Abstract
Foot and mouth disease (FMD) has a long history in Sri Lanka and was found to be endemic in various parts of the country and constitutes a constant threat to farmers. In Sri Lanka, currently there is no regular, nationwide vaccination programme devised to control FMD. Therefore, improving farmers’ knowledge regarding distinguishing FMD from other diseases and ensuring prompt reporting of any suspicion of FMD as well as restricting movement of animals are critical activities for an effective FMD response effort. Therefore, the main purpose of this study was to clarify the relationship between farmers’ knowledge levels and their behaviors to establish a strategy to control FMD. In our study, item count technique was applied to estimate the number of farmers that under-report and sell FMD-infected animals, although to do so is prohibited by law. The following findings were observed: about 63% of farmers have very poor knowledge of routes of FMD transmission; ‘under-reporting’ was found to be a sensitive behavior and nearly 23% of the farmers were reluctant to report FMD-infected animals; and ‘selling FMD-infected animals’ is a sensitive behavior among high-level knowledge group while it is a non-sensitive behavior among the low-level knowledge group. If farmers would understand the importance of prompt reporting, they may report any suspected cases of FMD to veterinary officials. However, even if farmers report honestly, they do not want to cull FMD-infected animals. Thus, education programs should be conducted not only on FMD introduction and transmission, but also its impact. Furthermore, consumers may criticize the farmers for culling their infected animals. Hence, not only farmers, but also consumers need to be educated on the economic impact of FMD and the importance of controlling an outbreak. If farmers have a high knowledge of FMD transmission, they consider selling FMD-infected animals as a sensitive behavior. Therefore, severe punishment should be levied for selling FMD-infected animals.
Keywords: Foot and Mouth Disease Control, Item Count Technique, Knowledge, Behavior, Dairy
INTRODUCTION
Foot and mouth disease (FMD) has a long history in Sri Lanka and it is enzootic in the country, particularly in the eastern part of the Northern and Eastern provinces (enzootic zones). Therefore, FMD has been ranked as the highest priority disease for control and eradication by 2020. There was only a single outbreak of FMD recorded during the first decade of the 21st century in the country (Figure 1). A massive outbreak in 2014 swept through all the provinces, resulting in 58,645 cases and 1,265 deaths, the largest number recorded since 1987. The majority of FMD cases were observed in North Central Province with some spill-over into other provinces (Department of Animal Production and Health [DAPH], 2014).
Figure 1.
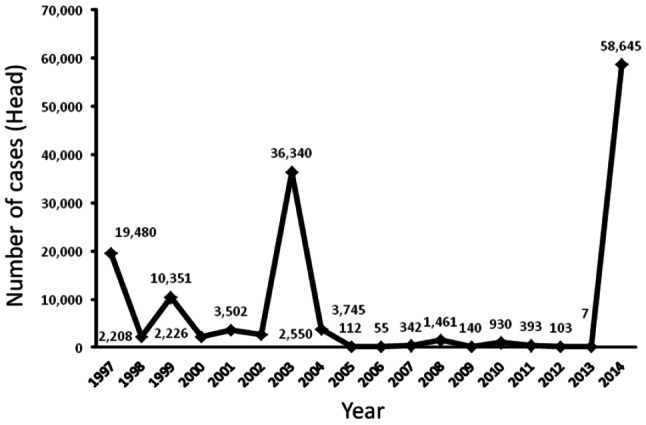
Recorded cases of foot and mouth disease between 1997 and June 2014 (Source: Department of Animal Production and Health).
In Sri Lanka, FMD outbreaks are mainly controlled by ring vaccination and restriction of animal movement based on farmers’ reports. Nevertheless, currently there is no national regular vaccination program devised to control FMD; vaccination has always been limited to the enzootic zones. In addition, cooperation by the farmers is not sufficient and the vaccination rate remains low. Moreover, currently there is no policy to cull infected animals.
Therefore, improving farmers’ knowledge regarding distinguishing FMD from other diseases and ensuring prompt reporting of any suspicion of FMD as well as restricting movement of animals are critical activities for an effective FMD response effort (Goswami and Sagar, 1996). Thus, FMD can be controlled effectively if a strong awareness of it is created among the farmers regarding its symptoms, routes of transmission, disease management, prevention and control.
For this study, it was hypothesized that almost all dairy farmers in Sri Lanka are poor and that they may attempt to sell FMD-infected animals for a low price without informing the local veterinary authorities. On the other hand, highly knowledgeable farmers understand that the behaviors of ‘under-reporting of suspected cases of FMD’ and ‘selling FMD-infected animals’ can spread FMD virus and ultimately decrease their profits. Thus, because of having a long-term point of view, they may select appropriate behaviors. However, farmers’ knowledge levels and behaviors regarding FMD control are largely unknown; to our knowledge, there has been no study published on the knowledge level and behaviors of dairy farmers in Sri Lanka. Therefore, the main purpose of this study was to clarify, by using the item count technique (ICT), the relationship between farmers’ knowledge levels and their behaviors to establish a strategy to control FMD.
The ICT, also known as the unmatched count technique, is an appropriate method to estimate the proportion of people who have engaged in sensitive behavior. In recent years, this method has grown in popularity as an indirect questioning technique that is designed to elicit respondents’ truthful responses to sensitive questions. Therefore, in the present study ICT was used to estimate the number of farmers that under-report and sell FMD-infected animals, since it is prohibited by law.
MATERIALS AND METHODS
Target area
The target area is in the North Central Province of Sri Lanka. North Central Province consists of two districts called Polonnaruwa and Anuradhapura. North Central Province was chosen for the following reasons: FMD is enzootic in the area and it appears that FMD has been emerging as the major killer disease among cattle; it has the second largest cattle and buffalo population (0.17 million cattle and 0.07 million buffalo) of Sri Lanka (DAPH, 2011), meaning there is a large potential impact of an FMD outbreak; and, finally, out of 30 divisional secretariats, 18 were seriously affected by FMD, and 8,384 confirmed cases (52% of the total) were reported in the first three months of the outbreak in 2014.
A survey of farmers was conducted in the divisional secretariats of Anuradhapura district, namely Padaviya, Kebithigollewa, Kahatagasdigiliya and Rambewa. The mentioned areas were selected because they had recorded the highest number of FMD cases during the outbreak period.
Data collection and analysis
Questions were asked to measure the farmers’ knowledge about FMD. Respondents earned 1 point for each correct answer and the maximum score was 15. The questions were composed to test the knowledge of FMD signs and symptoms, transmission, control, and immunity (Figure 2).
Figure 2.
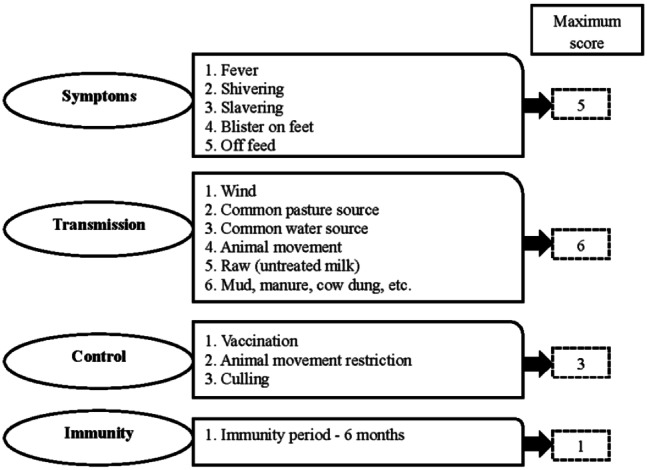
Questions and scores given for correct answers.
The ICT was introduced by Miller (1984). This method has been used to study racial prejudice (Redlawsk et al., 2010), risky sexual activity (LaBrie and Earleywine, 2000; Walsh and Braithwaite, 2008), and drug use (Coutts and Jann, 2011). Estimation using the ICT is expected to be higher than that from conventional direct questioning (DQ). For example, Rayburn et al. (2003) reported that the ICT yielded a higher estimate of the base rate of “people who have had a physical fight with a person because he was a gay” than DQ. Similarly, LaBrie and Earleywine (2000) report a higher estimated percentage of “people having sex without a condom after drinking” from the ICT compared to DQ. A statistical test is needed to determine the difference between the two estimates from the two techniques. When the proportion of ICT estimated from sub-sample A and sub-sample B is not statistically higher than the proportion of DQ estimated from sub-sample C, it can be concluded that the behavior of interest is not considered sensitive by respondents.
In the theory, the sample is randomly separated into two same-size sub-samples: sub-samples A and B. Our baseline list consisted of five non-sensitive statements to ensure a higher estimate than would be obtained from a baseline list of fewer non-sensitive statements (Tsuchiya et al., 2007). The statements on our list were logically consistent with dairy farming and FMD, and were designed to obtain a negative correlation between responses in order to minimize the variance of responses for the baseline list (Glynn, 2013). The respondents were first told that the questionnaire was anonymous to encourage truthful answers, and then were asked to state the number of items that were true for them without mentioning which ones.
The double-list technique was used in the present study to obtain a more accurate estimation (Droitcour et al., 1991). Two baseline lists are needed so that the sensitive statement (SS) can be presented to all respondents. The second baseline list Y was designed to be positively correlated to the first baseline list X to increase the certainty of the estimation (Glynn, 2013). The proportion of the farmers involved in sensitive behaviors can be represented as follows:
where p̂ is the proportion of farmers involved in sensitive behaviors, X̄6B is the mean number of statements on the “6-statement list X” counted by farmers in sub-sample B, X̄5A is the mean number of statements on the “5-statement list X” counted by farmers in sub-sample A, Ȳ6A is the mean number of statements on the “6-statement list X” counted by farmers in sub-sample A, and Ȳ5B is the mean number of statements on the “5-statement list X” counted by farmers in sub-sample B.
In the double list experiment, the respondents in sub-sample A first received the X baseline list and then received the Y baseline list plus the SS, “If I suspect FMD in my animal, I will not report to veterinary office” (Figure 3a). The respondents in sub-sample B received the Y baseline list and then received the X baseline list with the SS appended. Additionally, the respondents in sub-sample A received the U baseline list and then received the V baseline list with the sensitive item appended, “If I suspect FMD in my animal, I will sell that animal soon” (Figure 3b). The respondents in sub-sample B received the V baseline list and then received the U baseline list plus the SS appended.
Figure 3.
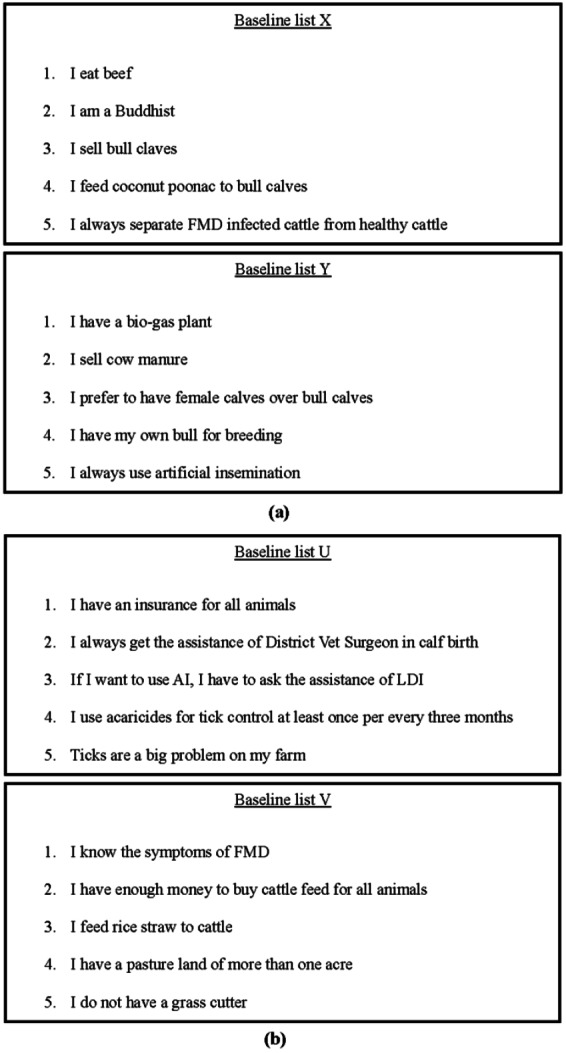
Questions for selling FMD-infected animals (a) and for under-reporting FMD-infected animals (b). FMD, foot and mouth disease; AI, artificial insemination; LDI, livestock development instructor.
In addition, another sub-sample of respondents, sub-sample C, received a DQ to estimate the proportion of farmers involved in sensitive behaviors. Anonymity was guaranteed to evoke truthful answers. The questions were i) “Do you immediately report if there is a FMD suspected animal to a veterinary or local authority?” and ii) “Do you immediately sell your live animal if it is suspected to be infected with FMD without informing anyone like a veterinarian or local authority?” The proportions of farmers involved in sensitive behaviors are obtained by dividing the number of yes responses by the total number of DQ respondents.
In May 2014, 284 farmers were interviewed face-to-face (ICT respondents, 201; DQ respondents, 83). The sample was divided as indicated in Table 1, according to type of questionnaire. Farmers with FMD-infected animals and those with non-infected animals were included as respondents to determine whether they intended to report or sell the meat if their animal was suspected or obviously infected.
Table 1.
Questionnaire and sample sizes
| Sub-sample A | Sub-sample B | Sub-sample C | |
|---|---|---|---|
| Questionnaire | X Baseline | Y Baseline | Direct question |
| Y Baseline+SS | X Baseline+SS | ||
| U Baseline | V Baseline | ||
| V Baseline+SS | U Baseline+SS | ||
| Sample size | 100 | 101 | 83 |
SS, sensitive statement.
The binomial test is a nonparametric statistical procedure and is based on the binomial distribution. This test is most appropriate in studies when the hypothesis involves observing or measuring whether or not and event happens: either or conditions that are “dichotomous events” (Cohen, 2001). In this study, the dichotomous events were respondents either engaged in some specified behavior or did not, therefore, these data are well suited for analysis comparing two independent binomials. The null hypothesis is that the proportion of endorsements in the ICT and the proportion of endorsement in the DQ are equal.
The most commonly used method for testing this hypothesis is Fisher’s exact test. Nevertheless, Fisher’s exact test has less power than other procedures (Wilcox, 2005). Storer and Kim (1990) compared many methods that have better statistical properties than Fisher’s exact test. They recommend a binominal test, which Wilcox (2005) named Twobinom, since it has better properties than Fisher’s test including both better statistical power and more control over type 1 error. As used by LaBrie and Earleywine (2000), the binominal test was employed to test the hypothesis that the proportions are equal. The Rallfun-v25 in the R version 3.0.2 (R Core Team, 2014) software package was used to perform the statistical tests.
RESULTS AND DISCUSSION
Farmers’ knowledge
Table 2 compares the farmers’ previous experiences and the knowledge scores on FMD and its control, by samples. More than 60% of the farmers in all three samples had experienced FMD. The results also indicated that the knowledge scores were higher among farmers’ with FMD experience compared to farmers who did not have FMD experience.
Table 2.
Comparison of the characteristics of the respondents to the samples
| Characteristics of respondents | Item count technique | Direct question | |
|---|---|---|---|
|
| |||
| A | B | ||
| Previous experiences of FMD (%) | 63.37 (n = 101) | 67.00 (n = 100) | 65.58 (n = 154) |
| Knowledge scores on FMD | |||
| Signs and symptoms | 1.88 (0.96) | 2.19 (0.64) | 2.57 (1.13) |
| FMD transmission | 1.45 (0.45) | 1.73 (0.55) | 2.03 (0.72) |
| Methods of FMD control | 0.81 (0.21) | 0.91 (0.14) | 1.10 (0.27) |
| Immunity period after FMD vaccine | 18.81 (4.95) | 19.90 (5.00) | 24.00 (10.00) |
FMD, foot and mouth disease.
Values are presented as number (% of farmers).
Knowledge score gap between farmers with FMD experienced and without FMD experience.
In general, the clinical signs of FMD include a high fever for two or three days, mouth and foot blisters, shivering, slavering, and loss of appetite. As shown in Figure 4a, the majority (61%) of farmers in the study area were able to identify the signs and symptoms of FMD-infected animals. However, 3% of the farmers were unable to identify any symptoms.
Figure 4.
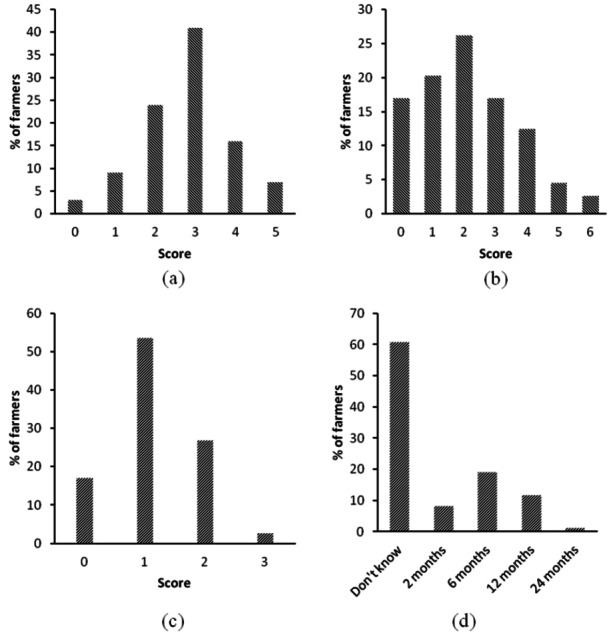
Distribution of knowledge scores on foot and mouth disease (FMD) and its control. (a) Signs and symptoms, (b) FMD transmission, (c) methods of FMD control, and (d) immunity period after FMD vaccine.
FMD has multiple known routes of transmission. These include animal movement, raw (untreated milk), grazing in common water and common pasture sources, and contact with mud, manure, cow dung, etc. Figure 4b shows the distribution of knowledge scores related to FMD transmission routes. As indicated, 26% of the farmers received a score of 2. Of the rest, 20% received the score of 1 and for 17% of the farmers the score was 0. Therefore, overall knowledge about FMD transmission routes in Sri Lanka is poor.
With regard to control methods, a high proportion of farmers (54%) had scores of 1 and a considerable percentage (17%) of dairy farmers received a score of 0. Thus, from the figure it is apparent that the majority of the farmers (71%) have very poor knowledge related to FMD control methods (Figure 4c).
Vaccination provides immunity that protects animals from FMD disease without the risk of infection. Knowledge related to the immunity period conferred by FMD vaccination is necessary for correct timing to avoid transmission of the infection. Figure 4d shows the distribution of knowledge scores related to the immunity period after FMD vaccination; the majority of farmers (89%) do not know this information.
In order to eradicate FMD disease, there should be a mechanism to improve farmers’ knowledge regarding its spread and control.
Farmer’s behavior towards FMD transmission
The estimates of the proportion of farmers who under-report animals suspected of infection with FMD and who sell FMD infected animals, from the ICT and DQ methods, are shown in Table 3. From the total sample, estimates of under-reporting based on the ICT are higher than those based on the DQ, and the difference was statistically significant at the 1% level. Therefore, from the results it is clear that under-reporting is a sensitive behavior. Nearly 23% of the farmers were reluctant to report FMD-infected animals.
Table 3.
Distribution of behaviors regarding FMD control
| Type of behaviours | ICT (%) (n = 201) | DQ (%)(n = 83) | Binominal test | Factor score |
|---|---|---|---|---|
| Under-reporting of FMD suspect animals | 23.08 | 6.02 | 0.008*** | 3.96 |
| Selling of FMD infected animals | 10.88 | 4.82 | 0.104 | 2.26 |
FMD, foot and mouth disease; ICT, item count technique; DQ, direct question; n, sample size.
The factor score is obtained by dividing the ICT estimate by the DQ estimate.
Statistically significant at 1% level.
In addition, estimates of selling FMD-infected animals based on the ICT are higher than those based on the DQ estimates, but the difference was not statistically significant. Thus, it is apparent that selling FMD-infected animals is a non-sensitive behavior. In other words, farmers freely admit that they sell FMD-infected animals despite the law that prohibits it. Moreover, approximately 11% of farmers sell FMD-infected animals.
The present results identified two main types of risks for FMD transmission. i) Farmers did not report their FMD-infected cattle, because they want to keep this secret. ii) Farmers sell their FMD-infected cattle, because they think it is a non-sensitive problem.
Relationship between knowledge and behavior
The total sample was categorized into two groups based on the knowledge level of FMD transmission; namely, high-level knowledge and low-level knowledge. The high-level knowledge group comprised farmers who scored higher than 2 while the low-level knowledge group consisted of farmers who received less than 3. There was a statistically significant (p<0.01) difference between the groups. Estimates of the proportion of farmers who sell FMD-infected animals among high-level and low-level knowledge groups, from analysis by the ICT and the DQ methods, are shown in Table 4.
Table 4.
Selling FMD-infected animals
| Levels of knowledge | ICT (%) | DQ (%) | Binominal test | Factor score |
|---|---|---|---|---|
| High-level | 10.94 (n = 53) | 0 (n = 55) | 0.012*** | 10.94 |
| Low-level | 13.14 (n = 148) | 7.07 (n = 99) | 0.215 | 18.59 |
FMD, foot and mouth disease; ICT, item count technique; DQ, direct question; n, sample size.
Statistically significant at 1% level.
From the total sample, estimates based on the ICT are higher among the high-level knowledge group than those based on DQ. The difference is statistically significant at the 1% level. The 11-factor scores indicated in Table 4 suggest that ICT respondents are 11 times more likely to admit to selling FMD-infected animals. Therefore, from the results it is clear that selling FMD-infected animals is a sensitive behavior among the high-level knowledge group.
Additionally, estimates based on the ICT analysis were not statistically higher than those based on DQ analysis in the low-level knowledge group, indicating that there is no underestimation from DQ. In other words, low-level knowledge farmers freely admit that they sell FMD-infected animals despite the law that prohibits it. Approximately 13% of low-level knowledge farmers sell FMD-infected animals without informing veterinarians of the FMD infection. Therefore, the punishment and checking systems for selling FMD-infected animals should be more strictly regulated.
Furthermore, nearly 56% of the farmers in the sample population had received some kind of training related to dairy farming, but around 44% of the farmers had not received any kind of training at all (Figure 5). As shown in Figure 6, a higher proportion of farmers (66%) had received training on farm management. A considerable percentage of farmers (11%) had received training on breeding management, particularly on artificial insemination. Of the rest, 8% had received training on pasture and feed management and 15% on animal health management training. It is clearly evident that the proportion of farmers trained in animal health management is very low in the study area. Thus, training programs particularly focusing on disease identification and health management should be conducted. After completing the training, an exam could be administered to check the level of knowledge.
Figure 5.
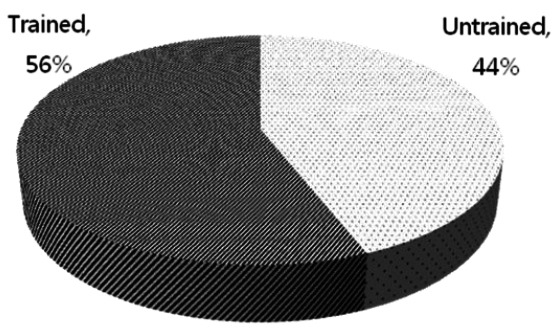
Distribution of training among farmers.
Figure 6.
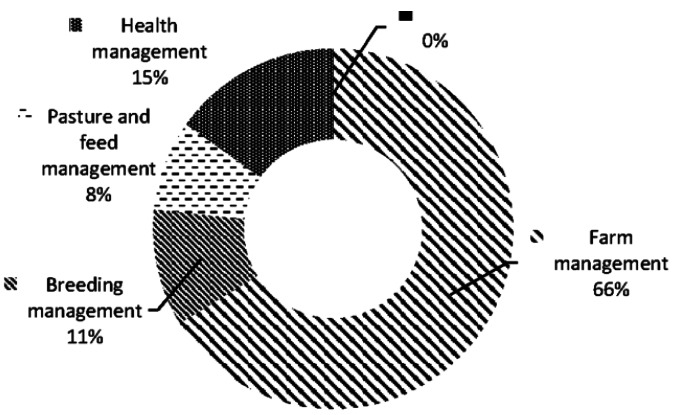
Distribution of type of training among farmers. Farm management included training related to milk production, milking, shed construction.
Willingness to accept compensation for culling
In addition to preventive vaccination and animal movement restriction, outbreaks of FMD can be controlled by stamping-out or (circle) culling. Around 59% of farmers do not willingly accept any compensation for culling of FMD-infected animals.
Sri Lanka is a Buddhist country, and Buddhists and Hindus reject cattle slaughtering. In May 2014, a Buddhist monk in Sri Lanka, Bowatte Indraratna thero, set himself on fire in Kandy outside the Temple of the Sacred Tooth Relic demanding an end to cattle slaughter. That was the Sri Lanka’s first self-immolation by a monk. After that, Buddhists have organized many campaigns around the country to ban cattle slaughter in Sri Lanka. However, the government has so far disclosed no plans to do this. Therefore, most of the farmers in the study sample reject cattle slaughtering and are not willing to accept any value for culling.
However, 41% of the respondents are willing to accept compensation for culling FMD-infected animals. The average acceptable value per animal cited for culling was approximately Sri Lankan rupees 75.7 (1 US dollar = 131 Sri Lankan rupee). However, the majority of the farmers are not willing to accept any amount. Therefore, vaccination, animal movement control, and improving farmers’ knowledge of FMD spread and control will play a big role in FMD eradication in the country.
Conclusions
By employing the knowledge questionnaire regarding FMD along with the ICT method, farmer’s knowledge and behavior regarding the FMD outbreak and its control were analyzed. A high proportion of farmers (63%) have very poor knowledge of routes of FMD transmission. Thus, in order to eradicate the FMD disease by 2020, there should be a mechanism to improve farmers’ knowledge.
Moreover, under-reporting was found to be a sensitive behavior while selling FMD-infected animals was a non-sensitive behavior. If farmers would understand the importance of prompt reporting, they may report any suspected cases of FMD to veterinary officials. However, even if farmers report honestly, they do not want to cull FMD-infected animals. Thus, education programs should be conducted not only on FMD introduction and transmission, but also its impact. Furthermore, consumers may criticize the farmers for culling their infected animals. Hence, not only farmers, but also consumers need to be educated on the economic impact of FMD and the importance of controlling an outbreak.
If farmers have a high knowledge of FMD transmission, they consider selling FMD-infected animals as a sensitive behavior. Therefore, severe punishment should be levied for selling FMD-infected animals.
ACKNOWLEDGMENTS
Firstly, the authors would like to thank Dr. Nihal Wedasinghe, Provincial Director (North Central Province), DAPH for providing necessary information and data required for this study. Secondly, the authors are very much indebted to Dr Ranjani Hettiarachchi, Deputy Director, Animal Health Division, DAPH and to Dr. K.A.C.H.A. Kothalawala, Agricultural Economist, Livestock Planning and Economic Division, DAPH for their assistance and cooperation. Lastly, this work was supported by a Grant-in-Aid for Scientific Research from Obihiro University of Agriculture and Veterinary Medicine, Japan.
Footnotes
CONFLICT OF INTEREST
We certify that there is no conflict of interest with any financial organization regarding the material discussed in the manuscript.
REFERENCES
- Cohen BH. Explaining Psychological Statistics. 2nd Ed. John Wiley and Sons; New York, NY, USA: 2001. pp. 611–612. [Google Scholar]
- Coutts E, Jann B. Sensitive questions in online surveys: Experimental results for the randomized response technique (RRT) and the unmatched count technique (UCT) Sociol Methods Res. 2011;40:169–193. [Google Scholar]
- Department of Animal Production and Health. Annual Report 2011. Department of Animal Production and Health; Peradeniya, Sri Lanka: 2011. [Google Scholar]
- Department of Animal Production and Health. Annual Report 2014. Department of Animal Production and Health; Peradeniya, Sri Lanka: 2014. [Google Scholar]
- Droitcour J, Caspar RA, Hubbard ML, Parsley TL, Visscher W, Ezzati TM. The item count technique as a method of indirect questioning: A review of its development and a case study application. In: Biemer PP, Groves RM, Lyberg LE, Mathiowetz NA, Sudman S, editors. Measurement Errors in Surveys. Kpjm John Wiley & Sons Inc; Hoboken, NJ, USA: 1991. pp. 185–210. [Google Scholar]
- Glynn A. What can we learn with statistical truth serum? Design and analysis of the list experiment. Public Opin Q. 77(2013)(S1):159–172. [Google Scholar]
- Goswami A, Sagar RL. Development of cognitive learning scale to test the knowledge of livestock owners about vaccination against the contagious diseases. J Vet Anim Sci. 1996;27:32–37. [Google Scholar]
- LaBrie JW, Earleywine M. Sexual risk behaviors and alcohol: Higher base rates revealed using the unmatched-count technique. J Sex Res. 2000;37:321–326. [Google Scholar]
- Miller JD. PhD Thesis. George Washington University; Washington, DC, USA: 1984. A New Survey Technique for Studying Deviant Behavior. [Google Scholar]
- R Core Team. R: A language and environment for statistical computing. R Foundation for Statistical Computing; Vienna, Austria: 2014. http://www.r-project.org. [Google Scholar]
- Rayburn NR, Earleywine M, Davison GC. An investigation of base rates of anti-gay hate crimes using the unmatched-count technique. J Aggress Maltreat Trauma. 2003;6:137–152. [Google Scholar]
- Redlawsk DP, Tolbert CJ, Franko W. Voters, emotions, and race in 2008: Obama as the first black president. Polit Res Q. 2010;63:875–889. [Google Scholar]
- Storer BE, Kim C. Exact properties of some exact test statistics for comparing two binomial proportions. J Am Stat Assoc. 1990;85:146–155. [Google Scholar]
- Tsuchiya T, Hirai Y, Ono S. A study of the properties of the item count technique. Public Opin Q. 2007;71:253–272. [Google Scholar]
- Walsh JA, Braithwaite J. Self-reported alcohol consumption and sexual behavior in males and females: Using the unmatched-count technique to examine reporting practices of socially sensitive subjects in a sample of university students. J Alcohol Drug Educ. 2008;52:49–72. [Google Scholar]
- Wilcox RR. Introduction to Robust Estimation and Hypothesis Testing. 2nd Ed. Elsevier Academic Press; Burlington, MA, USA: 2005. [Google Scholar]


