

Abstract
Purpose
In an effort to elucidate possible neural mechanisms underlying diminished tearing in dry eye disease, this study sought to determine if hyperosmolar tears, a ubiquitous sign of dry eye disease, produce functional changes in corneal nerve responses to drying of the cornea and if these changes correlate with alterations in corneal nerve morphology.
Methods
In vivo extracellular electrophysiological recordings were performed in rat trigeminal ganglion neurons that innervated the cornea before, and up to 3 hours after, the ocular application of continuous hyperosmolar tears or artificial tears. In corollary experiments, immunohistochemical staining was performed to compare corneal nerve morphology in control and in eyes treated with hyperosmolar solutions.
Results
Our previous studies identified a population of corneal afferents, dry-sensitive neurons that are strongly excited by corneal dessication (“dry response”), a response thought to trigger the lacrimation reflex. In the present study, we found that the dry responses of corneal dry-sensitive neurons were depressed or even completely abolished by hyperosmolar tears in a time- (30 minutes to 3 hours) and dose (450- to 1000-mOsm solutions)-dependent manner. Furthermore, eyes treated with hyperosmolar tears for 3 hours contained large numbers of morphologically abnormal (granular, fragmented, or prominently beaded) subbasal nerves that appeared to be undergoing degeneration.
Conclusions
These results demonstrate that tear hyperosmolarity, considered to be a “core” mechanism of dry eye disease, significantly decreases physiological sensitivity and morphologic integrity of the corneal nerves important in tear production. These alterations might contribute to the diminished tearing seen clinically in dry eye patients.
Keywords: tear hyperosmolarity, corneal nerves, dry eye disease
Dry eye disease (DED) is a chronic anterior eye disorder that afflicts up to 30% of the population worldwide, depending on age and sex.1–3 Dry eye disease is also a disease of diminished tearing that is thought to be responsible for the symptoms of ocular dryness, discomfort, and pain.4,5 It is generally agreed that dry eye (DE) patients express tear hyperosmolarity due to a decrease in the tearing that normally replenishes the ocular surface to maintain a healthy cornea.6–8 Evidence primarily from in vivo confocal microscopy has clearly shown that the corneal nerves, especially the subbasal fibers, are morphologically abnormal in DE patients9–11; however, it is not clear whether these corneal nerve abnormalities are a “cause” or a “consequence” of DED.12 This is because of a lack of knowledge about the patients' natural history,13 including the stage of the DED.14 Thus, it is important to establish first if hyperosmolar tears, a ubiquitous sign of DED, “cause” the immunohistochemically defined nerve damage. It is also important to determine, secondly, if the nerve damage, especially to those nerves responsible for the production of tears, is functionally altered in a manner consistent with the diminished tearing seen in DE patients. Therefore, the present study was conceived, using a rodent model, to resolve these issues by treating the cornea with hyperosmolar tears for prolonged periods (up to 3 hours) and to assess if hyperosmolar tears produce changes in the functions and structures of the corneal nerves.
Recently we reported a class of corneal afferents that were excited vigorously by drying of the cornea, a stimulus critical for the production of tears. These afferents were also depressed or even silenced by wetting of the cornea, equivalent to tears' action. The behaviors of these dry-sensitive (DS) corneal afferent neurons are thus consistent with the notion that they represent the afferent limb of the lacrimation reflex, and are important for regulating tear production.15,16 Furthermore, in addition to their responsiveness to drying of the cornea, these neurons show a different sensitivity to cooling of the cornea and have been divided into two major types by virtue of their responses to cold stimuli. One class, high-threshold cold-sensitive plus dry-sensitive (HT-CS + DS) afferents, is excited exclusively by a noxious level of cooling of the cornea (∼4°C on the average) and has been suggested to function in cold-induced ocular pain and reflex (noxious stimulus-induced) tearing.17,18 A second class, low-threshold cold-sensitive plus dry-sensitive (LT-CS + DS) afferents, is exquisitely sensitive to slight cooling of the ocular surface and has been proposed to serve a variety of functions including basal tearing, blinking, and dryness/discomfort.15,16,19–21 Thus, we also sought to determine if hyperosmolar tears produce functionally different outcomes on the responses of these two types of DS corneal afferents. The results from these experiments will provide novel insights into the mechanisms by which tear hyperosmolarity contributes to the pathophysiology of DED.
Methods
Electrophysiology
Under 3.0% isoflurane (in 100% oxygen), male Sprague-Dawley rats (329–560 g weight) were fitted with venous and arterial catheters and tracheal tubes. The animals were then placed in a stereotaxic instrument, and a partial craniotomy was performed over the parietal bone to expose the brain for easy penetration of the recording electrodes into the left trigeminal ganglion (TG) (Fig. 1A). Just before the recordings, the isoflurane concentration was decreased to and maintained at 1.5% to 2.0% throughout the experiment. After checking for pinch-evoked withdrawal reflexes to determine an adequate plane of anesthesia, pancuronium bromide (0.6 mg/kg/h) was infused continuously and the animal was artificially respired (Harvard model 683; Harvard Appparatus, Holliston, MA, USA). All vital signs remained within physiological range (arterial pressure > 100 mm Hg; end-tidal CO2 4–5%; body temperature ∼38°C) throughout the recording sessions. A tungsten microelectrode (5–9 Mohms; FHC, Inc., Bowdoin, ME, USA) was used to record from a single corneal neuron in the left TG exhibiting spontaneous activity during corneal drying (see below). After an amplification and discrimination with template matching software (CED, Cambridge, England), the neural spike outputs and the temperatures during the corneal thermal stimulation were acquired and analyzed by CED Micro-1401 and Spike2, v.8.04. Receptive fields (RFs) on the cornea were identified with an ice-cooled dental metal probe (tip diameter ∼1 mm) and were carefully mapped to exclude confounding regions such as conjunctiva and eyelids. At the end of the experiment, each animal was euthanized with an intraperitoneal injection of sodium Euthasol (200 mg/kg; Virbac Corporation, Fort Worth, TX, USA). The experimental protocol was approved by the Cornell Medical College Institutional Animal Care and Use Committee and performed in accordance with the ARVO Statement for the Use of Animals in Ophthalmic and Vision Research.
Figure 1.

(A) Schematic drawing of the method used for in vivo extracellular recording from the trigeminal ganglion of the rat while stimulating the ocular surface with a drying stimulus. It is important to note that the recording and stimulating sites are physically far apart (∼12–14 mm). (B, C) HT-CS + DS (high-threshold cold-sensitive plus dry-sensitive) neuron that required greater than 1°C of cooling from the 31°C adapting temperature to elicit a response. (D, E) CI + DS (cold-insensitive plus dry-sensitive) neuron that displayed no sensitivity to cooling down to 19°C (definition of CI + DS afferents) but which, when tested with a colder stimulus (6°C), showed responses beginning at 17.2°C (arrow). Notice also that the dry responses (green) are considerably greater in magnitude (8–12 spikes/s) than the cold-evoked responses (1–2 spikes/s), indicating that the dry responses are unlikely to be just cold-evoked responses. There was no response to heat (45°C; traces truncated). (F, G) LT-CS + DS (low-threshold cold-sensitive plus dry-sensitive) neuron that begins to respond to a cooling temperature less than 1°C (mostly ∼0.1°C as shown here). Top traces are temperatures (B, D, F) or dry and wet (ATs) stimuli applied to the cornea (C, E, G); middle traces are raw data (action potentials), and bottom traces are transformed data (poststimulus time histograms, PSTHs). The threshold temperatures are shown next to the arrows. Regardless of the different cooling thresholds, all three types of neurons are equally excited by drying of the cornea (C, E, G); thus they are termed dry-sensitive. ATs, artificial tears.
After locating the “cold” RF as described above, we identified the neuron as DS by noting the increase in discharge rate upon drying of the cornea (i.e., removing the artificial tears from the ocular surface) and decrease upon wetting of the cornea. In addition to dryness sensitivity, to define the neuron as high- (HT-CS + DS) or low-threshold cold sensitive (LT-CS + DS) (Figs. 1B–G), the threshold was determined using the cooling stimulus applied to the ocular surface via fluids that bathed a hollow plastic cylinder placed over the anterior eye (bath). The temperature of the fluids was regulated by a Peltier-based device (Temperature Controller; Warner Instruments, Hamden, CT, USA), which was placed between the reservoir and the plastic cylinder. The fluids were drawn from the reservoir by a peristaltic pump at a rate of 1.3 mL/min via polyethylene tubing through the temperature controller down into the plastic cylinder. The cooling stimulus was a 12°C change from a 31°C adapting temperature to 19°C that took ∼51 seconds and then back to 31°C. The rate of temperature change was, on the average, 0.20°C/s (range, 0.17°–0.24°) for the 12°C change. Following threshold characterization, each unit was then recorded during two conditions of the corneal fluid status. The wet cornea condition (wet stimulus; 5 minutes) occurred when the cornea was moistened with 200 μL rat artificial tears (ATs) dropped into a plastic cylinder that was placed over the anterior eye. The dry cornea condition (dry stimulus; 2 minutes) occurred after the cylinder was detached from the eye and the excess ATs were removed with a piece of filter paper. The dry stimulus was presented a total of three times before the application of the hyperosmolar solutions, once 30 minutes after, three times 1 hour after, three times 3 hours after, and finally three times 10 to 30 minutes after washing the hyperosmolar solutions with ATs to evaluate the extent of the recovery of the dry responses. Thus, during each 3-hour exposure period, hyperosmolar stimuli were always left on the ocular surface except when the dry stimuli were applied. The hyperosmolar solutions used were 450, 600, 800, and 1000 mOsm and were prepared by adding NaCl or mannitol (Sigma-Aldrich Corp., St. Louis, MO, USA) to the ATs (305 mOsm). Their osmolarities were measured with an osmometer (Micro-OSMETTE; Precision Systems, Inc., Natick, MA, USA). The ATs (in mM) were composed of NaCl 106.5; NaHCO3 26.1; KCl 18.7; MgCl2 1.0; NaH2PO4 0.5; CaCl2 1.1; HEPES 10; pH 7.45.22
Immunohistochemistry
The morphologic integrity of the corneal nerves after hyperosmolar stimulation was assessed by immunocytochemical staining of corneal whole-mount preparations.23 A total of eight Sprague-Dawley rats (362–395 g) were used for this portion of the study. Under isoflurane anesthesia (2.0–2.5% in 100% O2), the right eyes from two animals were treated with ATs and the left eyes from the same animals were treated with 1000-mOsm hyperosmolar stress stimulation (HOS) for 3 hours. The remaining corneas were selected at random from animals whose eyes were treated with either ATs (n = 2) or hyperosmolar tears (600–1000 mOsm; n = 10). The ages of the ATs-treated and HOS-treated animals were comparable (ATs, 3.1–4.1 months old; HOS, 3.3–4.3 months old).
Each animal then was given a lethal dose of Euthasol (200 mg/kg, intraperitonally), and the eyes were immediately enucleated and immersion fixed in acetone. Before enucleation, the superior pole of the cornea was marked with a surgical suture. After 2 hours of fixation and multiple rinses with PBS, the anterior segment of each eye was dissected, and, using an ophthalmic knife, four radial cuts were made on each cornea to flatten the surface. The radial cuts produced four connected quadrants (superior nasal and temporal, inferior nasal and temporal). Each whole cornea was then incubated overnight in a mouse monoclonal antibody against neuronal class III β-tubulin (TuJ1, 1:500; Covance Research Products, Berkeley, CA, USA), and the following day in a secondary antibody, 1:200 biotinylated horse anti-mouse IgG, rat absorbed (BA-1000; Vector Laboratories, Burlingame, CA, USA), for 90 to 120 minutes. After rinsing in PBS–Triton X-100, the tissues were incubated for 2 hours at room temperature in an avidin-biotin-horseradish peroxidase complex (ABC reagent, Vector Laboratories), rinsed for 45 minutes in PBS, incubated for 8 minutes at room temperature in 0.1% diaminobenzidine (Sigma-Aldrich Corp.) and 0.003% hydrogen peroxide, washed with PBS, and mounted on slides. The morphologic appearances of the corneal nerves were assessed qualitatively by two independent investigators in a blinded fashion using a Zeiss Observer.Z1 (Jena, Germany) and Leica DM4000 (Wetzler, Germany) light microscope. High-magnification images of the cornea nerves were captured using a digital camera attached to the microscope. By adjusting the focal plane, the investigators were able to obtain, specifically from the identical field of view, photographs of the subbasal nerve fibers (SNFs) and intraepithelial nerve terminals (NTs).
Data Analysis
Neural discharges were analyzed based on 1-second bin acquired with Spike2 software. The evoked responses to cooling stimuli were defined as the total number of spikes following the stimulus onset that exceeded the mean + 2 SD, which were based on the activity over the 30 seconds preceding the stimulus. The end of the evoked response was defined as cessation of activity, which occurred in all neurons, when the cooling ramp was followed by warming back to the adapting temperature (Fig. 1). The response to drying of the cornea (dry response) was defined as number of spikes/s averaged over the 30-second period preceding the end of the dry stimulus (approximately 1.5–2 minutes after the onset of dry stimulus). The average dry response was based on the average of the responses to three dry stimuli as described above unless stated otherwise. When the spikes or action potentials vanished, the dry response was considered 0. The high-threshold cold-sensitive plus dry-sensitive (HT-CS + DS afferents) neurons (cooling thresholds greater than 1°C from 31°C adapting temperature) and the low-threshold cold-sensitive plus dry-sensitive neurons (LT-CS + DS afferents) with thresholds less than 1°C17 were analyzed in this study. Two DS neurons that exhibited no cooling sensitivity to 19°C (definition of CI + DS afferents; Fig. 1)17 were also included but analyzed as HT-CS + DS afferents because they responded to temperatures ∼17°C and 6°C when tested with much colder stimuli (Figs. 1D, 1E).
Statistical analyses for the effects of hyperosmolar or AT solutions on neural discharges were performed with ANOVA (GraphPad Prism 5; La Jolla, CA, USA) with or without repeated measures. Post hoc analyses were done with a Bonferroni multiple comparison test for individual comparisons; t-tests were also used to evaluate the differences between two selected sample populations. Fisher's exact test and χ2 test were used for a test of homogeneity (Table).
Table.
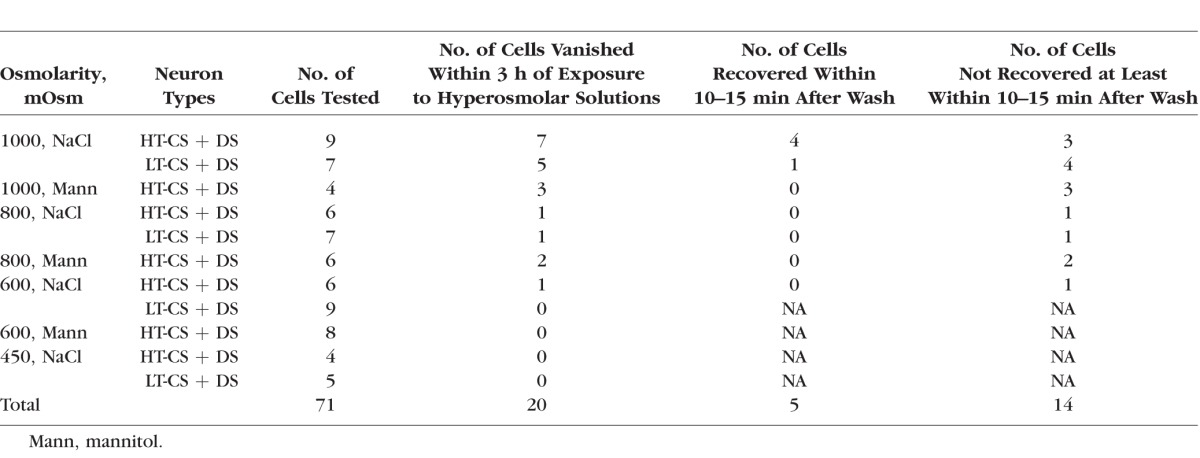
Number of Dry-Sensitive Corneal Afferents That Disappeared After Ocular Treatments With Hyperosmolar Solutions
To qualitatively assess morphologic appearance of the corneal nerves, a microscope (Zeiss Observer.Z1) was used to photograph whole-mount corneas at different focal depths to observe SNFs and intraepithelial NTs separately. The right eyes from two animals were treated with ATs, and the left eyes from the same animals were treated with 1000-mOsm HOS. An additional two eyes used for AT treatments came from the right eyes of another two animals. The remaining eyes were treated with randomly chosen hyperosmolar tears (600–1000 mOsm). In addition, the ages of the animals were roughly matched for the AT (3.1–4.1 months old) and HOS groups (3.3–4.3 months old).
Results
Electrophysiology
A total of 82 DS afferents with RFs restricted to the cornea proper were found in this study. Forty-four neurons (20 HT-CS + DS and 24 LT-CS + DS units) were used to analyze the dry responses after 30 minutes, 1 hour, and 3 hours of the HOS of the cornea; the dry responses were also recorded after washing with HOS. An additional 13 neurons plus the 44 units above were analyzed to determine if the action potentials vanished during any time after the HOS application. For the study employing the mannitol as the HOS, 18 afferents (all HT-CS + DS units) were tested before and 3 hours after the HOS application, and an additional 7 neurons were treated with ATs as a control. Only one neuron was studied per hyperosmolar stimulus. The average thresholds to cooling of the cornea for HT-CS + DS and LT-CS + DS neurons, respectively, were 26.24 ± 0.75°C (4.763 ± 0.0.74°C cooling) and 30.58 ± 0.08°C (0.37 ± 0.08°C cooling). Note that HOS (hyperosmolar stress, solutions, or stimuli) and hyperosmolar tears are all equivalent conditions in this paper.
Ocular Application of Hyperosmolar Tears (450–1000 mOsm) Depresses the Dry Responses of Corneal Afferents in a Dose- and Time-Dependent Manner
Figures 2 through 5 show examples of the types of changes in response to drying of the cornea (dry responses) over 3-hour periods under 450- to 1000-mOsm HOS. The ocular applications of the hyperosmolar tears consistently augmented the background activity in all these neurons that either adapted to lower rates (Fig. 3) or remained high (sustained) for much of the 3-hour periods (Fig. 2). Figure 2 shows that the dry responses (numbers in parentheses) were not greatly influenced by the 450-mOsm tears over the 3-hour exposure periods but that washing the 450-mOsm stimulus with ATs decreased the dry responses substantially. The magnitudes of the dry responses (numbers in parentheses) for this LT-CS + DS neuron did not appear to change under HOS even though the background activity increased significantly (4.81 spikes/s from 0.91 spikes/s pre-HOS; block arrows in Fig. 2B). By contrast, Figure 3 shows that, for this HT-CS + DS neuron, the greater HOS (800 mOsm) was seen to have gradually depressing effects on the dry responses including after the wash. The reduction of the dry response occurred in the face of the increased background discharges induced by the HOS (6.39 spikes/s from 0.29 spikes/s pre-HOS; block arrows in Fig. 2B), resulting in apparent decreases in the dry responses from the preceding background rates; brackets with arrows in Fig. 3D identify the decrease from 6.50 to 4.25 spikes/s (first dry stimulus) and from 5.81 to 5.34 spikes/s (third dry stimulus) (see also Fig. 6D).
Figure 2.

Poststimulus time histograms (PSTHs) of a LT-CS + DS corneal neuron in response to drying of the cornea (dry responses; blue) before (A), during (B), and 30 minutes (C), 1 hour (D), and 3 hours (E) after the hyperosmolar solutions (450-mOsm NaCl) were applied to the ocular surface. (F) The dry responses after washout. Numbers in parentheses are the magnitudes of the dry responses. The bars above the PSTHs indicate the applied stimuli: ATs, artificial tears (wet stimuli; black); dry, removal of artificial tears (blue); dotted bars, 450-mOsm NaCl hyperosmolar stimuli (HOS). The horizontal bars below the PSTHs in all figures are 5 minutes. The inset above PSTHs is a drawing of a corneal surface with RF of this neuron (blue dot). Block arrows in (B) indicate the periods in which background discharges before and after HOS applications were measured (see text).
Figure 3.

Poststimulus time histograms of a HT-CS + DS neuron in response to drying of the cornea (dry responses; green) under 800-mOsm NaCl HOS. All designations in this figure and Figure 4 are the same as in Figure 2 unless indicated otherwise. Notice that there is a gradual decrease in dry response as the hyperosmolar stimuli were kept on the ocular surface longer. There were even smaller dry responses after washout. The small brackets with arrows above PSTHs in (D) indicate the periods where the dry responses were measured. The responses to the first and third dry stimuli in (D) were smaller than the background level (see text).
Figure 6.

Responses to mannitol stimuli. (A) The averaged graph showing the effects of hyperosmolar mannitol solutions on the dry responses of HT-CS + DS corneal neurons. A similar tendency (i.e., decreased dry responses with time) observed with NaCl hyperosmolar solutions (cf. Figs. 2–5) was also evident with mannitol. (B–E) PSTHs of a HT-CS + DS corneal neuron in response to dry stimuli (dry responses; green) before (B), during (C), and 3 hours after the application of the mannitol HOS (D). (E) Very little recovery of the dry responses (green) 15 minutes after HOS washing. Notice that the dry responses in (D) are in fact the decreases (arrows) from the elevated background discharges (see text). (F–H) Poststimulus time histograms and action potentials (upper graph) of another HT-CS + DS neuron in response to dry stimuli before and during (F) and 1 hour after the application of the mannitol HOS (G). Later time points in (G) also show the disappearance of the spikes. There was no dry response at a 3-hour period (not shown). (H) The dry responses failed to recover 2.5 hours after HOS washing. Time scale bars (5 minutes) apply to all figures. Symbols indicate the same statistical significance levels as in Figure 5.
Figure 4 shows that under an extremely high tear osmolarity (1000 mOsm), the dry responses of this HT-CS + DS neuron decreased noticeably at 30 minutes and 1 hour after the application of the 1000-mOsm HOS (Figs. 4B, 4C); but just before the 3-hour period, the action potentials disappeared (Fig. 4D), and the dry responses at 3 hours after the HOS could not be observed (Fig. 4E). Figure 4F shows the recovery of the dry responses 25 minutes after the wash, confirming that the disappearance was not simply a loss of the recording.
Figure 4.

Poststimulus time histograms of another HT-CS + DS corneal neuron in response to drying of the cornea (dry responses; green) before (A), 30 minutes (B), and 1 hour (C) after the application of HOS (1000-mOsm NaCl). (D) The background discharges suddenly disappeared at 2.9 hours after HOS application, and the dry response was absent when tested at 3 hours after the HOS application (E) but was recovered partially 25 minutes after washing the HOS with ATs (F). The traces above PSTHs are raw data (action potentials) during the same time epochs shown below as PSTHs; the vertical bar to the right of each trace indicates the calibration amplitude.
Figure 5A demonstrates that, as a group, the average dry responses of HT-CS + DS neurons decreased progressively as the exposure to the hyperosmolar stimuli was maintained over 30 minutes, 1 hour, and 3 hours, corroborating the above examples from individual neurons (Figs. 3, 4). The extent of the suppressions depended on the osmolarity of the tears and the time periods: The dry responses were decreased more by higher osmolarity and by longer periods of exposure to the HOS. Again consistent with the individual examples above, the washing out of the HOS did not recover the dry responses, but the responses continued to decrease for all groups except the 1000-mOsm group, suggesting that the deleterious effect of the HOS on the dry response and tearing could be long lasting. Under the 1000-mOsm stimulus, however, the average dry response rebounded partially (49% of the pre-HOS level) after washout, although the value was still significantly below the pre-HOS level (P < 0.05, 1-way ANOVA). After 3 hours of treatments with hyperosmolar tears, the dry responses were reduced by −23%, −19%, −38%, and −100%, respectively, for the 450-, 600-, 800-, and 1000-mOsm groups. Two-way ANOVA (time periods × osmolarity) revealed that “time” (P = 0.0005), but not “osmolarity” (P = 0.1008) was a significant factor in altering the dry responses (2-way ANOVA). Thus, 1-way ANOVA was performed on each osmolarity to evaluate the importance of time; the results indicated that only 800 mOsm (P < 0.05) and 1000 mOsm (P < 0.0001) led to statistically significant time-dependent decreases in the dry responses. Furthermore, the individual comparisons (t-tests) between each time point compared to responses before the HOS for the 800- and 1000-mOsm groups showed that the dry responses were significantly smaller at all time points after the HOS than before, except at 30 minutes in the 800-mOsm group (Fig. 5A).
Figure 5.

Graphs showing the changes in averaged dry responses before and after the applications of hyperosmolar stimuli for groups of HT-CS + DS (A) and LT-CS + DS (B) corneal neurons. (A) “Time” (P = 0.0005) but not “osmolarity” (P = 0.1008) was a significant factor in altering the dry responses (2-way ANOVA). *P < 0.05; **P < 0.01; ***P < 0.001; ****P < 0.0001 versus before (t-tests for 800- and 1000-mOsm groups; see text). (B) Both time (P = 0.0012) and osmolarity (P = 0.0068) had significant effects on dry responses (2-way ANOVA). One-way ANOVA reveals that only 450- and 600-mOsm HOS produced significant decreases (P = 0.0052) and increases (P = 0.0001), respectively, in the dry response from before the hyperosmolar stimuli. Symbols indicate the same statistical significance levels as in (A).
Figure 5B shows that for LT-CS + DS neurons as a group, hyperosmolar tears had slightly different effects on the dry responses. Two-way ANOVA revealed that both time (P = 0.0012) and osmolarity factors (P = 0.0068) had significant impacts on the dry responses; however, post hoc analyses indicated that the significance was apparently attributed to the significant changes in the dry responses for 1000-mOsm group after 3 hours of hyperosmolar stimuli and after the wash (P < 0.01; Bonferroni multiple comparisons). Furthermore, 1-way ANOVA performed on each osmolarity group demonstrated that significant effects of time periods were found only for the 450-mOsm (P = 0.0052) and 600-mOsm (P < 0.0001) groups but in opposite directions (i.e., decrease and increase, respectively). Under the 600-mOsm HOS, the dry responses increased significantly by +12% (at 1 hour; P < 0.05, t-test) and +26% (at 3 hours; P < 0.01, t-test) from the dry response before the HOS. These results apparently derived from the HOS-induced increases in background firing that were so powerfully sustained (i.e., very little adaptation) that the dry responses added to the increased background discharge, thus elevating the dry response magnitudes (cf. the first dry response in Fig. 2E). By contrast, under the 450-mOsm HOS, the dry responses decreased by −8% at the 3-hour period (NS, t-test) and −40% after the wash (P < 0.05, t-test). The decreases in dry responses under the 1000-mOsm HOS were −42%, −40%, −51%, and −37% after 30 minutes, the 1- and 3-hour periods, and after washout, respectively, but failed to attain statistical significance (P = 0.2495, 1-way ANOVA).
Hyperosmolar Solutions Prepared From Mannitol Also Cause Depression of the Dry Responses
In order to determine if the hyperosmolar effects observed with NaCl solutions were due to tonicity or osmolarity, we tested the neurons with 600- to 1000-mOsm mannitol (nonpermeant) solutions in HT-CS + DS afferents. HT-CS + DS neurons were selected for this experiment because the results shown in Figure 5 revealed that they were more sensitive to the decreasing effects of the HOS than LT-CS + DS neurons. Figure 6 confirmed that the depressive influence of the HOS could be seen also with mannitol-based hyperosmolar tears, suggesting that it was due to osmolarity rather than to tonicity. Two-way ANOVA revealed that the reductions of the dry responses among the HT-CS + DS afferents after 3 hours of mannitol HOS treatments were not significantly different from those of NaCl (P = 0.7423): The percent reductions were −19%, −38%, and −100% for NaCl, and −36%, −42%, and −89% for mannitol, respectively, with 600-, 800-, and 1000-mOsm HOS. Also much like the effect of the extreme HOS prepared from NaCl (800 and 1000 mOsm), the action potentials were often seen to disappear with the continuous HOS prepared from mannitol (Figs. 6G, 6H). This will be further described below.
The Dry Responses Under High Osmolar Tears (800–1000 mOsm) Are Dysfunctional
The original protocol was designed so that all the proposed osmolarities (450- to 1000-mOsm solutions) could be applied to the eyes in pseudorandom order. In the course of testing these stimuli, however, it became obvious that the dry responses under the higher ranges of the hyperosmolar tears (800–1000 mOsm) displayed characteristics markedly different from those seen under the lower osmolarities (450–600 mOsm). This is exemplified by Figure 5A, demonstrating that the statistically significant decline in the average dry responses occurred only with the 800- to 1000-mOsm NaCl solutions. The most striking feature of the responses under the 1000-mOsm, and to some extent also under the 800-mOsm HOS, however, was the consistent observation of the action potential disappearance. This is illustrated in Figure 7 and can be seen also in Figures 4D and 4E described above. Figure 7 shows examples of the types of disappearance observed in most neurons under the 1000 mOsm, but also in some neurons under the 600 and 800 mOsm. The corneal afferent shown in Figure 7A exhibited a sudden disappearance of the action potentials within minutes (∼18 minutes) of the initial application of the HOS followed by the repeated disappearance and reappearance patterns, which never completely disappeared even after 3 hours (middle column). The background discharges of these neurons (middle column) seem to have little relationship to the dry stimuli impinging on the cornea that normally give rise to the healthy dry responses such as those shown in the right column. Spikes from another afferent shown in Figure 7B suddenly disappeared after a period of exposure to the HOS (∼1.5 hours), and then shortly afterward reappeared, only to be followed by a complete disappearance that lasted as long as the HOS was present (3 hours); but a vigorous dry response was recovered after the wash. Figure 7C shows that the action potential amplitudes gradually decreased shortly after the HOS application until they suddenly depolarized strongly and disappeared as long as the HOS was present. However, unlike the afferent in Figure 7B, the action potentials of the neuron in Figure 7C did not return even after 2 hours of washout, indicating that the loss of action potentials may be permanent, implying structural damage to the nerves, as will be described in the discussion of anatomy below. Figure 7D shows that the spikes of another afferent vanished like the afferent in Figure 7B, but showed evidence that the neuron was still alive as the spikes were unmasked by responding to another stimulus (the hyperosmolar solutions) while the responses to the dry and cold stimuli were still absent (right column).
Figure 7.

Examples of disappearing action potentials in four corneal afferents exposed to hyperosmolar solutions (HOS). (A) The spikes of this afferent (LT-CS + DS) disappeared suddenly (left column), which was followed by repeated patterns of reappearance and disappearance under continuing HOS (middle column). These patterns vanished and the normal dry responses appeared after wash (right column). (B) The spikes of this HT-CS + DS afferent disappeared suddenly (1.5 hours after application of HOS) followed by a brief reappearance, but the action potentials never reappeared again as long as the HOS was present (middle column). The dry responses eventually returned 15 minutes after HOS washing (right column). (C) The spikes of this HT-CS + DS afferent disappeared ∼30 minutes after low osmolar solutions (600 mOsm; middle column). Disappearance was preceded by vigorous depolarization (diminished amplitudes, arrows with waveforms identifying them as the same neurons despite the reduction in amplitudes). This disappearance was long lasting and did not reappear 30 minutes after wash (right column). (D) The spikes of this HT-CS + DS afferent disappeared and the dry responses never returned even after 1 hour of wash, but the right column shows that the presence of this neuron was detected by the responsiveness to other stimuli (1000-mOsm hyperosmolar solutions). This response was not due to the cold stimulation, as a 19°C stimulus failed to evoke any response. In the middle column, the bursts of discharges at the beginning of HOS application were from another (bigger) cell (see the waveform).
The Table shows the number of neurons tested with NaCl and mannitol hyperosmolar solutions whose responses went silent and number of neurons whose signals were recovered or not recovered after the wash. The Table demonstrates the dose-related disappearance of the action potentials, combining NaCl and mannitol groups, the responses of 15/20 units (75%) for 1000 mOsm; 4/19 (44%) neurons for 800 mOsm, 1/23 (4%) units for 600 mOsm, and none of the 9 neurons (0%) examined with 450-mOsm solutions vanished. χ2 analyses confirmed that the differences among these groups were highly significant (P < 0.0001). Because Figure 5A indicated that the dry responses under the low osmolarity (450–600 mOsm) behaved differently from those under the high osmolarity (800–1000 mOsm), we performed the statistics to compare these two groups. As expected, the proportion of neurons whose action potentials vanished under 800 to 1000 mOsm (19/39; 49%) was significantly higher than that under 450 to 600 mOsm, 1/32 (3%) (P < 0.0001; Fisher's exact test). The Table also shows that two different solutes (NaCl and mannitol) had similar effects on the disappearance of the action potentials. For example, with the 800- to 1000-mOsm hyperosmolar tears, the proportion of those neurons with disappearing spikes under the mannitol-based HOS (5/10; 50%) was identical to that under the NaCl-based HOS (14/29; 48%) (χ2, P = 0.9251). Moreover, although the cases of disappearance that did not recover after wash were greater numerically under the 800- to 1000-mOsm mannitol (5/5; 100%) than under the 800- to 1000-mOsm NaCl solutions (9/14; 64%), the differences were not statistically significant (χ2, P = 0.1195).
Immunohistochemistry
In order to test the hypothesis that spike disappearance after HOS correlates with anatomical changes in corneal epithelial nerves, we compared the immunohistochemical appearances of corneal nerves in eyes treated with 600- to 1000-mOsm NaCl HOS for 3 to 4 hours and in eyes treated with ATs. The results revealed striking differences in the morphologic appearance of SNFs, but no changes in epithelial NT morphology, between the two groups. While these qualitative differences were extremely significant, because of the high level of variability in absolute number, regional distribution, and severity of SNF changes in the HOS eyes, quantitation of these changes could not be assessed in a controlled, meaningful manner.
Subbasal Nerve Fibers
Subbasal nerve fibers in control (AT-treated) corneas were, with rare exceptions, densely stained, smooth calibered, and morphologically intact (Fig. 8A). A few SNFs exhibited some focal swellings or varicosities; however, none of the control SNFs were fragmented, discontinuous, or prominently beaded.
Figure 8.

Immunohistochemically stained SNFs and nerve terminals in AT-treated (A, B) and HOS-treated (C–F) corneas. Each of the paired images in rows 1 to 3 shows the same corneal area focused alternately on SNFs (left column) and nerve terminals (right column). (A, B) Subbasal nerve fibers (A) and nerve terminals (B) in a control, AT-treated cornea are smooth and morphologically intact. (C, D) Subbasal nerve fibers in a HOS-treated cornea (C) exhibit a variety of morphologies, ranging from smooth (arrowheads) to granular (short arrows) to prominently beaded (long arrows). In contrast, the nerve terminals that originate from these SNFs (arrows, [D]) appear structurally intact and are indistinguishable morphologically from those of control corneas. (E, F) Subbasal nerve fibers from a different area of the same HOS-treated cornea shown in (C) and (D), showing more profound degenerative changes. Most of the SNFs in this region have fragmented into linear arrays of disconnected axon fragments (arrowheads) or beads (short arrows). The SNFs at bottom left (large arrows) demonstrate a near-total loss of normal morphology, suggestive of an advanced stage of degeneration. Despite the profound changes in SNF morphology in this region, the nerve terminals (arrows, [F]) remain histologically intact. The regions of the subbasal plexi illustrated in the HOS corneas (C–F) are more peripheral than the area shown in the ATs cornea (A, B); thus, the nerve terminals, although morphologically intact, appear to be slightly less in number and density. The calibration bar in (A) is 50 μm and applies to all figures.
Corneal SNFs and NTs in 600-mOsm HOS-treated corneas were indistinguishable morphologically from those in control (AT-treated) corneas. In contrast, HOS-treated corneas exposed to higher-concentration hyperosmolar solutions (800–1000-mOsm NaCl) contained large numbers of SNFs that were morphologically abnormal (Figs. 8C, 8E). Many of the altered SNFs, although histologically intact, were less smooth and more “granular” in appearance than control SNFs. Still other, more severely affected, SNFs appeared as linear arrays of discontinuous axon segments or “beads” (Fig. 8E). The latter fibers resembled nerve fibers in advanced stages of degeneration. In extreme cases, the SNFs had disintegrated so completely that only disorganized clusters of widely dispersed beads remained (Fig. 8E, bottom left).
The number, distribution, and severity of affected SNF fibers varied considerably from cornea to cornea and from region to region within the same cornea. In most corneas, areas of the subbasal nerve plexus that contained large numbers of morphologically abnormal SNFs were interspersed with regions dominated by intact, “healthy”-looking SNFs. Individual corneal epithelial leashes (assemblages of SNFs originating from the same stromal nerve bundle) often contained mixtures of healthy (smooth-bored) and degenerating (fragmented and beaded) axons.
Intraepithelial Terminals
In contrast to the altered appearance of SNFs in HOS- versus AT-treated corneas, epithelial NTs in both the HOS corneas and ATS corneas were anatomically intact and morphologically indistinguishable. Intraepithelial nerve profiles in perpendicular sections of HOS- and AT-treated corneas were also morphologically indistinguishable (data not shown). In both groups, the NTs were intensely stained and morphologically diverse (Figs. 8B, 8D, 8F). Most terminals in both groups formed compact tree-like arrangements; however, some terminals were morphologically simple and resembled unbranched extensions of the more deeply lying SNFs.
Discussion
The present study demonstrated that treatment of the rat ocular surface with hyperosmolar tears leads to the disappearance of corneal nerve responses to drying of the cornea (a stimulus important for tearing) and simultaneously produces corneal subbasal nerve damage (a prominent sign in DE patients). Combined, these two observations suggest a possible mechanistic link between tear hyperosmolarity, altered corneal nerve function and morphology, and DED.
Corneal Nerve Dysfunction
The first major finding of the present study was the significant decline in corneal afferent responses to drying of the cornea (dry responses) under hyperosmolar tear conditions that are thought to mimic DE conditions. We proposed previously15,17,24 that the dry responses are likely the afferent trigger of the lacrimation reflex to produce tears: HT-CS + DS neurons promote noxious stimulus-induced tearing and LT-CS + DS neurons stimulate basal tearing. The decline of the dry responses was generally time and dose dependent for HT-CS + DS neurons, but was complex for LT-CS + DS neurons (Fig. 5). Our results thus suggest that tear hyperosmolarity has more detrimental effects on nociception-evoked tearing than basal tearing, as the dry responses of LT-CS + DS neurons are less affected or even increased under some hyperosmolar conditions (Fig. 5B). One of the hallmarks of DED is diminished tearing.25 Thus, our outcomes are consistent with clinical observations. Furthermore, the results of our previous study18 showing that hyperosmolar tears induce “sensitization” of corneal nerve functions may appear at first glance to be discordant with those of the present study showing that the same stimulus (hyperosmolar tears) produces “desensitization.” However, it is important to note that these two studies employed different durations (15 minutes in the previous study versus 30 to 180 minutes in the present study) and types of stimuli (cold stimulus in the previous study and corneal dryness in the present study).
The continuing decrease of the dry responses after washout and failure to return to pre-HOS level with 450- to 800-mOsm solutions (Fig. 5) was a somewhat surprising result. Statistically, although a significant decrease from the pre-HOS response (P < 0.05) was attained only for 1000 and 800 mOsm, the level for 600 and 450 mOsm also very closely approached significance: P = 0.0523 and P = 0.0544, respectively, for HT-CS + DS neurons. The results suggest that the deleterious effect of HOS on the dry response and therefore tearing could be long lasting, consistent with our anatomical observations described below. It has been demonstrated that shrunk cells caused by hyperosmolar solutions do not return to the normal cell sizes for many minutes by a regulatory volume increase as has been shown for the sucrose-based HOS on human lymphocytes.26 Also, extracellular hyperosmolarity has been known to cause profound cellular and molecular damage to cells via accumulation of osmolytes and inorganic ions perturbing protein structure and other organelles such as mitochondria.27,28 These factors might have contributed to the long-lasting effects of dry responses demonstrated in this study.
The second major finding of this study was the disappearance of corneal afferent action potentials under mild to severe hyperosmolar conditions (Fig. 7; Table). Two observations are especially noteworthy. First, the present study is, to our knowledge, the first systematic study to demonstrate that hyperosmolar solutions cause the disappearance of action potentials that is unlikely due to a simple loss of extracellular recordings. The latter conclusion was based on our observations that this phenomenon occurred very frequently (especially with 1000 mOsm) and also in a dose-dependent manner (Table). Although a brief description of a loss of neural signals under hyperosmolar tear conditions (>500 mOsm) has been reported previously,20 the present study is the first to report an association between hyperosmolarity-induced functional changes and anatomical alterations in corneal nerves (Fig. 8). Our study also revealed that the action potential disappearance applied to both classes of DS corneal neurons (Table), suggesting that most, if not all, types of corneal nerves are likely affected by hyperosmolar conditions on the ocular surface.
The other noteworthy observation was the rapidity with which the action potentials disappear—as early as 18 minutes after the initial exposure to HOS (Fig. 7A). The neurons disappeared at different times (from as little as 18 minutes to as long as 3 hours) after the initial exposure to hyperosmolar stimuli. The reasons why the responses of some neurons vanish more rapidly or are more susceptible than others remain unknown; however, possible factors might include (1) variations in the depth of the NTs affected; (2) active and passive NT remodeling as a consequence of epithelial cell turnover that occurs every 5 to 7 days29 at the time of hyperosmolar stress; and (3) intrinsic differences in NT susceptibility to osmotic stress or other insults—for example, only select subpopulations of C-fibers (∼17%) in adult rats undergo apoptosis 1 to 6 hours after capsaicin treatment.30
Corneal Nerve Damage
Our third major finding was that corneal subbasal nerves undergo what appear to be early stages of axon degeneration in response to the same hyperosmolar conditions that caused action potential disappearance. The anatomical (Fig. 8) and functional changes (Table) that we observed within 3 hours of hyperosmotic stress may reflect experimentally induced remodeling or early stages of degeneration. The classic features of nerve degeneration, that is, varicosity formation, terminal thickening, and fragmentation,31,32 mimic the morphologic changes seen here. Yet, the speed of degeneration observed in the present study was surprising. The rapid occurrence of action potential disappearance and nerve fragmentation suggest a hyperosmolarity-induced “neurotoxicity” mechanism similar to that invoked to explain capsaicin- or NMDA receptor activation-induced neuronal death initiated by cation entry.33,34 After only 13 minutes of exposure to capsaicin, the axon membranes of cultured rat dorsal root ganglion neurons have been shown to “explode” following swellings, retractions, and bleb formations.33 Similarly, brief (10 minutes) NMDA exposure to murine cortical cultures resulted in local swellings or varicosities on dendritic arbors.34 Other mechanisms may play a role. It has been widely accepted that inflammatory mediators and their downstream factors contribute significantly to the initiation and/or perpetuation of experimental DED.35,36 However, their major effects appear to be on the epithelial cell layers and/or corneal NTs.37 The HOS-induced effects on corneal nerves demonstrated in this study appear to be exerted primarily on the SNFs (axons), and thus may not represent the same phenomenon. It is interesting to speculate that the direct destruction of the corneal nerves by HOS could bypass any inflammatory factor leading to some forms of DED. A mechanism that may not involve inflammatory factors in DED (e.g., via lacrimal functional units) has already been proposed.12,38,39 Loosening or erosion of epithelial cell junctional complexes by the hyperosmotic solutions may be another reason why the action potentials disappear and subbasal nerves disintegrate. Sugar powders applied to the ocular surface have been known to strip epithelial cell layers within 40 minutes.40 Moreover, hyperosmolar stress has been known to increase tight junction permeability in airway epithelia within 4 minutes41 and to break down the blood–retinal barrier in retinal pigmented epithelial cells.42 Determining the precise factor(s) that would cause acute nerve degeneration and functional impairment should help elucidate the mechanism underlying the diminished tearing in DE patients as well as other anterior eye diseases such as neurotrophic keratopathy.
Clinical Implications
The ubiquitous presence of hyperosmolar tears is generally considered a gold standard sign of DED.6–8 It has been commonly agreed that tear osmolarity values are higher in DED patients than in non-DED patients, although the actual values of tear osmolarity in DED patients vary widely among studies. For example, while most studies have reported ∼315 to 370 mOsm,8,43,44 osmolarities as high as 675 mOsm have been reported.45 A number of technical caveats undoubtedly contributed to the variability. One troublesome fact is that tear samples are normally taken from a pool of tears in the lower half of the ocular surface; however, the simple act of inserting a pipette tip would naturally produce tearing, causing artificial dilution of the sample. Moreover, it has been implicitly agreed that the actual measurement of tear osmolarity from the central part of the cornea is not practical and the “true” values of tear osmolarity are not known. The best method, thus far, is a theoretical calculation based on experimental observations during tear breakup as the tears begin to evaporate after a blink. It has been predicted46 that even in normal people, as tears thin or break up, the osmolarity in certain spots of the cornea can reach ∼900 to 1000 mOsm or higher.47,48 Thus, the hyperosmolarity values of 450- to 1000-mOsm NaCl or mannitol solutions used in this study in an attempt to mimic DE conditions are not unreasonable. We found that the disappearance of action potentials can occur with an osmolarity as low as 600 mOsm and as rapidly as 18 minutes. In the clinical setting, high osmolarities and long durations of hyperosmolar tear treatments similar to those used in this study are unlikely to exist in DED as initiating and/or perpetuating factors; however, it is important to note that we still do not know all the parameters of hyperosmolar tear treatments, optimum or otherwise, that lead to or “initiate” declines in dry response or nerve damage. Future studies will determine if much lower osmolar tear concentrations (e.g., 350–400 mOsm), under conditions of normal blinking (e.g., every 10–15 seconds), might produce results comparable to those obtained in this study.
An important lesson for DED clinicians is our observation in some cases that action potentials that disappeared for 1- to 2-hour periods could return after washing the HOS for extremely prolonged periods of time (e.g., 3–4 hours; data not shown), indicating that corneal nerve function could be recovered if treated early with continuous wash with ATs such as Prosthetic Replacement of the Ocular Surface Ecosystem (PROSE). The present study may also explain previous studies of diminished tearing associated with subbasal nerve loss in diabetics,49 and axonal dysfunctions of diabetic neuropathy50–52 in which the local hyperglycemic hyperosmolarity could lead to functional and anatomical changes similar to those demonstrated in this study.
More work is required to extend the results of this study to clinical situations involving DED. For example, how rapidly does nerve damage after exposure to HOS occur (considering that eye blinks in normal circumstances will quickly eliminate any regional foci of hyperosmolar tears), although dysfunction (e.g., slow rate) of eye blink mechanisms in DE patients53 will more likely favor conditions leading to nerve damage. Once the damage occurs, it is important also to determine how likely and by what means the hyperosmolar tear-induced corneal nerve degeneration could be repaired. Finally, it remains to be determined why subbasal nerves, but not NTs, are altered morphologically by HOS. In vivo confocal microscopy (IVCM) studies provide irrefutable evidence of abnormal subbasal nerve morphology in DE patients; however, the high resolution afforded by even the most sensitive IVCM instrument has not been applied to successful quantification of NTs.54 Perhaps the immunohistochemical staining method of corneal whole-mount preparations used in this study is incapable of detecting subtle qualitative changes in intraepithelial NT morphology. Assessments of NT density and ultrastructural histologic appearance in perpendicular frozen or paraffin sections may provide additional insight into these issues.
Acknowledgments
We thank Laura Keppley and Inna Rozenberg for their significant contributions and excellent technical support in our laboratory.
Supported by National Institutes of Health Grants EY023555 (HH) and EY018594 (MIR) and a grant from Research to Prevent Blindness to the Department of Ophthalmology of Weill Cornell Medical College.
Disclosure: H. Hirata, None; K. Mizerska, None; C.F. Marfurt, None; M.I. Rosenblatt, None
References
- 1. Tomlinson A. Epidemiology of dry eye disease. : Asbell PA,, Lemp MA, Dry Eye Disease: The Clinician's Guide to Diagnosis and Treatment. New York, NY: Thieme Medical Publishers; 2006: 1–15. [Google Scholar]
- 2. Lemp MA,, Crews LA,, Bron AJ,, Foulks GN,, Sullivan BD. Distribution of aqueous-deficient and evaporative dry eye in a clinic-based patient cohort: a retrospective study. Cornea. 2012; 31: 472–478. [DOI] [PubMed] [Google Scholar]
- 3. The definition and classification of dry eye disease: report of the Definition and Classification Subcommittee of the International Dry Eye WorkShop (2007). Ocul Surf. 2007; 5: 75–92. [DOI] [PubMed] [Google Scholar]
- 4. Doughty MJ,, Fonn D,, Richter D,, Simpson T,, Caffery B,, Gordon K. A patient questionnaire approach to estimating the prevalence of dry eye symptoms in patients presenting to optometric practices across Canada. Optom Vis Sci. 1997; 74: 624–631. [DOI] [PubMed] [Google Scholar]
- 5. Gilbard JP,, Gray KL,, Rossi SR. A proposed mechanism for increased tear-film osmolarity in contact lens wearers. Am J Ophthalmol. 1986; 102: 505–507. [DOI] [PubMed] [Google Scholar]
- 6. Sullivan BD,, Whitmer D,, Nichols KK,, et al. An objective approach to dry eye disease severity. Invest Ophthalmol Vis Sci. 2010; 51: 6125–6130. [DOI] [PubMed] [Google Scholar]
- 7. Lemp MA,, Bron AJ,, Baudouin C,, et al. Tear osmolarity in the diagnosis and management of dry eye disease. Am J Ophthalmol. 2011; 151: 792–798, e791. [DOI] [PubMed] [Google Scholar]
- 8. Sullivan BD,, Crews LA,, Sonmez B,, et al. Clinical utility of objective tests for dry eye disease: variability over time and implications for clinical trials and disease management. Cornea. 2012; 31: 1000–1008. [DOI] [PubMed] [Google Scholar]
- 9. Tuominen IS,, Konttinen YT,, Vesaluoma MH,, Moilanen JA,, Helinto M,, Tervo TM. Corneal innervation and morphology in primary Sjogren's syndrome. Invest Ophthalmol Vis Sci. 2003; 44: 2545–2549. [DOI] [PubMed] [Google Scholar]
- 10. Benitez del Castillo JM Wasfy MA, Fernandez C, Garcia-Sanchez J. An in vivo confocal masked study on corneal epithelium and subbasal nerves in patients with dry eye. Invest Ophthalmol Vis Sci. 2004; 45: 3030–3035. [DOI] [PubMed] [Google Scholar]
- 11. Zhang M,, Chen J,, Luo L,, Xiao Q,, Sun M,, Liu Z. Altered corneal nerves in aqueous tear deficiency viewed by in vivo confocal microscopy. Cornea. 2005; 24: 818–824. [DOI] [PubMed] [Google Scholar]
- 12. Dartt DA. Dysfunctional neural regulation of lacrimal gland secretion and its role in the pathogenesis of dry eye syndromes. Ocul Surf. 2004; 2: 76–91. [DOI] [PubMed] [Google Scholar]
- 13. Nichols KK,, Foulks GN,, Schaumberg DA,, Smith JA. The changing times in dry eye research. Optom Vis Sci. 2008; 85: 613–614. [DOI] [PubMed] [Google Scholar]
- 14. Bron AJ,, Yokoi N,, Gafney E,, Tiffany JM. Predicted phenotypes of dry eye: proposed consequences of its natural history. Ocul Surf. 2009; 7: 78–92. [DOI] [PubMed] [Google Scholar]
- 15. Hirata H,, Meng ID. Cold-sensitive corneal afferents respond to a variety of ocular stimuli central to tear production: implications for dry eye disease. Invest Ophthalmol Vis Sci. 2010; 51: 3969–3976. [DOI] [PMC free article] [PubMed] [Google Scholar]
- 16. Parra A,, Madrid R,, Echevarria D,, et al. Ocular surface wetness is regulated by TRPM8-dependent cold thermoreceptors of the cornea. Nat Med. 2010; 16: 1396–1399. [DOI] [PubMed] [Google Scholar]
- 17. Hirata H,, Fried N,, Oshinsky ML. Quantitative characterization reveals three types of dry-sensitive corneal afferents: pattern of discharge, receptive field, and thermal and chemical sensitivity. J Neurophysiol. 2012; 108: 2481–2493. [DOI] [PMC free article] [PubMed] [Google Scholar]
- 18. Hirata H,, Rosenblatt MI. Hyperosmolar tears enhance cooling sensitivity of the corneal nerves in rats: possible neural basis for cold-induced dry eye pain. Invest Ophthalmol Vis Sci. 2014; 55: 5821–5833. [DOI] [PMC free article] [PubMed] [Google Scholar]
- 19. Belmonte C,, Gallar J. Cold thermoreceptors, unexpected players in tear production and ocular dryness sensations. Invest Ophthalmol Vis Sci. 2011; 52: 3888–3892. [DOI] [PubMed] [Google Scholar]
- 20. Parra A,, Gonzalez-Gonzalez O,, Gallar J,, Belmonte C. Tear fluid hyperosmolality increases nerve impulse activity of cold thermoreceptor endings of the cornea. Pain. 2014; 155: 1481–1491. [DOI] [PubMed] [Google Scholar]
- 21. Quallo T,, Vastani N,, Horridge E,, et al. TRPM8 is a neuronal osmosensor that regulates eye blinking in mice. Nat Commun. 2015; 6: 7150. [DOI] [PMC free article] [PubMed] [Google Scholar]
- 22. Kessler TL,, Mercer HJ,, Zieske JD,, McCarthy DM,, Dartt DA. Stimulation of goblet cell mucous secretion by activation of nerves in rat conjunctiva. Curr Eye Res. 1995; 14: 985–992. [DOI] [PubMed] [Google Scholar]
- 23. Marfurt CF,, Cox J,, Deek S,, Dvorscak L. Anatomy of the human corneal innervation. Exp Eye Res. 2010; 90: 478–492. [DOI] [PubMed] [Google Scholar]
- 24. Hirata H,, Oshinsky ML. Ocular dryness excites two classes of corneal afferent neurons implicated in basal tearing in rats: involvement of transient receptor potential channels. J Neurophysiol. 2012; 107: 1199–1209. [DOI] [PMC free article] [PubMed] [Google Scholar]
- 25. Tsubota K. Tear dynamics and dry eye. Prog Retin Eye Res. 1998; 17: 565–596. [DOI] [PubMed] [Google Scholar]
- 26. Baumgarten CM,, Feher, JJ. Osmosis and regulation of cell volume. : Sperelakis N, Cell Physiology Source Book. Amsterdam: Elsevier; 2012: 262–301. [Google Scholar]
- 27. Burg MB,, Ferraris JD,, Dmitrieva NI. Cellular response to hyperosmotic stresses. Physiol Rev. 2007; 87: 1441–1474. [DOI] [PubMed] [Google Scholar]
- 28. Sperelakis N. Cell Physiology Sourcebook: Essentials of Membrane Biophysics. London UK; Waltham, MA: Elsevier/Academic Press; 2012: 261–301. [Google Scholar]
- 29. Harris LW,, Purves D. Rapid remodeling of sensory endings in the corneas of living mice. J Neurosci. 1989; 9: 2210–2214. [DOI] [PMC free article] [PubMed] [Google Scholar]
- 30. Jancso G,, Kiraly E,, Joo F,, Such G,, Nagy A. Selective degeneration by capsaicin of a subpopulation of primary sensory neurons in the adult rat. Neurosci Lett. 1985; 59: 209–214. [DOI] [PubMed] [Google Scholar]
- 31. RamonyCajal S. Degeneration and Regeneration of the Nervous System. London: Oxford University Press; 1928.
- 32. May RM. Cajal's Degeneration and Regeneration of the Nervous System. New York: Hafner; 1959. [Google Scholar]
- 33. Pecze L,, Blum W,, Schwaller B. Mechanism of capsaicin receptor TRPV1-mediated toxicity in pain-sensing neurons focusing on the effects of Na(+)/Ca(2+) fluxes and the Ca(2+)-binding protein calretinin. Biochim Biophys Acta. 2013; 1833: 1680–1691. [DOI] [PubMed] [Google Scholar]
- 34. Faddis BT,, Hasbani MJ,, Goldberg MP. Calpain activation contributes to dendritic remodeling after brief excitotoxic injury in vitro. J Neurosci. 1997; 17: 951–959. [DOI] [PMC free article] [PubMed] [Google Scholar]
- 35. Pflugfelder SC,, Farley W,, Luo L,, et al. Matrix metalloproteinase-9 knockout confers resistance to corneal epithelial barrier disruption in experimental dry eye. Am J Pathol. 2005; 166: 61–71. [DOI] [PMC free article] [PubMed] [Google Scholar]
- 36. Chen Z,, Tong L,, Li Z,, et al. Hyperosmolarity-induced cornification of human corneal epithelial cells is regulated by JNK MAPK. Invest Ophthalmol Vis Sci. 2008; 49: 539–549. [DOI] [PMC free article] [PubMed] [Google Scholar]
- 37. Pflugfelder SC. Tear dysfunction and the cornea: LXVIII Edward Jackson Memorial Lecture. Am J Ophthalmol. 2011; 152: 900–909 e901. [DOI] [PMC free article] [PubMed] [Google Scholar]
- 38. Toshida H,, Nguyen DH,, Beuerman RW,, Murakami A. Neurologic evaluation of acute lacrimomimetic effect of cyclosporine in an experimental rabbit dry eye model. Invest Ophthalmol Vis Sci. 2009; 50: 2736–2741. [DOI] [PMC free article] [PubMed] [Google Scholar]
- 39. Stern ME,, Gao J,, Siemasko KF,, Beuerman RW,, Pflugfelder SC. The role of the lacrimal functional unit in the pathophysiology of dry eye. Exp Eye Res. 2004; 78: 409–416. [DOI] [PubMed] [Google Scholar]
- 40. Katsuyama I,, Arakawa T. A convenient rabbit model of ocular epithelium damage induced by osmotic dehydration. J Ocul Pharmacol Ther. 2003; 19: 281–289. [DOI] [PubMed] [Google Scholar]
- 41. Willermain F,, Libert S,, Motulsky E,, et al. Origins and consequences of hyperosmolar stress in retinal pigmented epithelial cells. Front Physiol. 2014; 5: 199. [DOI] [PMC free article] [PubMed] [Google Scholar]
- 42. Hogman M,, Mork AC,, Roomans GM. Hypertonic saline increases tight junction permeability in airway epithelium. Eur Respir J. 2002; 20: 1444–1448. [DOI] [PubMed] [Google Scholar]
- 43. Tomlinson A,, Khanal S,, Ramaesh K,, Diaper C,, McFadyen A. Tear film osmolarity: determination of a referent for dry eye diagnosis. Invest Ophthalmol Vis Sci. 2006; 47: 4309–4315. [DOI] [PubMed] [Google Scholar]
- 44. Nelson JD,, Farris RL. Sodium hyaluronate and polyvinyl alcohol artificial tear preparations. A comparison in patients with keratoconjunctivitis sicca. Arch Ophthalmol. 1988; 106: 484–487. [DOI] [PubMed] [Google Scholar]
- 45. Gilbard JP,, Farris RL. Tear osmolarity and ocular surface disease in keratoconjunctivitis sicca. Arch Ophthalmol. 1979; 97: 1642–1646. [DOI] [PubMed] [Google Scholar]
- 46. Braun RJ,, King-Smith PE,, Begley CG,, Li L,, Gewecke NR. Dynamics and function of the tear film in relation to the blink cycle. Prog Retin Eye Res. 2015; 45: 132–164. [DOI] [PMC free article] [PubMed] [Google Scholar]
- 47. King-Smith PE,, Nichols JJ,, Nichols KK,, Fink BA,, Braun RJ. Contributions of evaporation and other mechanisms to tear film thinning and break-up. Optom Vis Sci. 2008; 85: 623–630. [DOI] [PubMed] [Google Scholar]
- 48. Liu H,, Begley C,, Chen M,, et al. A link between tear instability and hyperosmolarity in dry eye. Invest Ophthalmol Vis Sci. 2009; 50: 3671–3679. [DOI] [PubMed] [Google Scholar]
- 49. Misra SL,, Craig JP,, Patel DV,, et al. In vivo confocal microscopy of corneal nerves: an ocular biomarker for peripheral and cardiac autonomic neuropathy in type 1 diabetes mellitus. Invest Ophthalmol Vis Sci. 2015; 56: 5060–5065. [DOI] [PubMed] [Google Scholar]
- 50. Sima AA,, Zhang W. Mechanisms of diabetic neuropathy: axon dysfunction. Handb Clin Neurol. 2014; 126: 429–442. [DOI] [PubMed] [Google Scholar]
- 51. Biessels GJ,, Bril V,, Calcutt NA,, et al. Phenotyping animal models of diabetic neuropathy: a consensus statement of the diabetic neuropathy study group of the EASD (Neurodiab). J Peripher Nerv Syst. 2014; 19: 77–87. [DOI] [PMC free article] [PubMed] [Google Scholar]
- 52. Matsuka Y,, Spigelman I. Hyperosmolar solutions selectively block action potentials in rat myelinated sensory fibers: implications for diabetic neuropathy. J Neurophysiol. 2004; 91: 48–56. [DOI] [PubMed] [Google Scholar]
- 53. Nakamori K,, Odawara M,, Nakajima T,, Mizutani T,, Tsubota K. Blinking is controlled primarily by ocular surface conditions. Am J Ophthalmol. 1997; 124: 24–30. [DOI] [PubMed] [Google Scholar]
- 54. Ivanusic JJ,, Wood RJ,, Brock JA. Sensory and sympathetic innervation of the mouse and guinea pig corneal epithelium. J Comp Neurol. 2013; 521: 877–893. [DOI] [PubMed] [Google Scholar]