Abstract
Griseofulvin (GSF) causes hepatic porphyria in mice, which mimics the liver injury associated with erythropoietic protoporphyria (EPP) in humans. The current study investigated the biochemical basis of GSF-induced liver injury in mice using a metabolimic approach. GSF treatment in mice resulted in significant accumulations of protoporphyrin IX (PPIX), N-methyl PPIX, bile acids, and glutathione (GSH) in the liver. Metabolomic analysis also revealed bioactivation pathways of GSF that contributed to the formation of GSF-PPIX, GSF-GSH and GSF-proline adducts. GSF-PPIX is the precursor of N-methyl PPIX. A six-fold increase of N-methyl PPIX was observed in the liver of mice after GSF treatment. N-methyl PPIX strongly inhibits ferrochelatase, the enzyme that converts PPIX to heme, and leads to PPIX accumulation. Excessive PPIX in the liver results in bile duct blockage and disturbs bile acid homeostasis. The accumulation of GSH in the liver was likely due to Nrf2-mediated upregulation of GSH synthesis. In summary, this study provides the biochemical basis of GSF-induced liver injury that can be used to understand the pathophysiology of EPP-associated liver injury in humans.
Keywords: Griseofulvin, drug toxicity, drug metabolism, metabolomics, erythropoietic protoporphyria
Graphical Abstract
1. Introduction
Griseofulvin (GSF) is used both in animals and humans for management of fungal infections. GSF is associated with multiple side effects including confusion, dizziness, nausea, diarrhea, and fatigue [1-3]. In addition, GSF is contraindicated to patients with porphyrias [4-6]. GSF causes hepatic porphyria in mice [7, 8]. GSF upregulates the expression of the delta-aminolevulinate synthase (ALAS), the rate-limiting enzyme in heme synthesis pathway that increases the production of porphyrins [9]. Moreover, GSF treatment results in functional deficiency of ferrochelatase (FECH), the enzyme that converts protoporphyrin IX (PPIX) to heme [10]. Thus, GSF treatment in mice causes PPIX accumulation in the liver which leads to liver damage [7, 8]. This phenotype is similar to human subjects with erythropoietic protoporphyria (EPP)-associated liver injury [7, 11, 12]. Therefore, GSF is commonly used as a tool drug to generate a mouse model for investigating EPP-associated liver injury [7, 8].
Studies of GSF in mice have revealed hepatocellular injury, cholestasis, ductular proliferation and cirrhosis [8, 13-15]. In addition, oxidative stress has been observed in the liver of mice treated with GSF [16]. Global gene analysis showed GSF-mediated alteration of genes that may be associated with inflammation, fibrosis, and cholestasis [17]. Nevertheless, the biochemical basis of GSF-induced liver injury remains understudied. The gaps are two-fold: (1) what are altered by GSF in liver metabolome; and (2) how does GSF cause the changes in liver metabolome? The current study addressed these two questions in mice using a metabolomic approach.
2. Materials and Methods
2.1. Chemicals and reagents
Griseofulvin (GSF), protoporphyrin IX (PPIX), N-methyl PPIX, β-Nicotinamide adenine dinucleotide phosphate (NADPH), glutathione (GSH) and L-proline (PRL) were purchased from Sigma-Aldrich (St. Louis, MO). Chemical standards of bile acids were obtained from Steraloids, Inc. (Newport, RI). All solvents for ultra-performance liquid chromatography and quadrupole time-of-flight mass spectrometry (UPLC-QTOFMS) analysis were of the highest grade commercially available.
2.2. Animals and treatment
FVB/NJ mice (male, 8 weeks old) were fed with 2.5% GSF diet (w/w) or control diet (n=4 per group) for 14 days. The dose and time of GSF treatment was chosen based on the previous studies that showed liver injury in mice [16, 18]. On the last day of treatment, the mice were housed separately in metabolic cages to collect urine and feces. Afterwards, all mice were sacrificed and liver tissues were harvested. A section of liver tissues was fixed in 4% formaldehyde phosphate buffer. The remaining liver tissues were flash-frozen in liquid nitrogen and stored at −80 °C until further analysis. The study protocol was approved by the Institutional Animal Care and Use Committee.
2.3. Biochemical and pathological analysis
Biochemical analysis was conducted to measure alanine transaminase (ALT) and alkaline phosphatase (ALP) activities in serum. For pathological analysis, fixed liver tissues were subjected to dehydration in serial concentrations of alcohol and xylene followed by paraffin embedding. Four-micrometer sections of liver tissues were cut and stained with hematoxylin and eosin.
2.4. Sample preparation for metabolite analysis
Twenty five microliters of serum sample was mixed with 75 μL of methanol, followed by vortexing for 30 s and centrifugation at 15,000 g for 10 min. Liver samples were homogenized in water (100 mg tissue in 400 μl water), and then a 200 μL aliquot of methanol was added to 100 μL of liver homogenate. The mixture was vortexed twice for 1 min and centrifuged at 15,000 g for 20 min. Urine samples were prepared by mixing 50 μL of urine with 100 μL of acetonitrile and then centrifuged at 15,000 g for 10 min. Feces were homogenized in water (1 mg of feces in 10 μL of H2O), and then a 200 μl of acetonitrile: MeOH (1:1, v/v) was added to 200 μL of the resulting mixture, followed by centrifugation at 15,000 g for 10 min. The supernatant was transferred to a new Eppendorf vial for a second centrifugation. One microliter of the supernatant was injected onto the UPLC-QTOFMS system for metabolite analysis.
2.5. In vitro metabolism of GSF
Incubations were conducted in 1× phosphate-buffered saline (PBS, pH 7.4), containing 10 μM GSF and 0.1 mg of mouse liver microsomes (XenoTech, LLC, Lenexa, KS) in a final volume of 190 μL. Incubations were performed in triplicates. After 5 min of pre-incubation at 37 °C, the reaction was initiated by the addition of 10 μL of 20 mM NADPH (final concentration 1.0 mM) and continued for 40 min with gentle shaking. GSH or PRL (final concentration 5.0 mM) was used to trap reactive metabolites. Incubations were terminated by adding 200 μL of ice-cold methanol, and then vortexed for 30 s and centrifuged at 15,000 g for 10 min. One microliter of the supernatant was injected onto the UPLC-QTOFMS system for metabolite analysis.
2.6. UPLC-QTOFMS analysis
Chromatographic separation of metabolites was performed on an Acquity UPLC BEH C18 column (2.1 × 100 mm, 1.7 μm; Waters Corporation, Milford, MA). The mobile phase A (MPA) was 0.1% formic acid in water, and the mobile phase B (MPB) was 0.1% formic acid in acetonitrile. The gradient began at 2% MPB and held for 1 min, followed by 12 min linear gradient to 95% MPB, held for 8 min, and then decreased to 2% MPB for column equilibration. The flow rate of mobile phase was 0.5 ml/min and the column temperature was maintained at 50 °C. The QTOFMS system (Waters Corporation, Milford, MA) was operated in a high resolution mode (resolution ~ 20,000) with electrospray ionization. The source and desolvation temperatures were set at 150 °C and 500 °C, respectively. Nitrogen was applied as the cone gas (50 L/h) and desolvation gas (800 L/h). Argon was applied as collision gas. The capillary and cone voltages were set at 0.8 kV and 40 V. QTOFMS was calibrated with sodium formate and monitored by the intermittent injection of lock mass leucine encephalin (m/z = 556.2771) in real time.
2.7. Data analysis
Mass spectra were acquired by MassLynx 4.1 (Waters Corporation, Milford, MA) in centroid format from m/z 50 to 1000. A multivariate data matrix containing sample identity, ion identity (retention time and m/z) and ion abundance was generated through deisotoping, deconvolution, peak alignment, recognition and integration. The data matrix was then exported into SIMCA-P+ (Version 13, Umetrics, Kinnelon, NJ) and transformed by mean-centering and Pareto-scaling. Principal component analysis (PCA) was performed to analyze the natural inter-relationship among different treatment groups. Orthogonal partial least-squares discriminant analysis (OPLS-DA) was further conducted to maximize the class discrimination.
2.8. Quantitative polymerase chain reaction (qPCR) analysis
Total mRNA was extracted from approximately 50 mg of frozen liver tissues using TRIzol reagent (Invitrogen, Carlsbad, CA). First strand cDNA was generated from 1 μg of total RNA with a SuperScript II Reverse Transcriptase kit and random oligonucleotides (Invitrogen). All the qPCR primer sequences were designed using qPrimerDepot. qPCR was carried out using Sybrgreen PCR master mix on an ABI-Prism 7500 Sequence Detection System (Applied Biosystems, Foster City, CA).
2.9. Statistical analysis
All quantified data are expressed as means ± S.D. Statistical significance between groups was determined by two-tailed Student's t test. A P value less than 0.05 is considered as statistically significant.
3. Results
3.1. GSF-induced liver injury in mice
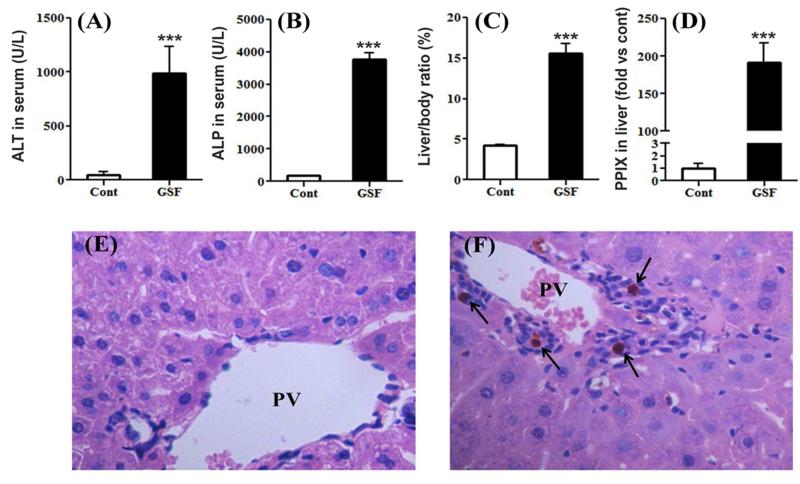
Compared to the control group, GSF treatment resulted in significant increases in serum ALT and ALP levels (Fig. 1A and 1B), indicating a mixed hepatocellular-cholestatic injury. GSF treatment also resulted in liver enlargement, as the liver to body weight ratio increased significantly in GSF group (Fig. 1C). As expected, PPIX accumulated dramatically in the liver of mice after GSF treatment (Fig. 1D). By histological analysis, we observed bile plugs along with inflammation in the liver of mice treated with GSF (Fig. 1F), suggesting bile duct obstruction. These biochemical and pathological changes are similar to previous studies on GSF-induced liver injury in mice [16, 18].
Figure 1. GSF-induced liver injury in mice.
WT mice were treated with control diet or GSF diet for 14 days. A and B, ALT and ALP activities in serum. C, liver to body weight ratios. D, relative quantification of PPIX levels in the liver. All data are expressed as means ± S.D. (n=4). The data in control group were set as 1. ***P < 0.005 vs control. E and F, histological analysis of liver from control (E) and GSF group (F), H&E staining, 200 X. PV, portal vein. Arrows point to bile plugs.
3.2. GSF disturbs liver metabolome in mice
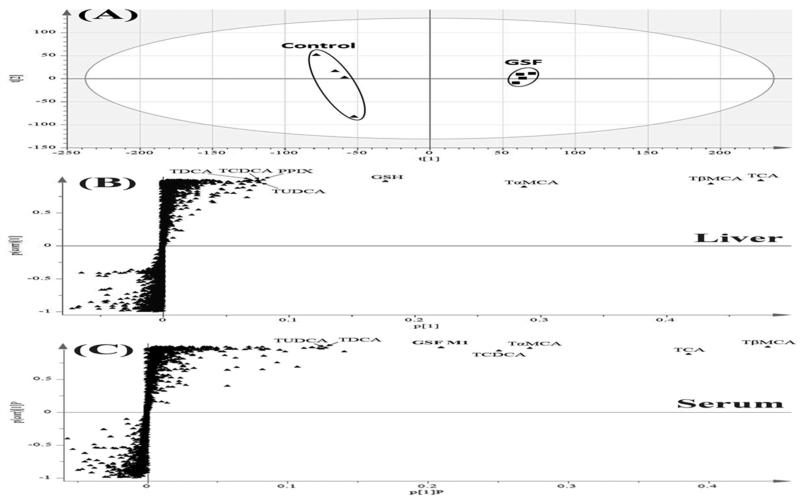
PCA analysis demonstrated clear differences of liver metabolome between the control and GSF groups (Fig. 2A). OPLS-DA analysis revealed ions contributing to this group separation, which included bile acids, PPIX, and GSH (Fig. 2B). Bile acids were also the top ranking ions in serum of mice treated with GSF (Fig. 2C). In addition, metabolomic analysis identified GSF metabolites in the liver and serum samples. Moreover, accumulation of N-methyl PPIX was observed in the liver of mice treated with GSF. Overall, GSF treatment resulted in significant accumulations of PPIX, N-methyl PPIX, bile acids, and GSH in the liver (Table 1).
Figure 2. Metabolomic analysis of samples from mice treated with GSF.
All samples were analyzed by UPLC-QTOFMS in negative mode. A, Separation of liver samples from the control and GSF groups in a PCA score plot. The t[1] and t[2] values represent the score of each sample in principle component 1 and 2, respectively. B and C, loading S plots of liver (B) and serum (C) samples generated by OPLS-DA analysis. The x-axis is a measure of the relative abundance of ions, and the y-axis is a measure of the correlation of each ion to the model. Top ranking ions were labeled.
Table 1. Accumulated endogenous metabolites in the liver of mice treated with GSF.
Liver samples were analyzed by UPLC-QTOFMS.
| No. | Chemical Class | Identity | RT (min) | Observed m/z | Mass error | Formula |
|---|---|---|---|---|---|---|
| 1 | Porphyrins | PPIX | 11.03 | 563.2654 | −0.7 | C34H34N4O4 |
| 2 | N-methyl PPIX | 11.85 | 577.2809 | −1.0 | C35H36N4O4 | |
| 3 | Bile acids | TCA | 5.62 | 514.2838 | 0.0 | C26H45NO7S |
| 4 | TβMCA | 4.99 | 514.2839 | 0.2 | C26H45NO7S | |
| 5 | TαMCA | 4.89 | 514.2841 | 0.6 | C26H45NO7S | |
| 6 | TDCA | 6.25 | 498.2891 | 0.4 | C26H45NO6S | |
| 7 | TCDCA | 6.18 | 498.2885 | −0.8 | C26H45NO6S | |
| 8 | TUDCA | 5.52 | 498.2881 | −1.6 | C26H45NO6S | |
| 9 | Antioxidant | GSH | 0.67 | 308.0913 | −1.0 | C10H17N3O6S |
RT, retention time; ppm, part per million; PPIX, protoporphyrin IX; TCA, Taurocholic acid; TαMCA, Tauro-α-Muricholic acid; TβMCA, Tauro-β-Muncholic acid; TDCA, Tauro-deoxycholic acid, TCDCA, Tauro-Chenodeoxycholic Acid; TUDCA, Tauroursodeoxycholic acid; GSH, Glutathione.
3.3. Bile duct blockage and bile acid accumulation
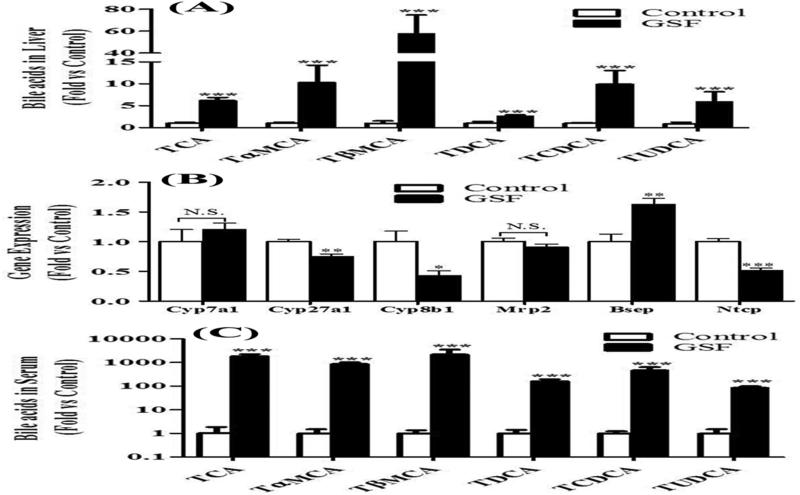
The liver is the center for bile acid synthesis and homeostasis [19, 20]. We observed significant accumulation of bile acids in the liver of mice treated with GSF (Fig. 2B and 3A). We next tested whether the accumulation of bile acids in the liver is due to the regulation of genes encoding the enzymes and transporters that are involved in bile acid homeostasis. Enzymes contributing to bile acid synthesis include cholesterol 7ɑ-hydroxylase (Cyp7a1), 8β-hydroxylase (Cyp8b1) and sterol 27-hydroxylase (Cyp27a1) [19, 20]. GSF treatment had no effect on Cyp7a1expression, but downregulated the expressions of Cyp8b1 and Cyp27a1 (Fig. 3B). For the transporters, GSF treatment had no effect on expression of multidrug resistance-associated protein 2 (Mrp2), the transporter that pumps out bilirubin [21]. However, we observed the upregulation of bile salt export pump (Bsep) and downregulation of Na+-taurocholate cotransporting polypeptide (Ntcp) (Fig. 4B), the two transporters that are involved in efflux and uptake of bile acids, respectively [22, 23]. Increase of Bsep and decrease of Ntcp have been considered as an adaptive response to obstructive cholestasis [23]. We observed bile duct blockage in mice treated with GSF (Fig. 1F). Therefore, we conclude that GSF-mediated enrichment of bile acids in the liver is caused by bile duct blockage, but not by bile acid synthesis. This mechanism is supported by the fact that a remarkable accumulation of bile acids was observed in the serum of mice treated with GSF (Fig. 2C and Fig. 3C), in which the pathway of bile acid excretion is blocked.
Figure 3. Accumulation of bile acids in mice treated with GSF.
Bile acids were analyzed by UPLC-QTOFMS. A, relative abundances of TCA, TɑMCA, TβMCA, TDCA, TCDCA and TUDCA in the liver. B, expression of genes responsible for bile acid synthesis (Cyp7a1, Cyp27a1 and Cyp8b1) and transport (Mrp2, Bsep and Ntcp) in the liver. C, relative abundances of bile acids in serum. All data are expressed as means ± S.D. (n=4). The data in control group were set as 1. *P < 0.05; **P < 0.01; ***P < 0.005 vs control. N.S., not significant.
Figure 4. GSH and GSSG homeostasis in the liver of mice treated with GSF.
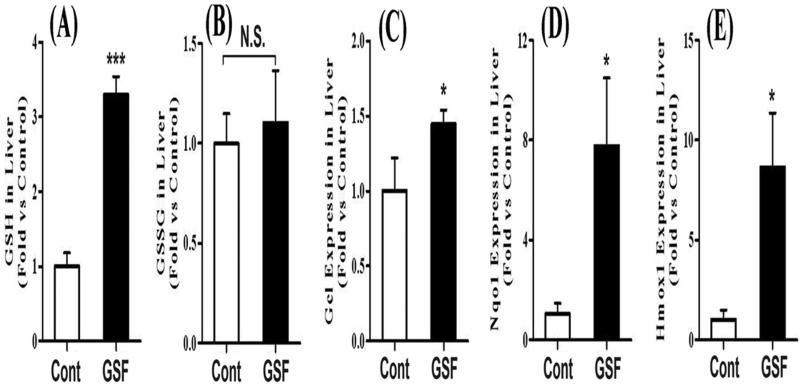
A and B, relative abundances of GSH and GSSG in the liver quantified by UPLC-QTOFMS. C-E, expression of Gcl, Nqo1 and Hmox1 in the liver. All data are expressed as means ± S.D. (n=4). The data in control group were set as 1. *P < 0.05; ***P < 0.005 vs control. N.S., not significant.
3.4. GSH and oxidized glutathione (GSSG) in the liver
GSH is the major endogenous antioxidant protecting against oxidative stress in cells [24, 25]. We expected GSH depletion and GSSG accumulation in the liver of mice treated with GSF, because PPIX causes oxidative stress [16, 26]. Surprisingly, the GSH level did not decrease in the liver of GSF-treated mice, but significantly increased (Fig. 4A). In addition, there are no significant differences in GSSG levels between the control and GSF-treated mice (Fig. 4B). We further examined the expression of glutamate-cysteine ligase (Gcl), the rate-limiting enzyme in GSH biosynthesis [27]. Gcl was significantly upregulated after GSF treatment (Fig. 4C). Gcl, NADH quinone oxidoreductase 1 (Nqo1) and heme oxygenase-1 (Hmox-1) are target genes of Nrf2, a transcription factor that regulates the expression of antioxidant proteins [28, 29]. We found that the expressions of Nqo1 and Hmox-1 were also significantly upregulated after GSF treatment (Fig. 4D and 4E), indicating that Nrf2 was triggered by GSF-induced liver injury.
3.5. Metabolism and bioactivation of GSF
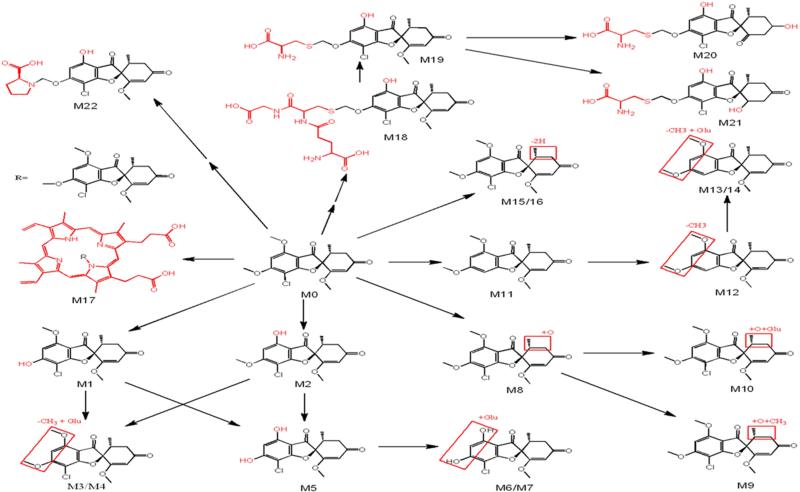
GSF metabolites were screened in liver, serum, urine and feces of mice treated with GSF. Overall, 22 metabolites were identified, including 9 previously reported metabolites [30, 31] and 13 novel metabolites (Table 2, Fig. 5). Among these GSF metabolites, one PPIX-conjugated (M17), one GSH-conjugated (M18), three cysteine-conjugated (M19-21) and one PRL-conjugated (M22) metabolites were of interest because they are associated with pathways of GSF bioactivation (Fig. 5).
Table 2. GSF metabolites in mice.
GSF metabolites were screened using a metabolomic approach.
| Metabolite | RT (min) | Observed m/z | Predicted formula | Mass error (ppm) | Identification | Sources |
|---|---|---|---|---|---|---|
| M0 | 6.43 | 353.0792 | C17H17ClO6 | 0.1 | Parent | L, S, F, U |
| M1 | 5.33 | 339.0636 | C16H15ClO6 | 0.2 | 6-O desmethyl GSF | L, S, F, U |
| M2 | 5.88 | 339.0640 | C16H15ClO6 | 1.5 | 4-O desmethyl GSF | L, S, F, U |
| M3 | 4.09 | 515.0953 | C22H23ClO12 | −0.6 | GSF - CH3 + Glu | L, S, U |
| M4 | 5.07 | 515.0958 | C22H23ClO12 | 0.4 | GSF - CH3 + Glu | L, S, U |
| M5 | 4.47 | 325.0483 | C15H13ClO6 | 1.3 | Didesmethyl GSF | L, S, F, U |
| M6 | 3.84 | 501.0804 | C21H21ClO12 | 0.8 | Didesmethyl GSF + Glu | S, U |
| M7 | 4.47 | 501.0806 | C21H21ClO12 | 1.2 | Didesmethyl GSF + Glu | S, U |
| M8 | 5.92 | 369.0742 | C17H17ClO7 | 0.9 | GSF + O | L, S, F, U |
| M9 | 6.64 | 383.0895 | C18H19ClO7 | −0.6 | GSF + O + CH3 | L, S |
| M10 | 5.08 | 545.1069 | C23H25ClO13 | 1.3 | GSF + O + Glu | L, S, F, U |
| M11 | 5.92 | 319.1180 | C17H18O6 | −0.6 | GSF - Cl | L, S, F, U |
| M12 | 4.44 | 305.1031 | C16H16O6 | 2.0 | GSF - Cl - CH3 | L, S, U |
| M13 | 3.51 | 481.1345 | C22H24O12 | −0.2 | GSF - Cl - CH3 + Glu | S, U |
| M14 | 4.16 | 481.1342 | C22H24O12 | −0.8 | GSF - Cl - CH3 + Glu | S, U |
| M15 | 5.81 | 351.0640 | C17H15ClO6 | 1.4 | GSF - 2H | L, S, F, U |
| M16 | 5.25 | 351.0641 | C17H15ClO6 | 1.7 | GSF - 2H | L, S, F, U |
| M17 | 11.93 | 913.3226 | C51H49ClN4O10 | 1.2 | GSF + PPIX | L, F |
| M18 | 4.45 | 644.1320 | C26H30ClN3O12S | 0.5 | GSF - CH3 + GSH | L, U |
| M19 | 4.57 | 458.0673 | C19H20ClNO8S | −0.7 | GSF - CH3 + Cys | L, S, F, U |
| M20 | 3.76 | 446.0676 | C18H20ClNO8S | 0.0 | GSF - 2CH3 + Cys + 2H | U, F |
| M21 | 4.40 | 446.0681 | C18H20ClNO8S | 1.1 | GSF - 2CH3 + Cys + 2H | U, F |
| M22 | 4.70 | 452.1100 | C21H22ClNO8 | −1.5 | GSF - CH3 + PRL | L, F, U |
Glu, Glucuronide; GSH, Glutathione; Cys, Cysteine; PRL, Proline; L, Liver; S, Serum; F, Feces; U, Urine.
Figure 5. Metabolic pathways of GSF in mice.
GSF metabolites in mice were screened using a metabolomic approach. All structures were determined based on the accurate mass measurement and MS/MS fragments.
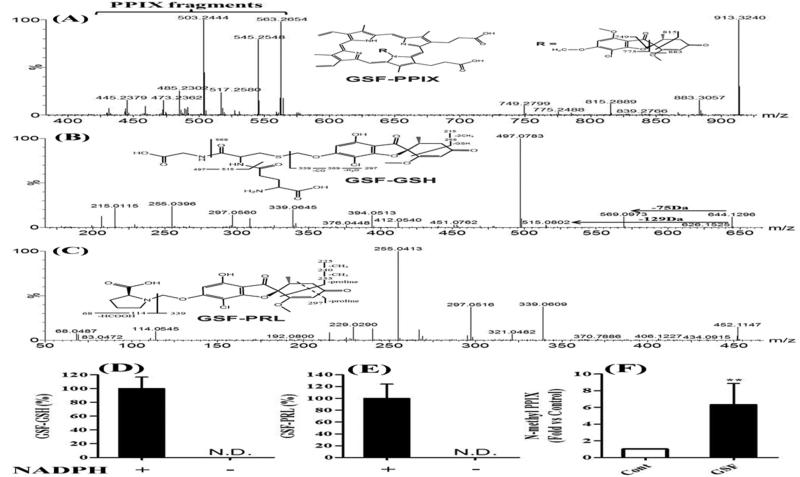
M17 is a GSF-PPIX adduct that has been proposed previously [32, 33]. The fragment ions of M17 perfectly matched the structure of GSF-PPIX (Fig. 6A). M18 is a novel GSF metabolite that had a [M + H]+ ion at m/z 644.1320 with a calculated formula as C26H30ClN3O12S. The MS/MS spectrum of M18 provided characteristic ions at m/z 569 and 515 (Fig. 6B), resulting from neutral loss of glycine (75 Da) and pyroglutamate (129 Da), respectively. The MS/MS spectrum of M18 confirmed that M18 is a GSH adduct. Compared to chemical composition of O-demethyl GSF (C16H15ClO6), the composition of M18 was consistent with the addition of a GSH moiety to the hydrated O-demethyl GSF. M22 is also a novel GSF metabolite that had a [M + H]+ ion at m/z 452.1100 with a calculated formula as C21H22ClNO8. The MS/MS spectrum of M22 provided two signature ions at m/z 68 and 114 (Fig. 6C), indicating that a PRL moiety was included in this metabolite.
Figure 6. GSF bioactivation pathways.
A-C, identification of GSF-PPIX, GSF-GSH and GSF- PRL by MS/MS analysis. D and E, NADPH-dependent formation of GSF-GSH and GSF-PRL in mouse liver microsomes. All data are expressed as means ± S.D. (n=3). N.D., not detected. F, accumulation of N-methyl PPIX in the liver of mice treated with GSF. All data are expressed as means ± S.D. (n=4). The data in control group was set as 1. **P < 0.01 vs control.
By using GSH or PRL as trapping reagents, we recapitulated the GSF-GSH and GSF-PRL adducts in the incubation of GSF with mouse liver microsomes (Fig. 6D and 6E). In addition, we confirmed that the formation of GSF-GSH and GSF-PRL adducts was NADPH-dependent, suggesting that these bioactivation pathways of GSF were mediated by CYP450s. Furthermore, we found that N-methyl PPIX increased 6.3-fold in the liver of mice treated with GSF (Fig. 6F). GSF-PPIX is the precursor of N-methyl PPIX [32, 34, 35], which can strongly inhibit FECH and result in PPIX accumulation.
4. Discussion
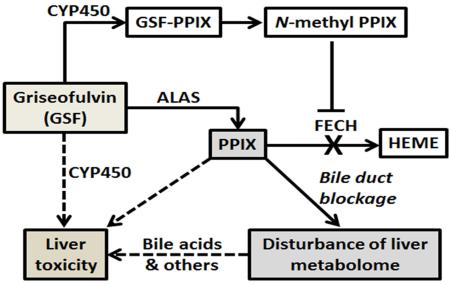
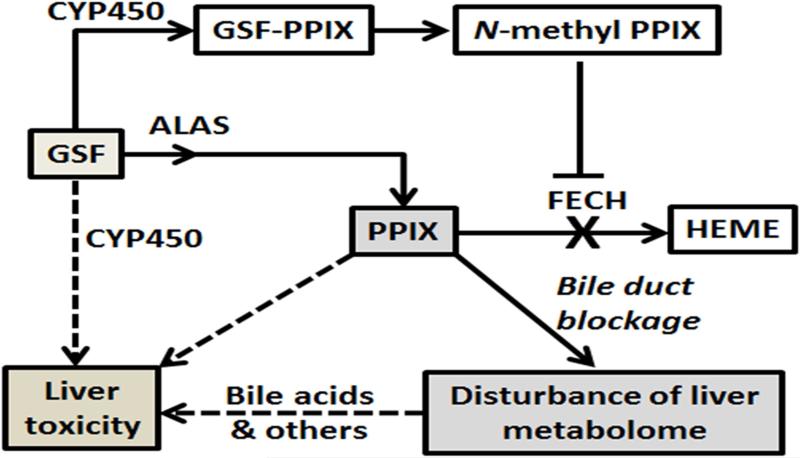
The current study profiled GSF-mediated alterations of liver metabolome in mice. We observed significant accumulations of PPIX, N-methyl PPIX, bile acids, and GSH in the liver of mice after GSF treatment. In addition, we reprofiled GSF metabolism in mice using a metabolomic approach and provided a full map of GSF metabolism. Our data suggest that GSF-induced liver injury initiated from GSF bioactivation, which produces GSF-PPIX adducts and N-methyl PPIX. N-methyl PPIX strongly inhibits the conversion of PPIX to heme and leads to PPIX accumulation [32, 34, 35]. Reactive metabolites of GSF and high levels of PPIX can directly cause liver damage [26, 36]. Furthermore, excessive amount of PPIX in the liver causes bile duct blockage and disturbs the homeostasis of xenobiotics and endobiotics, such as bile acids, which can in turn potentiate GSF-mediated liver injury (Fig. 7).
Figure 7. Proposed mechanisms of GSF-induced liver injury in mice.
CYP450-mediated GSF bioactivation leads to the formation of N-methyl PPIX, which inhibits the FECH-mediated conversion of PPIX to heme. Together with GSF-mediated induction of ALAS [9], the rate liming enzyme in heme synthesis, GSF treatment results in a significant accumulation of PPIX in the liver. PPIX and other endobiotics that are stuck in the liver because of PPIX-mediated bile duct blockage contribute to GSF-induced liver injury. Reactive metabolites generated by CYP450-mediated GSF bioactivation may also contribute to hepatotoxicity of GSF.
The current study extended our knowledge of GSF metabolism and mechanism of GSF-induced liver injury. Multiple GSF metabolites are results from GSF bioactivation, such as the metabolites conjugated with PPIX, GSH, cysteine and PRL. The GSF-PPIX adduct might be generated through a carbon-centered radical intermediate formed by CYP450-mediated O-demethylation of GSF, which then reacts with one of the pyrrole nitrogen atoms in PPIX to produce GSF-PPIX adduct. Similar to nitrogen atoms in the pyrrole ring of PPIX, GSH and PRL contain a sulfur atom or a nitrogen atom with lone electron pair, which can also react with the carbon-centered radical intermediate of GSF. Reactive metabolites generated from bioactivation can bind to cellular proteins and lead to hepatotoxicity [36]. Therefore, bioactivation of GSF may directly contribute to GSF-induced liver injury. Moreover, bioactivation of GSF results in the formation of N-methyl PPIX through GSF-PPIX, which causes PPIX accumulation in the liver and potentiates liver damage.
PPIX accumulation in the liver can directly and indirectly potentiate GSF-induced liver injury. PPIX can directly cause cell damage through production of reactive oxygen species, activation of c-Jun N-terminal protein kinase and mitochondrial permeability transition pore opening [26]. More importantly, PPIX can indirectly cause liver damage through bile duct blockage. PPIX excretion is dependent on the biliary system [37]. However, PPIX is highly hydrophobic, which will precipitate in bile when in excess and leads to bile duct blockage [37]. Excretion pathways through the biliary system are critical for maintaining the liver homeostasis of endobiotics and xenobiotics, especially for metabolites >500 Da [38-40]. Bile acids are synthesized in the liver and mainly excreted through bile ducts [20]. In the mice treated with GSF, a high level of bile acids was observed in the liver and it was not due to synthesis pathways (Fig. 3), suggesting the bile duct obstruction occurred. Bile acids have many physiological functions that are dependent on their chemical nature or through the signaling pathways of farnesoid X receptor and G-protein-coupled receptor [41-43]. However, a high level of bile acids in the body causes liver injury and pruritus [44-46]. Since the liver injury in EPP patients is similar to GSF hepatotoxicity and EPP patients also suffer from the skin damages [15, 47, 48], future studies are warranted to investigate the impact of bile acids on liver injury and skin damage in EPP patients. In addition to bile acids, PPIX-mediated bile duct blockage will definitely affect the homeostasis of other metabolites excreted through the biliary system. Therefore, EPP patients should be cautious to the drugs and diet supplements that are dependent on biliary excretion.
In summary, the present study provided a metabolomic perspective of GSF-induced liver injury in mice. Our data suggest that GSF hepatotoxicity may be caused by reactive metabolites of GSF, accumulation of PPIX, and endobiotics that are accumulated in the liver because of PPIX-mediated bile duct blockage (Fig. 7).
Acknowledgments
This work was supported in part by the National Institute of Diabetes and Digestive and Kidney Diseases [DK090305]. We thank Jie Lu for technical assistance.
Footnotes
Publisher's Disclaimer: This is a PDF file of an unedited manuscript that has been accepted for publication. As a service to our customers we are providing this early version of the manuscript. The manuscript will undergo copyediting, typesetting, and review of the resulting proof before it is published in its final citable form. Please note that during the production process errors may be discovered which could affect the content, and all legal disclaimers that apply to the journal pertain.
References
- 1.Lambert DR, Siegle RJ, Camisa C. Griseofulvin and ketoconazole in the treatment of dermatophyte infections. International journal of dermatology. 1989;28:300–4. doi: 10.1111/j.1365-4362.1989.tb01348.x. [DOI] [PubMed] [Google Scholar]
- 2.Araujo OE, Flowers FP, King MM. Griseofulvin: a new look at an old drug. DICP : the annals of pharmacotherapy. 1990;24:851–4. doi: 10.1177/106002809002400912. [DOI] [PubMed] [Google Scholar]
- 3.Perfect JR, Lindsay MH, Drew RH. Adverse drug reactions to systemic antifungals. Prevention and management. Drug safety. 1992;7:323–63. doi: 10.2165/00002018-199207050-00003. [DOI] [PubMed] [Google Scholar]
- 4.Bonkovsky HL, Guo JT, Hou W, Li T, Narang T, Thapar M. Porphyrin and heme metabolism and the porphyrias. Comprehensive Physiology. 2013;3:365–401. doi: 10.1002/cphy.c120006. [DOI] [PubMed] [Google Scholar]
- 5.Smith AG, De Matteis F. Drugs and the hepatic porphyrias. Clinics in haematology. 1980;9:399–425. [PubMed] [Google Scholar]
- 6.Knasmuller S, Parzefall W, Helma C, Kassie F, Ecker S, Schulte-Hermann R. Toxic effects of griseofulvin: disease models, mechanisms, and risk assessment. Critical reviews in toxicology. 1997;27:495–537. doi: 10.3109/10408449709078444. [DOI] [PubMed] [Google Scholar]
- 7.Matilla A, Molland EA. A light and electron microscopic study of the liver in case of erythrohepatic protoporphyria and in griseofulvin-induced porphyria in mice. J Clin Pathol. 1974;27:698–709. doi: 10.1136/jcp.27.9.698. [DOI] [PMC free article] [PubMed] [Google Scholar]
- 8.Gschnait F, Konrad K, Honigsmann H, Denk H, Wolff K. Mouse model for protoporphyria. I. The liver and hepatic protoporphyrin crystals. J Invest Dermatol. 1975;65:290–9. doi: 10.1111/1523-1747.ep12598357. [DOI] [PubMed] [Google Scholar]
- 9.De Matteis F. The effects of drugs on the activities of 5-aminolaevulinate synthetase and other enzymes in the pathway of haem biosynthesis. The Biochemical journal. 1972;130:52P–3P. doi: 10.1042/bj1300052p. [DOI] [PMC free article] [PubMed] [Google Scholar]
- 10.De Matteis F, Gibbs AH. Drug-induced conversion of liver haem into modified porphyrins. Evidence for two classes of products. The Biochemical journal. 1980;187:285–8. doi: 10.1042/bj1870285. [DOI] [PMC free article] [PubMed] [Google Scholar]
- 11.Becker DM, Viljoen JD, Katz J, Kramer S. Reduced ferrochelatase activity: a defect common to porphyria variegata and protoporphyria. British journal of haematology. 1977;36:171–9. doi: 10.1111/j.1365-2141.1977.tb00637.x. [DOI] [PubMed] [Google Scholar]
- 12.Kramer S, Viljoen JD. Erythropoietic protoporphyria: evidence that it is due to a variant ferrochelatase. The International journal of biochemistry. 1980;12:925–30. doi: 10.1016/0020-711x(80)90186-x. [DOI] [PubMed] [Google Scholar]
- 13.Wessely Z, Shapiro SH, Klavins JV. Light and electron microscopy of hepatocellular changes in griseofulvin fed mice. Particular reference to Mallory bodies. Annals of clinical and laboratory science. 1979;9:24–36. [PubMed] [Google Scholar]
- 14.Denk H, Eckerstorfer R, Gschnait F, Konrad K, Wolff K. Experimental induction of hepatocellular hyalin (Mallory bodies) in mice by griseofulvin treatment. 1. Light microscopic observation. Lab Invest. 1976;35:377–82. [PubMed] [Google Scholar]
- 15.Yokoo H, Craig RM, Harwood TR, Cochrane C. Griseofulvin-induced cholestasis in Swiss albino mice. Gastroenterology. 1979;77:1082–7. [PubMed] [Google Scholar]
- 16.Martinez Mdel C, Afonso SG, Meiss RP, Buzaleh AM, Batlle A. Hepatic damage and oxidative stress induced by Griseofulvin in mice. Cellular and molecular biology. 2009;55:127–39. [PubMed] [Google Scholar]
- 17.Gant TW, Baus PR, Clothier B, Riley J, Davies R, Judah DJ, et al. Gene expression profiles associated with inflammation, fibrosis, and cholestasis in mouse liver after griseofulvin. EHP Toxicogenomics. 2003;111:37–43. [PubMed] [Google Scholar]
- 18.Meerman L, Koopen NR, Bloks V, Van Goor H, Havinga R, Wolthers BG, et al. Biliary fibrosis associated with altered bile composition in a mouse model of erythropoietic protoporphyria. Gastroenterology. 1999;117:696–705. doi: 10.1016/s0016-5085(99)70464-6. [DOI] [PubMed] [Google Scholar]
- 19.Thomas C, Pellicciari R, Pruzanski M, Auwerx J, Schoonjans K. Targeting bile-acid signalling for metabolic diseases. Nature reviews Drug discovery. 2008;7:678–93. doi: 10.1038/nrd2619. [DOI] [PubMed] [Google Scholar]
- 20.Li T, Chiang JY. Bile acid signaling in metabolic disease and drug therapy. Pharmacological reviews. 2014;66:948–83. doi: 10.1124/pr.113.008201. [DOI] [PMC free article] [PubMed] [Google Scholar]
- 21.Jedlitschky G, Leier I, Buchholz U, Hummel-Eisenbeiss J, Burchell B, Keppler D. ATP-dependent transport of bilirubin glucuronides by the multidrug resistance protein MRP1 and its hepatocyte canalicular isoform MRP2. The Biochemical journal. 1997;327(Pt 1):305–10. doi: 10.1042/bj3270305. [DOI] [PMC free article] [PubMed] [Google Scholar]
- 22.Kosters A, Karpen SJ. Bile acid transporters in health and disease. Xenobiotica; the fate of foreign compounds in biological systems. 2008;38:1043–71. doi: 10.1080/00498250802040584. [DOI] [PMC free article] [PubMed] [Google Scholar]
- 23.Alrefai WA, Gill RK. Bile acid transporters: structure, function, regulation and pathophysiological implications. Pharmaceutical research. 2007;24:1803–23. doi: 10.1007/s11095-007-9289-1. [DOI] [PubMed] [Google Scholar]
- 24.Puglia CD, Powell SR. Inhibition of cellular antioxidants: a possible mechanism of toxic cell injury. Environmental health perspectives. 1984;57:307–11. doi: 10.1289/ehp.8457307. [DOI] [PMC free article] [PubMed] [Google Scholar]
- 25.Godin DV, Wohaieb SA. Nutritional deficiency, starvation, and tissue antioxidant status. Free radical biology & medicine. 1988;5:165–76. doi: 10.1016/0891-5849(88)90079-2. [DOI] [PubMed] [Google Scholar]
- 26.Xu H, Sun Y, Zhang Y, Wang W, Dan J, Yao J, et al. Protoporphyrin IX induces a necrotic cell death in human THP-1 macrophages through activation of reactive oxygen species/c-Jun N-terminal protein kinase pathway and opening of mitochondrial permeability transition pore. Cellular physiology and biochemistry : international journal of experimental cellular physiology, biochemistry, and pharmacology. 2014;34:1835–48. doi: 10.1159/000366383. [DOI] [PubMed] [Google Scholar]
- 27.Franklin CC, Backos DS, Mohar I, White CC, Forman HJ, Kavanagh TJ. Structure, function, and post-translational regulation of the catalytic and modifier subunits of glutamate cysteine ligase. Molecular aspects of medicine. 2009;30:86–98. doi: 10.1016/j.mam.2008.08.009. [DOI] [PMC free article] [PubMed] [Google Scholar]
- 28.Jaiswal AK. Nrf2 signaling in coordinated activation of antioxidant gene expression. Free radical biology & medicine. 2004;36:1199–207. doi: 10.1016/j.freeradbiomed.2004.02.074. [DOI] [PubMed] [Google Scholar]
- 29.Lee JM, Johnson JA. An important role of Nrf2-ARE pathway in the cellular defense mechanism. Journal of biochemistry and molecular biology. 2004;37:139–43. doi: 10.5483/bmbrep.2004.37.2.139. [DOI] [PubMed] [Google Scholar]
- 30.Chang RL, Zampaglione N, Lin C. Correlation of 14C-griseofulvin metabolism in rat liver microsomes, isolated perfused rat livers, and in rats with bile duct cannulas. Drug metabolism and disposition: the biological fate of chemicals. 1975;3:487–93. [PubMed] [Google Scholar]
- 31.Lin CC, Magat J, Chang R, McGlotten J, Symchowicz S. Absorption, metabolism and excretion of 14C-griseofulvin in man. The Journal of pharmacology and experimental therapeutics. 1973;187:415–22. [PubMed] [Google Scholar]
- 32.Holley AE, Frater Y, Gibbs AH, De Matteis F, Lamb JH, Farmer PB, et al. Isolation of two N-monosubstituted protoporphyrins, bearing either the whole drug or a methyl group on the pyrrole nitrogen atom, from liver of mice given griseofulvin. The Biochemical journal. 1991;274(Pt 3):843–8. doi: 10.1042/bj2740843. [DOI] [PMC free article] [PubMed] [Google Scholar]
- 33.Bellingham RM, Gibbs AH, de Matteis F, Lian LY, Roberts GC. Determination of the structure of an N-substituted protoporphyrin isolated from the livers of griseofulvin-fed mice. The Biochemical journal. 1995;307(Pt 2):505–12. doi: 10.1042/bj3070505. [DOI] [PMC free article] [PubMed] [Google Scholar]
- 34.Ortiz de Montellano PR, Kunze KL, Cole SP, Marks GS. Differential inhibition of hepatic ferrochelatase by the isomers of N-ethylprotoporphyrin IX. Biochem Biophys Res Commun. 1981;103:581–6. doi: 10.1016/0006-291x(81)90491-5. [DOI] [PubMed] [Google Scholar]
- 35.Dailey HA, Fleming JE. Bovine ferrochelatase. Kinetic analysis of inhibition by N-methylprotoporphyrin, manganese, and heme. The Journal of biological chemistry. 1983;258:11453–9. [PubMed] [Google Scholar]
- 36.Stepan AF, Walker DP, Bauman J, Price DA, Baillie TA, Kalgutkar AS, et al. Structural alert/reactive metabolite concept as applied in medicinal chemistry to mitigate the risk of idiosyncratic drug toxicity: a perspective based on the critical examination of trends in the top 200 drugs marketed in the United States. Chem Res Toxicol. 2011;24:1345–410. doi: 10.1021/tx200168d. [DOI] [PubMed] [Google Scholar]
- 37.Cox TM, Alexander GJ, Sarkany RP. Protoporphyria. Seminars in liver disease. 1998;18:85–93. doi: 10.1055/s-2007-1007144. [DOI] [PubMed] [Google Scholar]
- 38.Pfeifer ND, Hardwick RN, Brouwer KL. Role of hepatic efflux transporters in regulating systemic and hepatocyte exposure to xenobiotics. Annual review of pharmacology and toxicology. 2014;54:509–35. doi: 10.1146/annurev-pharmtox-011613-140021. [DOI] [PubMed] [Google Scholar]
- 39.Kock K, Brouwer KL. A perspective on efflux transport proteins in the liver. Clinical pharmacology and therapeutics. 2012;92:599–612. doi: 10.1038/clpt.2012.79. [DOI] [PMC free article] [PubMed] [Google Scholar]
- 40.Schuetz JD, Swaan PW, Tweedie DJ. The role of transporters in toxicity and disease. Drug metabolism and disposition: the biological fate of chemicals. 2014;42:541–5. doi: 10.1124/dmd.114.057539. [DOI] [PMC free article] [PubMed] [Google Scholar]
- 41.Schaap FG, Trauner M, Jansen PL. Bile acid receptors as targets for drug development. Nature reviews Gastroenterology & hepatology. 2014;11:55–67. doi: 10.1038/nrgastro.2013.151. [DOI] [PubMed] [Google Scholar]
- 42.Zhu Y, Li F, Guo GL. Tissue-specific function of farnesoid X receptor in liver and intestine. Pharmacological research : the official journal of the Italian Pharmacological Society. 2011;63:259–65. doi: 10.1016/j.phrs.2010.12.018. [DOI] [PMC free article] [PubMed] [Google Scholar]
- 43.Duboc H, Tache Y, Hofmann AF. The bile acid TGR5 membrane receptor: from basic research to clinical application. Digestive and liver disease : official journal of the Italian Society of Gastroenterology and the Italian Association for the Study of the Liver. 2014;46:302–12. doi: 10.1016/j.dld.2013.10.021. [DOI] [PMC free article] [PubMed] [Google Scholar]
- 44.O'Brien KM, Allen KM, Rockwell CE, Towery K, Luyendyk JP, Copple BL. IL-17A synergistically enhances bile acid-induced inflammation during obstructive cholestasis. Am J Pathol. 2013;183:1498–507. doi: 10.1016/j.ajpath.2013.07.019. [DOI] [PMC free article] [PubMed] [Google Scholar]
- 45.Woolbright BL, Jaeschke H. Novel insight into mechanisms of cholestatic liver injury. World journal of gastroenterology : WJG. 2012;18:4985–93. doi: 10.3748/wjg.v18.i36.4985. [DOI] [PMC free article] [PubMed] [Google Scholar]
- 46.Higuchi H, Gores GJ. Bile acid regulation of hepatic physiology: IV. Bile acids and death receptors. American journal of physiology Gastrointestinal and liver physiology. 2003;284:G734–8. doi: 10.1152/ajpgi.00491.2002. [DOI] [PubMed] [Google Scholar]
- 47.Ghent CN, Bloomer JR, Klatskin G. Elevations in skin tissue levels of bile acids in human cholestasis: relation to serum levels and topruritus. Gastroenterology. 1977;73:1125–30. [PubMed] [Google Scholar]
- 48.Anstey AV, Hift RJ. Liver disease in erythropoietic protoporphyria: insights and implications for management. Gut. 2007;56:1009–18. doi: 10.1136/gut.2006.097576. [DOI] [PMC free article] [PubMed] [Google Scholar]


