Abstract
The Breast Cancer Metastasis Suppressor 1 (BRMS1) is a nucleo-cytoplasmic protein that suppresses cancer metastasis without affecting the growth of the primary tumor. Previous work has shown that it decreases the expression of protein mediators involved in chemoresistance. This study measured the biomechanical and biochemical changes in BRMS1 expression and the responses of BRMS1 to drug treatments on cancer cells in vitro. The results show that BRMS1 expression affects biomechanical properties by decreasing the Young’s modulus and adhesion force of breast cancer cells after doxorubicin (DOX) exposure. Raman spectral bands corresponding to DNA/RNA, lipids and proteins were similar for all cells after DOX treatment. The expression of cytokines were similar for cancer cells after DOX exposure, although BRMS1 expression had different effects on the secretion of cytokines for breast cancer cells. The absence of significant changes on apoptosis, reactive oxygen species (ROS) expression and cell viability after BRMS1 expression shows that BRMS1 has little effect on cellular chemoresistance. Analyzing cancer protein expression is critical in evaluating therapeutics. Our study may provide evidence of the benefit of metastatic suppressor expression before chemotherapy.
Introduction
The most deadly feature of cancer cells is their metastatic property, which is controlled by metastasis suppressors. Clinical studies have reported that Breast Cancer Metastasis Suppressor 1 (BRMS1) affects disease progression and prognosis.1,2 BRMS1 is part of an expanding class of proteins called metastasis suppressors that stifle cancer metastasis without affecting the primary tumor growth.3 A loss of BRMS1 is correlated with poor prognosis among cancer patients.4–6 BRMS1 decreases the expression and activity of numerous mediators of chemoresistance such as NF-κB activity7 and AKT phosphorylation8 in several cancer models.9–11 Some reports studied BRMS1’s effect on cellular biophysical and biocomponent differences,12,13 but little research evaluates these biophysical and biochemical changes in response to drug treatments in the presence of BRMS1. Thus, we compared the responses of cancer cells with and without BRMS1 to a therapeutic agent using multiple approaches.
Atomic force microscopy (AFM) is a scanning analytical technique that can measure the biomechanical and topographical characteristics of a sample at nanoscale resolution.14,15 Attractive or repulsive forces between tip and sample surface will cause a positive or negative bending of the cantilever. This alteration is detected by a laser, and reflected by a position photodetector.15,16 AFM has been used to detect biomechanical differences between human lung adenocarcinoma epithelial cell (A549) and human primary small airway epithelial cell (SAECs) after exposure to anticancer drugs.17 Therefore, AFM was selected to study the biomechanical properties of cells.
Raman microspectroscopy (RM) is a spectroscopic technique based on inelastic scattering when a laser impinges upon a molecule, interacting with the electron cloud and the bonds of that molecule. RM can measure molecular vibrational compositions used to identify the biochemical information of living cells.18 RM is used to study cells in near physiological conditions, without labelling or fixation,19 and has been applied to investigate the interaction between pharmaceuticals and living cells in toxicology studies.20 Thus, RM is a suitable technique to collect the biochemical information of cells.
Apoptosis, reactive oxygen species (ROS) expression and cell viability tests were also applied to detect BRMS1’s effect on cellular responses. Apoptosis is a universal and efficient suicide pathway in cells, and it might enhance a death cascade by a drug.21 ROS, generated during cellular metabolism, are oxygen-containing molecules that can damage DNA, proteins, and lipids.22 The viability of cancer cells will change according to the interaction conditions with anticancer drugs. Comparing the results of apoptosis, ROS expression and cell viability between parental and BRMS1-expressing cells through DOX exposure can reflect BRMS1 effect on chemosensitivity. In this work, using five different cell lines: metastatic MDA-MB-231 (231), metastatic MDA-MB-435 (435), non-metastatic MDA-MB-231/BRMS1 (231/BRMS1), non-metastatic MDA-MB-435/BRMS1 (435/BRMS1) and A549, we investigated the biomechanical and biochemical changes induced on BRMS1 expression when treated with the chemotherapeutic agent DOX. Knowledge of these differences could improve the understanding of metastasis suppressors and be of significant clinical benefit in human cancer therapy.
Experimental
Cell culture
To express BRMS1 cDNA, 231 and 435 cells were transfected with a lentiviral vector construct under a cytomegalovirus promoter. 231, 231/BRMS1, 435 and 435/BRMS1 cells were cultured in a 1 : 1 mixture of Dulbecco’s-modified eagle’s medium (DMEM) and Ham’s F-12 medium supplemented with 5% fetal bovine serum (Thermo Fisher Scientific). A549 cells (ATCC) were cultured in F-12k medium containing 10% fetal bovine serum at 37 °C with 5% CO2 in a humidified atmosphere. All cells were passaged at 80–90% confluency using 0.5% trypsin–EDTA solution (Thermo Fisher Scientific).
Drug preparation and treatment
DOX was dissolved in deionized water. Stock solutions of DOX (8 μM) were stored at 4 °C according to instructions (Sigma-Aldrich). For final drug concentrations, solutions were serially diluted. The dose of DOX treatment for A549 is 71 nM, referring to the study of Kashkin et al.23 Meantime, the IC50 concentration of DOX corresponding to 231, 231/BRMS1, 435, and 435/BRMS1 cell is 49 nM, 71 nM, 122 nM, and 114 nM, respectively, referring to the research from Welch et al.24
Immunofluorescence for detection of BRMS1 localization
435 and 435/BRMS1 cells were plated on cover slips (Thermo Fisher Scientific), washed with cold PBS (Thermo Fisher Scientific), fixed with 4% para-formaldehyde (Electron Microscopy Sciences) and permeabilized with 0.2% Triton X-100 in PBS. After blocking with 5% bovine serum albumin (BSA) in PBS for one hour, cells were incubated with anti-BRMS1 monoclonal antibody (1 : 100 dilution) in 5% BSA solution overnight at 4 °C. After washing thrice with PBS, Alexa Fluor 488-labeled anti-mouse IgG (1 : 400 dilution, Molecular Probes) was added and incubated at room temperature for 1 hour. After washing the cells thrice with PBS, the cover slips were mounted (Vector laboratories Inc) and observed under an Olympus IX-70 inverted fluorescence microscope.
Raman spectroscopy
To avoid high near infrared (IR) Raman scattering and fluorescence background, magnesium fluoride (MgF2, United Crystals Co.) substrates were used. The cells were seeded on MgF2 in culture medium overnight and treated with corresponding IC50 concentration of DOX. Before measurements, cells were rinsed thrice in PBS, and maintained in EBSS for Raman spectra collection (Thermo Fisher Scientific).
Before experiments began, LIVE/DEAD viability experiments were conducted to verify if the cells were alive on MgF2 as shown in Fig. S1.† Raman spectra were recorded using a Renishaw inVia Raman spectrometer equipped with a 63 × 0.9NA water immersion objective (Leica) and a 300 mW 785 nm near-IR laser. Spectra were collected in static mode for 1 accumulation at 10 s laser exposure over a wavenumber range of 600–1800 cm−1. Eight cells per treatment were analyzed with micro-Raman spectroscopy. Cosmic rays of Raman spectra were removed by Renishaw WiRE 3.3 software.
Atomic force microscopy
Cells were detected by a contact mode PicoPlus AFM controlled by Picoview software (Agilent Technologies). Biomechanical properties were calculated from in situ force–distance curve measurements in medium at room temperature. The radius of silicon nitride tips was 20 nm. Its spring constant was calibrated to 0.10–0.11 N m−1 by Thermo K Calibration (Agilent Technologies) and its corresponding deflection sensitivities were 45–50 nm V−1. More than 10 cells were detected, collecting at least 15 force curves on the central area of different cells to avoid spurious detections.25,26 Scanning Probe Image Processor (SPIP) software (Image Metrology) was used to calculate Young’s modulus and adhesion force by fitting the Sneddon variation of Hertz model.27–29 The half cone-opening angle of tip was 36°, and cellular Poisson’s ratio was 0.5. The detection was accomplished within 2 hours (h) to approximate physiological conditions.
Ecell = 4F(ΔZ)(1 − ηcell2)/3(ΔZ1.5)tan θ, where Ecell: Young’s modulus; F: loading force; ηcell: Poisson ratio; ΔZ: indentation; θ: tip half cone opening angle.
Cytokine and chemokine analysis
A total of 25 cytokines and chemokines were selected to analyze their expression. The samples were centrifuged at 250 × g for 5 min, the supernatant was collected and stored at −80 °C prior to the assay. The samples were tested as single batches on Q-Plex Array™ kits (Quansys Biosciences).
ROS and apoptosis assay
The ROS expression was detected by a Muse™ Oxidative Stress kit (EMD Millipore Co.), and apoptosis level was determined by a Muse™ Annexin V and Dead Cell kit (EMD Millipore Co.). Cells were cultured in 6-well plates to about 70% confluence, then the medium was replaced with DOX containing medium. Every treatment had three replicates. At each time point, the cells were collected and analyzed using a Muse Cell Analyzer (EMD Millipore Co.).
Cell viability assay
Cell viability was analyzed using LIVE/DEAD Viability/Cytotoxicity Assay Kit (Thermo Fisher Scientific). Calcein AM is retained within live cells producing green fluorescence; whereas, EthD-1 enters damaged membrane and binds to nucleic acids, producing red fluorescence. Every treatment has three replicates. After staining, cells were imaged using fluorescence microscope with DP30BW CCD camera (Olympus IX71) to analyze the relative proportion of live/dead cells.
Statistical analysis
Data are presented as mean ± standard deviation. Differences were considered significant at p < 0.05. The OriginPro 9 software (OriginLab Corp.) was used for one-way ANOVA and figure plot.
Results and discussion
BRMS1 is localized mainly in the nucleus with some expression observed in the cytosol
To assess the biophysical and biochemical differences of breast cancer cells with and without BRMS1, it is important to pinpoint the distribution of BRMS1. Fig. 1 shows the immunofluorescence images for 435 and 435/BRMS1 cells. BRMS1 is highly expressed (green) in (Fig. 1B) 435/BRMS1 cells compared to 435 cells (Fig. 1A). Further, it is observed that BRMS1 is mainly distributed within cellular nucleus, which is consistent with previous research.30
Fig. 1.
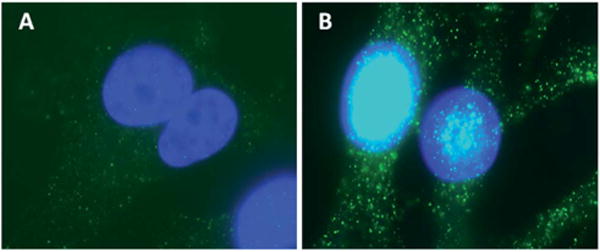
BRMS1 mainly distributed around the nucleus. Immunofluorescence images of (A) 435 and (B) 435/BRMS1 cells stained with anti-BRMS1 antibody (blue: nucleus; green: expression of BRMS1).
Immunolocalization experiments using BRMS1 antibody confirmed the high expression and localization of BRMS1 predominantly to the nucleus of MDA-MB-435/BRMS1 cells. BRMS1 is an important part of the SIN3–HDAC complexes, critical for deacylating histone proteins and condensing the chromatin machinery leading to reduced transcription of several genes.31,32 BRMS1 was also found, albeit at lower levels, in the cytosol, which is consistent with earlier reports categorizing BRMS1 as a nucleo-cytoplasmic protein.33
BRMS1 affects the biomechanical properties and the response of cancer cells to DOX
AFM was employed to quantify the biomechanical properties, and Fig. S2† lists the histograms of Young’s modulus and adhesion force of cells with and without DOX treatment. The results in Fig. 2 show that both Young’s modulus (Fig. 2A) and adhesion forces (Fig. 2B) of A549, 231 and 435 (metastatic cancer cells) cells increased in response to 4 h DOX exposure. However, both biomechanical properties of 231/BRMS1 and 435/BRMS1 moderately decreased. For 231 and 231/BRMS1 cells before DOX treatment, the differences in the Young’s modulus and adhesion force corresponded to 7.5 kPa and 0.30 nN respectively. While for the 435 and 435/BRMS1 cells, the differences were 11.6 kPa and 0.29 nN respectively. However, after incubation with DOX, both the Young’s modulus and adhesion forces decreased for both cell lines. The difference amounts to 2.8 kPa and 0.04 nN for 231 and 231/BRMS1 and, 2.6 kPa and 0.07 nN for 435 and 435/BRMS1. These results suggest that BRMS1 expression affects the biomechanical properties of cancer cells and also induces a differential response when interacting with DOX.
Fig. 2.
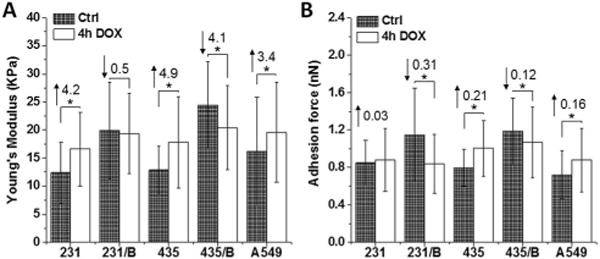
BRMS1 expression alters the biomechanical properties and the response of cancer cells to DOX. (A) Young’s modulus and (B) adhesion force of 231, 231/BRMS1 (231/B), 435, 435/BRMS1 (435/B) and A549 cells without DOX treatment and treated with 4 h DOX group. Error bars are standard deviation of the mean (*p < 0.05; B represents BRMS1 in the figure; the number above each column is the difference between the control and 4 h DOX group; upward arrows mean an increase and downward arrows mean a decrease).
It is reported that in BRMS1-expressing cells, the activation of focal adhesion kinase and β1 integrin were reduced, leading to a decrease level of cellular adhesion and cytoskeletal reorganization.34 Our results demonstrate that BRMS1 could affect cellular biomechanical properties. The Young’s moduli of metastatic cancer cells (231, 435) are lower than that of non-metastatic cells (231/BRMS1, 435/BRMS1), which is consistent with reported studies.26,35–37 This distinction in cell elasticity is attributed to altered cytoskeletal organization, in particular the intermediate filament and actin filament structures, which have been identified as the main determinants of cell elasticity.38 Furthermore, interaction with DOX results in an increase in Young’s modulus for cancer cells; while decreasing in BRMS1 expressing cells. Metastatic cancer cells (231, 435) possessed lower adhesion forces than BRMS1 expressing non-metastatic cells. Additionally, interaction with DOX led to increased cell adhesion in metastatic A549, 231 and 435 cells, whereas a decrease was seen in non-metastatic 231/BRMS1 and 435/BRMS1 cells. The measured adhesion force is associated with cell-surface biomolecules.39 Alterations in cell adhesion after DOX treatment may be caused by cellular response to chemical stimulus leading to the variation of cell-surface macromolecules.
BRMS1 has negligible effect on the biochemical changes of cancer cells to DOX
To compare the differences in biochemical information, Raman spectra of cells with and without DOX treatment were collected. A representative Raman video images of 231, 231/BRMS1, 435, 435/BRMS1 and A549 are shown in Fig. 3A–E. The average Raman spectra were collected from over 24 spectra for each individual group, and all those spectra exhibited similar spectral peaks.
Fig. 3.
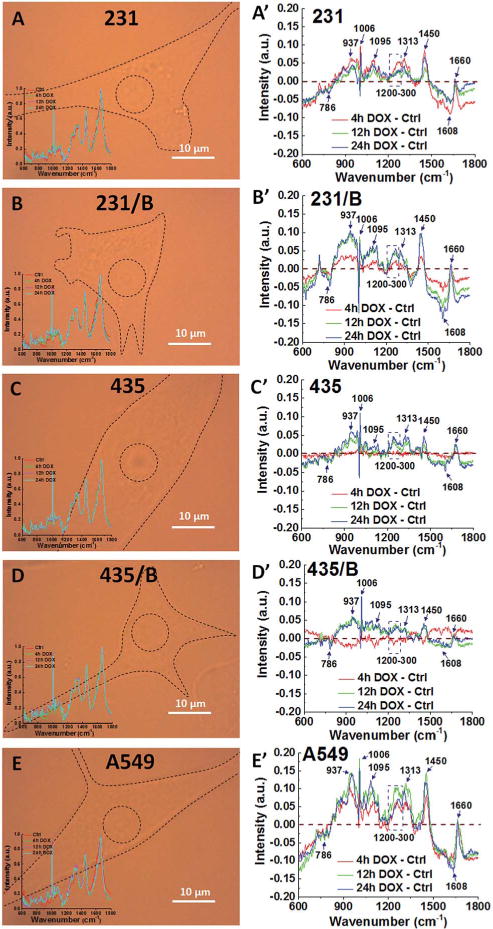
Similar Raman peaks corresponding to DNA/RNA, lipids and proteins between cell lines have noticeable changes for all cancer cells after DOX treatment. The representative Raman video images of (A) 231, (B) 231/BRMS1, (C) 435, (D) 435/BRMS1 and (E) A549 (inset in each image is the average Raman spectra from nucleus of control and treated with DOX for 4 h, 12 h and 24 h). Spectra difference between different time (4 h, 12 h and 24 h) of DOX treated cells and control cells of (A′) 231, (B′) 231/BRMS1, (C′) 435, (D′) 435/BRMS1 and (E′) A549 (B represents as BRMS1 in the figure).
To identify the spectral differences, the spectrum of the corresponding control group was subtracted from the average Raman spectra of different DOX groups (4 h, 12 h and 24 h) as shown in Fig. 3A′–E′. Raman peaks at 786 cm−1, 937 cm−1, 1006 cm−1, 1095 cm−1, 1313 cm−1, 1450 cm−1, 1608 cm−1 and peak range from 1200–1300 cm−1 show significant differences when BRMS1 is expressed. The peak at 786 cm−1 arises from pyrimidine ring breathing mode. Raman peak at 937 cm−1 is assigned to a-helix and C–C stretching in the protein backbone. The peak at 1006 cm−1 belongs to the symmetric ring breathing mode of phenylalanine (Phe). Raman peak at 1095 cm−1 can be assigned to lipid. The peak at 1313 cm−1 corresponds to guanine (G). The bands at 1450 cm−1 can be assigned to the CH2 deformation (def) of lipid whereas the 1608 cm−1 corresponds to tryptophan (Tyr). The spectral region of 1200–1300 cm−1 belongs to amide III. Table S1† lists the other major cellular biopolymers, i.e. nucleus acids, proteins, lipids and carbohydrates.
The Raman intensities were extracted as shown in Fig. 4. Most of the peak intensities from BRMS1-expressing cells are larger than parental cells (Fig. 4A–G). Meanwhile, these spectral intensities displayed a similar trend from control to 24 h DOX group.
Fig. 4.
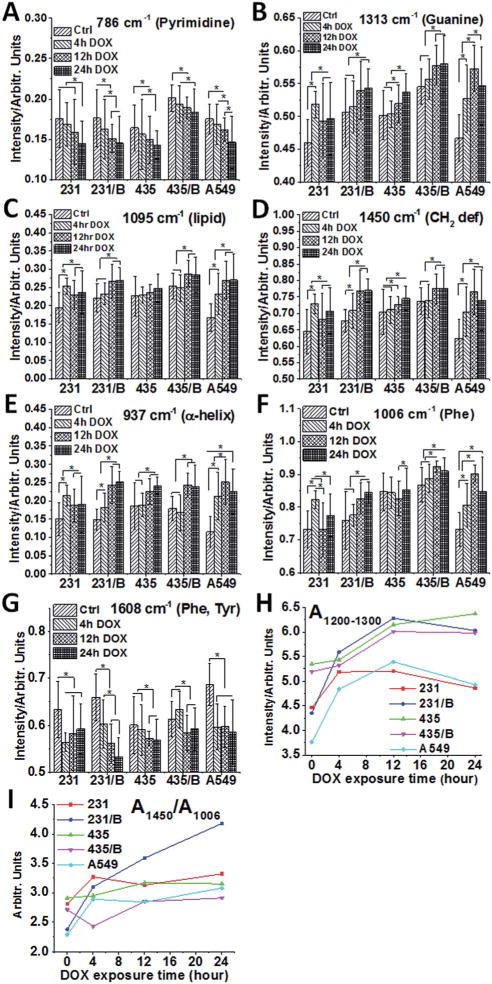
BRMS1 expression has negligible impact on the biochemical changes of cancer cells to DOX. Raman intensity analysis of five cancer cell lines at (A) 786 cm−1 (pyrimidine), (B) 1313 cm−1 (guanine), (C) 1095 cm−1 (lipid), (D) 1450 cm−1 (CH2 deformation of lipid), (E) 937 cm−1 (α-helix), (F) 1006 cm−1 (phenylalanine) and (G) 1608 cm−1 (phenylalanine and tryptophan) at different DOX exposure times (control, 4 h, 12 h and 24 h). Error bars are the standard deviation of the mean. The band area of 1200–1300 cm−1 (H) and the intensity ratio (I) between the 1450 cm−1 and 1006 cm−1 bands (A1450/A1006) of 231, 231/BRMS1, 435, 435/BRMS1 and A549 cells at different DOX exposure times (*p < 0.05; B represents as BRMS1 in the figure).
The peak intensity at 786 cm−1 (Fig. 4A) gradually reduces in all cell lines from control group to 24 h DOX exposure. After 24 h DOX exposure, the intensity at 786 cm−1 for 231, 231/BRMS1, 435, 435/BRMS1 and A549 slightly decreases 1.2, 1.2, 1.1, 1.1 and 1.2 folds respectively, compared to the corresponding control group. Interestingly, the intensity of 1313 cm−1 (Fig. 4B) increases for all cells from control to 24 h DOX exposure. In the control group, the intensity of 1313 cm−1 for BRMS1-expressing cells is slightly larger than that of cells without BRMS1. All cells increase 1.1 fold at 1313 cm−1 after 24 h DOX treatment compared to control. Similarly, the peaks at 1095 cm−1, 1450 cm−1, 937 cm−1 and 1006 cm−1 (Fig. 4C–F) all exhibit increasing intensity for all cells when compared to the control. However, the intensity at 1608 cm−1 of 231, 231/BRMS1, 435, 435/BRMS1 and A549 at 24 h group reduces 7%, 19%, 5%, 4% and 15% respectively compared to control. The spectral region of 1200–1300 cm−1 (Fig. 4H) fluctuates over DOX exposure time, and the band areas of 12 h and 24 h DOX groups increase compared to control group for all cancer cell lines due to an alteration of proteins secondary structure. The band area ratios between the 1450 cm−1 and 1006 cm−1 in Fig. 4I, A1450/A1003, can reveal a structural modification.40 Most of the cells have the largest mean ratio at 24 h DOX treatment, indicating the largest relative content of lipids at 24 h DOX incubation. Table S2† lists the mean area of Raman bands at 1200–1300, 1450 and 1006 cm−1, and the ratio of 1450/1006 at different DOX treatments.
The Raman spectral results demonstrate that BRMS1 expression has an effect on cellular biochemical properties. However, after DOX treatment, the spectral changes of cancer cells with BRMS1 are similar to those without BRMS1. DOX incubation time also plays a critical role in changing spectral intensities. The results suggest that BRMS1 expression changes the biochemical makeup without affecting chemotherapeutic sensitivity of these in vitro cancer cells.
BRMS1 expression changes the expression of cytokines and chemokines
Multiplex ELISA was applied to analyze a total of 25 human cytokines and chemokines, and the majority of them were undetectable (Fig. S3†). However, several cytokines (IL-8, IL-15, RANTES, MCP-1, GROα, GMCSF, IL-2 and TNFα) showed prominent expression levels after DOX treatments (Fig. 5).
Fig. 5.
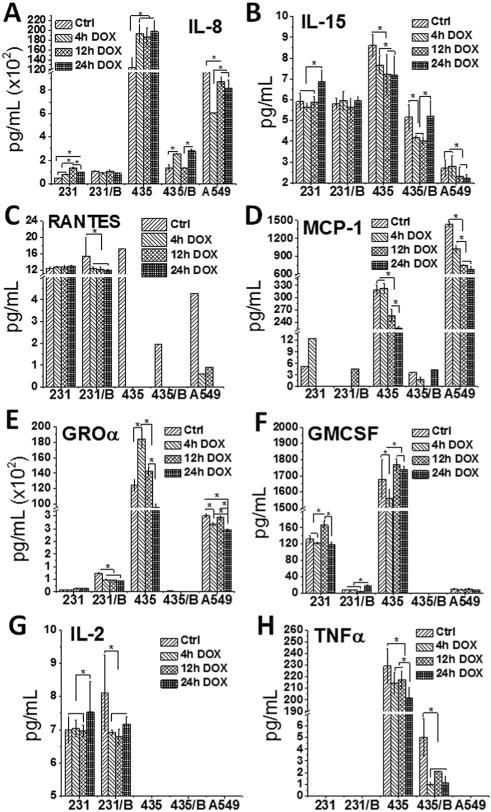
The expression of cytokine and chemokine was affected by BRMS1. Cytokines and chemokines analysis of (A) IL-8, (B) IL-15, (C) RANTES, (D) MCP-1, (E) GROα, (F) GMCSF, (G) IL-2 and (H) TNFα released from 231, 231/BRMS1, 435, 435/BRMS1 and A549 cells. Cells were exposed to DOX for 0 h (control), 4 h, 12 h and 24 h before measurement. Unit of Y-axis: pg mL−1. Error bars are standard deviation of the mean (*p < 0.05; B represents as BRMS1 in the figure).
All cells expressed IL-8, IL-15, RANTES and MCP-1, while some of these cells did not release GROα, GMCSF, IL-2 and TNFα. For 231 and 231/BRMS1, the expressions of IL-8, IL-15, RANTES and IL-2 are very similar from control to 24 h DOX group. However the average expression of GROα is 1041 and 5282 pg mL−1 for 231 and 231/BRMS1 respectively from control to 24 h DOX group, and 231 and 231/BRMS1 secrete an average of 135 and 9 pg mL−1 for GMCSF correspondingly. Similar to 231 and 231/BRMS1, these cytokines fluctuate from control to 24 h DOX group for 435 and 435/BRMS1. Among the eight cytokines 435 releases more than 435/BRMS1 except IL-2 that is undetectable. On average, 435 cells express about 2-fold more IL-15, 9-fold more RANTES, 85-fold higher MCP-1, 87-fold more IL-8, 93-fold higher TNFα, and 6308-fold more GROα than the 435/BRMS1 from control to 24 h DOX group. Meanwhile, the average expression of GMCSF is 1687 pg mL−1 for 435 cells, while that of 435/BRMS1 is undetectable. For A549 cells, cytokine expression also varies. A549 cells express low level of IL-15, RANTES, GMCSF, IL-2 and TNFα (each one is less than 9 pg mL−1 on average) comparing to IL-8, MCP-1 and GROα (83 142, 975 and 27 650 pg mL−1 on average, respectively) from control to 24 h DOX group. Overall, different cell lines release different cytokines at varying levels from control to 24 h DOX group. Among the 25 cytokines and chemokines, many are expressed at a negligible level. The eight cytokines discussed here indicate that 231 and 231/BRMS1 release similar levels of IL-8, IL-15, RANTES and IL-2, while 435 cells express cytokines at a much higher level than the 435/BRMS1 (except IL-2).
It is reported that the expression of BRMS1 largely enhances major histocompatibility complex (MHC) genes and significantly reduces the expression level of some genes related to protein localization and secretion.41 This phenomenon is more obvious between 435 and 435/BRMS1, as shown in Fig. 5. Although 231 and 231/BRMS1 secrete similar level of IL-8, IL-15, RANTES and IL-2, the level of GMCSF for 231/BRMS1 is much less than that of 231. This result may indicate that the expression of BRMS1 in different cell lines has different effects on secretion of cytokines. However, the expression values of cytokines and chemokines for five cell lines are at similar magnitude comparing control to DOX treated groups, suggesting that DOX has similar influences on cancer cells with and without BRMS1.
BRMS1 expression has limited effect on apoptosis, ROS expression and cell viability of cancer cells from DOX
When DOX interacted with cancer cells, an apoptotic response, an increase in ROS, and reduced viability were triggered. These results also showed that apoptosis, ROS expression and cell viability tests were all time-dependent, and the percentage variations of these three tests followed similar changes across all cell lines. In Fig. 6A, there is a large increase in the number of apoptotic cells after 24 h DOX exposure, with a pronounced increase in 435 and 435/BRMS1 cells. For instance, at 12 h exposure, both 435 and 435/BRMS1 have a similar apoptosis percentage (ca. 5–6%); after 24 h exposure, the percentage of apoptotic cells increases to 24% for 435, and 27% for 435/BRMS1. Plus, both are significantly higher than ~17% for both 231 and 231/BRMS1 at the same exposure time. Similarly, the production of ROS in five cells grew with the increase of DOX exposure time (Fig. 6B). The overall level of ROS production for A549, 231, and 231/BRMS1 after 24 h DOX exposure was larger than those for 435 and 435/BRMS1 cells. ROS consists mainly of highly reactive hydroxyl radical (•OH), singlet oxygen (1O2), superoxide anion radical (O2−•) and hydrogen peroxide (H2O2), and ROS can destroy the structure of nucleic acids, proteins and lipids, leading to the loss of organelle functions and membrane damage.42 The increase of ROS level over DOX incubation time may lead to the fluctuation of biochemical changes detected by RM (Fig. 4), and it was found some of the biopolymer changes (Fig. 4A: pyrimidine and Fig. 4G: Phe & Tyr) were consistent with the changes of ROS level, both exhibiting gradually decrease over DOX exposure time. However, other biocomponents (Fig. 4B–F) displayed increasing alterations, and these changes may be explained by other factors, like the increasing expression of cytokine and chemokine (Fig. 5) after treated with DOX, or the increase of apoptotic cells degrading specific cellular proteins and nucleic information. For cell viability (Fig. 6C), the viable cell percentages of 231, 231/BRMS1, 435, 435/BRMS1 and A549 decreased after DOX treatment, changing into 72.7%, 72.4%, 74.8%, 70.7% and 74.5% respectively after 24 h DOX exposure. After 4 h and 12 h DOX exposure, the differences of viability percentage between cancer cells and cancer cells with BRMS1 are ~3% and ~2.8%, correspondingly. The changes of cell viability reveal that cells with or without BRMS1 reacted to DOX similarly, suggesting there is no DOX resistance in BRMS1-expressing cells.
Fig. 6.
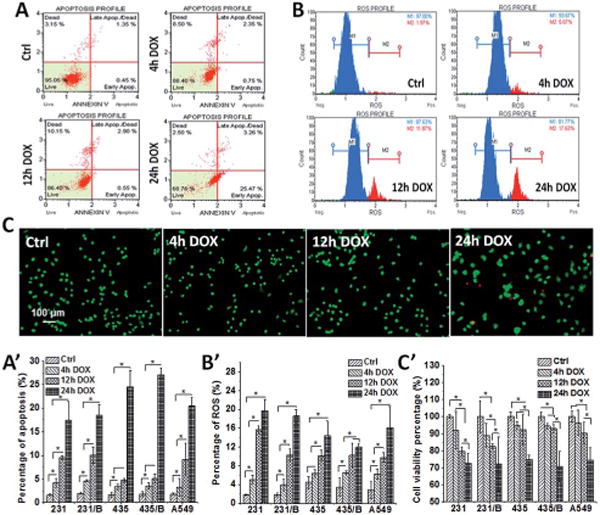
BRMS1 expression has little influence on apoptosis, ROS expression and cell viability of cancer cells from DOX. The representative (A) apoptosis, (B) ROS expression and (C) cell viability images and the histogram of (A′) apoptosis, (B′) ROS expression and (C′) cell viability percentage from 231, 231/BRMS1, 435, 435/BRMS1 and A549 cells without DOX treatment and treated with 4 h, 12 h and 24 h DOX (error bars are standard deviation of the mean, *p < 0.05; B represents as BRMS1 in the figure).
The apoptosis, ROS expression and cell viability changes of five cells display a similar pattern from control to 24 h DOX exposure, reflecting the similar responses between cancer cells and BRMS1-expressing cells to DOX treatment.
Conclusions
Studies were conducted to understand the effects of metastasis suppressors on cellular biomechanical and biochemical properties and its responses to chemotherapeutic drugs. To perform these studies, a representative metastasis suppressor, BRMS1, was selected. This work reported the distribution of BRMS1 within cells. It is also observed that BRMS1 has an influence on cellular biomechanical and biochemical properties. However, the effect on cellular biomechanical and biochemical information from BRMS1 does not impact the chemotherapeutic sensitivity of cells with BRMS1 compared to cells without BRMS1. These findings have provided critical clues on the biomechanical and biochemical changes from BRMS1 expression and the following drug treatments, and confirmed that the drug treatment of breast cancer remains effective in the presence of BRMS1. Our future work is to study more metastasis suppressors and their effects on cellular biophysical, biochemical and cytotoxic responses, providing clinical cues for drug treatments.
Supplementary Material
Acknowledgments
We thank the support from CDMRP award W81XWH-10-1-0668 (AZ), U.S. National Cancer Institute RO1-CA87728 (DRW), Susan G. Komen for the Cure SAC11037 (DRW) and the National Foundation for Cancer Research-Center for Metastasis Research (DRW). Qifei Li also thanks the China Scholarship Council (CSC) for their support.
Footnotes
Electronic supplementary information (ESI) available. See DOI: 10.1039/c5ay01810b
Notes and references
- 1.Slipicevic A, Holm R, Emilsen E, Rosnes AKR, Welch DR, Maelandsmo GM, Florenes VA. BMC Cancer. 2012;12:73. doi: 10.1186/1471-2407-12-73. [DOI] [PMC free article] [PubMed] [Google Scholar]
- 2.Frolova N, Edmonds MD, Bodenstine TM, Seitz R, Johnson MR, Feng R, Welch DR, Frost AR. Tumor Biol. 2009;30:148–159. doi: 10.1159/000228908. [DOI] [PMC free article] [PubMed] [Google Scholar]
- 3.Stafford LJ, Vaidya KS, Welch DR. Int J Biochem Cell Biol. 2008;40:874–891. doi: 10.1016/j.biocel.2007.12.016. [DOI] [PubMed] [Google Scholar]
- 4.Hicks DG, Yoder BJ, Short S, Tarr S, Prescott N, Crowe JP, Dawson AE, Budd GT, Sizemore S, Cicek M, Choueiri TK, Tubbs RR, Gaile D, Nowak N, Accavitti-Loper MA, Frost AR, Welch DR, Casey G. Clin Cancer Res. 2006;12:6702–6708. doi: 10.1158/1078-0432.CCR-06-0635. [DOI] [PMC free article] [PubMed] [Google Scholar]
- 5.Stark AM, Tongers K, Maass N, Mehdorn HM, Held-Feindt J. J Cancer Res Clin Oncol. 2005;131:191–198. doi: 10.1007/s00432-004-0629-9. [DOI] [PubMed] [Google Scholar]
- 6.Zhang Z, Yamashita H, Toyama T, Yamamoto Y, Kawasoe T, Iwase H. Clin Cancer Res. 2006;12:6410–6414. doi: 10.1158/1078-0432.CCR-06-1347. [DOI] [PubMed] [Google Scholar]
- 7.Cicek M, Fukuyama R, Welch DR, Sizemore N, Casey G. Cancer Res. 2005;65:3586–3595. doi: 10.1158/0008-5472.CAN-04-3139. [DOI] [PubMed] [Google Scholar]
- 8.Vaidya KS, Harihar S, Phadke PA, Stafford LJ, Hurst DR, Hicks DG, Casey G, DeWald DB, Welch DR. J Biol Chem. 2008;283:28354–28360. doi: 10.1074/jbc.M710068200. [DOI] [PMC free article] [PubMed] [Google Scholar]
- 9.Cheng JQ, Lindsley CW, Cheng GZ, Yang H, Nicosia SV. Oncogene. 2005;24:7482–7492. doi: 10.1038/sj.onc.1209088. [DOI] [PubMed] [Google Scholar]
- 10.Pham CG, Bubici C, Zazzeroni F, Knabb JR, Papa S, Kuntzen C, Franzoso G. Mol Cell Biol. 2007;27:3920–3935. doi: 10.1128/MCB.01219-06. [DOI] [PMC free article] [PubMed] [Google Scholar]
- 11.Sebens S, Arlt A, Schafer H. Recent Results Cancer Res. 2008;177:151–164. doi: 10.1007/978-3-540-71279-4_17. [DOI] [PubMed] [Google Scholar]
- 12.Wu Y, McEwen GD, Harihar S, Baker SM, DeWald DB, Zhou A. Cancer Lett. 2010;293:82–91. doi: 10.1016/j.canlet.2009.12.016. [DOI] [PubMed] [Google Scholar]
- 13.McEwen GD, Wu Y, Tang M, Qi X, Xiao Z, Baker SM, Yu T, Gilbertson TA, DeWald DB, Zhou A. Analyst. 2013;138:787–797. doi: 10.1039/c2an36359c. [DOI] [PubMed] [Google Scholar]
- 14.Binnig G, Quate CF, Gerber C. Phys Rev Lett. 1986;56:930–933. doi: 10.1103/PhysRevLett.56.930. [DOI] [PubMed] [Google Scholar]
- 15.Dorobantu LS, Gray MR. Scanning. 2010;32:74–96. doi: 10.1002/sca.20177. [DOI] [PubMed] [Google Scholar]
- 16.Liu S, Wang Y. Scanning. 2010;32:61–73. doi: 10.1002/sca.20173. [DOI] [PubMed] [Google Scholar]
- 17.Xiao LF, Tang MJ, Li QF, Zhou AH. Anal Methods. 2013;5:874–879. [Google Scholar]
- 18.Ling J, Weitman SD, Miller MA, Moore RV, Bovik AC. Appl Opt. 2002;41:6006–6017. doi: 10.1364/ao.41.006006. [DOI] [PubMed] [Google Scholar]
- 19.Notingher L, Jell G, Notingher PL, Bisson I, Tsigkou O, Polak JM, Stevens MM, Hench LL. J Mol Struct. 2005;744:179–185. [Google Scholar]
- 20.Owen CA, Selvakumaran J, Notingher I, Jell G, Hench LL, Stevens MM. J Cell Biochem. 2006;99:178–186. doi: 10.1002/jcb.20884. [DOI] [PubMed] [Google Scholar]
- 21.Sellers WR, Fisher DE. J Clin Invest. 1999;104:1655–1661. doi: 10.1172/JCI9053. [DOI] [PMC free article] [PubMed] [Google Scholar]
- 22.Thannickal VJ, Fanburg BL. Am J Physiol: Lung Cell Mol Physiol. 2000;279:L1005–L1028. doi: 10.1152/ajplung.2000.279.6.L1005. [DOI] [PubMed] [Google Scholar]
- 23.Kashkin KN, Musatkina EA, Komelkov AV, Favorskaya IA, Trushkin EV, Shleptsova VA, Sakharov DA, Vinogradova TV, Kopantzev EP, Zinovyeva MV, Kovaleva OV, Zborovskaya IB, Tonevitsky AG, Sverdlov ED. Dokl Biochem Biophys. 2010;430:20–23. doi: 10.1134/s1607672910010072. [DOI] [PubMed] [Google Scholar]
- 24.Vaidya KS, Sanchez JJ, Kim EL, Welch DR. Cancer Lett. 2009;281:100–107. doi: 10.1016/j.canlet.2009.02.035. [DOI] [PMC free article] [PubMed] [Google Scholar]
- 25.Cross SE, Jin YS, Lu QY, Rao JY, Gimzewski JK. Nanotechnology. 2011;22:215101. doi: 10.1088/0957-4484/22/21/215101. [DOI] [PMC free article] [PubMed] [Google Scholar]
- 26.Cross SE, Jin YS, Rao J, Gimzewski JK. Nat Nanotechnol. 2007;2:780–783. doi: 10.1038/nnano.2007.388. [DOI] [PubMed] [Google Scholar]
- 27.Sneddon IN. Int J Eng Sci. 1965;3:47–57. [Google Scholar]
- 28.Butt HJ, Cappella B, Kappl M. Surf Sci Rep. 2005;59:1–152. [Google Scholar]
- 29.Rosenbluth MJ, Lam WA, Fletcher DA. Biophys J. 2006;90:2994–3003. doi: 10.1529/biophysj.105.067496. [DOI] [PMC free article] [PubMed] [Google Scholar]
- 30.Hurst DR, Xie Y, Thomas JW, Liu JZ, Edmonds MD, Stewart MD, Welch DR. PLoS One. 2013;8:e55966. doi: 10.1371/journal.pone.0055966. [DOI] [PMC free article] [PubMed] [Google Scholar]
- 31.Meehan WJ, Samant RS, Hopper JE, Carrozza MJ, Shevde LA, Workman JL, Eckert KA, Verderame MF, Welch DR. J Biol Chem. 2004;279:1562–1569. doi: 10.1074/jbc.M307969200. [DOI] [PubMed] [Google Scholar]
- 32.Liu Y, Smith PW, Jones DR. Mol Cell Biol. 2006;26:8683–8696. doi: 10.1128/MCB.00940-06. [DOI] [PMC free article] [PubMed] [Google Scholar]
- 33.Bodenstine TM, Vaidya KS, Ismail A, Beck BH, Cook LM, Diers AR, Landar A, Welch DR. Cancer Res. 2010;70:10002–10011. doi: 10.1158/0008-5472.CAN-10-2606. [DOI] [PMC free article] [PubMed] [Google Scholar]
- 34.Khotskaya YB, Beck BH, Hurst DR, Han Z, Xia W, Hung MC, Welch DR. Mol Carcinog. 2014;53:1011–1026. doi: 10.1002/mc.22068. [DOI] [PMC free article] [PubMed] [Google Scholar]
- 35.Cross SE, Jin YS, Tondre J, Wong R, Rao J, Gimzewski JK. Nanotechnology. 2008;19:384003. doi: 10.1088/0957-4484/19/38/384003. [DOI] [PubMed] [Google Scholar]
- 36.Wu YZ, McEwen GD, Harihar S, Baker SM, DeWald DB, Zhou AH. Cancer Lett. 2010;293:82–91. doi: 10.1016/j.canlet.2009.12.016. [DOI] [PubMed] [Google Scholar]
- 37.Lekka M, Laidler P, Gil D, Lekki J, Stachura Z, Hrynkiewicz AZ. Eur Biophys J Biophys Lett. 1999;28:312–316. doi: 10.1007/s002490050213. [DOI] [PubMed] [Google Scholar]
- 38.Leporatti S, Vergara D, Zacheo A, Vergaro V, Maruccio G, Cingolani R, Rinaldi R. Nanotechnology. 2009;20:055103. doi: 10.1088/0957-4484/20/5/055103. [DOI] [PubMed] [Google Scholar]
- 39.van der Aa BC, Michel RM, Asther M, Zamora MT, Rouxhet PG, Dufrene YF. Langmuir. 2001;17:3116–3119. [Google Scholar]
- 40.Guo J, Cai W, Du B, Qian M, Sun Z. Biophys Chem. 2009;140:57–61. doi: 10.1016/j.bpc.2008.11.005. [DOI] [PubMed] [Google Scholar]
- 41.Champine PJ, Michaelson J, Weimer BC, Welch DR, DeWald DB. Clin Exp Metastasis. 2007;24:551–565. doi: 10.1007/s10585-007-9092-8. [DOI] [PMC free article] [PubMed] [Google Scholar]
- 42.Nohl H, Kozlov AV, Gille L, Staniek K. Biochem Soc Trans. 2003;31:1308–1311. doi: 10.1042/bst0311308. [DOI] [PubMed] [Google Scholar]
Associated Data
This section collects any data citations, data availability statements, or supplementary materials included in this article.


