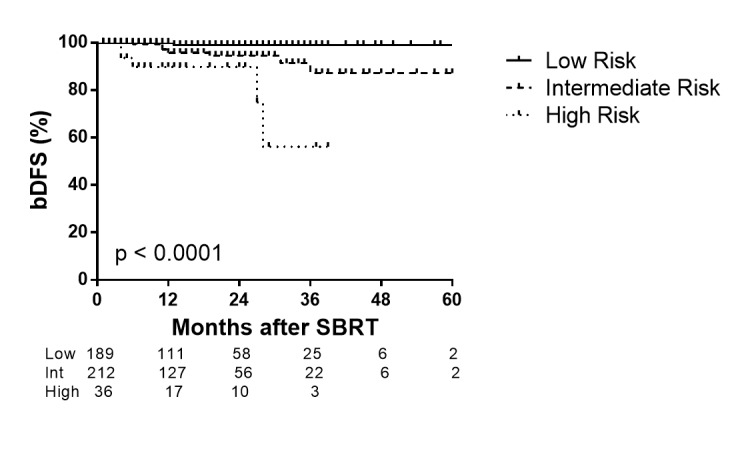
Figure 2. Rate of biochemical disease-free survival for low, intermediate, and high-risk patients after SBRT.

Number of subjects for each risk group are shown below, p value < 0.0001 by log-rank test. Tick marks indicate censored patients.

Number of subjects for each risk group are shown below, p value < 0.0001 by log-rank test. Tick marks indicate censored patients.