

Summary
GABAergic synaptic transmission regulates brain function by establishing the appropriate excitation-inhibition (E/I) balance in neural circuits. The structure and function of GABAergic synapses are sensitive to destabilization by impinging neurotransmitters. However, signaling mechanisms that promote the restorative homeostatic stabilization of GABAergic synapses remain unknown. Here, by quantum dot single-particle tracking, we characterize a signaling pathway that promotes the stability of GABAA receptor (GABAAR) postsynaptic organization. Slow metabotropic glutamate receptor signaling activates IP3 receptor-dependent calcium release and protein kinase C to promote GABAAR clustering and GABAergic transmission. This GABAAR stabilization pathway counteracts the rapid cluster dispersion caused by glutamate-driven NMDA receptor-dependent calcium influx and calcineurin dephosphorylation, including in conditions of pathological glutamate toxicity. These findings show that glutamate activates distinct receptors and spatiotemporal patterns of calcium signaling for opposing control of GABAergic synapses.
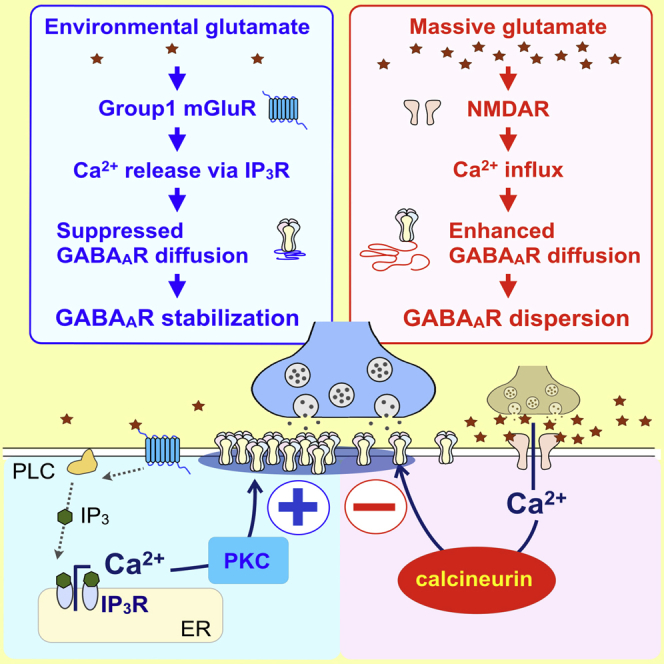
Graphical Abstract
Highlights
-
•
Bidirectional synaptic control system by glutamate and Ca2+ signaling
-
•
Stabilization of GABA synapses by mGluR-dependent Ca2+ release from IP3R via PKC
-
•
Synaptic GABAAR clusters stabilized through regulation of GABAAR lateral diffusion
-
•
Competition with an NMDAR-dependent Ca2+ pathway driving synaptic destabilization
Bannai et al. characterize bidirectional regulation of synaptic GABAAR stability by glutamate and Ca2+. Environmental glutamate continuously stabilizes synaptic GABAAR clusters through mGluR-dependent Ca2+ release through IP3Rs and PKC activation. In contrast, massive glutamate induces GABAAR dispersion through the activation of NMDA receptor and calcineurin.
Introduction
A dynamic balance between excitation and inhibition is crucial for brain functions, such as the generation of rhythmic cortical network activities (Haider et al., 2006, Mann and Mody, 2010) and regulation of the critical period (Hensch, 2004). Accordingly, imbalances may result in neurological disorders like epilepsy and neuropsychiatric diseases like autism (Eichler and Meier, 2008, Yizhar et al., 2011). Extensive evidence indicates that inhibitory GABAergic synaptic transmission plays a key role in the regulation of excitation-inhibition (E/I) balance (Mann and Paulsen, 2007). Thus, understanding the molecular mechanisms regulating GABAergic synaptic transmission, which remain unclear compared to excitatory synapses, is crucial for understanding basic brain function in health and disease.
Fast GABAergic inhibition, i.e., GABAA receptor (GABAAR)-mediated inhibitory synaptic transmission, critically depends on the degree of GABAAR clustering that determines the total number of synaptic GABAARs (Kilman et al., 2002, Nusser et al., 1997). Clustering is regulated by the balance between endocytosis and exocytosis (Luscher et al., 2011) and rapid receptor exchange in and out of synapses by lateral diffusion on the cell surface (Triller and Choquet, 2008). In hippocampal neurons, GABAergic inhibition is plastically modulated by neuronal activities through the control of GABAAR diffusion and clustering (Gaiarsa et al., 2002, Luscher et al., 2011, Petrini and Barberis, 2014). Phasic and sustaining Ca2+ influx through N-Methyl D-aspartic acid (NMDA)-gated ionotropic glutamate receptors (NMDARs) induces long-term depression of GABAergic transmission (iLTD), which results from an increase in GABAAR lateral diffusion and the synaptic escape of GABAAR due to calcineurin-dependent dephosphorylation of the GABAAR γ2 subunit at the residue serine 327 (Bannai et al., 2009, Luscher et al., 2011, Muir et al., 2010, Niwa et al., 2012). A different context of transient NMDA stimulation evokes GABAergic long-term potentiation (iLTP) through synaptic translocation of Ca2+-Calmodulin-dependent kinase II (CaMKII) that leads to phosphorylation of GABAAR β3 serine 383 and stabilization of synaptic GABAAR (Marsden et al., 2010, Petrini et al., 2014). Although detailed molecular mechanism for plastic changes of GABAergic synapses are well characterized, a homeostatic mechanism for the maintenance of GABAergic synapses during continuous exchange of receptors by lateral diffusion and the recovery of GABAAR clusters after dispersion (Niwa et al., 2012) remains unidentified.
We sought to identify and characterize the signaling pathway that continuously stabilizes GABAergic synaptic structure. For this purpose, we focused on the contribution of IP3-induced Ca2+ release (IICR) from intracellular Ca2+ stores in the endoplasmic reticulum (ER) (Berridge, 1998) to GABA synaptic structure. IICR is critical for brain development and function, such as the control of neurite outgrowth, morphogenesis of dendrites, and motor coordination in vivo (Hisatsune et al., 2006, Hisatsune et al., 2013, Matsumoto et al., 1996, Mikoshiba, 2011, Sugawara et al., 2013, Takei et al., 1998). Here we report that metabotropic glutamate receptor (mGluR)-dependent IICR mediates the homeostatic stabilization of GABAAR structures, opposing destabilization by Ca2+ influx through NMDA-type ionotropic glutamate receptors.
Results
mGluR-Dependent Activation of IP3 Receptors Stabilizes GABAAR Clusters at Inhibitory Synapses
Type 1 IP3 receptor (IP3R1) is the dominant IP3R subtype in neurons (Furuichi et al., 1993). To study the impact of IICR on the GABAergic synapse, we investigated the postsynaptic clustering of GABAAR and of its scaffolding molecule gephyrin in hippocampal neurons cultured from IP3R1 knockout (IP3R1 KO) mice (Matsumoto et al., 1996). GABAAR and gephyrin were labeled using an antibody against the GABAAR γ2 subunit (Niwa et al., 2012) and commercial gephyrin antibodies, respectively. GABAAR and gephyrin clusters were considered synaptic when adjacent to synapsin-immunoreactive boutons (Bannai et al., 2009). We found that GABAAR γ2 (Figure 1A) and gephyrin (Figure 1B) immunoreactivities were reduced in IP3R1 KO neurons compared with wild-type (WT) neurons (Figures 1A and 1B). Quantification revealed that both the number of GABAAR clusters per dendritic length and the fluorescent intensity of GABAAR clusters were significantly reduced in IP3R1 KO neurons (75.4% ± 5.5% and 75.6% ± 3.2% of WT, respectively; Figure 1C). The number of gephyrin clusters per dendrite length and the fluorescent intensity of gephyrin clusters in IP3R1 KO neurons were 55.4% ± 4.2% and 71.3% ± 3.7% of WT neurons, respectively (Figure 1D). However, we found a 19.7% ± 3.5% reduction in the number of synapsin-immunoreactive terminals per dendrite length in IP3R1KO neurons, suggesting that the persistent loss of IICR impaired synaptic connectivity.
Figure 1.

Gene KO of IP3R1 Conducts to the Dispersal of GABAAR and Gephyrin Clusters
(A and B) Hippocampal neurons from 15–18 DIV wild-type (WT) or IP3R1 knockout (IP3R1KO) mice stained for GABAAR γ2 subunit (A) and gephyrin (B). Arrows in upper panels indicate the dendrites enlarged in lower panels. Color code in lower panels is as follows: green, GABAAR or gephyrin clusters; magenta, synapsin punctae; and white, GABAAR or gephyrin clusters facing synapsin-labeled boutons. Note the decrease in GABAAR and gephyrin immunoreactivities in IP3R1KO neurons as compared to WT neurons. Scale bars, 50 and 10 μm in upper and lower panels, respectively.
(C and D) Number of synaptic clusters per dendrite length (left) and fluorescent intensities (right) of synaptic GABAAR (C) and gephyrin (D) clusters. Values represent mean ± SEM and were normalized to their respective control values (C, n = 36 cells for WT, n = 38 for IP3R1KO; D, n = 37 for WT, n = 38 for IP3R1KO; ∗∗∗p < 0.005, Welch’s t-test).
We therefore examined the impact of IICR on GABAAR and gephyrin following acute blockade of IP3R with 2-aminoethoxydiphenyl borate (2APB, 100 μM) (Maruyama et al., 1997). The fluorescence intensity of postsynaptic GABAAR clusters was not different in neurons exposed for 30 min to 2APB as compared to untreated cells (Figures 2A and 2B). It was only after 60–90 min of drug exposure that the fluorescence intensity, but not the number of synaptic GABAAR clusters per dendrite length, was significantly reduced (Figures 2A and 2B). Considering that neuronal excitation-dependent Ca2+ influx induces the dispersion of GABAAR clusters (Bannai et al., 2009, Muir et al., 2010), loss of IICR could affect the GABAergic synapses through the enhancement of neuronal excitation and Ca2+ influx. This possibility was excluded by the findings that 2APB reduced the fluorescence intensity of GABAAR clusters when action potentials (APs) were blocked with tetrodotoxin (TTX, 1 μM) (Figures S1A and S1B) or when extracellular Ca2+ was removed by Chelex (Figures S1C and S1D), indicating that IICR regulates GABAAR clustering in basal condition and in the absence of Ca2+ influx.
Figure 2.

mGluR/IICR-Signaling Cascade Promotes Clustering of GABAAR and Gephyrin
(A–D) Effect of pharmacological blockade of IICR on GABAAR (A and B) and gephyrin (C and D) clustering in 21–27 DIV hippocampal neurons. (A and C) Representative examples show GABAAR (A) or gephyrin (C) immunoreactivity after 100 μM 2APB or 0.1% DMSO treatment for 30, 60, and 90 min. (B and D) The number of cluster per dendrite length (left) and fluorescence intensities (right) of synaptic GABAAR (B) or gephyrin (D) clusters in cells exposed to DMSO (gray), 2APB (red), U73122 (blue), or MCPG (green) are shown. Plots show mean values ± SEM in function of time. Data were normalized to their respective control values.
(E) Time course of DHPG-induced intracellular Ca2+ elevation as reported by measurement of Fluo-4 F/F0 ratio (means ± SEM; n = 41).
(F and G) Representative images (F) and quantifications (G) of the fluorescence intensity of synaptic GABAAR clusters showing that DHPG increases GABAAR clustering. Values (mean ± SEM) were normalized to their respective control values (n ≥ 30 cells per condition; ∗∗∗p < 0.005, ∗p < 0.05, t-test). Scale bars, 10 μm.
See also Figures S1–S5.
We then checked whether 2APB alters other key constituents of the inhibitory synapse, such as the main scaffolding molecule gephyrin. We found that 60 min of 2APB treatment decreased both the number and fluorescence intensity of gephyrin clusters (Figures 2C and 2D), indicating a global impact of 2APB on the molecular organization of the GABA synapse. The shrinkage of gephyrin clusters also was confirmed by time-lapse imaging of cultured hippocampal neurons from mRFP-gephyrin knockin mice (Calamai et al., 2009) treated with 2APB (Figure S2). We recently demonstrated that gephyrin was stabilized at synapses through its interaction with GABAAR (Niwa et al., 2012). Similarly, we show here that GABAAR antibody cross-linking prevented the dispersion of gephyrin clusters by 2APB (Figure S3), suggesting that the loss of gephyrin at synapses was secondary to the receptor dispersal.
IP3Rs located at the surface of the ER are often activated via the production of phospholipase C (PLC) following the activation of group I mGluRs. We therefore examined the impact of this signaling pathway on GABAAR and gephyrin clustering following acute blockade of PLC and mGluR with U73122 (1 μM) and α-methyl-4-carboxyphenylglycine (MCPG, 250 μM), respectively. U73122 and MCPG impaired the clustering of both GABAAR and gephyrin after 60–90 min of drug exposure (Figure S4; Figure 2D). We thus checked whether mGluR activation stabilizes GABA synapses. We showed that acute IICR activation by group I mGluR agonist dihydroxyphenylglycine (DHPG, 5 μM) increased the intracellular Ca2+ level, as observed with Ca2+ imaging (Figure 2E). Furthermore, acute DHPG treatment (10–40 min) increased the fluorescence intensity of synaptic GABAAR clusters by 17%–26% (Figures 2F and 2G), indicating that Ca2+ release from ER stores indeed promotes GABAAR clustering. Altogether, these results indicate that mGluR-dependent IICR constitutively stabilizes the post-synaptic clustering of GABAARs and gephyrin.
Impact of mGluR Signaling on GABAAR-Mediated Synaptic Transmission
Since a loss of synaptic GABAAR is often correlated with reduced synaptic efficacy (Kilman et al., 2002, Nusser et al., 1997, Nusser et al., 1998), we checked whether IICR inhibition impacts GABAergic synaptic transmission. We recorded inward GABAAR-mediated miniature inhibitory postsynaptic currents (mIPSCs) in the presence of TTX and ionotropic glutamate receptor antagonists in cultured hippocampal neurons, with and without MCPG treatment (60- to 90-min incubation). Representative traces illustrate that MCPG reduced GABAAR-mediated mIPSC amplitude (Figure 3A). The distribution of mIPSC amplitudes was significantly shifted toward lower values (Figure 3B). In contrast, the time to peak (Figure 3C) and decay time τ (Figure 3D) remained unchanged after MCPG treatment, indicating no impact of IICR on GABAAR channel kinetics. Furthermore, mIPSC amplitude was significantly reduced in post-natal day (P)14–P16 hippocampal slices derived from IP3R1 KO mice as compared with WT animals (Figure 3E), with unchanged time to peak (Figure 3F) and slightly reduced decay time τ (Figure 3G). We thus concluded that the dispersal of GABAAR clusters following IICR blockade is responsible for the reduction in GABAergic synaptic efficacy.
Figure 3.

Lower Efficacy of GABA Synapses after Reduced IICR Activity
(A) Examples show GABAergic mIPSC traces recorded in cultured hippocampal neurons in the absence (left) or presence (right) of mGluR inhibitor MCPG.
(B) Distribution of mIPSC amplitudes in the absence (white, top and bottom) or presence (gray, middle and bottom) of MCPG. Note that the distribution of mIPSC amplitudes is shifted toward lower values in MCPG-treated neurons.
(C and D) Cumulative distributions of time to peak (C) and decay time constant (D) of mIPSCs in the absence (open) or presence of MCPG (close). The first 15 events were collected from seven neurons per condition.
(E) Distributions of mIPSC amplitudes recorded in pyramidal neurons from P14–P16 WT (white, top and bottom) or IP3R1KO mice (gray, middle and bottom) hippocampal slices. The overlay emphasizes the reduction in mIPSC amplitudes in IP3R1KO.
(F and G) Distributions of time to peak (F) and decay time constant (G) of mIPSCs of WT (white circle) and IP3R1KO (black circle). The first 250 events were collected from four neurons per condition (∗∗∗p < 0.005; ns, not significant; Mann-Whitney U-test).
Ca2+ Influx and Ca2+ Release Define Opposing Mechanisms to Control GABAAR Clustering
We previously showed that the NMDAR-mediated dispersal of synaptic GABAAR and gephyrin clustering was reversed 15 min after NMDA withdrawal (Bannai et al., 2009, Niwa et al., 2012; Figures 4A–4C). We show here that GABAAR clustering did not recover after NMDA removal when IICR was blocked with the IP3R antagonist 2APB (Figures 4A and 4B) or the group I/II mGluR inhibitor MCPG (Figure 4C), suggesting IICR participates in the recovery phase. These results also suggest that Ca2+ influx and IICR operate through separate, non-overlapping mechanisms to regulate GABAAR clustering. We further examined whether recruitment of Ca2+ stores could prevent NMDAR and Ca2+ influx-mediated dispersion of GABAAR clusters. For this purpose, we applied DHPG together with NMDA to neurons pre-treated with NMDA. We found that activation of IICR did not reverse the NMDA-induced GABAAR loss of clusters when NMDA was applied first (Figures 4D–4F). In contrast, DHPG pre-treatment for 30 min completely prevented GABAAR dispersion (Figures 4G–4I). These results highlight that, when engaged, these two glutamatergic pathways cannot be antagonized by the activation of a secondary pathway.
Figure 4.

mGluR/IICR Contribute to the Positive Control of GABAAR Clustering through Separate Non-overlapping Mechanisms with Ca2+ Influx
(A–C) Inhibition of IICR prevents re-clustering of GABAAR at synapses after NMDA washout. (A) Examples show GABAAR γ2 immunoreactivities after 3-min exposure to NMDA (top) or after 15 min of NMDA washout in the presence of DMSO (middle) or 2APB (bottom). Scale bar, 10 μm. (B and C) Quantification of the fluorescence intensity of GABAARγ2 before (NMDA) and after washout (Recovery), in the presence or absence of 2APB (B) or MCPG (C), is shown. Values (mean ± SEM) were normalized to their respective control values (n = 30 cells/condition; ∗∗∗p < 0.005, t-test).
(D–I) Pre-activation of IICR prevents NMDA-mediated dispersion of GABAAR. Neurons pre-incubated to NMDA (D–F) or DHPG (G–I) were then exposed to NMDA in the presence of DHPG. Images (E and H) and quantifications of synaptic cluster fluorescence intensities (F and I) reveal that DHPG restored GABAAR clustering only when neurons were pre-treated with DHPG. Scale bars, 10 μm. Values (mean ± SEM) were normalized to their respective control values (n = 30–60 cells per condition; ∗∗∗p < 0.005, Tukey’s range test in ANOVA).
Intracellular Calcium Scales GABAAR Clustering via Regulation of Lateral Diffusion
GABAAR undergoes extensive endocytosis through clathrin-dependent mechanisms (Kittler et al., 2004), and the density of GABAAR at synapses is largely dependent on the controlled removal of receptors from the plasma membrane (Kittler et al., 2008). However, we found 2APB was able to reduce GABAAR clustering, even when clathrin-dependent endocytosis was prevented by the membrane-permeant dynamin blocker dynasore (Newton et al., 2006; Figures S5A and S5B). We quantified the levels of total and surface GABAAR using surface biotinylation and western blot analysis. GABAAR was identified using a homemade antiserum directed against the β3 subunit, a subunit that assembles with the γ2 subunit at inhibitory synapses (Sieghart et al., 1999). The antiserum specificity was validated by western blot using protein extracts from hippocampal cultured neurons or HeLa cells transfected or not with the GABAAR β3 subunit together with the α2 and γ2 subunits (Figure S5C). Quantification of the amount of total and biotinylated surface GABAAR proteins (Jovanovic et al., 2004) in the presence or absence of 2APB (for 60 min) revealed no significant changes in the membrane and total pools of GABAAR (Figures S5D and S5E), suggesting that the loss of GABAAR at inhibitory synapses did not result from internalization and degradation of the receptor.
The regulation of receptor membrane dynamics contributes to the rapid control of their numbers at synapses (Choquet and Triller, 2013, Gerrow and Triller, 2010, Triller and Choquet, 2005, Triller and Choquet, 2008). The activity-dependent reduction of GABAAR number at inhibitory synapses is due to a reduction in receptor diffusion constraints (Bannai et al., 2009, Bouthour et al., 2012, Muir et al., 2010). We thus examined the influence of IICR on the lateral diffusion of GABAAR using a quantum dot (QD)-based single-particle tracking (SPT) approach (Bannai et al., 2006, Lévi et al., 2011). Synaptic and extrasynaptic sub-trajectories were segregated according to their colocalization with FM4-64 punctae (Bannai et al., 2009). Neuronal exposure to 2APB apparently increased the surface exploration of individual trajectories within 30 min (Figure 5A). Indeed, diffusion coefficients of both extrasynaptic and synaptic QDs significantly increased (Figure 5B). However, the increase in diffusion was not associated with a significant change in the dwell time (Figure 5C) or size of the domain of confinement (Figure 5D) at inhibitory synapses, meaning 2APB did not lead to a noticeable loss of GABAAR. It was after 60 min of 2APB application that the increase in diffusion coefficients (Figures 5E and 5F) was associated with a reduction in the dwell time (79.0% of control; Figure 5G) and an increase in the confinement size (120.5% of control; Figure 5H) at inhibitory synapses, indicative of synaptic escape.
Figure 5.

Reduced IICR Activity Increases the Lateral Diffusion of GABAAR γ2 Subunits in the Presence of Calcineurin Activity
QD-SPT tracking of GABAAR γ2 subunits in hippocampal neurons. (A, E, I, M, and Q) Examples show QD trajectories (green), reconstructed from recording sequences (15.2 s for I and 38.4 s for others), overlaid with FM4-64 signals (gray) in order to identify synapses. Scale bars, 5 μm. (B, F, J, N, and R) Quantifications of median diffusion coefficients are shown (median D ± 25%–75% Interquartile Range [IQR]). (C, G, K, O, and S) The mean (±SEM) synaptic dwell time is shown. (D, H, L, P, and T) Size of confinement domains is shown (mean ± SEM).
(A–H) Tracking of QD-bound GABAAR γ2 subunits in neurons exposed to IP3R blocker 2APB for 0–30 (A–D) or 60–90 (E–H) min. Note that exploration and diffusion coefficient of GABAAR increased after 2APB application (A, B, E, and F). In contrast, the mean synaptic dwell time (C and G) and size of confinement domains (D and H) decreased and increased, respectively, only after 60 min, but not before 30 min of drug treatment.
(I–L) Increased diffusion and reduced synaptic confinement in IP3R1KO neurons (KO) compared with WT, analyzed at 15–18 DIV.
(M–P) The blockade of group I mGluRs also led to an increase in diffusion of GABAAR.
(Q–T) Neurons were exposed to 2APB in the absence or presence of the calcineurin inhibitor Cyclosporin A (CysA) and FK506. Both CysA and FK506 prevented the 2APB-dependent increase in GABAAR diffusion.
NS, p > 0.05; ∗p < 0.05, ∗∗p < 0.01, ∗∗∗p < 0.005; Mann-Whitney U-test (B, F, J, N, and R) and Welch’s t-test for others. Numbers of QDs analyzed are shown in Table S1. See also Figures S5 and S6.
A similar relief in GABAAR diffusion constraints was found in neurons derived from IP3R1 KO animals as compared with WT neurons (Figures 5I–5L). Considering that 2APB (60–90 min) did not affect the membrane dynamics of mGluR5 (Figure S6), we concluded that the 2APB-dependent relief in diffusion constraints of the GABAAR was not due to a global effect on the properties of the membrane. Furthermore, neuronal exposure to MCPG also led to a faster synaptic escape of GABAAR (Figures 5M–5P), demonstrating that the mGluR-dependent IICR pathway regulates the surface mobility of GABAAR. Altogether our results show that the IICR-signaling pathway constrains the diffusion of GABAAR during basal activity, maintaining a stable pool of GABAARs at inhibitory synapses.
Counteracting Kinase-Phosphatase Systems Control GABAAR Diffusion
We found that the calcineurin inhibitor cyclosporin A or FK506 (CysA, 1 μM; FK506, 1 μM; Figure 5Q) completely prevented the effect of IICR blockade on GABAAR diffusion dynamics, i.e., the increase in diffusion coefficients at synaptic sites (Figure 5R), synaptic escape (Figure 5S), and synaptic confinement size (Figure 5T). These results suggest that basal calcineurin activity underlies the increase in GABAAR lateral diffusion in the absence of IICR.
The observation that the loss of IICR revealed the role of basal calcineurin activity to increase GABAAR diffusion suggested the possibility that IICR physiologically activates a phosphorylation pathway antagonizing the de-phosphorylation effect of calcineurin to reduce GABAAR diffusion. Because conventional α, β, and γ subtypes of protein kinase C (PKC) are activated by Ca2+ and diacylglycerol (DAG) downstream of mGluR1/5, we hypothesized that IICR reduces lateral diffusion of GABAAR following PKC-dependent phosphorylation of target proteins. Therefore, we examined the effect of 2APB treatment on the expression level and the intracellular distribution of Ca2+-dependent PKCs in cultured hippocampal neurons by western blot and immunocytochemistry, respectively. Western blot analysis revealed that 2APB exposure for 60 min dramatically decreased the expression level of PKCγ to 68.9% ± 6.0% of the control (DMSO), while the expression of PKCα and β2 remained unchanged (PKCα: 94.4% ± 5.6%; PKCβ2: 95.7% ± 4.4%; Figures 6A and 6B). Since there is a possibility that the distribution of protein can change without affecting the total amount of protein, we then quantified the amount of Ca2+-dependent PKCs around surface GABAARs using immunocytochemistry (Figure 6C). To estimate the amount of PKCs around surface GABAARs, we measured the mean PKC fluorescence intensity per pixel overlapping with GABAAR clusters. Although the fluorescence intensity beneath GABAAR clusters of PKCα was unaffected (PKCα: 97.0% ± 1.8%; Figure 6D), that of PKCβ2 and γ significantly decreased after 2APB treatment (PKCβ2: 91.8% ± 1.1%; PKCγ: 81.9% ± 1.6%; Figure 6D). We concluded that the IICR pathway regulates the expression level and subcellular distribution of PKCs.
Figure 6.

IICR Activity Regulates the Expression Level and Clustering of Ca2+-Dependent PKC
(A) Protein expression levels of α, β2, and γ PKC subtypes and GABAAR β3 subunit after 60-min exposure of neurons to DMSO or 2APB are shown.
(B) Quantification of the PKC/GABAAR β3 subunit protein level ratio showing the PKCγ/GABAAR β3 ratio significantly decreased after 2APB exposure for 60 min. Values (mean ± SEM) were normalized to the respective DMSO control condition (n = 6; ∗∗∗p < 0.005, t-test).
(C) Co-staining of GABAAR γ2 subunit and α, β2, or γ PKC subtypes after 60 min of DMSO or 2APB treatment. Arrowheads in upper panels indicate the dendrites enlarged in lower panels. Color codes in lower panels are as follows: green, GABAAR; magenta, α, β2, or γ PKC; and white, GABAAR and PKC colocalized clusters. Scale bars, 10 μm. Note that 2APB decreased the PKC β2 and γ, but not α, isoform immunoreactivities.
(D) PKC fluorescence intensity per pixel below GABAAR punctae. Values (mean ± SEM) were normalized to the respective DMSO control condition (n = 30 cells for PKCα and PKCβ2; n = 40 for PKCγ; ∗∗∗p < 0.005, t-test).
We reasoned that if IICR constrains the diffusion of GABAAR through PKC-dependent phosphorylation, the blockade of PKC should mimic the effect of the IICR inhibitor 2APB. Indeed, neurons exposed to 12-(2-cyanoethyl)-6,7,12,13-tetrahydro-13-methyl-5-oxo-5H-indolo(2,3-a)pyrrolo(3,4-c)-carbazole (Gö6976), a specific inhibitor against PKCα, β, and γ (Keenan et al., 1997, Martiny-Baron et al., 1993), for 60–90 min (500 nM; Figure 7A) had an increased diffusion coefficient (Figures 7B and 7C), reduced synaptic dwell time (Figure 7D), and enlarged confinement size (Figure 7E). This behavior is reminiscent of the effect of 2APB on GABAAR diffusion (Figure 5). In turn, the PKC activator phorbol 12-myristate 13-acetate (PMA, 200 nM), which mimics DAG, but not its inactive analog 4α-phorbol 12-myristate 13-acetate (4α-PMA) (Figure 7A), abolished the 2APB effect on GABAAR mobility (Figure 7F–7I).
Figure 7.

Constraint of GABAAR Lateral Diffusion Requires Ca2+-Dependent PKC Activity
(A) A diagram showing the time course of the experiment. Drugs were applied as indicated by horizontal bars.
(B–E) Blockade of Ca2+-dependent PKC by Gö6976 (60–90 min) enhances GABAAR surface exploration (B, green), diffusion coefficients (C, median D values ± IQR), synaptic escape (D, mean dwell time ± SEM), and size of confinement domain (E, mean ± SEM).
(F–I) The PKC activator PMA, but not its inactive form (4α-PMA), prevented the 2APB-induced enhancement of GABAAR mobility (∗∗∗p < 0.005; NS, p > 0.05; Mann-Whitney U-test (C and G) and Welch’s t-test (D, E, H, and I). Numbers of QDs analyzed are shown in Table S1. Scale bars, 5 μm (A and E).
(J) Conceptual diagrams showing summary of our finding. Massive Ca2+ influx through NMDAR activates calcineurin (CN), exceeds phosphorylation by PKC, and results in increasing lateral diffusion of GABAAR on the plasma membrane (PM). In contrast, the mGluR/PLC/IICR pathway constitutively activates PKC. This activation of mGluR/IICR/PKC process constrains lateral diffusion of GABAAR, counteracting basal activity of CN.
See also Figure S7.
Dephosphorylation of Serine 327 of the GABAAR γ2 subunit (S327) by calcineurin has been reported to enhance the lateral diffusion of GABAAR (Muir et al., 2010). Interestingly, S327 is also a PKC target (Moss et al., 1992). Therefore, we examined whether IICR-mediated regulation of GABAAR mobility relies on the phosphorylation of S327 by mutating S327 to alanine (S327A) or glutamate (S327E) to mimic the dephosphorylated and phosphorylated forms of the receptor, respectively (Figure S7A). A myc-tag was added to the N-terminal region of the chimera in order to track the mutant receptor with QD-coupled myc-tag antibodies. We found 2APB significantly enhanced the diffusion of S327A and S327E chimeras similar to the WT GABAAR (Figure S7B), indicating that S327 is not involved in the 2APB effect. S343, an additional potential PKC target in GABAARγ2L (Moss et al., 1992), was mutated in concert with S327 to alanine (S327/343A) or glutamate (S327/343E). However, neither S327/343A nor S327/343E prevented the 2APB-induced increase in GABAAR diffusion (Figure S7C), suggesting that IICR-dependent regulation of GABAAR mobility does not require S327 or S343 of the GABAARγ2 subunit, but involves other PKC target residues.
Altogether these results implicate PKC activation and, therefore, increased phosphorylation of target protein(s) in the IICR-induced constrain of GABAAR lateral diffusion. In the hippocampal neurons, the second messenger Ca2+ has a dualistic impact on GABAAR, i.e., intracellular Ca2+ elevation has opposite effects on the regulation of GABAAR lateral diffusion and clustering. Ca2+ influx through NMDAR activates calcineurin, leading to an increase of GABAAR lateral diffusion and synaptic escape of the receptor (Bannai et al., 2009, Muir et al., 2010; Figure 7J). In contrast, Ca2+ release from the ER stores following mGluR, PLC, and IP3R activation antagonizes calcineurin activity while activating PKC, which leads to phosphorylation of unknown target(s) and synaptic stabilization of GABAARs (Figure 7J).
Discussion
In this study, we demonstrate that the mGluR/IICR/PKC pathway stabilizes GABAergic synapses by constraining lateral diffusion and increasing clustering of GABAARs, without affecting the total number of GABAAR on the cell surface. This pathway defines a unique form of homeostatic regulation of GABAergic transmission under conditions of basal synaptic activity and during recovery from E/I imbalances. The study also highlights the ability of neurons to convert a single neurotransmitter (glutamate) into an asymmetric control system for synaptic efficacy using different calcium-signaling pathways.
In hippocampal neurons, GABAergic synapses have two regulatory mechanisms as follows: a plastic regulation of GABAAR clustering by Ca2+ influx through NMDARs (Bannai et al., 2009, Luscher et al., 2011, Marsden et al., 2010, Muir et al., 2010, Petrini et al., 2014), and a homeostatic stabilization process that contributes to the continuous maintenance of GABAergic synapse structure and the recovery from anti-homeostatic destabilization. Our results provide further insight into this second system, showing that the recovery of synaptic GABAAR clusters from NMDA-induced dispersal is impaired when IP3R and mGluR signaling are inhibited. These findings support the idea that continuous IICR activity downstream of mGluRs plays a crucial role in recovery from the transient decrease in synaptic GABAAR numbers accompanying excess neuronal activity and the stabilization of GABAergic synapses under both normal and pathological conditions.
Our data raise the possibility that mGluR-dependent IICR contributes to the maintenance of GABAergic synapses under physiological conditions. Gene KO of IP3R1 or pharmacological inhibition of IICR led to a reduction of synaptic GABAAR numbers and mIPSC amplitude, indicating that the constitutive IICR activity is involved in the maintenance of GABAergic synapses. Considering that group I mGluRs are tonically activated by ambient glutamate (Smolders et al., 2004), mGluR-dependent IICR could occur in a constitutive manner under basal conditions to maintain the integrity of GABAergic synapses.
Our findings also suggest a possible role of constitutive IICR in synaptic plasticity. Although several alterations of synaptic plasticity have been reported in IP3R1KO hippocampal neurons such as LTD-LTP conversion (Nishiyama et al., 2000) and LTP facilitation in excitatory synapses (Fujii et al., 2000, Itoh et al., 2001), the mechanisms underlying these modifications mostly remain unknown. LTP facilitation in IP3R1KO hippocampus CA1 is due to weakened inhibitory input (Yoshioka et al., 2010), and this could be explained by our finding that loss of mGluR or IICR impaired GABAergic synaptic transmission through enhanced synaptic escape of GABAAR by diffusion. In other words, mGluR/IICR signaling could ensure physiological LTP by restoring post-plasticity stabilization of GABAergic synapses that would have a tonic effect on the physiological set point for network stability.
The most striking conceptual finding in this study is that two distinct intracellular signaling pathways, NMDAR-driven Ca2+ influx and mGluR-driven Ca2+ release from the ER, effectively driven by the same neurotransmitter, glutamate, have an opposing impact on the stability and function of GABAergic synapses. Sustained Ca2+ influx through ionotropic glutamate receptor-dependent calcium signaling increases GABAAR lateral diffusion, thereby causing the dispersal of synaptic GABAAR, while tonic mGluR-mediated IICR restrains the diffusion of GABAAR, thus increasing its synaptic density. How can Ca2+ influx and IICR exert opposing effects on GABA synaptic structure? Our research indicates that each Ca2+ source activates a different Ca2+-dependent phosphatase/kinase: NMDAR-dependent Ca2+ influx activates calcineurin, while ER Ca2+ release activates PKC.
We found that the increased lateral diffusion of GABAAR was attenuated by the inhibition of calcineurin, which remains active even at basal levels of Ca2+ concentration (Nabavi et al., 2013). This implies that GABAAR lateral diffusion could be under the control of calcineurin not only after Ca2+ influx, when neuronal excitation is enhanced, but also during basal levels of activity. Moreover, the enhancement of GABAAR diffusion by PKC inhibition indicates that PKC is also normally active under basal conditions. Active PKCs translocate to the plasma membrane (Newton, 1997). Therefore, the fact that 2APB decreased the amount of PKC-β2 and -γ colocalizing with GABAAR clusters suggests that constitutive activation of the IICR pathway may maintain the expression and activity of PKC.
It is noteworthy that the impact of a PKC inhibitor alone on GABAAR diffusion was more prominent than that of a calcineurin inhibitor alone under basal conditions, suggesting that constitutive PKC activity for synaptic stability overcomes basal calcineurin activity in neurons with a physiological E/I balance. However, the mechanism of how PKC phosphorylation impacts GABAAR diffusion remains to be elucidated in future study. GABAAR scaffold-binding affinity could be regulated by PKC. Considering that GABAAR antibody cross-linking prevented the dispersion of gephyrin clusters by 2APB, the possibility of a phosphorylation-dependent regulation of GABAAR lateral diffusion is independent of the receptor-gephyrin binding control. This implies the involvement of other GABAAR-interacting and -clustering protein(s) (Luscher et al., 2011, Smith et al., 2014). It is also noteworthy that the GABAARγ2 S327 and S343 residues both targeted by PKC are not involved in IICR-mediated regulation of GABAAR lateral mobility. This contrasts with the fact that calcineurin enhances GABAAR lateral diffusion via a mechanism involving S327 dephosphorylation (Muir et al., 2010). This suggests that calcineurin and PKC tune GABAAR mobility by regulation of the phosphorylation state of distinct residues. Furthermore, PKC may affect GABAAR stability by also controlling the phosphorylation of scaffold molecules.
Taken together, these results lead us to propose the following model for bidirectional competitive regulation of GABAergic synapses by glutamate signaling. Phasic Ca2+ influx through NMDARs following sustained neuronal excitation or injury leads to the activation of calcineurin, overcoming PKC activity and relieving GABAAR diffusion constraints. In contrast, during the maintenance of GABAergic synaptic structures or the recovery from GABAAR dispersal, the ambient tonic mGluR/IICR pathway constrains GABAAR diffusion by PKC activity, overcoming basal calcineurin activity. One possible mechanism of dual regulation of GABAAR by Ca2+ is that each Ca2+-dependent enzyme has a unique sensitivity to the frequency and number of external glutamate release events and can act to decode neuronal inputs (Fujii et al., 2013, Li et al., 2012, Stefan et al., 2008) in inhibitory synapses.
Tight control of E/I balance, the loss of which results in epilepsy and other brain and nervous system diseases/disorders, is dependent on GABAergic synaptic transmission (Mann and Paulsen, 2007). A recent study showed that the excitation-induced acceleration of GABAAR diffusion and subsequent dispersal of GABAARs from synapses is the cause of generalized epilepsy febrile seizure plus (GEFS+) syndrome (Bouthour et al., 2012). Our results indicate that pre-activation of the mGluR/IICR pathway by DHPG could completely prevent the dispersion of synaptic GABAARs induced by massive excitatory input similar to status epilepticus. Thus, further study of the molecular mechanisms underlying the mGluR/IICR-dependent stabilization of GABAergic synapses via regulation of GABAAR lateral diffusion and synaptic transmission could be helpful in the prevention or treatment of pathological E/I imbalances, for example, in the recovery of GABAergic synapses from epileptic states.
Experimental Procedures
Animals
All experiments in this study were carried out in accordance with the guidelines approved by the Animal Experiment Committee of the RIKEN and Nagoya Univ.
Primary Cultures of Hippocampal Neurons
Primary cultures of hippocampal neurons were prepared from embryonic day (E)18–E21 Wistar rat embryos or P0–P1 IP3R1 KO mice (Matsumoto et al., 1996) or their littermates, as previously described (Goslin et al., 1998), and they were used for each experiment at 21–27 days in vitro (DIV), unless otherwise described.
Drug Treatment
Neurons were acutely exposed to the different drugs for the indicated duration at 37°C in imaging medium comprising MEM without phenol red (Life Technologies), 20 mM HEPES, 33 mM glucose, 2 mM glutamine, 1 mM sodium pyruvate, and MACS NeuroBrew-21 (Miltenyi Biotec).
Immunocytochemistry and Quantitative Analysis
Immunochemical detections of GABAAR, gephyrin, synapsin, and PKC in cultured neurons were performed as previously described (Bannai et al., 2009, Niwa et al., 2012) using the following antibodies: rabbit anti-GABAAR γ2 subunit antibody (Niwa et al., 2012); mouse anti-gephyrin monoclonal antibody mAb7a (0.33 μg/ml, Synaptic Systems); mouse anti-synapsin I antibody (1:3,000, Synaptic Systems); rabbit polyclonal anti-synapsin I antibody (1:400, Merck Millipore); guinea pig anti-PKCα antibody (1 μg/ml, Frontier Institute); guinea pig anti-PKCβII antibody (1 μg/ml, Frontier Institute); and guinea pig anti-PKCγ antibody (1 μg/ml, Frontier Institute). Images were acquired on an inverted microscope equipped with oil-immersion objectives (60×, numerical aperture [NA] 1.42) and a cooled charge-coupled device (CCD) camera. All images from the same culture were acquired with the same sub-saturation exposure time. Quantification of the fluorescence signal was performed using MetaMorph software (Molecular Devices) as previously described (Bannai et al., 2009, Charrier et al., 2006, Lévi et al., 2004, Lévi et al., 2008, Niwa et al., 2012).
Electrophysiology
Whole-cell patch-clamp experiments on primary cultured neurons were carried out with solutions. The internal solution contained the following (in mM): CsCl2, 140; EGTA, 0.2; HEPES, 10; Mg-ATP, 2; GTP-Tris, 1; and Na-phosphocreatine, 2.5 (pH 7.2–7.3, 280–290 mOsm). The extracellular recording solution contained the following (in mM): NaCl, 147; KCl, 2.1; HEPES, 8.8; D-glucose, 8.8; CaCl2, 1.1; MgCl2, 1.1; and Pyruvic Acid, 0.026% (v/v) (pH 7.4, 310 mOsm).
For experiments on acute slice, hippocampal brain slices were prepared from P14–P21 BL56/J IP3R1−/− mice and WT littermates. The internal solution contained the following (in mM): CsCl2, 130; EGTA, 10; CaCl2, 1; MgCl2, 1; HEPES, 10; Mg-ATP, 2; GTP-Tris, 0.1; and Na-phosphocreatine, 2.5 (pH 7.4, 290–300 mOsm). The extracellular recording solution was the artificial cerebrospinal fluid (aCSF) solution and contained the following (in mM): NaCl, 125; KCl, 2.5; D-Glucose, 25; CaCl2, 2; MgCl2, 1; NaH2PO4, 1.25; and NaHCO3, 25 (320 mOsm).
Spontaneous mIPSCs were recorded in the whole-cell voltage-clamp configuration, in the presence of 2,3-Dihydroxy-6-nitrobenzo[f]quinoxaline-7-sulfonamide (NBQX, 10 μM), D-2-Amino-5-phosphonopentanoic acid (D-AP5, 50 μM), and TTX (1 μM). When required the extracellular recording solution was supplemented with 250 μM MCPG or vehicle (NaOH). The resistance of whole-cell patch pipettes was 3–5 MΩ. All experiments were performed at room temperature. The membrane potential was held at −70 mV. Under these recording conditions, GABAergic chloride currents were recorded as inward currents.
Production of a Rabbit GABAAR β3 Subunit Antiserum
The rabbit anti-GABAAR β3 subunit antiserum (anti-GABAAR β3) was raised as described previously (Todd et al., 1996). For the sub-cloning of fusion protein consisting of maltose-binding protein (MBP) and amino acids 345–408 of the mouse GABAAR β3, the DNA sequence corresponding to amino acid 345–408 of the GABAAR β3 was amplified by PCR, using FANTOM3 clone C630014N19 (RIKEN Genomic Sciences Research Complex) as a template (Carninci et al., 2005), and sub-cloned into pMAL-C vector (New England Biolabs).
Western Blot
For western blot analysis, the following primary antibodies were used: rabbit anti-GABAAR β3 antiserum (1:2,000); rabbit anti-PKCα antiserum (1:100,000, Sigma-Aldrich); guinea pig anti-PKCβII antibody (200 ng/ml, Frontier Institute); or guinea pig anti-PKCγ antibody (200 ng/ml, Frontier Institute). The primary antibodies were recognized using horseradish peroxidase (HRP)-coupled goat anti-rabbit IgG (1:5,000, GE Healthcare) or goat anti-guinea pig IgG (1:5,000, Cappel). Chemiluminescence from HRP reacted to Immobilon Western Chemiluminescent HRP Substrate (Merck Millipore) was detected by Imagequant LAS-4000 mini (GE Healthcare) and quantified using ImageJ.
Ca2+ Imaging
Ca2+ imaging was performed as described previously (Bannai et al., 2009, Niwa et al., 2012). Neurons were incubated with 0.5 μM fluo-4 AM (Life Technologies) and fluo-4 signal was acquired at 0.2 Hz at room temperature (24°C–26°C). The ratio of the fluorescence intensities F/F0, where F is a fluorescence intensity and F0 is the intensity at t = 0, was obtained after subtraction of the background fluorescence.
QD-SPT Experiments and Data Analysis
QD labeling and SPT of GABAARs were performed as previously described (Bannai et al., 2006). Rabbit anti-GABAARγ2 antibody (2.0 μg/ml; Niwa et al., 2012) was used for the labeling of GABAAR. Recording was performed at 37°C in the imaging medium using an inverted microscope (IX-70, -71, or -73, Olympus) equipped with an oil-immersion objective (60×, NA > 1.42, Olympus) and a cooled CCD camera (ORCA-II-ER, Hamamatsu Photonics) or an EM-CCD camera (Cascade, Roper Scientific; ImagEM, Hamamatsu Photonics). Fluorescent signals were detected using appropriate filter sets for QD (excitation: 455 ± 70 nm, emission: 605 ± 20 nm) and FM4-64 (excitation: 535 ± 15 nm, emission: 580 nm long pass). QD movies were recorded with an integration time of 76 ms with 512 consecutive frames (38.9 s) or 200 frames for IP3R1KO neurons. All recordings were finished within 30 min after labeling. QD-SPD data were analyzed using TI workbench software written by Dr. T. Inoue (Waseda University) as described previously (Bannai et al., 2009, Niwa et al., 2012).
Details of other methods are presented in the Supplemental Experimental Procedures.
Author Contributions
H.B. and F.N. developed the concept, designed and performed the experiments, analyzed data, and wrote the paper. M.W.S., A.N.S., M.A., A.M., and K.S. performed experiments and analyzed data. S.L. developed SPT and immunocytochemistry, provided conceptual advice, and wrote the paper. A.T. and K.M. supervised the whole project.
Acknowledgments
We thank the Research Resource Center (RIKEN BSI) for FANTOM3 clone and for supporting antibody production. We thank C. Hisatsune and S. Sakuragi for technical supports; T. Inoue, M. Dahan, V. Racine, and J.B. Sibarita for the analysis program; and Y. Oda, I. Mori, C. Yokoyama, and A.V. Terashima for their valuable comments on the manuscript. This work was supported by RIKEN (Special Postdoctoral Researcher [SPDR] and Foreign Postdoctoral Researcher [FPR] programs); KAKENHI (20700300, 25830058, 20220007, and “Glial assembly” 26117509); Japan Society for the Promotion of Science (JSPS, 06J06775); research grants from the Toyobo Biotechnology Foundation, Kato Memorial Bioscience Foundation, and Toray Science Foundation; and the Moritani Scholarship Foundation. Work in the A.T. laboratory was supported by the European Research Council (ERC) grant PlastInhib and the L’Agence Nationale de la Recherche (ANR) grant Synaptune, The Labex Memolife (ANR-10-LABX-54) and PSL Research University (ANR-11-IDEX-0001-02). We thank two anonymous reviewers for their insightful and constructive comments on the manuscript.
Published: December 17, 2015
Footnotes
This is an open access article under the CC BY-NC-ND license (http://creativecommons.org/licenses/by-nc-nd/4.0/).
Supplemental Information includes Supplemental Experimental Procedures, seven figures, and one table and can be found with this article online at http://dx.doi.org/10.1016/j.celrep.2015.12.002.
Contributor Information
Antoine Triller, Email: triller@biologie.ens.fr.
Katsuhiko Mikoshiba, Email: mikosiba@brain.riken.jp.
Supplemental Information
References
- Bannai H., Lévi S., Schweizer C., Dahan M., Triller A. Imaging the lateral diffusion of membrane molecules with quantum dots. Nat. Protoc. 2006;1:2628–2634. doi: 10.1038/nprot.2006.429. [DOI] [PubMed] [Google Scholar]
- Bannai H., Lévi S., Schweizer C., Inoue T., Launey T., Racine V., Sibarita J.B., Mikoshiba K., Triller A. Activity-dependent tuning of inhibitory neurotransmission based on GABAAR diffusion dynamics. Neuron. 2009;62:670–682. doi: 10.1016/j.neuron.2009.04.023. [DOI] [PubMed] [Google Scholar]
- Berridge M.J. Neuronal calcium signaling. Neuron. 1998;21:13–26. doi: 10.1016/s0896-6273(00)80510-3. [DOI] [PubMed] [Google Scholar]
- Bouthour W., Leroy F., Emmanuelli C., Carnaud M., Dahan M., Poncer J.C., Lévi S. A human mutation in Gabrg2 associated with generalized epilepsy alters the membrane dynamics of GABAA receptors. Cereb. Cortex. 2012;22:1542–1553. doi: 10.1093/cercor/bhr225. [DOI] [PubMed] [Google Scholar]
- Calamai M., Specht C.G., Heller J., Alcor D., Machado P., Vannier C., Triller A. Gephyrin oligomerization controls GlyR mobility and synaptic clustering. J. Neurosci. 2009;29:7639–7648. doi: 10.1523/JNEUROSCI.5711-08.2009. [DOI] [PMC free article] [PubMed] [Google Scholar]
- Carninci P., Kasukawa T., Katayama S., Gough J., Frith M.C., Maeda N., Oyama R., Ravasi T., Lenhard B., Wells C., FANTOM Consortium. RIKEN Genome Exploration Research Group and Genome Science Group (Genome Network Project Core Group) The transcriptional landscape of the mammalian genome. Science. 2005;309:1559–1563. doi: 10.1126/science.1112014. [DOI] [PubMed] [Google Scholar]
- Charrier C., Ehrensperger M.V., Dahan M., Lévi S., Triller A. Cytoskeleton regulation of glycine receptor number at synapses and diffusion in the plasma membrane. J. Neurosci. 2006;26:8502–8511. doi: 10.1523/JNEUROSCI.1758-06.2006. [DOI] [PMC free article] [PubMed] [Google Scholar]
- Choquet D., Triller A. The dynamic synapse. Neuron. 2013;80:691–703. doi: 10.1016/j.neuron.2013.10.013. [DOI] [PubMed] [Google Scholar]
- Eichler S.A., Meier J.C. E-I balance and human diseases - from molecules to networking. Front. Mol. Neurosci. 2008;1:2. doi: 10.3389/neuro.02.002.2008. [DOI] [PMC free article] [PubMed] [Google Scholar]
- Fujii S., Matsumoto M., Igarashi K., Kato H., Mikoshiba K. Synaptic plasticity in hippocampal CA1 neurons of mice lacking type 1 inositol-1,4,5-trisphosphate receptors. Learn. Mem. 2000;7:312–320. doi: 10.1101/lm.34100. [DOI] [PMC free article] [PubMed] [Google Scholar]
- Fujii H., Inoue M., Okuno H., Sano Y., Takemoto-Kimura S., Kitamura K., Kano M., Bito H. Nonlinear decoding and asymmetric representation of neuronal input information by CaMKIIα and calcineurin. Cell Rep. 2013;3:978–987. doi: 10.1016/j.celrep.2013.03.033. [DOI] [PubMed] [Google Scholar]
- Furuichi T., Simon-Chazottes D., Fujino I., Yamada N., Hasegawa M., Miyawaki A., Yoshikawa S., Guénet J.L., Mikoshiba K. Widespread expression of inositol 1,4,5-trisphosphate receptor type 1 gene (Insp3r1) in the mouse central nervous system. Receptors Channels. 1993;1:11–24. [PubMed] [Google Scholar]
- Gaiarsa J.L., Caillard O., Ben-Ari Y. Long-term plasticity at GABAergic and glycinergic synapses: mechanisms and functional significance. Trends Neurosci. 2002;25:564–570. doi: 10.1016/s0166-2236(02)02269-5. [DOI] [PubMed] [Google Scholar]
- Gerrow K., Triller A. Synaptic stability and plasticity in a floating world. Curr. Opin. Neurobiol. 2010;20:631–639. doi: 10.1016/j.conb.2010.06.010. [DOI] [PubMed] [Google Scholar]
- Goslin K., Asmussen H., Banker G. Rat hippocampal neurons in low-density culture. In: Banker G., Goslin K., editors. Culturing nerve cells. MIT press; Cambridge: 1998. pp. 339–370. [Google Scholar]
- Haider B., Duque A., Hasenstaub A.R., McCormick D.A. Neocortical network activity in vivo is generated through a dynamic balance of excitation and inhibition. J. Neurosci. 2006;26:4535–4545. doi: 10.1523/JNEUROSCI.5297-05.2006. [DOI] [PMC free article] [PubMed] [Google Scholar]
- Hensch T.K. Critical period regulation. Annu. Rev. Neurosci. 2004;27:549–579. doi: 10.1146/annurev.neuro.27.070203.144327. [DOI] [PubMed] [Google Scholar]
- Hisatsune C., Kuroda Y., Akagi T., Torashima T., Hirai H., Hashikawa T., Inoue T., Mikoshiba K. Inositol 1,4,5-trisphosphate receptor type 1 in granule cells, not in Purkinje cells, regulates the dendritic morphology of Purkinje cells through brain-derived neurotrophic factor production. J. Neurosci. 2006;26:10916–10924. doi: 10.1523/JNEUROSCI.3269-06.2006. [DOI] [PMC free article] [PubMed] [Google Scholar]
- Hisatsune C., Miyamoto H., Hirono M., Yamaguchi N., Sugawara T., Ogawa N., Ebisui E., Ohshima T., Yamada M., Hensch T.K. IP3R1 deficiency in the cerebellum/brainstem causes basal ganglia-independent dystonia by triggering tonic Purkinje cell firings in mice. Front. Neural Circuits. 2013;7:156. doi: 10.3389/fncir.2013.00156. [DOI] [PMC free article] [PubMed] [Google Scholar]
- Itoh S., Ito K., Fujii S., Kaneko K., Kato K., Mikoshiba K., Kato H. Neuronal plasticity in hippocampal mossy fiber-CA3 synapses of mice lacking the inositol-1,4,5-trisphosphate type 1 receptor. Brain Res. 2001;901:237–246. doi: 10.1016/s0006-8993(01)02373-3. [DOI] [PubMed] [Google Scholar]
- Jovanovic J.N., Thomas P., Kittler J.T., Smart T.G., Moss S.J. Brain-derived neurotrophic factor modulates fast synaptic inhibition by regulating GABA(A) receptor phosphorylation, activity, and cell-surface stability. J. Neurosci. 2004;24:522–530. doi: 10.1523/JNEUROSCI.3606-03.2004. [DOI] [PMC free article] [PubMed] [Google Scholar]
- Keenan C., Goode N., Pears C. Isoform specificity of activators and inhibitors of protein kinase C gamma and delta. FEBS Lett. 1997;415:101–108. doi: 10.1016/s0014-5793(97)01104-6. [DOI] [PubMed] [Google Scholar]
- Kilman V., van Rossum M.C., Turrigiano G.G. Activity deprivation reduces miniature IPSC amplitude by decreasing the number of postsynaptic GABA(A) receptors clustered at neocortical synapses. J. Neurosci. 2002;22:1328–1337. doi: 10.1523/JNEUROSCI.22-04-01328.2002. [DOI] [PMC free article] [PubMed] [Google Scholar]
- Kittler J.T., Thomas P., Tretter V., Bogdanov Y.D., Haucke V., Smart T.G., Moss S.J. Huntingtin-associated protein 1 regulates inhibitory synaptic transmission by modulating gamma-aminobutyric acid type A receptor membrane trafficking. Proc. Natl. Acad. Sci. USA. 2004;101:12736–12741. doi: 10.1073/pnas.0401860101. [DOI] [PMC free article] [PubMed] [Google Scholar]
- Kittler J.T., Chen G., Kukhtina V., Vahedi-Faridi A., Gu Z., Tretter V., Smith K.R., McAinsh K., Arancibia-Carcamo I.L., Saenger W. Regulation of synaptic inhibition by phospho-dependent binding of the AP2 complex to a YECL motif in the GABAA receptor gamma2 subunit. Proc. Natl. Acad. Sci. USA. 2008;105:3616–3621. doi: 10.1073/pnas.0707920105. [DOI] [PMC free article] [PubMed] [Google Scholar]
- Lévi S., Logan S.M., Tovar K.R., Craig A.M. Gephyrin is critical for glycine receptor clustering but not for the formation of functional GABAergic synapses in hippocampal neurons. J. Neurosci. 2004;24:207–217. doi: 10.1523/JNEUROSCI.1661-03.2004. [DOI] [PMC free article] [PubMed] [Google Scholar]
- Lévi S., Schweizer C., Bannai H., Pascual O., Charrier C., Triller A. Homeostatic regulation of synaptic GlyR numbers driven by lateral diffusion. Neuron. 2008;59:261–273. doi: 10.1016/j.neuron.2008.05.030. [DOI] [PubMed] [Google Scholar]
- Lévi S., Dahan M., Triller A. Labeling neuronal membrane receptors with quantum dots. Cold Spring Harb. Protoc. 2011;2011:prot5580. doi: 10.1101/pdb.prot5580. [DOI] [PubMed] [Google Scholar]
- Li L., Stefan M.I., Le Novère N. Calcium input frequency, duration and amplitude differentially modulate the relative activation of calcineurin and CaMKII. PLoS ONE. 2012;7:e43810. doi: 10.1371/journal.pone.0043810. [DOI] [PMC free article] [PubMed] [Google Scholar]
- Luscher B., Fuchs T., Kilpatrick C.L. GABAA receptor trafficking-mediated plasticity of inhibitory synapses. Neuron. 2011;70:385–409. doi: 10.1016/j.neuron.2011.03.024. [DOI] [PMC free article] [PubMed] [Google Scholar]
- Mann E.O., Mody I. Control of hippocampal gamma oscillation frequency by tonic inhibition and excitation of interneurons. Nat. Neurosci. 2010;13:205–212. doi: 10.1038/nn.2464. [DOI] [PMC free article] [PubMed] [Google Scholar]
- Mann E.O., Paulsen O. Role of GABAergic inhibition in hippocampal network oscillations. Trends Neurosci. 2007;30:343–349. doi: 10.1016/j.tins.2007.05.003. [DOI] [PubMed] [Google Scholar]
- Marsden K.C., Shemesh A., Bayer K.U., Carroll R.C. Selective translocation of Ca2+/calmodulin protein kinase IIalpha (CaMKIIalpha) to inhibitory synapses. Proc. Natl. Acad. Sci. USA. 2010;107:20559–20564. doi: 10.1073/pnas.1010346107. [DOI] [PMC free article] [PubMed] [Google Scholar]
- Martiny-Baron G., Kazanietz M.G., Mischak H., Blumberg P.M., Kochs G., Hug H., Marmé D., Schächtele C. Selective inhibition of protein kinase C isozymes by the indolocarbazole Gö 6976. J. Biol. Chem. 1993;268:9194–9197. [PubMed] [Google Scholar]
- Maruyama T., Kanaji T., Nakade S., Kanno T., Mikoshiba K. 2APB, 2-aminoethoxydiphenyl borate, a membrane-penetrable modulator of Ins(1,4,5)P3-induced Ca2+ release. J. Biochem. 1997;122:498–505. doi: 10.1093/oxfordjournals.jbchem.a021780. [DOI] [PubMed] [Google Scholar]
- Matsumoto M., Nakagawa T., Inoue T., Nagata E., Tanaka K., Takano H., Minowa O., Kuno J., Sakakibara S., Yamada M. Ataxia and epileptic seizures in mice lacking type 1 inositol 1,4,5-trisphosphate receptor. Nature. 1996;379:168–171. doi: 10.1038/379168a0. [DOI] [PubMed] [Google Scholar]
- Mikoshiba K. Role of IP3 receptor in development. Cell Calcium. 2011;49:331–340. doi: 10.1016/j.ceca.2010.12.006. [DOI] [PubMed] [Google Scholar]
- Moss S.J., Doherty C.A., Huganir R.L. Identification of the cAMP-dependent protein kinase and protein kinase C phosphorylation sites within the major intracellular domains of the beta 1, gamma 2S, and gamma 2L subunits of the gamma-aminobutyric acid type A receptor. J. Biol. Chem. 1992;267:14470–14476. [PubMed] [Google Scholar]
- Muir J., Arancibia-Carcamo I.L., MacAskill A.F., Smith K.R., Griffin L.D., Kittler J.T. NMDA receptors regulate GABAA receptor lateral mobility and clustering at inhibitory synapses through serine 327 on the γ2 subunit. Proc. Natl. Acad. Sci. USA. 2010;107:16679–16684. doi: 10.1073/pnas.1000589107. [DOI] [PMC free article] [PubMed] [Google Scholar]
- Nabavi S., Kessels H.W., Alfonso S., Aow J., Fox R., Malinow R. Metabotropic NMDA receptor function is required for NMDA receptor-dependent long-term depression. Proc. Natl. Acad. Sci. USA. 2013;110:4027–4032. doi: 10.1073/pnas.1219454110. [DOI] [PMC free article] [PubMed] [Google Scholar]
- Newton A.C. Regulation of protein kinase C. Curr. Opin. Cell Biol. 1997;9:161–167. doi: 10.1016/s0955-0674(97)80058-0. [DOI] [PubMed] [Google Scholar]
- Newton A.J., Kirchhausen T., Murthy V.N. Inhibition of dynamin completely blocks compensatory synaptic vesicle endocytosis. Proc. Natl. Acad. Sci. USA. 2006;103:17955–17960. doi: 10.1073/pnas.0606212103. [DOI] [PMC free article] [PubMed] [Google Scholar]
- Nishiyama M., Hong K., Mikoshiba K., Poo M.M., Kato K. Calcium stores regulate the polarity and input specificity of synaptic modification. Nature. 2000;408:584–588. doi: 10.1038/35046067. [DOI] [PubMed] [Google Scholar]
- Niwa F., Bannai H., Arizono M., Fukatsu K., Triller A., Mikoshiba K. Gephyrin-independent GABA(A)R mobility and clustering during plasticity. PLoS ONE. 2012;7:e36148. doi: 10.1371/journal.pone.0036148. [DOI] [PMC free article] [PubMed] [Google Scholar]
- Nusser Z., Cull-Candy S., Farrant M. Differences in synaptic GABA(A) receptor number underlie variation in GABA mini amplitude. Neuron. 1997;19:697–709. doi: 10.1016/s0896-6273(00)80382-7. [DOI] [PubMed] [Google Scholar]
- Nusser Z., Hájos N., Somogyi P., Mody I. Increased number of synaptic GABA(A) receptors underlies potentiation at hippocampal inhibitory synapses. Nature. 1998;395:172–177. doi: 10.1038/25999. [DOI] [PubMed] [Google Scholar]
- Petrini E.M., Barberis A. Diffusion dynamics of synaptic molecules during inhibitory postsynaptic plasticity. Front. Cell. Neurosci. 2014;8:300. doi: 10.3389/fncel.2014.00300. [DOI] [PMC free article] [PubMed] [Google Scholar]
- Petrini E.M., Ravasenga T., Hausrat T.J., Iurilli G., Olcese U., Racine V., Sibarita J.B., Jacob T.C., Moss S.J., Benfenati F. Synaptic recruitment of gephyrin regulates surface GABAA receptor dynamics for the expression of inhibitory LTP. Nat. Commun. 2014;5:3921. doi: 10.1038/ncomms4921. [DOI] [PMC free article] [PubMed] [Google Scholar]
- Sieghart W., Fuchs K., Tretter V., Ebert V., Jechlinger M., Höger H., Adamiker D. Structure and subunit composition of GABA(A) receptors. Neurochem. Int. 1999;34:379–385. doi: 10.1016/s0197-0186(99)00045-5. [DOI] [PubMed] [Google Scholar]
- Smith K.R., Davenport E.C., Wei J., Li X., Pathania M., Vaccaro V., Yan Z., Kittler J.T. GIT1 and βPIX are essential for GABA(A) receptor synaptic stability and inhibitory neurotransmission. Cell Rep. 2014;9:298–310. doi: 10.1016/j.celrep.2014.08.061. [DOI] [PMC free article] [PubMed] [Google Scholar]
- Smolders I., Lindekens H., Clinckers R., Meurs A., O’Neill M.J., Lodge D., Ebinger G., Michotte Y. In vivo modulation of extracellular hippocampal glutamate and GABA levels and limbic seizures by group I and II metabotropic glutamate receptor ligands. J. Neurochem. 2004;88:1068–1077. doi: 10.1046/j.1471-4159.2003.02251.x. [DOI] [PubMed] [Google Scholar]
- Stefan M.I., Edelstein S.J., Le Novère N. An allosteric model of calmodulin explains differential activation of PP2B and CaMKII. Proc. Natl. Acad. Sci. USA. 2008;105:10768–10773. doi: 10.1073/pnas.0804672105. [DOI] [PMC free article] [PubMed] [Google Scholar]
- Sugawara T., Hisatsune C., Le T.D., Hashikawa T., Hirono M., Hattori M., Nagao S., Mikoshiba K. Type 1 inositol trisphosphate receptor regulates cerebellar circuits by maintaining the spine morphology of purkinje cells in adult mice. J. Neurosci. 2013;33:12186–12196. doi: 10.1523/JNEUROSCI.0545-13.2013. [DOI] [PMC free article] [PubMed] [Google Scholar]
- Takei K., Shin R.M., Inoue T., Kato K., Mikoshiba K. Regulation of nerve growth mediated by inositol 1,4,5-trisphosphate receptors in growth cones. Science. 1998;282:1705–1708. doi: 10.1126/science.282.5394.1705. [DOI] [PubMed] [Google Scholar]
- Todd A.J., Watt C., Spike R.C., Sieghart W. Colocalization of GABA, glycine, and their receptors at synapses in the rat spinal cord. J. Neurosci. 1996;16:974–982. doi: 10.1523/JNEUROSCI.16-03-00974.1996. [DOI] [PMC free article] [PubMed] [Google Scholar]
- Triller A., Choquet D. Surface trafficking of receptors between synaptic and extrasynaptic membranes: and yet they do move! Trends Neurosci. 2005;28:133–139. doi: 10.1016/j.tins.2005.01.001. [DOI] [PubMed] [Google Scholar]
- Triller A., Choquet D. New concepts in synaptic biology derived from single-molecule imaging. Neuron. 2008;59:359–374. doi: 10.1016/j.neuron.2008.06.022. [DOI] [PubMed] [Google Scholar]
- Yizhar O., Fenno L.E., Prigge M., Schneider F., Davidson T.J., O’Shea D.J., Sohal V.S., Goshen I., Finkelstein J., Paz J.T. Neocortical excitation/inhibition balance in information processing and social dysfunction. Nature. 2011;477:171–178. doi: 10.1038/nature10360. [DOI] [PMC free article] [PubMed] [Google Scholar]
- Yoshioka M., Yamazaki Y., Fujii S., Kaneko K., Kato H., Mikoshiba K. Intracellular calcium ion dynamics involved in long-term potentiation in hippocampal CA1 neurons in mice lacking the IP3 type 1 receptor. Neurosci. Res. 2010;67:149–155. doi: 10.1016/j.neures.2010.03.002. [DOI] [PubMed] [Google Scholar]
Associated Data
This section collects any data citations, data availability statements, or supplementary materials included in this article.