

Abstract
Sporadic ALS patients display heterogeneous immune pathways in peripheral blood mononuclear cells (PBMCs). We tested nine sALS patients and one unaffected identical twin of an index case by RNA-Seq of PBMCs. The inflammatory patients (n = 3) clustered into a subset with an inflammatory Th1/Th17 signature and the non-inflammatory patients (n = 7) into another subset with a B cell signature. The inflammatory subset was remarkable for granulocyte and agranulocyte diapedesis, hepatic fibrosis, roles of cytokines and metalloproteases. The non-inflammatory subset was highlighted by degradation of vitamin E, serotonin and nucleotides, altered T cell and B cell signaling, agranulocyte diapedesis, and up regulation of B cell genes. Identification of these differentially regulated pathways in sALS patients may guide the choice of anti-inflammatory therapies.
Keywords: Amyotrophic lateral sclerosis, immune pathways, tocilizumab, hepatic fibrosis, vitamin E
Introduction
The presence of inflammation in the spinal cord of sporadic amyotrophic lateral sclerosis (sALS) patients is documented by immunohistochemical demonstration of activated microglia, astrocytes, and activated complement components [1], along with the infiltration by dendritic cells, macrophages [2], and IL-17A-positive CD4 and CD8 T cells and mast cells [3]. Inflammatory macrophages phagocytize both normal and apoptotic neurons in the ALS spinal cord [4] and infiltrate the spinal cord of sALS patients [3] and animal models of ALS, contributing to disease progression [5,6]. Others claim that only T cells cross the blood-brain barrier and activate microglia [7], but this is inconsistent with the results in experimental models [5,6] and infiltration by monocyte/macrophages in the ALS spinal cord [8]. The inflammatory cytokines IL-1 and IL-6 are induced in peripheral blood mononuclear cells (PBMCs) of sALS patients by mutant or aggregated wild-type superoxide dismutase-1 (SOD-1) [3]. IL-6 and TGF-β are present in the serum of sALS patients early in the disease and IL-17A is found in the mid-course of the disease [4]. Th17 cells have been increasingly found in ALS patients [3,9,10], and ALS has been associated with prior history of autoimmune diseases, including multiple sclerosis, myasthenia gravis and systemic lupus erythematosus [11].
Thus inflammation, including autoimmune inflammation, is documented in sALS but anti-inflammatory therapy has not yet been proven successful. A recent study identified heterogeneous, Th1, Th17, and IL-6 driven inflammatory pathways in ALS patients [10]. Specific neurotoxic mechanisms include Th17 cell disruption of the blood-brain barrier [12] and IL-6 trans-signaling [13]. Although the clinical trial of celecoxib failed [14], recent anti-inflammatory approaches against ALS are promising [15,16]. In addition, the lipidic mediator resolvin D1 (RvD1) attenuated IL-6 and TNF-α production in ALS macrophages, suggesting beneficial role of omega-3 supplementation [4].
The recognition of IL-6-driven inflammation in inflammatory sALS patients [16] has stimulated a pending clinical trial of the IL-6 receptor antibody tocilizumab (ActemraR). As shown in a previous cross-sectional study, one subgroup of “inflammatory” sALS patients had a highly increased expression of inflammatory cytokines, in particular IL1, IL6, and IL8, chemokines, metalloproteinases and transcription factors, whereas the “non-inflammatory” group had a near normal expression, except for increased chemokines CXCL9, CXCL10 and CXCL11 [17]. Two “inflammatory” patients responded to ActemraR therapy by down regulation of inflammatory genes [16]. To develop a scheme for sub grouping sALS patients for an appropriate anti-inflammatory therapy, we have investigated the transcriptome of ALS patients’ PBMCs for the signatures of signaling pathways.
Materials and methods
Patients and controls
The immune and genetic investigation had institutional and ethical review board approval. The study population included ALS patients from a previous study [16] and a pair of twins discordant in the diagnosis of ALS (Figure 1A). The assignment to the previously described inflammatory group was based on RT PCR expression of IL-1β and IL-6 in PBMCs [16] with the threshold value (Ct) at most time-points < 24 cycles; in “non-inflammatory” patients , the threshold Ct was ≥ 24 cycles. Three patients received ActemraR infusions from their private physicians.
Figure 1.
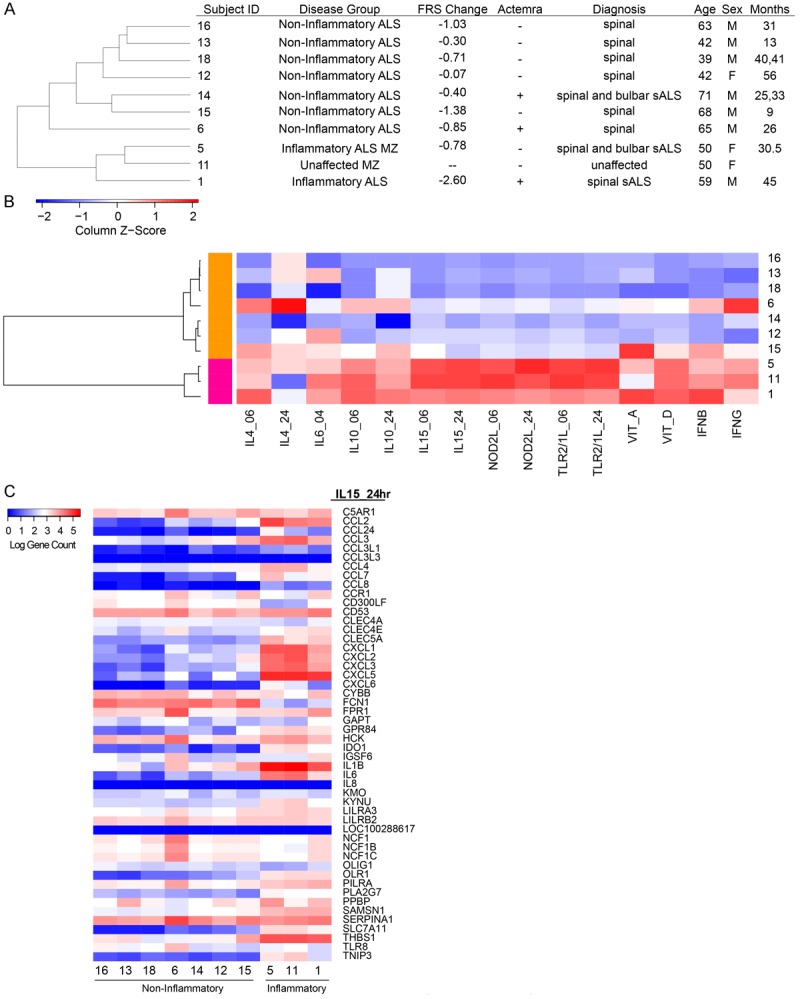
Unsupervised clustering of patient population. A. Patient disease status and demographics ordered by correlation-based cluster of PBMC gene counts. B. Hierarchical clustering dendrogram of ALS blood expression measured by their relative enrichment (Z-score) for immune perturbation signatures across the ALS samples. Unique gene signatures derived from adherent PBMC stimulated by perturbation at 6 h or 24 h as indicated. Each square represents the enrichment score of the top 50 unique genes of a signature (column) for a patient (row) with respect to the other patients, where red indicates a higher enrichment and blue indicates a lower enrichment score of the signature genes. Patients are organized into two main clusters by correlation, where magenta includes inflammatory patients 1, 5 and 11. The orange cluster includes non-inflammatory patients 6, 12, 13, 14, 15, 16 and 18. C. Transcriptional responses of the down-stream genes in the IL-15 pathway. Note downregulation of IL-6 responses but heterogeneity in IL-1beta responses in “non-inflammatory” patients.
RT PCR assay of inflammatory gene mRNAs
The assay was done using a custom array of inflammatory genes (SABiosciences) on the Roche LightCycler using the ΔΔCt method [29]. A lower number of cycles (Ct) indicate a higher inflammation.
Th17 cell assay
PBMCs were isolated by the ficoll-hypaque gradient method, washed with 1XPBS and re-suspended in completed medium. 0.5-1.0×10⁶ cells were incubated with medium, or medium with superoxide dismutase1 (SOD-1) or SOD-1 (2 µg/ml) plus tocilizumab (10 µg/ml) for 20 hours, and in presence of Brefeldin A (Golgi-plug) (1 µl/ml) (BD Biosciences) for last 6 hours. The cells were harvested and washed with a FACS buffer (PBS in 0.02% NaN3 (wt/vol) and 0.5% BSA), labeled with FITC-conjugated anti-CD3 antibodies, washed, fixed and permeabilized with cyofix/cytoperm (BD Biosciences) solution according to the manufacturer protocol and stained by PE or APC-conjugated anti-IL-17 (BD Biosciences, San Diego, CA). Flow cytometry was performed using a FACSCalibur instrument. Data were analyzed using FlowJo software (Ashland, OR) with lymphocyte gate, based on forward and side scatter.
Patient expression profiling
RNA-seq was performed on patient PBMCs using standard Illumina RNA-seq library construction protocols. RNA-seq libraries were sequenced on Illumina HiSeq 2000. Reads were aligned to the hg19 reference genome using TopHat [30]. Gene counts were quantified with HTSeq and normalized with DESeq, followed by adding a pseudo count of 1 for each gene [31]. To cluster the patient PBMC RNA-Seq data, gene expression signatures were identified from microarray intensity values of published works in which PBMC derived monocytes were stimulated by IL4 (IL4_06, IL4_24), IL10 (IL10_06, IL10_24), IL15 (IL15_06, IL15_24), NOD2L (NOD2L_06, NOD2L_24), TLR2/1L (TLR2/1L_06, TLR2/1L_24), Vitamin A (VIT_A), or Vitamin D (VIT_D) at different periods of exposure [18-20]. fRMA was used for normalization of the microarray intensity values [32]. To identify genes highly expressed in the stimulated monocytes, the ratio of the median intensity value of a perturbation set to the median intensity value of their respective control set was used to rank the genes. The top 50 ranking genes were chosen for each perturbation to serve as the signature for high expression. Additional signatures include the genes induced by interferon-β (IFN-β) and interferon-γ (IFN-γ) from IFN-treated PBMCs [33]. For each patient, a signature expression value was determined by calculating the arithmetic mean of the log10 gene count across the 50 genes within a signature for each signature. Patients were subsequently clustered on their set of mean signature values distanced by correlation.
Pathway enrichment analysis
Differentially expressed genes between the inflammatory patients (1, 5, and 11) and non-inflammatory patients (6, 12, 13, 14, 15, 16, and 18) were detected using DESeq (Anders et al. 2010). The genes were ranked by the fold change expression of the inflammatory patients to the non-inflammatory patients. To identify pathways enriched in the high expression genes among the inflammatory patients, the top 750 genes with a log2 fold change > 2 and an FDR < 0.05 were submitted to QIAGEN’s Ingenuity® Pathway Analysis (IPA®, QIAGEN Redwood City, www.qiagen.com/ingenuity). The bottom 539 genes with a log2 fold change < -2 and an FDR < 0.05 were submitted to Ingenuity’s pathway analysis tool to identify enriched pathways for higher expression genes among the non-inflammatory patients.
Results
Clustering of sporadic ALS patients according to the signatures of Th1 and B-cell pathways
Clinical and demographic data of nine sALS patients and one identical non-affected twin of the patient #5 from a previous study [16] are displayed (Figure 1A). Through an unsupervised clustering method, the sALS patients #6, 12, 13, 14, 15, 16 and 18 were tightly clustered together based on the expression of 25,367 genes, while sALS patients #1, 5, and 11 formed a second cluster (Supplemental Figure 1).
Clinical and demographic data of nine sALS patients and one identical non-affected twin of the patient #5 from a previous study [16] are displayed (Figure 1A). Through an unsupervised clustering method, the sALS patients #6, 12, 13, 14, 15, 16 and 18 were tightly clustered together based on the expression of 25,367 genes, while sALS patients #1, 5, and 11 formed a second cluster (Supplemental Figure 1).
To characterize the inflammatory state of the sALS patients, we intersected their PBMC mRNA expression profiles with gene expression signatures induced by activation of immune cells. These signatures are derived from previous studies involving the stimulation of adherent PBMCs with Th1-and Th2-like cytokines (IL-4, IL-10, IL-15, IFN-β, or IFN-γ), microbial ligands to innate immune receptors (NOD2L, TLR2/1L), and the vitamins A and D [18-20]. We generated a list of unique signature genes that were upregulated in response to each of these perturbations (see Methods). The relative enrichment score (Z-score) of each perturbation signature across the ALS blood samples was clustered and represented as a heat map of the enrichment score (Figure 1B), in which the ALS profiles are clustered based on their signature enrichment. Strikingly, we find that this analysis also generated two contrasting groups, much as the previous one in Figure 1A. This allows us to characterize the larger of the two groups (patients 16, 13, 18, 6, 14, 12, and 15) as B-cell “noninflammatory”, as it has lower levels of IL-15, NOD2L, and TLR2/1L-induced gene signatures in comparison to the Th1 (patients 5,11, and 1) “inflammatory” group (Figure 1B). We find that the cytokine response signatures of the noninflammatory group are more heterogeneous. The patient #6 had elevated levels of IL-4 and IFNγ signatures, the patient #15 showed higher levels of the vitamin A program, and the patients #6, 12, 16, and 18 had higher levels of both the ligands APRIL and BAFF and the receptors BCMA and TACI (Supplemental Figure 2). The transcriptional responses of the down-stream genes in the IL-15 pathway (Figure 1C) separate the patients in a greater detail and confirmed that some patients had a mixed pattern (e.g. patient #6 and #15).
Clustering of sporadic ALS patients with follow-up samples
A follow-up set of RNA-Seq samples were available for patients #18 and 14 and clustered on the expression of 25,367 genes along with other patient samples. The paired set of samples 18_R1, 18_R2, and 14_R1, 14_R2 reveal tight clustering within patients that is indicative of high correlation in gene expression profiles from the same individual at different time points (Supplemental Figure 1). This suggests that the gene expression signatures are quite robust over time, although they manifest some differences resulting from the treatment or disease progression.
Enriched pathways of high expression genes in inflammatory patients
We next asked whether the genes that were differentially expressed in the inflammatory and noninflammatory groups were enriched for certain functions and pathways using the Ingenuity Pathway Analysis tool (QIAGEN’s Ingenuity Pathway Analysis IPA, QIAGEN Redwood City <http://www.qiagen.com/ingenuity>. Accessed 2015 Mar 5). We found that the pathways enriched among the inflammatory patients include granulocyte and agranulocyte adhesion and diapedesis, hepatic fibrosis, differential regulation of cytokine production in macrophages and T helper cells by IL-17A and IL-17F, inhibition of matrix metalloproteases, atherosclerosis signaling, and IL6-signaling (Figure 2A). Genes among the IL-6 signaling pathway include IL6 itself and many genes downstream of the IL-6 responsive element (TSG6, COL1A1, and IL8) (Figure 2B). The differential regulation of cytokine production in macrophages and T helper cells by IL-17A and IL-17F pathways include pro-inflammatory genes that are induced in macrophages by either IL-17A or IL-17F (IL-1β, IL-6, IL-10, IL-12, IL-13, CCL2, CCL3, and G-CSF) (Figure 2C).
Figure 2.
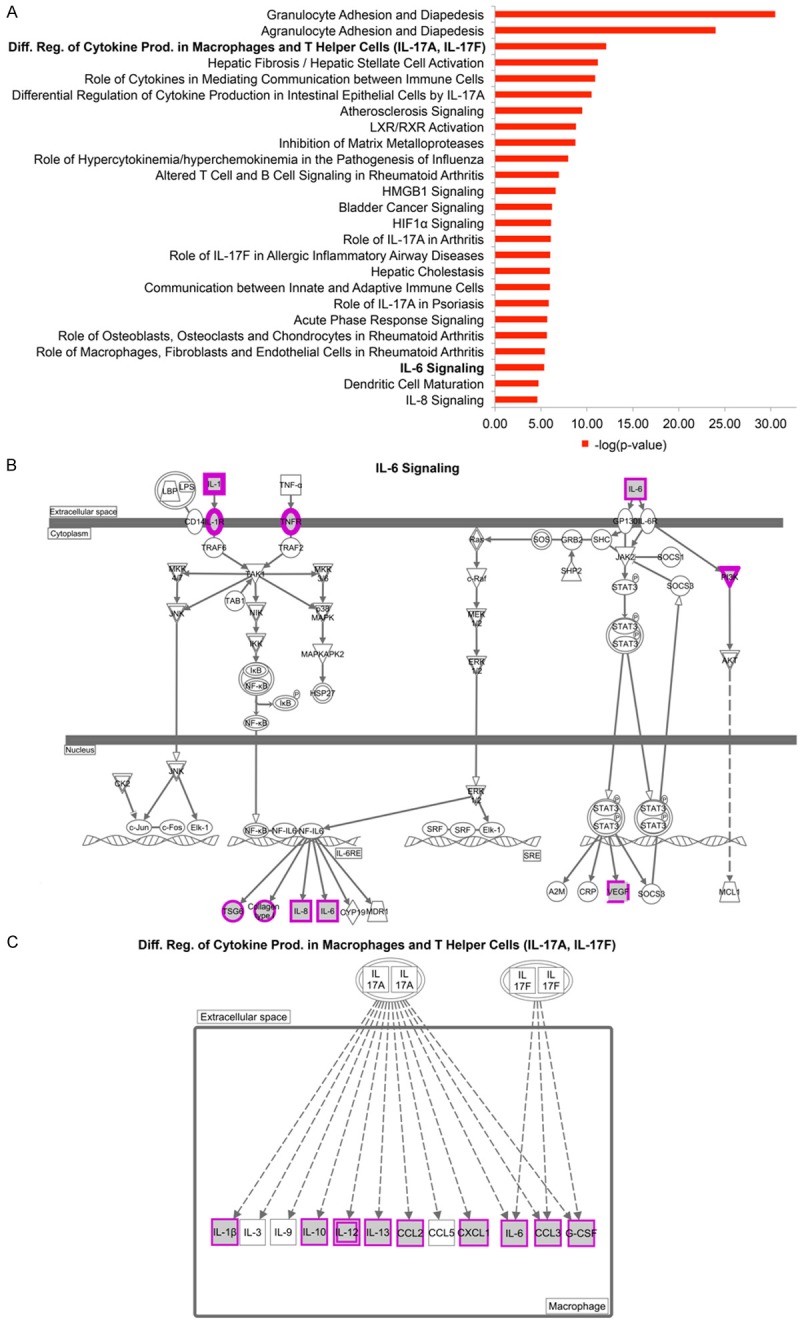
Pathway Enrichment of Higher Expression Genes in Inflammatory Patients. A. The top 25 significant canonical pathways from the high expression genes in inflammatory patients. B. IL-6 signaling pathway. Highly expressed genes in inflammatory patients are marked in purple. Omitted from the figure is the pathway involved in T helper cells. C. Differential regulation of cytokine production in macrophages and T helper cells by IL-17A and IL-17F pathways.
Enriched pathways of high expression genes in non-inflammatory patients
Pathways enriched among the genes that have higher expression in non-inflammatory patients include alpha-tocopherol degradation, altered cytokine signaling, agranulocyte adhesion, serotonin degradation, retinoate biosynthesis, B cell development, atherosclerosis signaling, and other pathways (Figure 3A). Highly expressed genes in non-inflammatory patients include (a) the genes CYP4F2 and CYP4F3 involved in alpha-tocopherol degradation (Figure 3B); (b) the genes in the B cell development pathway including the members of MHCII (HLA-DMA, HLA-DMB, HLA-DRB1, HLA-DRB5) (Figure 3C); and (c) the genes SULT1A1, SULT1B1, DHRS9, ALDH2, and ALDH1A1 involved in serotonin degradation (Figure 3D). In addition, the ligand for the B cell developmental pathway (APRIL) and the receptors (BCMA/TNFRSF17 and BCR) were heterogeneously overexpressed in non-inflammatory patients (Supplemental Figure 2).
Figure 3.

Pathway Enrichment of Higher Expression Genes in Non-Inflammatory Patients. A. The top 25 significant canonical pathways from the high expression genes in non-inflammatory patients. B. α-tocopherol (vitamin E) degradation. C. B-Cell development pathway with high expression genes in the non-inflammatory patients marked in purple. D. Serotonin degradation pathway. Highly expressed genes in inflammatory patients are marked in purple. E. Retinoate Biosynthesis I pathway. Highly expressed genes in inflammatory patients are marked in purple.
Th17 cells are increased in the inflammatory subgroup and are inhibited by tocilizumab
In freshly isolated PBMCs, Th17 cells were increased in the inflammatory subgroup patients in comparison to the non-inflammatory group patients and control subjects (Figure 4). After overnight stimulation by fibrillar SOD-1, Th17 increased 2- to 5-fold in the inflammatory subgroup subjects but did not change significantly in the non-inflammatory subgroup and control subjects. Overnight treatment with tocilizumab reduced (N.S.) Th17 induction by SOD-1 in the inflammatory subgroup, but did not have an effect in the non-inflammatory subgroup.
Figure 4.
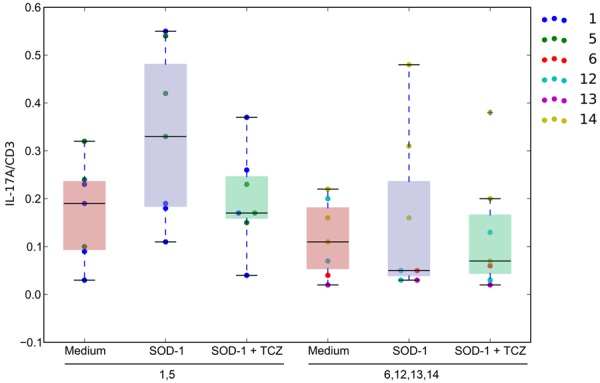
Th17 Cell Assay of Patient PBMCs. The distribution of the % of IL-17/CD3 cells in lymphocytes grouped by inflammatory patients (columns 1, 2, and 3) and non-inflammatory patients (columns 4, 5, and 6). The red distributions are the Th17 to CD3 cell ratios in medium. The blue distributions are the Th17 to CD3 cell ratios of PBMCs stimulated by SOD-1. The green distributions are the Th17 to CD3 cell ratios of PBMCs stimulated by SOD-1 in the presence of tocilizumab.
Inflammatory cytokines are down-regulated by ActemraR therapy in the “inflammatory” subset but not in the “non-inflammatory” subset
A brief follow-up of patients #1 and #6 was previously published [16]. Here we show that on a longitudinal follow-up of the inflammatory patient #1, and the non-inflammatory patients #6 and 14, inflammatory or non-inflammatory transcription, respectively, appeared to be a stable biomarker of these sALS patients in the course of the disease (600-1400, 100 to 600, and 750 to 950 days after onset, respectively) (Figure 5). Extended follow-up of the inflammatory patient 1 revealed up regulation of inflammatory cytokines on entry into the ActemraR therapy in May 2012 (913 days after onset), but, following the start of therapy, down regulation of inflammatory cytokines for 4 months with immediate down regulation 2 hours after infusion of Actemra (see Figure 5D). The patient then developed a brief resistance to ActemraR therapy for 2 months followed again by attenuation of inflammation. However, he stopped therapy in February 2013 (1200 days after onset) and afterwards became more inflammatory and expired 1930 days after onset. Two non-inflammatory sALS patients were given a short course of ActemraR therapy. They had low transcription of inflammatory cytokines on entry into the therapy, but their inflammatory cytokine transcription actually increased during the therapy, which was then stopped (Figure 5B and 5C). To determine the immediate response to Actemra, inflammatory cytokine transcription was measured before and 1-2 hr after treatment. For patient 1, the IL1A and IL8 transcription decreased immediately after the infusion (Figure 5D). For patient 6, all inflammatory cytokine, with the exception of IL1A, increased following the infusion (Figure 5E).
Figure 5.

Longitudinal Course of the Transcription of IL-1alpha, IL-1 beta, IL6 and IL-8 in three ALS patients. A. Longitudinal course of inflammatory patient #1; B. Longitudinal course of a non-inflammatory patient #6; C. Longitudinal course of a “non-inflammatory“ patient #14; D. The rescaled transcriptional response of patient 1 during the Actemra treatment period. E. The rescaled transcriptional response of patient 14 during the Actemra treatment period. The blue dots indicate the difference of the observed IL-1α transcriptional level to the mean IL-1α level. The green dots indicate the difference of the observed IL-1β transcriptional level to the mean IL-1β level. The red dots indicate the difference of the observed IL-6 transcriptional level from the mean IL-6 level. The light blue dots indicate the difference of the observed IL-8 transcriptional level to the mean IL-8 level. All mean transcriptional level was calculated across all samples and days. The grey box indicates the days after onset of ALS in which transcriptional levels were measured after Actemra treatment. The dashed red line indicates the days after onset in which PBMCs were sampled for RNA-Seq analysis. Up arrows indicate the level of a positive (i.e. decreased transcription) immediate response to Actemra for the corresponding transcriptional marker, while down arrows indicate the level of a negative (increased transcription) response to Actemra.
Discussion
In this study, we confirmed the heterogeneity of inflammation in sALS patients, which was previously observed and believed to be important for selection of appropriate patients for tocilizumab (Actermra) therapy [16]. Only “inflammatory” patients are likely to respond to Actemra. Although inflammation has been demonstrated in a longitudinal study [16] and cross-sectional studies of sALS patients [10,21], the progression of inflammation since the beginning to the end has not been completely analyzed. Here we observe that the inflammatory or non-inflammatory phenotype was maintained throughout the observed disease course, which however, started only 600 days after onset in the “inflammatory” patient. Thus, it is still plausible that a non-inflammatory phase preceded the inflammatory phase early after onset, as described by S. Appel’s group [22]. It will be important to follow ALS patients over time for establishing their “inflammatory” phenotype, as “non-inflammatory” ALS patients may become “inflammatory” and respond to Actemra therapy.
The “inflammatory” patient #1 had inflammatory phenotype before and after treatment with ActemraR, but became less inflammatory during ActemraR therapy, except for a transitory resistance to this therapy probably due to reduced uptake and degradation of IL-6 caused by tocilizumab [23]. The “inflammatory” patients had more Th17 cells in comparison to “non-inflammatory” patients. Tocilizumab therapy in vitro and in vivo attenuated Th17 cell induction as well as inflammatory cytokines. The patients in the “non-inflammatory” subgroup had low transcription and production of inflammatory cytokines and chemokines at baseline but, in response to the ActemraR therapy, two patients actually increased the transcription of IL-6 and other inflammatory cytokines.
The up regulated Th1 and B-cell pathways clarify certain features of the pathophysiology of sALS patients. In both groups of patients, immune cell adhesion and diapedesis explain the infiltration by immune cells (granulocytes and agranulocytes) of the affected spinal cord segments [3]. In the inflammatory group, hepatic fibrosis and stellate cell activation is consistent with fibrosis and liver dysfunction in sALS patients [24]. Atherosclerosis signaling could be related to vascular changes with downregulation of tight junctions caused by SOD-1 in an animal model [25] and to inflammation caused by SOD-1 in human macrophages in vitro [3]. Increased α-tocopherol degradation may lead to deficiency of vitamin E. Patients with familial isolated vitamin E deficiency have neurological disorders characteristic of vitamin E deficiency such as cerebellar ataxia and dysarthria [26]. Importantly, in a large study of ALS incidence, long-term vitamin E supplement use was associated with lower ALS rates [27]. Increased serotonin degradation may be related to depression, which is common in ALS patients, as 37% patients are taking anti-depressant medication [28]. Increased retinoate may contribute to osteoporosis in ALS patients.
In conclusion, this study describes heterogeneity of signature pathways in sALS patients that may inform personalized therapy with drugs targeting various pathways, including inflammatory, vitamin, cytochrome P450 superfamily of enzymes, and B-cell developmental pathways. Currently, tocilizumab (Actemra) has shown positive effects in Th1 patients. However, tocilizumab would not be beneficial in the non-inflammatory subset of patients who might benefit from other approaches, such as a therapy targeted at B cells, since the B cell activation and survival genes were upregulated in these patients. These results provide a new rationale for a targeted molecular therapy of inflammatory sALS patients guided in a personalized fashion by the PBMC transcriptome.
Acknowledgements
We thank patients and families of patients in the study. LL was supported by 5P01GM099134-03, DM was supported by 1P50AR063020-01, and RRS was supported by R01 AI80778.
Disclosure of conflict of interest
M.F. received paid travel to meetings and honoraria for consultations from Smartfish AS, Oslo, Norway.
Authors’ contribution
MF and MP designed research. LL and DM performed bioinformatics analysis. RH, LR, AR performed molecular studies. MF, MP, LL, BS, SW, and RR analyzed the data. MF, MP, LL, RRS wrote the paper. All authors read and approved the final manuscript.
Supporting Information
References
- 1.McGeer PL, McGeer EG. Inflammatory processes in amyotrophic lateral sclerosis. Muscle Nerve. 2002;26:459–70. doi: 10.1002/mus.10191. [DOI] [PubMed] [Google Scholar]
- 2.Henkel JS, Engelhardt JI, Siklós L, Simpson EP, Kim SH, Pan T, Goodman JC, Siddique T, Beers DR, Appel SH. Presence of dendritic cells, MCP-1, and activated microglia/macrophages in amyotrophic lateral sclerosis spinal cord tissue. Ann Neurol. 2004;55:221–35. doi: 10.1002/ana.10805. [DOI] [PubMed] [Google Scholar]
- 3.Fiala M, Chattopadhay M, La Cava A, Tse E, Liu G, Lourenco E, Eskin A, Liu PT, Magpantay L, Tse S, Mahanian M, Weitzman R, Tong J, Nguyen C, Cho T, Koo P, Sayre J, Martinez-Maza O, Rosenthal MJ, Wiedau-Pazos M. IL-17A is increased in the serum and in spinal cord CD8 and mast cells of ALS patients. J Neuroinflammation. 2010;7:76–90. doi: 10.1186/1742-2094-7-76. [DOI] [PMC free article] [PubMed] [Google Scholar]
- 4.Liu G, Fiala M, Mizwicki MT, Sayre J, Magpantay L, Siani A, Mahanian M, Chattopadhyay M, La Cava A, Wiedau-Pazos M. Neuronal phagocytosis by inflammatory macrophages in ALS spinal cord: inhibition of inflammation by resolvin D1. Am J Neurodegener Dis. 2012;1:60–74. [PMC free article] [PubMed] [Google Scholar]
- 5.Vaknin I, Kunis G, Miller O, Butovsky O, Bukshpan S, Beers DR, Henkel JS, Yoles E, Appel SH, Schwartz M. Excess circulating alternatively activated myeloid (M2) cells accelerate ALS progression while inhibiting experimental autoimmune encephalomyelitis. PLoS One. 2011;6:e26921. doi: 10.1371/journal.pone.0026921. [DOI] [PMC free article] [PubMed] [Google Scholar]
- 6.Butovsky O, Siddiqui S, Gabriely G, Lanser AJ, Dake B, Murugaiyan G, Doykan CE, Wu PM, Gali RR, Iyer LK, Lawson R, Berry J, Krichevsky AM, Cudkowicz ME, Weiner HL. Modulating inflammatory monocytes with a unique microRNA gene signature ameliorates murine ALS. J Clin Invest. 2012;122:3063–87. doi: 10.1172/JCI62636. [DOI] [PMC free article] [PubMed] [Google Scholar]
- 7.Evans MC, Couch Y, Sibson N, Turner MR. Inflammation and neurovascular changes in amyotrophic lateral sclerosis. Mol Cell Neurosci. 2013;53:34–41. doi: 10.1016/j.mcn.2012.10.008. [DOI] [PubMed] [Google Scholar]
- 8.Graves MC, Fiala M, Dinglasan LA, Liu NQ, Sayre J, Chiappelli F, van Kooten C, Vinters HV. Inflammation in amyotrophic lateral sclerosis spinal cord and brain is mediated by activated macrophages, mast cells and T cells. Amyotroph Lateral Scler Other Motor Neuron Disord. 2004;5:213–9. doi: 10.1080/14660820410020286. [DOI] [PubMed] [Google Scholar]
- 9.Rentzos M, Rombos A, Nikolaou C, Zoga M, Zouvelou V, Dimitrakopoulos A, Alexakis T, Tsoutsou A, Samakovli A, Michalopoulou M, Evdokimidis J. Interleukin-17 and interleukin-23 are elevated in serum and cerebrospinal fluid of patients with ALS: a reflection of Th17 cells activation? Acta Neurol Scand. 2010;122:425–9. doi: 10.1111/j.1600-0404.2010.01333.x. [DOI] [PubMed] [Google Scholar]
- 10.Saresella M, Piancone F, Tortorella P, Marventano I, Gatti A, Caputo D, Lunetta C, Corbo M, Rovaris M, Clerici M. T helper-17 activation dominates the immunologic milieu of both amyotrophic lateral sclerosis and progressive multiple sclerosis. Clin Immunol. 2013;148:79–88. doi: 10.1016/j.clim.2013.04.010. [DOI] [PubMed] [Google Scholar]
- 11.Turner MR, Goldacre R, Ramagopalan S, Talbot K, Goldacre MJ. Autoimmune disease preceding amyotrophic lateral sclerosis: an epidemiologic study. Neurology. 2013;81:1222–5. doi: 10.1212/WNL.0b013e3182a6cc13. [DOI] [PMC free article] [PubMed] [Google Scholar]
- 12.Kebir H, Kreymborg K, Ifergan I, Dodelet-Devillers A, Cayrol R, Bernard M, Giuliani F, Arbour N, Becher B, Prat A. Human TH17 lymphocytes promote blood-brain barrier disruption and central nervous system inflammation. Nat Med. 2007;13:1173–5. doi: 10.1038/nm1651. [DOI] [PMC free article] [PubMed] [Google Scholar]
- 13.Campbell IL, Erta M, Lim SL, Frausto R, May U, Rose-John S, Scheller J, Hidalgo J. Transsignaling is a dominant mechanism for the pathogenic actions of interleukin-6 in the brain. J Neurosci. 2014;34:2503–13. doi: 10.1523/JNEUROSCI.2830-13.2014. [DOI] [PMC free article] [PubMed] [Google Scholar]
- 14.Cudkowicz ME, Shefner JM, Schoenfeld DA, Zhang H, Andreasson KI, Rothstein JD, Drachman DB. Trial of celecoxib in amyotrophic lateral sclerosis. Ann Neurol. 2006;60:22–31. doi: 10.1002/ana.20903. [DOI] [PubMed] [Google Scholar]
- 15.Miller RG, Zhang R, Block G, Katz J, Barohn R, Kasarskis E, Forshew D, Gopalakrishnan V, McGrath MS. NP001 regulation of macrophage activation markers in ALS: A phase I clinical and biomarker study. Amyotroph Lateral Scler Frontotemporal Degener. 2014;15:601–9. doi: 10.3109/21678421.2014.951940. [DOI] [PMC free article] [PubMed] [Google Scholar]
- 16.Fiala M, Mizwicki MT, Weitzman R, Magpantay L, Nishimoto N. Tocilizumab infusion therapy normalizes inflammation in sporadic ALS patients. Am J Neurodegener Dis. 2013;2:129–39. [PMC free article] [PubMed] [Google Scholar]
- 17.Mizwicki MT, Fiala M, Magpantay L, Aziz N, Sayre J, Liu G, Siani A, Chan D, Martinez-Maza O, Chattopadhyay M, La Cava A. Tocilizumab attenuates inflammation in ALS patients through inhibition of IL6 receptor signaling. Am J Neurodegener Dis. 2012;1:305–15. [PMC free article] [PubMed] [Google Scholar]
- 18.Schenk M, Fabri M, Krutzik SR, Lee DJ, Vu DM, Sieling PA, Montoya D, Liu PT, Modlin RL. Interleukin-1beta triggers the differentiation of macrophages with enhanced capacity to present mycobacterial antigen to T cells. Immunology. 2014;141:174–80. doi: 10.1111/imm.12167. [DOI] [PMC free article] [PubMed] [Google Scholar]
- 19.Montoya D, Inkeles MS, Liu PT, Realegeno S, Teles RM, Vaidya P, Munoz MA, Schenk M, Swindell WR, Chun R, Zavala K, Hewison M, Adams JS, Horvath S, Pellegrini M, Bloom BR, Modlin RL. IL-32 is a molecular marker of a host defense network in human tuberculosis. Sci Transl Med. 2014;6:250ra114. doi: 10.1126/scitranslmed.3009546. [DOI] [PMC free article] [PubMed] [Google Scholar]
- 20.Wheelwright M, Kim EW, Inkeles MS, De Leon A, Pellegrini M, Krutzik SR, Liu PT. All-trans retinoic acid-triggered antimicrobial activity against Mycobacterium tuberculosis is dependent on NPC2. J Immunol. 2014;192:2280–90. doi: 10.4049/jimmunol.1301686. [DOI] [PMC free article] [PubMed] [Google Scholar]
- 21.Italiani P, Carlesi C, Giungato P, Puxeddu I, Borroni B, Bossù P, Migliorini P, Siciliano G, Boraschi D. Evaluating the levels of interleukin-1 family cytokines in sporadic amyotrophic lateral sclerosis. J Neuroinflammation. 2014;11:94. doi: 10.1186/1742-2094-11-94. [DOI] [PMC free article] [PubMed] [Google Scholar]
- 22.Hooten KG, Beers DR, Zhao W, Appel SH. Protective and Toxic Neuroinflammation in Amyotrophic Lateral Sclerosis. Neurotherapeutics. 2015;12:364–75. doi: 10.1007/s13311-014-0329-3. [DOI] [PMC free article] [PubMed] [Google Scholar]
- 23.Nishimoto N, Terao K, Mima T, Nakahara H, Takagi N, Kakehi T. Mechanisms and pathologic significances in increase in serum interleukin-6 (IL-6) and soluble IL-6 receptor after administration of an anti-IL-6 receptor antibody, tocilizumab, in patients with rheumatoid arthritis and Castleman disease. Blood. 2008;112:3959–64. doi: 10.1182/blood-2008-05-155846. [DOI] [PubMed] [Google Scholar]
- 24.Nakano Y, Hirayama K, Terao K. Hepatic ultrastructural changes and liver dysfunction in amyotrophic lateral sclerosis. Arch Neurol. 1987;44:103–6. doi: 10.1001/archneur.1987.00520130079022. [DOI] [PubMed] [Google Scholar]
- 25.Zhong Z, Deane R, Ali Z, Parisi M, Shapovalov Y, O’Banion MK, Stojanovic K, Sagare A, Boillee S, Cleveland DW, Zlokovic BV. ALS-causing SOD1 mutants generate vascular changes prior to motor neuron degeneration. Nat Neurosci. 2008;11:420–2. doi: 10.1038/nn2073. [DOI] [PMC free article] [PubMed] [Google Scholar]
- 26.Ouahchi K, Arita M, Kayden H, Hentati F, Ben Hamida M, Sokol R, Arai H, Inoue K, Mandel JL, Koenig M. Ataxia with isolated vitamin E deficiency is caused by mutations in the alpha-tocopherol transfer protein. Nat Genet. 1995;9:141–5. doi: 10.1038/ng0295-141. [DOI] [PubMed] [Google Scholar]
- 27.Wang H, O’Reilly ÉJ, Weisskopf MG, Logroscino G, McCullough ML, Schatzkin A, Kolonel LN, Ascherio A. Vitamin E intake and risk of amyotrophic lateral sclerosis: a pooled analysis of data from 5 prospective cohort studies. Am J Epidemiol. 2011;173:595–602. doi: 10.1093/aje/kwq416. [DOI] [PMC free article] [PubMed] [Google Scholar]
- 28.Pisa FE, Logroscino G, Casetta A, Cecotti L, Verriello L, Bratina A, Sartori A, Lazzarino de Lorenzo L, Eleopra R, Barbone F. The Use of Antidepressant Medication before and after the Diagnosis of Amyotrophic Lateral Sclerosis: A Population-Based Cohort Study. Neuroepidemiology. 2015;44:91–8. doi: 10.1159/000374119. [DOI] [PubMed] [Google Scholar]
- 29.Mizwicki MT, Fiala M, Magpantay L, Aziz N, Sayre J, Liu G, Siani A, Chan D, Martinez-Maza O, Chattopadhyay M, La Cava A. Tozilizumab attenuates inflammation in ALS patients through inhibition of IL-6 receptor signaling. Am J Neurodegener Dis. 2012;1:305–15. [PMC free article] [PubMed] [Google Scholar]
- 30.Trapnell C, Pachter L, Salzberg SL. TopHat: discovering splice junctions with RNA-Seq. Bioinformatics. 2009;25:1105–11. doi: 10.1093/bioinformatics/btp120. [DOI] [PMC free article] [PubMed] [Google Scholar]
- 31.Anders S, Pyl PT, Huber W. HTSeq-a Python framework to work with high-throughput sequencing data. Bioinformatics. 2015;31:166–9. doi: 10.1093/bioinformatics/btu638. [DOI] [PMC free article] [PubMed] [Google Scholar]
- 32.McCall MN, Bolstad BM, Irizarry RA. Frozen robust multiarray analysis (fRMA) Biostatistics. 2010;11:242–53. doi: 10.1093/biostatistics/kxp059. [DOI] [PMC free article] [PubMed] [Google Scholar]
- 33.Teles RM, Graeber TG, Krutzik SR, Montoya D, Schenk M, Lee DJ, Komisopoulou E, Kelly-Scumpia K, Chun R, Iyer SS, Sarno EN, Rea TH, Hewison M, Adams JS, Popper SJ, Relman DA, Stenger S, Bloom BR, Cheng G, Modlin RL. Type I interferon suppresses type II interferontriggered human anti-mycobacterial responses. Science. 2013;339:1448–53. doi: 10.1126/science.1233665. [DOI] [PMC free article] [PubMed] [Google Scholar]
Associated Data
This section collects any data citations, data availability statements, or supplementary materials included in this article.