

Abstract
Mammographic density has been proven as an independent risk factor for breast cancer. Women with dense breast tissue visible on a mammogram have a much higher cancer risk than women with little density. A great research effort has been devoted to incorporate breast density into risk prediction models to better estimate each individual’s cancer risk. In recent years, the passage of breast density notification legislation in many states in USA requires that every mammography report should provide information regarding the patient’s breast density. Accurate definition and measurement of breast density are thus important, which may allow all the potential clinical applications of breast density to be implemented. Because the two-dimensional mammography-based measurement is subject to tissue overlapping and thus not able to provide volumetric information, there is an urgent need to develop reliable quantitative measurements of breast density. Various new imaging technologies are being developed. Among these new modalities, volumetric mammographic density methods and three-dimensional magnetic resonance imaging are the most well studied. Besides, emerging modalities, including different x-ray–based, optical imaging, and ultrasound-based methods, have also been investigated. All these modalities may either overcome some fundamental problems related to mammographic density or provide additional density and/or compositional information. The present review article aimed to summarize the current established and emerging imaging techniques for the measurement of breast density and the evidence of the clinical use of these density methods from the literature.
Introduction
The breast tissue mainly consists of two components: fibroglandular tissue and fat. Fibroglandular tissue is a mixture of fibrous stroma and the epithelial cells that line the ducts of the breast, and it is denser compared with fat. X-ray is less likely to penetrate fibroglandular tissue and appears bright on mammography. In general, fibroglandular tissue is commonly referred to as breast density or “mammographic density” (MD). MD has been proven as an independent risk factor for breast cancer [1], [2], [3], [4], [5], [6]. Women with dense tissue visible on a mammogram have a cancer risk 1.8 to 6.0 times that of women with little density [7]. Increasing evidence has also found that the morphological distribution pattern of the projected dense tissue (texture) on mammograms may affect breast cancer risk [8], [9], [10].
Starting from 2009, 20 states have passed breast density notification legislation. At a national level, the Breast Density and Mammography Reporting Act (H.R. 1302) was introduced in the U.S. Congress in October 2011, which requires that every mammography report provide information regarding the patient’s breast density [11]. Currently, the Breast Imaging and Reporting Data (BI-RADS) score of I to IV based on radiologists’ subjective assessment is being reported, which is a coarse qualitative measure. As the H.R. 1302 Breast Density Act is being proactively debated, quantitative imaging methods are also being developed to provide a robust, reproducible, and accurate clinical measurement of breast density [12]. Many research studies are investigating how the breast density can be used in disease management, e.g., incorporating density into risk prediction model for risk-based screening and using the change of density after hormonal therapy to predict which patients will benefit from the treatment. A reliable quantitative measurement of breast density is required before these potential clinical applications can be implemented.
In this article, we review the currently established and emerging imaging methods used for the measurement of breast density. Some of these imaging techniques, although not well known to clinicians and breast cancer researchers, may have a great potential for the quantification of breast density and/or breast composition.
Established Imaging Modalities for Evaluating Breast Density
Mammographic density (MD)
Dense tissues attenuate x-ray more than fat and thus show higher signal intensity than fat on mammography. Because mammography is a widely used screening modality, the clinical role of breast density was mainly established based on the measurement of MD. MD can be assessed qualitatively or measured quantitatively. Qualitative methods include the Wolfe criteria [13] and the BI-RADS criteria [14]. The Wolfe criteria comprise N1 (lowest risk), P1 (low risk), P2 (high risk), and DY (highest risk) [13]. The new breast composition categories according to the fifth edition of the American College of Radiology BI-RADS [15] are as follows: (I) the breasts are almost entirely fatty; (II) there are scattered areas of fibroglandular density; (III) the breasts are heterogeneously dense, which may obscure small masses; and (IV) the breasts are extremely dense, which lowers the sensitivity of mammography. Other more sophisticated method assigns different scores, such as the six categories developed by Boyd et al.: 0%, 0% to 10%, 10% to 25%; 25% to 50%, 50% to 75%, and ≥ 75% [16]. The assessment is observer dependent, and the high inter- or intrareader variation was a major concern in these approaches [17].
Quantitative method uses computer-aided segmentation of fibroglandular area from digitized mammograms [18], [19], [20], [21], [22] (Figure 1). Interactive thresholding is a commonly used tool. The threshold is first set to segment the breast from the surrounding background and subsequently to select the region of dense tissue. The ratio of the dense tissue area divided by the breast area is calculated as a percentage for MD. This is a relatively rapid procedure. Many studies have used this method to measure MD from digitized mammograms [23], [24]. However, this technique is subjective and requires the operator to interactively select threshold values for the whole breast and the fibroglandular tissue area [25], which may lead to large intraoperator and interoperator measurement variation. To overcome this problem, an alternative approach is to use cluster-based segmentation such as fuzzy c-means (FCM) or k-means algorithms [26]. Several cluster centroids are established using heuristics, and pixels are segregated according to their proximity to the cluster’s centroid values. Because this method is based on computer algorithms, when the number of clusters is fixed, the reproducibility is very high. Therefore, the FCM approach for quantitative breast density segmentation may be useful for detecting small density changes after interventions, such as chemo/hormonal therapy, diet/supplement, or other lifestyle changes [26].
Figure 1.
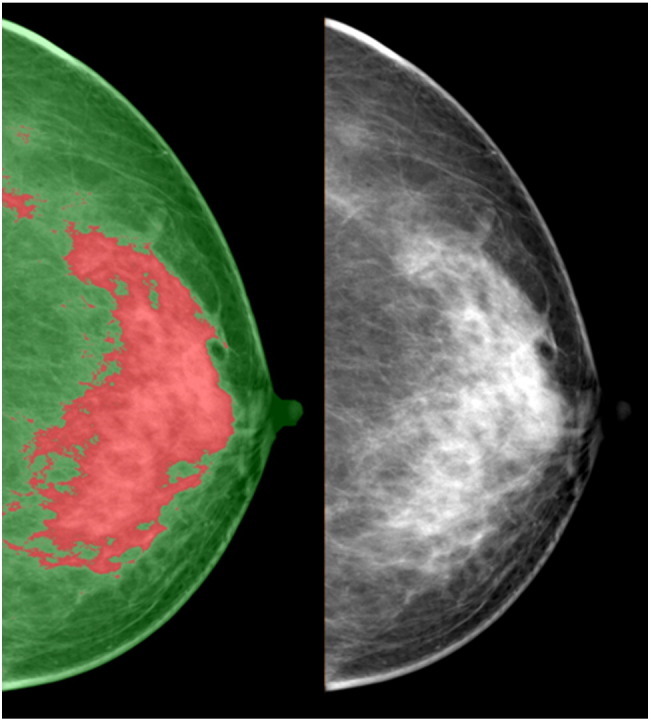
Quantitative measurement of 2D mammographic density. Note that the green color defines the breast boundary and the red color outlines the fibroglandular tissue area.
Because mammography takes two-dimensional (2D) projection image, it suffers from tissue-overlapping problem and cannot accurately and sensitively differentiate between fatty and fibroglandular tissues. The position of the woman and the degree of compression may lead to different projection views and thus measured densities [27]. This is a serious concern when trying to measure changes over time. A recent study has shown considerable variability in breast density assessments in repeated imaging with digital mammography. The variation was particularly obvious in women with younger age and greater breast density and when examined using different types of mammography [28]. Calibration of mammography unit is extremely important for control of the x-ray exposure for quantitative analysis. A small calibration variation may render evaluation of small changes unreliable [29]. Recently, a lateral phantom for calibration of mammographic density was developed, but its use is still under research investigation [30].
Limitations of 2D area-based measures of breast density have led to the development of volumetric measures of breast density. The Standard Mammogram Form (SMF) analysis program was introduced [31], [32]. SMF provides a representation of the amount of nonfat tissue at each location in a mammogram, estimated by an evolving series of computer programs. If the separation between the mammography compression plates is known, then the SMF representation can potentially provide a volume-based estimate of the amount of dense tissue in a breast [33]. However, this method showed a poor left-right symmetry between two breasts of the same woman, thus raising some concern about its validity [34]. Apart from SMF, several volumetric assessment methods using full-field digital mammography with calibration data have been developed and validated [35], [36]. Whether this analysis method can provide true volumetric breast density for cancer risk estimation needs to be investigated.
Recently, two automated breast assessment tools have been approved by the FDA and are increasingly being used. One is Quantra (http://www.hologic.com/wh/news-101107.htm), and the other is Volpara (http://www.volparadensity.com). Both quantitative tools give an objective estimate of the total volume of fibroglandular tissue as well as the total volume of the breast tissue in cubic centimeters, without uncertainty coming from the judgment of human operators (Figure 2). A complex model of the x-ray imaging chain is used to calculate the amount of dense tissue contained within each pixel in the image, which is independent of how the image was acquired. The volumetric percent density is expected to be lower than the areal percent density but highly correlated. One study comparing volumetric breast density determined by Volpara and visual assessment according to BI-RADS noted a high positive correlation (Spearman’s r = 0.754, P < .001) [37]. The volumetric measurements obtained from full-field digital mammography using Volpara showed a high correlation with magnetic resonance (MR)–measured breast density, with Pearson’s correlation coefficients of 0.93, 0.97, and 0.85 for volumetric breast density, breast volume, and fibroglandular tissue volume, respectively [38]. A study evaluating breast density measured by the Quantra software showed that it provided systematically lower density percentage values as compared with visual classification [39].
Figure 2.

Volumetric mammographic density (acquired using Volpara) of a BI-RADS density category 3 woman (A and B). Both volumetric breast density and Volpara density grade on the picture archiving and communication system are displayed (C) [37].
Despite the development of these new analysis tools, because the analysis is based on 2D projection acquisition, it still suffers from the intrinsic tissue overlapping problem. A review article by Kopans raised concerns about the accuracy of breast density determined by mammography [40]. The author stressed that studies suggesting a link between MD and risk for breast cancer have methodological flaws, and concluded that studies showing small percentage differences between groups are likely to be inaccurate.
MR-based quantitative breast density measurement
MR-based density measurement has gained a lot of research attention in recent years [41], [42], [43], [44], [45], [46], [47], [48], [49]. MR imaging (MRI) provides strong soft tissue contrast distinguishing between fibroglandular and fatty tissues. More importantly, it provides a three-dimensional (3D) view of breast tissues without compression. Therefore, MRI does not suffer from the tissue overlapping or x-ray exposure calibration problem as mammography. In addition, MRI can potentially measure more density-related biological properties that cannot be revealed by mammography, such as the water-fat content using Dixon imaging methods [49], [50], [51], [52], [53].
To use MRI for quantitative analysis of breast density, two procedures are necessary: segmentation of the whole breast from the body and segmentation of the fibroglandular tissue within the breast. Because the percent density is calculated as the ratio of the fibroglandular tissue volume to the total breast volume, reliable methods for the segmentation of the whole breast are mandatory. This is a challenging task because there is no obvious boundary indicating where the breast boundary ends. Therefore, it is more a problem of consistency rather than accuracy. Moreover, there are no established anatomic landmarks for the whole breast segmentation. Among the few published studies, the anatomic landmarks for MR-based breast segmentation methods were either not clearly specified [41], [42], [43], [44], [45], [46] or a horizontal line drawn manually along the ventral surface of the pectoralis major muscle was used [33], [47], [48]. A method published by Nie et al. [54] used V-shaped landmarks of each individual woman to determine the lateral posterior boundary of the breast. To draw the V-shaped cut, images with a large field of view that include the whole chest cavity containing the thoracic spinous process are necessary. To simplify the procedure, other studies used the sternum as the landmark [55]. Most of the reported MR density methods in the literature are based on semiautomated methods that require some operator interventions [33], [44], [46], [47], [54], [55], [56]. They are time consuming and subject to variations from an operator’s personal judgment. To overcome the problems, model-based segmentation methods, using the whole breast as the template, have been developed [57], [58], [59], [60]. However, because of widely variable breast shape from woman to woman, simply using one universal template may not be robust enough to segment all types of breasts [61]. Recently, a new automatic template-based method using the chest body model for breast segmentation has been reported [61]. The process starts from a middle slice. After defining the breast boundary using three body landmarks (thoracic spine and bilateral boundary of the pectoral muscle), the chest template was mapped to each subject's image space to obtain a subject-specific chest model for exclusion. The chest and muscle boundaries determined on the middle slice were used as the reference for the segmentation of adjacent slices, and the process continued superiorly and inferiorly until all 3D slices were segmented [61]. Other algorithm-based automatic methods have also been reported [62], [63]. A fully automated segmentation algorithm based on an atlas-aided fuzzy C-means (FCM-Atlas) method [63] showed a high correlation with manual segmentation (r = 0.92). The automatic method can provide an efficient tool for processing large clinical data sets for quantifying the fibroglandular tissue content in breast MRI [63].
Another challenge is to identify the chest wall muscle so that it can be excluded from the breast. For women with dense breasts, the fibroglandular tissue may be very close to the chest wall muscle, which makes the exclusion of the muscle while preserving the dense tissue difficult [61]. Various approaches have been attempted to detect the chest wall muscle, including semiautomated user-assisted methods [41], [43], [54] and automatic methods [60], [61], [64], [65], [66]. The semiautomatic methods can be subjective. Automatic methods, especially model (or atlas)-based segmentation methods [61], [65], [66], are promising approaches because they benefit from a prior learning of anatomical or statistical knowledge [66].
The breast segmentation, chest wall muscle exclusion, and the fibroglandular tissue segmentation can be integrated into a comprehensive software for quantitative analysis of volumetric breast density as well as the morphological distribution on 3D MRI (Figure 3) [54], [67], [68]. This MR-based quantitative density analysis method has been applied to study the menstrual cycle–related change [69], age- and race-related differences [70], interscanner difference [71], as well as the change in patients receiving chemotherapy [72], [73] and tamoxifen [74]. The effects of imaging sequences on the MR-measured density have also been studied [55], [75]. One study noted that although breast density percentage showed a high linear correlation among different sequences (r = 0.93), the results were significantly different when different pulse sequences were used [75]. A study comparing percent density measured using mammography and MRI showed that the mammography overestimates by a factor of two compared with MRI [41].
Figure 3.

Automatic breast MR method for quantification of breast density in three women with different breast morphologies/densities. Note color-coded images in the right panel showing the defined breast boundary (green) and the fibroglandular tissue area (red).
Currently, the American Cancer Society recommends that women with lifetime risk greater than 20% should receive breast MRI for screening. With the maturity and wide accessibility of this imaging technology, as well as more education and knowledge about the use of breast MRI, many more women are expected to receive screening breast MRI. With large MRI data sets from multiple sites available, research is ongoing to investigate the value of MRI-assessed breast density to improve the prediction of cancer risk or to aid the management.
Emerging New Technologies
Because of limitation of mammography-based measurement in quantification and the relatively high cost of MRI, other emerging new technologies are being developed for assessing breast density, including x-ray–based [76], [77], [78], [79], [80], [81], [82], [83], [84], [85], optical imaging [86], [87], [88], [89], [90], and ultrasound (US)-based systems [91], [92], [93], [94].
X-ray–based modalities
Digital breast tomosynthesis (DBT)
DBT is a mammographic derivative technology that has gradually become an important tool in clinical practice. This technique is a pseudo-3D examination of the breast, allowing cross-sectional visualization and reducing the superimposition or overlapping of the breast tissue [78]. In DBT, high–spatial-resolution tomographic images of the breast are reconstructed from multiple projection images acquired within a limited range of x-ray tube angles [76]. Besides being used for the improvement of cancer diagnosis, recently, DBT has been used for the measurement of breast density. Two methodological approaches have been reported. One approach is to analyze breast density based on the central DBT projection, acquired with the x-ray tube positioned orthogonal to the detector plane [76]. Similar to the measurement of 2D mammographic density, the percent density can be estimated using interactive thresholding, and it is shown that the density is highly correlated with mammographic density [76]. Another approach is to analyze all DBT projection images using a semiautomatic software, and the mean value is calculated [78]. Because DBT can resolve overlapping tissues, the density measured by DBT is significantly lower compared with the 2D mammographic density and not significantly different compared with the density measured by 3D MRI [78], [95], [96].
Dual-energy imaging
Breast density can also be quantified using dual-energy x-ray imaging [79], [80], [81], including dual-energy mammography and dual-energy x-ray absorptiometry techniques. Dual-energy imaging exploits differences between the effective atomic numbers (Z) of different tissues to provide separate quantitative thickness measurements for each tissue [79]. The adipose and glandular tissues have effective atomic numbers of 6.33 and 6.93, respectively. Dual-energy mammography can exploit this effective atomic number difference to quantify glandular and adipose tissue for density measurement [79]. Dual-energy x-ray absorptiometry might provide a low-radiation option for measurement of breast density; however, the accuracy was hampered by the beam spectra of the system, which was not optimal for normal breast tissues [79]. Dual-energy mammography can also be used to perform compositional breast imaging, which can separate water, lipid, and protein in the breast tissue [81] (Figure 4). This is achieved when dual-energy attenuation and breast shape measures are used together to solve for the three compositional thicknesses [81]. Preliminary study has demonstrated the feasibility of creating individual compositional diagnostic images in a clinical environment [81].
Figure 4.

Compositional breast imaging acquired from dual-energy mammography: (A) regular mammogram, (B) two-compartment volumetric density image gray scale = % fibroglandular volume, (C) water thickness gray scale = water thickness, (D) lipid thickness gray scale = lipid thickness, and (E) protein thickness gray scale = water thickness images, respectively [81].
Computed tomography (CT)
Efforts have been made to measure breast density from clinical chest CT [97], [98], low-dose chest CT [99], [100], cone beam CT [85], and dedicated breast CT [83], [84]. Low-dose chest CT is increasingly being used for lung cancer screening. With the full coverage of whole chest area and the soft tissue contrast presented on chest CT, the images can be exploited for analysis of breast density in female subjects (Figure 5).
Figure 5.

Segmentation of breast tissue (green color) and fibroglandular tissue (red color) from low-dose chest CT images in two women of different breast morphologies.
Breast density on CT can be assessed qualitatively similar to BI-RADS categorization [97] or quantitatively [83], [84], [85], [100]. For quantitative measurement, because breast fatty tissue is continuous with the body fat, the anatomic landmark used for the segmentation of breast boundary will affect the calculation of percent breast density [100]. FCM algorithm was generally used to partition adipose and fibroglandular tissue [84], [100]. The volume glandular fraction could be computed within the defined region of the segmented images [83], [84]. Breast density grades measured from chest CT have higher intrareader reliability and interreader agreement than mammographic BI-RADS density categories [99]. Quantitative CT density also shows low coefficient of variations of intraoperator and interoperator measurements (< 5%) [99]. Breast density acquired from CT has been shown to correlate with mammographic density [83], and the measured volume glandular fraction increased as a function of the reported BI-RADS classifications [83]. The measured density was in general lower than that of mammographic density both qualitatively [85] and quantitatively [99], which is expected because CT is based on 3D analysis and not on 2D project view.
Optical imaging modalities
Optical imaging, based on visible light and near-infrared (650 to 1000 nm), provides information about tissue optical properties through the spectral dependency of nonionizing photons that migrate through the breast tissue [101], [102]. Because optical absorption arises (stem/originates) from chromophores, mainly water, lipids, and oxy- and deoxyhemoglobin, wavelength-dependent measurements allow estimation of their concentrations in the probed volume. Similarly, wavelength-dependent tissue scattering information can be used to estimate the scattering particle density and scattering power, which are related to the tissue composition (e.g., cells and intracellular organelles, collagen). Accordingly, both chromophore concentration and scattering information can be used to differentiate dense from fatty breast tissues. Compared with fatty tissue, the dense tissue (stromal and epithelial tissue components) in the breast shows increased scattering, increased water-associated absorption, decreased lipid associated absorption, higher total hemoglobin content, and lower oxygen saturation [103].
Optical spectroscopy is the most commonly used method, which uses one source-detector pair to estimate bulk optical properties from tissues that lie between the source and detector. Usually, many wavelengths are used, and rich spectral information can be obtained. Optical tomographic imaging uses multiple source-detector pairs, and a dedicated reconstruction algorithm is applied to render 3D images. Spatially varying optical properties can be obtained, but because of the concern of imaging time, only several selected wavelengths are used, thus having limited spectral information. There are three main data acquisition techniques: continuous wave, time domain, and frequency domain. The continuous-wave technique is the easiest and cheapest approach because of the utilization of steady-state lasers. Time-domain technique provides the richest data by using a pulsed laser and measuring the broadening of the light pulse while it travels through the breast tissue. Frequency-domain technique is based on modulating the laser output intensity with radiofrequency (~ 100 to 300 MHz), and it can obtain both magnitude and phase information.
Four optical-based imaging methods for measuring breast density were reported. Three of those are spectroscopic approaches employing 1) time-domain transillumination geometry [104]: The source and detector fibers are positioned at the opposite sides of the mildly compressed breast to collect time-resolved transmittance data. Seven-picosecond pulsed diode lasers are used as light sources (i.e., 635, 680, 785, 905, 930, 975, and 1060 nm). 2) Continuous-wave transillumination geometry: This transillumination breast spectroscopy (TiBS) system uses a halogen lamp as broadband light source. Unwanted portion of its spectrum (ultraviolet and visible light range) is eliminated using optical filters, leaving a broad spectral range (550 to 1300 nm) [86], [89], [90], [101], [102], [105], [106]. The remaining light was coupled into a 5-mm–diameter liquid light guide in contact with the skin on top of the breast tissue. The principal component analysis was applied to reduce the spectral data set into four principal components and to generate four TiBS scores for each woman [90], [101]. 3) Frequency-domain reflection geometry: The diffuse optical spectroscopic imaging (DOSI) uses a handheld probe placed in gentle contact with the breast, and data are acquired in the reflection mode. Combining frequency-domain and continuous-wave tissue measurements, the DOSI system can provide quantitative topographic maps of water, oxyhemoglobin, deoxyhemoglobin, lipids, as well as tissue scattering associated with micrometer-sized structures such as collagen and membrane-bound organelles [107], [108], [109]. 4) Tomographic approach using frequency-domain technique in transmission geometry: This tomographic system uses an examination table on which the woman lies in prone position with breast pendant through an opening. Underneath the bed, the circular fiber optic array is brought into contact with the breast. Each source fiber is activated sequentially, whereas the data are acquired from all detector fibers simultaneously.
Some encouraging results have demonstrated the feasibility of optical spectroscopy and imaging for breast density measurements. In studies using a time-domain multiwavelength optical system, optical measurements of breast density compare favorably with radiologist’s assignments of BI-RADS categories [110], [111]. TiBS can differentiate women with > 75% MD from those with < 75% MD [89]. Other studies have shown a good correlation between optical density and Cumulus mammographic density [86], [90], [106]. With DOSI, several studies showed that it can measure differences between premenopausal and postmenopausal women, as well as changes after hormone replacement therapy [88], [112]. DOSI could characterize metabolic differences between benign and malignant tumors [113]. Recently, a study of DOSI and MRI found that DOSI functional measurements, including water, deoxyhemoglobin, and lipid concentration, correlate with MRI fibroglandular density before and after chemotherapy [114] (Figure 6). However, because the quality and accuracy of the information obtained by optical methods depend on the geometry and data acquisition technique, more studies are needed to determine the optimum technique for breast density measurements. Validation studies, such as comparing optical imaging results with MRI results, are also necessary.
Figure 6.

Corresponding MRI and DOSI for quantifying breast density. The yellow outlines in the MR images depict the fibroglandular tissue. The DOSI maps show measured parameters as a function of position (tick mark separation equals 1 cm). The illustrated maps are from an 8 × 6–cm area from the upper-inner region of the left breast. The areolar region has more water and ctHHB, higher TOI, and less lipid outlined by the semicircle. ctHHb, deoxyhemoglobin concentration; TOI, tissue optical index [114].
US-based images
US shows different signal intensities between fibroglandular and fatty tissues; thus, it has the potential for assessment of breast density. Studies using 2D US [115], 3D US [93], [94], and US tomography [91], [92] to estimate breast density have been reported.
2D US imaging
The clinical handheld 2D US probe was used to take representative images in the transverse direction at the 12 o’clock (supra-areolar) and 6 o’clock (infra-areolar) positions from the margin of the nipple [115]. It takes less than 5 minutes for a radiologist to scan the breasts and qualitatively assess density using four categories, similar to the BI-RADS mammographic density [115] (Figure 7). Using this simple approach, the interobserver agreement (average r = 0.63, Intraclass correlation (ICC) = 0.82) was comparable with mammographic assessments (average r = 0.74, ICC = 0.85) (P = .701) [115]. The correlation between the US and mammographic assessments of breast density showed r = 0.65 and ICC = 0.80, with 68% (222/328 cases) having the same BI-RADS category. The result suggested that 2D US has the potential to assess breast density.
Figure 7.

Reference US images of breast density demonstrating each of the four categories. The images were taken in the transverse direction at 12 o’clock (supra-areolar) position from the margin of the nipple. Areas of the fibroglandular tissue (solid line) and subcutaneous or retromammary fat are illustrated (dotted line). The extent of the fibroglandular tissue is less than 25% (category 1, A), between 25% and 50 % (category 2, B), between 50% and 75 % (category 3, C), and more than 75 % (category 4, D) [115].
3D US imaging
3D US can acquire whole-breast US images and has been used to measure volumetric density [93], [94]. Using this method, the women can be scanned in a supine [94] or a prone position with the breast immersed in a water bath [93]. Two or three passes are needed to cover the whole breast [93], [94]. An adaptive speckle reduction filter was used to remove the speckle noise, and a robust thresholding algorithm, such as FCM classifier, was used to segment the breast tissue into fatty or fibroglandular components for density measurements [93], [94] (Figure 8). When breast volume and percent breast density estimated by 3D automated whole breast ultrasound (ABUS) images were compared with the results evaluated by 3D MRI, a good correlation was noted (r = 0.884 and r = 0.917, respectively). Accurate segmentation of breast in ABUS, however, had its problems. With supine-type ABUS systems, the shape of the breast can be deformed when the whole breast is scanned with multiple passes. When the acquired images are merged, some regions overlap or are lost, making density estimation inaccurate [116]. The lateral boundary artifact and the retroareolar shadowing can make the density estimation difficult. Moreover, the anatomic landmark, such as pectoralis muscle, for separating breast and nonbreast region in 3D ABUS is usually not obvious. Recently, a more convenient method was introduced for rapid volume density analysis (RVDA) using ABUS [116]. With that method, three rectangular volumes of interest were extracted, including the volumes of interest located at the 6 and 12 o’clock positions relative to the nipple in the anterior to posterior pass and the lateral position relative to the nipple in the lateral pass. It was noted that the density correlation between the RVDA and the whole ABUS methods was very high (r = 0.98). The correlation between RVDA and conventional BI-RADS was also good (r = 0.83) [116].
Figure 8.

Determination of the 3D US pixels using the threshold-based method. The white region (upper panel right) indicates areas classified as fibroglandular tissue. The lower panel contains the original image and the density result of FCM classifier for a BIRADS mammographic density grade 2 case. The calculated breast density is 13.9% [modified from references [93], [94].
In addition, breast density has been estimated by US tomography [91], [92]. US tomography is based on the volumetric measure using whole-breast acoustic velocity, defined as a global sound speed measure obtained through a sound speed histogram developed from US transmission tomograms, as an overall indicator of breast density [92]. A study on US tomography has shown a direct correlation between the measured sound speed and the physical density in vitro. The in vivo study also showed a significantly higher sound speed in women with mammographic density BI-RADS 4 than BI-RADS 1 to 3 [92]. The volumetric ultrasound percent density is determined by segmenting high–sound speed areas from each tomogram using a k-means clustering algorithm and then integrating these results over the entire volume of the breast and dividing by whole-breast volume [91]. Ultrasound percent density was shown to have a good correlation with qualitative mammographic BI-RADS categories [91] and with quantitative MD with correlation coefficients ranging from 0.75 to 0.89 [92].
Conclusions
In conclusion, breast density is an important risk factor for the development of breast cancer. The current method based on 2D projection mammography for evaluation of breast density is subject to tissue overlapping and thus is not true volumetric density. New imaging methods, including 3D MR imaging and other emerging imaging techniques based on x-ray, optical imaging, and US, are being developed and tested for the quantitative measurement of breast density. These new methods may overcome some fundamental problems related to 2D mammographic density. Their clinical role for predicting cancer risk based on the measured breast density is under investigation.
Acknowledgement
This study was supported in part by National Institutes of Health/National Cancer Institute R01 CA127927, National Institutes of Health/National Cancer Institute R21 CA170955, and California Breast Cancer Research Program #16GB-0056.
Footnotes
This study was supported in part by National Institutes of Health/National Cancer InstituteR01 CA127927, National Institutes of Health/National Cancer InstituteR21 CA170955, and California Breast Cancer Research Program #16GB-0056.
References
- 1.Boyd NF, Guo H, Martin LJ, Sun L, Stone J, Fishell E, Jong RA, Hislop G, Chiarelli A, Minkin S. Mammographic density and the risk and detection of breast cancer. N Engl J Med. 2007;356(3):227–236. doi: 10.1056/NEJMoa062790. [DOI] [PubMed] [Google Scholar]
- 2.Vachon CM, Brandt KR, Ghosh K, Scott CG, Maloney SD, Carston MJ, Pankratz VS, Sellers TA. Mammographic breast density as a general marker of breast cancer risk. Cancer Epidemiol Biomarkers Prev. 2007;16(1):43–49. doi: 10.1158/1055-9965.EPI-06-0738. [DOI] [PubMed] [Google Scholar]
- 3.Titus-Ernstoff L, Tosteson AN, Kasales C, Weiss J, Goodrich M, Hatch EE, Carney PA. Breast cancer risk factors in relation to breast density (United States) Cancer Causes Control. 2006;17(10):1281–1290. doi: 10.1007/s10552-006-0071-1. [DOI] [PMC free article] [PubMed] [Google Scholar]
- 4.Boyd NF, Martin LJ, Sun L, Guo H, Chiarelli A, Hislop G, Yaffe M, Minkin S. Body size, mammographic density, and breast cancer risk. Cancer Epidemiol Biomarkers Prev. 2006;15(11):2086–2092. doi: 10.1158/1055-9965.EPI-06-0345. [DOI] [PubMed] [Google Scholar]
- 5.Ursin G, Pike M. Mammographic density, hormone therapy, and risk of breast cancer. Cancer Epidemiol Biomarkers Prev. 2006;15(9):1750. doi: 10.1158/1055-9965.EPI-06-0431. [DOI] [PubMed] [Google Scholar]
- 6.Ziv E, Shepherd J, Smith-Bindman R, Kerlikowske K. Mammographic breast density and family history of breast cancer. J Natl Cancer Inst. 2003;95(7):556–558. doi: 10.1093/jnci/95.7.556. [DOI] [PubMed] [Google Scholar]
- 7.Boyd NF, Dite GS, Stone J, Gunasekara A, English DR, McCredie MR, Giles GG, Tritchler D, Chiarelli A, Yaffe MJ. Heritability of mammographic density, a risk factor for breast cancer. N Engl J Med. 2002;347(12):886–894. doi: 10.1056/NEJMoa013390. [DOI] [PubMed] [Google Scholar]
- 8.Li H, Giger ML, Olopade OI, Margolis A, Lan L, Chinander MR. Computerized texture analysis of mammographic parenchymal patterns of digitized mammograms. Acad Radiol. 2005;12:863–873. doi: 10.1016/j.acra.2005.03.069. [DOI] [PubMed] [Google Scholar]
- 9.Russo J, Lynch H, Russo HI. Mammary gland architecture as a determining factor in the susceptibility of the human breast to cancer. Breast J. 2001;7:278–291. doi: 10.1046/j.1524-4741.2001.21033.x. [DOI] [PubMed] [Google Scholar]
- 10.Manduca A, Carston MJ, Heine JJ, Scott CG, Pankratz VS, Brandt KR, Sellers TA, Vachon CM, Cerhan JR. Texture features from mammographic images and risk of breast cancer. Cancer Epidemiol Biomarkers Prev. 2009;18:837–845. doi: 10.1158/1055-9965.EPI-08-0631. [DOI] [PMC free article] [PubMed] [Google Scholar]
- 11.H.R. 1302. Breast density and mammography reporting act of 2011. U.S. Congress. http://www.govtrack.us/congress/bill. xpd?bill=h112-3102 [Published October 2011, Accessed November 15, 2011]
- 12.Ng KH, Yip CH, Taib NA. Standardization of clinical breast density measurement. Lancet Oncol. 2012;13(4):334–336. doi: 10.1016/S1470-2045(12)70093-1. [DOI] [PubMed] [Google Scholar]
- 13.Wolfe JN. Breast patterns as an index of risk for developing breast cancer. Am J Roentgenol. 1976;126:1130–1139. doi: 10.2214/ajr.126.6.1130. [DOI] [PubMed] [Google Scholar]
- 14.Obenauer S, Hermann KP, Grabbe E. Applications and literature review of the BI-RADS classification. Eur Radiol. 2005;15(5):1027–1036. doi: 10.1007/s00330-004-2593-9. [DOI] [PubMed] [Google Scholar]
- 15.5th ed. 2013. American College of Radiology Breast Imaging Reporting and Data System (BI-RADS) Atlas. [Reston, VA] [Google Scholar]
- 16.Boyd NF, Byng JW, Jong RA, Fishell EK, Little LE, Miller AB, Lockwood GA, Tritchler DL, Yaffe MJ. Quantitative classification of mammographic densities and breast cancer risk: results from the Canadian National Breast Screening Study. J Natl Cancer Inst. 1995;87:670–675. doi: 10.1093/jnci/87.9.670. [DOI] [PubMed] [Google Scholar]
- 17.Lobbes MB, Cleutjens JP, Lima Passos V, Frotscher C, Lahaye MJ, Keymeulen KB, Beets-Tan RG, Wildberger J, Boetes C. Density is in the eye of the beholder: visual versus semi-automated assessment of breast density on standard mammograms. Insights Imaging. 2012;3(1):91–99. doi: 10.1007/s13244-011-0139-7. [DOI] [PMC free article] [PubMed] [Google Scholar]
- 18.Maskarinec G, Pagano I, Lurie G, Kolonel LN. A longitudinal investigation of mammographic density: the multiethnic cohort. Cancer Epidemiol Biomarkers Prev. 2006;15(4):732–739. doi: 10.1158/1055-9965.EPI-05-0798. [DOI] [PubMed] [Google Scholar]
- 19.Habel LA, Capra AM, Oestreicher N, Greendale GA, Cauley JA, Bromberger J, Crandall CJ, Gold EB, Modugno F, Salane M. Mammographic density in a multiethnic cohort. Menopause. 2007;14(5):891–899. doi: 10.1097/gme.0b013e318032569c. [DOI] [PubMed] [Google Scholar]
- 20.Li L, Wu Z, Chen L, George F, Chen Z, Salem A, Kallergi M, Berman C. Breast tissue density and CAD cancer detection in digital mammography. Conf Proc IEEE Eng Med Biol Soc. 2005;3:3253–3256. doi: 10.1109/IEMBS.2005.1617170. [DOI] [PubMed] [Google Scholar]
- 21.Martin KE, Helvie MA, Zhou C, Roubidoux MA, Bailey JE, Paramagul C, Blane CE, Klein KA, Sonnad SS, Chan HP. Mammographic density measured with quantitative computer-aided method: comparison with radiologists' estimates and BI-RADS categories. Radiology. 2006;240(3):656–665. doi: 10.1148/radiol.2402041947. [DOI] [PubMed] [Google Scholar]
- 22.Zhou C, Chan HP, Petrick N, Helvie MA, Goodsitt MM, Sahiner B, Hadjiiski LM. Computerized image analysis: estimation of breast density on mammograms. Med Phys. 2001;28(6):1056–1069. doi: 10.1118/1.1376640. [DOI] [PubMed] [Google Scholar]
- 23.Byng JW, Boyd NF, Fishell E, Jong RA, Yaffe MJ. The quantitative analysis of mammographic densities. Phys Med Biol. 1994;39:1629–1638. doi: 10.1088/0031-9155/39/10/008. [DOI] [PubMed] [Google Scholar]
- 24.Jamal N, Ng KH, Looi LM, McLean D, Zulfiqar A, Tan SP, Liew WF, Shantini A, Ranganathan S. Quantitative assessment of breast density from digitized mammograms into Tabar’s patterns. Phys Med Biol. 2006;51:5843–5857. doi: 10.1088/0031-9155/51/22/008. [DOI] [PubMed] [Google Scholar]
- 25.Yaffe M, Boyd N. Mammographic breast density and cancer risk: the radiological view. Gynecol Endocrinol. 2005;21(Suppl. 1):6–11. doi: 10.1080/09513590400030053. [DOI] [PubMed] [Google Scholar]
- 26.Glide-Hurst CK, Duric N, Littrup P. A new method for quantitative analysis of mammographic density. Med Phys. 2007;34(11):4491–4498. doi: 10.1118/1.2789407. [DOI] [PubMed] [Google Scholar]
- 27.Colin C, Prince V, Valette PJ. Can mammographic assessments lead to consider density as a risk factor for breast cancer? Eur J Radiol. 2013;82(3):404–411. doi: 10.1016/j.ejrad.2010.01.001. [DOI] [PubMed] [Google Scholar]
- 28.Kim WH, Moon WK, Kim SM, Yi A, Chang JM, Koo HR, Lee SH, Cho N. Variability of breast density assessment in short-term reimaging with digital mammography. Eur J Radiol. 2013;82(10):1724–1730. doi: 10.1016/j.ejrad.2013.05.004. [DOI] [PubMed] [Google Scholar]
- 29.Harvey JA, Bovbjerg VE. Quantitative assessment of mammographic breast density: relationship with breast cancer risk. Radiology. 2004;230:29–41. doi: 10.1148/radiol.2301020870. [DOI] [PubMed] [Google Scholar]
- 30.Shepherd JA, Herve L, Landau J, Fan B, Kerlikowske K, Cummings SR. Clinical comparison of a novel breast DXA technique to mammographic density. Med Phys. 2006;33:1940–1948. doi: 10.1118/1.2193691. [DOI] [PubMed] [Google Scholar]
- 31.Jeffreys M, Warren R, Highnam R, Davey Smith G. Breast cancer risk factors and a novel measure of volumetric breast density: cross-sectional study. Br J Cancer. 2008;98(1):210–216. doi: 10.1038/sj.bjc.6604122. [DOI] [PMC free article] [PubMed] [Google Scholar]
- 32.Jeffreys M, Warren R, Highnam R, Smith GD. Initial experiences of using an automated volumetric measure of breast density: the standard mammogram form. Br J Radiol. 2006;79(941):378–382. doi: 10.1259/bjr/24769358. [DOI] [PubMed] [Google Scholar]
- 33.Highnam R, Pan X, Warren R, Jeffreys M, Davey Smith G, Brady M. Breast composition measurements using retrospective standard mammogram form (SMF) Phys Med Biol. 2006;51:2695–2713. doi: 10.1088/0031-9155/51/11/001. [DOI] [PubMed] [Google Scholar]
- 34.McCormack VA, Highnam R, Perry N, dos Santos Silva I. Comparison of a new and existing method of mammographic density measurement: intramethod reliability and associations with known risk factors. Cancer Epidemiol Biomarkers Prev. 2007;16(6):1148–1154. doi: 10.1158/1055-9965.EPI-07-0085. [DOI] [PMC free article] [PubMed] [Google Scholar]
- 35.van Engeland S, Snoeren PR, Huisman H, Boetes C, Karssemeijer N. Volumetric breast density estimation from full-field digital mammograms. IEEE Trans Med Imaging. 2006;25:273–282. doi: 10.1109/TMI.2005.862741. [DOI] [PubMed] [Google Scholar]
- 36.Shepherd JA, Herve L, Landau J, Fan B, Kerlikowske K, Cummings SR. Novel use of single X-ray absorptiometry for measuring breast density. Technol Cancer Res Treat. 2005;4:173–182. doi: 10.1177/153303460500400206. [DOI] [PubMed] [Google Scholar]
- 37.Seo JM, Ko ES, Han BK, Ko EY, Shin JH, Hahn SY. Automated volumetric breast density estimation: a comparison with visual assessment. Clin Radiol. 2013;68(7):690–695. doi: 10.1016/j.crad.2013.01.011. [DOI] [PubMed] [Google Scholar]
- 38.Gubern-Mérida A, Kallenberg M, Platel B, Mann RM, Martí R, Karssemeijer N. Volumetric breast density estimation from full-field digital mammograms: a validation study. PLoS One. 2014;9(1):e85952. doi: 10.1371/journal.pone.0085952. [DOI] [PMC free article] [PubMed] [Google Scholar]
- 39.Ciatto S, Bernardi D, Calabrese M, Durando M, Gentilini MA, Mariscotti G, Monetti F, Moriconi E, Pesce B, Roselli A. A first evaluation of breast radiological density assessment by QUANTRA software as compared to visual classification. Breast. 2012;21(4):503–506. doi: 10.1016/j.breast.2012.01.005. [DOI] [PubMed] [Google Scholar]
- 40.Kopans DB. Basic physics and doubts about relationship between mammographically determined tissue density and breast cancer risk. Radiology. 2008;246(2):348–353. doi: 10.1148/radiol.2461070309. [DOI] [PubMed] [Google Scholar]
- 41.Klifa C, Carballido-Gamio J, Wilmes L, Laprie A, Shepherd J, Gibbs J, Fan B, Noworolski S, Hylton N. Magnetic resonance imaging for secondary assessment of breast density in a high-risk cohort. Magn Reson Imaging. 2010;28(1):8–15. doi: 10.1016/j.mri.2009.05.040. [DOI] [PMC free article] [PubMed] [Google Scholar]
- 42.Eng-Wong J, Orzano-Birgani J, Chow CK, Venzon D, Yao J, Galbo CE, Zujewski JA, Prindiville S. Effect of Raloxifene on mammographic density and breast magnetic resonance imaging in premenopausal women at increased risk for breast cancer. Cancer Epidemiol Biomarkers Prev. 2008;17(7):1696–1701. doi: 10.1158/1055-9965.EPI-07-2752. [DOI] [PMC free article] [PubMed] [Google Scholar]
- 43.Wei J, Chan HP, Helvie MA, Roubidoux MA, Sahiner B, Hadjiiski LM, Zhou C, Paquerault S, Chenevert T, Goodsitt MM. Correlation between mammographic density and volumetric fibroglandular tissue estimated on breast MR images. Med Phys. 2004;31(4):933–942. doi: 10.1118/1.1668512. [DOI] [PubMed] [Google Scholar]
- 44.Lee NA, Rusinek H, Weinreb J, Chandra R, Toth H, Singer C, Newstead G. Fatty and fibroglandular tissue volumes in the breasts of women 20-83 years old: comparison of X-ray mammography and computer-assisted MR imaging. AJR. 1997;168:501–506. doi: 10.2214/ajr.168.2.9016235. [DOI] [PubMed] [Google Scholar]
- 45.Yao J, Zujewski JA, Orzano J, Prindiville S, Chow C. Classification and calculation of breast fibroglandular tissue volume on SPGR fat suppressed MRI. Med Imaging Proc SPIE. 2005:1942–1949. [Google Scholar]
- 46.Klifa C, Carballido-Gamio J, Wilmes L, Laprie A, Lobo C, Demicco E, Watkins M, Shepherd J, Gibbs J, Hylton N. Quantification of breast tissue index from MR data using fuzzy cluster. Proc IEEE Eng Med Biol Soc. 2004;3:1667–1670. doi: 10.1109/IEMBS.2004.1403503. [DOI] [PubMed] [Google Scholar]
- 47.Khazen M, Warren R, Boggis C R, Bryant EC, Reed S, Warsi I, Pointon LJ, Kwan-Lim GE, Thompson D, Eeles R. A pilot study of compositional analysis of the breast and estimation of breast mammographic density using three-dimensional T1-weighted magnetic resonance imaging. Cancer Epidemiol Biomarkers Prev. 2008;17(9):2268–2274. doi: 10.1158/1055-9965.EPI-07-2547. [DOI] [PMC free article] [PubMed] [Google Scholar]
- 48.Thompson DJ, Leach MO, Kwan-Lim G, Gayther SA, Ramus SJ, Warsi I, Lennard F, Khazen M, Bryant E, Reed S. Assessing the usefulness of a novel MRI-based breast density estimation algorithm in a cohort of women at high genetic risk of breast cancer: the UK MARIBS study. Breast Cancer Res. 2009;11(6):R80. doi: 10.1186/bcr2447. [DOI] [PMC free article] [PubMed] [Google Scholar]
- 49.Clendenen TV, Zeleniuch-Jacquotte A, Moy L, Pike MC, Rusinek H, Kim S. Comparison of 3-point dixon imaging and fuzzy C-means clustering methods for breast density measurement. J Magn Reson Imaging. 2013;38(2):474–481. doi: 10.1002/jmri.24002. [DOI] [PubMed] [Google Scholar]
- 50.Graham SJ, Ness S, Hamilton BS, Bronskill MJ. Magnetic resonance properties of ex vivo breast tissue at 1.5 T. Magn Reson Med. 1997;38:669–677. doi: 10.1002/mrm.1910380422. [DOI] [PubMed] [Google Scholar]
- 51.Graham SJ, Stanchev PL, Lloyd-Smith JO, Bronskill MJ, Plewes DB. Changes in fibroglandular volume and water content of breast tissue during the menstrual cycle observed by MR imaging at 1.5 T. J Magn Reson Imaging. 1995;5:695–701. doi: 10.1002/jmri.1880050613. [DOI] [PubMed] [Google Scholar]
- 52.Graham SJ, Bronskill MJ, Byng JW, Yaffe MJ, Boyd NF. Quantitative correlation of breast tissue parameters using magnetic resonance and X-ray mammography. Br J Cancer. 1996;73:162–168. doi: 10.1038/bjc.1996.30. [DOI] [PMC free article] [PubMed] [Google Scholar]
- 53.Boyd N, Martin L, Chavez S, Gunasekara A, Salleh A, Melnichouk O, Yaffe M, Friedenreich C, Minkin S, Bronskill M. Breast-tissue composition and other risk factors for breast cancer in young women: a cross-sectional study. Lancet Oncol. 2009;10(6):569–580. doi: 10.1016/S1470-2045(09)70078-6. [DOI] [PubMed] [Google Scholar]
- 54.Nie K, Chen JH, Chan S, Chau MK, Yu HJ, Bahri S, Tseng T, Nalcioglu O, Su MY. Development of a quantitative method for analysis of breast density based on 3-dimensional breast MRI. Med Phys. 2008;35(12):5253–5262. doi: 10.1118/1.3002306. [DOI] [PMC free article] [PubMed] [Google Scholar]
- 55.Chang DH, Chen JH, Lin M, Bahri S, Yu HJ, Mehta RS, Nie K, Hsiang DJ, Nalcioglu O, Su MY. Comparison of breast density measured on MR images acquired using fat-suppressed versus nonfat-suppressed sequences. Med Phys. 2011;38:5961–5968. doi: 10.1118/1.3646756. [DOI] [PMC free article] [PubMed] [Google Scholar]
- 56.Wang L, Filippatos K, Friman O, Hahn HK. Fully automated segmentation of the pectoralis muscle boundary in breast MR images. SPIE Med Imaging. 2011 [796309-796309-8] [Google Scholar]
- 57.Gallego C, Martel AL. Automatic atlas-based segmentation of the breast in MRI for 3D breast volume computation. Med Phys. 2012;39(10):5835–5848. doi: 10.1118/1.4748504. [DOI] [PubMed] [Google Scholar]
- 58.Gubern-Mérida A, Kallenberg M, Martí R, Karssemeijer N. 2011. Fully automatic fibroglandular tissue segmentation in breast MRI: atlas-based approach. (MICCAI Workshop: Breast Image Analysis). [Google Scholar]
- 59.Reed VK, Woodward WA, Zhang L, Strom EA, Perkins GH, Tereffe W, Oh JL, Yu TK, Bedrosian I, Whitman GJ. Automatic segmentation of whole breast using atlas approach and deformable image registration. Int J Radiat Oncol Biol Phys. 2009;73:1493–1500. doi: 10.1016/j.ijrobp.2008.07.001. [DOI] [PMC free article] [PubMed] [Google Scholar]
- 60.Ertas G, Gulcur HO, Osman O, Ucan ON, Tunaci M, Dursun M. Breast MR segmentation and lesion detection with cellular neural networks and 3D template matching. Comput Biol Med. 2008;38:116–126. doi: 10.1016/j.compbiomed.2007.08.001. [DOI] [PubMed] [Google Scholar]
- 61.Lin M, Chen JH, Wang X, Chan S, Chen S, Su MY. Template-based automatic breast segmentation on MRI by excluding the chest region. Med Phys. 2013;40(12):122301. doi: 10.1118/1.4828837. [DOI] [PMC free article] [PubMed] [Google Scholar]
- 62.Wu S, Weinstein S, Kontos D. Atlas-based probabilistic fibroglandular tissue segmentation in breast MRI. Med Image Comput Comput Assist Interv. 2012;15:437–445. doi: 10.1007/978-3-642-33418-4_54. [DOI] [PMC free article] [PubMed] [Google Scholar]
- 63.Wu S, Weinstein SP, Conant EF, Kontos D. Automated fibroglandular tissue segmentation and volumetric density estimation in breast MRI using an atlas-aided fuzzy C-means method. Med Phys. 2013;40(12):122302. doi: 10.1118/1.4829496. [DOI] [PMC free article] [PubMed] [Google Scholar]
- 64.Twellmann T, Lichte O, Nattkemper TW. An adaptive tissue characterization network for model-free visualization of dynamic contrast enhanced magnetic resonance image data. IEEE Trans Med Imaging. 2005;24(10):1256–1266. doi: 10.1109/TMI.2005.854517. [DOI] [PubMed] [Google Scholar]
- 65.Gallego C, Martel AL. Automatic model-based 3D segmentation of the breast in MRI. Proc SPIE. 2011;7962:796215-1–796215-8. [Google Scholar]
- 66.Wu S, Weinstein SP, Conant EF, Schnall MD, Kontos D. Automated chest wall line detection for whole-breast segmentation in sagittal breast MR images. Med Phys. 2013;40(4):042301. doi: 10.1118/1.4793255. [DOI] [PMC free article] [PubMed] [Google Scholar]
- 67.Nie K, Chang D, Chen JH, Hsu CC, Nalcioglu O, Su MY. Quantitative analysis of breast parenchymal patterns using 3D fibroglandular tissue segmentation based on MRI. Med Phys. 2010;37(1):217–226. doi: 10.1118/1.3271346. [DOI] [PMC free article] [PubMed] [Google Scholar]
- 68.Nie K, Chang D, Chen JH, Shih TC, Hsu CC, Nalcioglu O, Su MY. Impact of skin removal on quantitative measurement of breast density using MRI. Med Phys. 2010;37(1):227–233. doi: 10.1118/1.3271353. [DOI] [PMC free article] [PubMed] [Google Scholar]
- 69.Chan S, Su MY, Lei FJ, Wu JP, Lin M, Nalcioglu O, Feig SA, Chen JH. Menstrual cycle-related fluctuations in breast density measured by using three-dimensional MR imaging. Radiology. 2011;261(3):744–751. doi: 10.1148/radiol.11110506. [DOI] [PMC free article] [PubMed] [Google Scholar]
- 70.Nie K, Su MY, Chau MK, Chan S, Nguyen H, Tseng T, Huang Y, McLaren CE, Nalcioglu O, Chen JH. Age- and race-dependence of the fibroglandular breast density analyzed on 3D MRI. Med Phys. 2010;37(6):2770–2776. doi: 10.1118/1.3426317. [DOI] [PMC free article] [PubMed] [Google Scholar]
- 71.Chen JH, Chan S, Liu YJ, Yeh DC, Chang CK, Chen LK, Pan WF, Kuo CC, Lin M, Chang DH. Consistency of breast density measured from the same women in four different MR scanners. Med Phys. 2012;39(8):4886–4895. doi: 10.1118/1.4736824. [DOI] [PMC free article] [PubMed] [Google Scholar]
- 72.Chen JH, Nie K, Bahri S, Hsu CC, Hsu FT, Shih HN, Lin M, Nalcioglu O, Su MY. MRI evaluation of decrease of breast density in the contralateral normal breast of patients receiving neoadjuvant chemotherapy. Radiology. 2010;255(1):44–52. doi: 10.1148/radiol.09091090. [DOI] [PMC free article] [PubMed] [Google Scholar]
- 73.Chen JH, Pan WF, Kao J, Lu J, Chen LK, Kuo CC, Chang CK, Chen WP, McLaren CE, Bahri S. Effect of taxane-based neoadjuvant chemotherapy on fibroglandular tissue volume and percent breast density in the contralateral normal breast evaluated by 3T MR. NMR Biomed. 2013;26(12):1705–1713. doi: 10.1002/nbm.3006. [DOI] [PMC free article] [PubMed] [Google Scholar]
- 74.Chen JH, Chang YC, Chang D, Wang YT, Nie K, Chang RF, Nalcioglu O, Huang CS, Su MY. Reduction of breast density following tamoxifen treatment evaluated by 3-D MRI: preliminary study. Magn Reson Imaging. 2011;29(1):91–98. doi: 10.1016/j.mri.2010.07.009. [DOI] [PMC free article] [PubMed] [Google Scholar]
- 75.Tagliafico A, Bignotti B, Tagliafico G, Astengo D, Martino L, Airaldi S, Signori A, Sormani MP, Houssami N, Calabrese M. Breast density assessment using a 3T MRI system: comparison among different sequences. PLoS One. 2014;9(6):e99027. doi: 10.1371/journal.pone.0099027. [DOI] [PMC free article] [PubMed] [Google Scholar]
- 76.Bakic PR, Carton AK, Kontos D, Zhang C, Troxel AB, Maidment AD. Breast percent density: estimation on digital mammograms and central tomosynthesis projections. Radiology. 2009;252(1):40–49. doi: 10.1148/radiol.2521081621. [DOI] [PMC free article] [PubMed] [Google Scholar]
- 77.Kontos D, Bakic PR, Carton AK, Troxel AB, Conant EF, Maidment AD. Parenchymal texture analysis in digital breast tomosynthesis for breast cancer risk estimation: a preliminary study. Acad Radiol. 2009;16(3):283–298. doi: 10.1016/j.acra.2008.08.014. [DOI] [PMC free article] [PubMed] [Google Scholar]
- 78.Tagliafico A, Tagliafico G, Astengo D, Cavagnetto F, Rosasco R, Rescinito G, Monetti F, Calabrese M. Mammographic density estimation: one-to-one comparison of digital mammography and digital breast tomosynthesis using fully automated software. Eur Radiol. 2012;22:1265–1270. doi: 10.1007/s00330-012-2380-y. [DOI] [PubMed] [Google Scholar]
- 79.Ducote JL, Molloi S. Quantification of breast density with dual energy mammography: an experimental feasibility study. Med Phys. 2010;37(2):793–801. doi: 10.1118/1.3284975. [DOI] [PMC free article] [PubMed] [Google Scholar]
- 80.Maskarinec G, Morimoto Y, Daida Y, Laidevant A, Malkov S, Shepherd JA, Novotny R. Comparison of breast density measured by dual energy X-ray absorptiometry with mammographic density among adult women in Hawaii. Cancer Epidemiol. 2011;35(2):188–193. doi: 10.1016/j.canep.2010.06.009. [DOI] [PMC free article] [PubMed] [Google Scholar]
- 81.Laidevant AD, Malkov S, Flowers CI, Kerlikowske K, Shepherd JA. Compositional breast imaging using a dual-energy mammography protocol. Med Phys. 2010;37(1):164–174. doi: 10.1118/1.3259715. [DOI] [PMC free article] [PubMed] [Google Scholar]
- 82.Shepherd JA, Malkov S, Fan B, Laidevant A, Novotny R, Maskarinec G. Breast density assessment in adolescent girls using dual-energy X-ray absorptiometry: a feasibility study. Cancer Epidemiol Biomarkers Prev. 2008;17(7):1709–1713. doi: 10.1158/1055-9965.EPI-08-0006. [DOI] [PMC free article] [PubMed] [Google Scholar]
- 83.Huang SY, Boone JM, Yang K, Packard NJ, McKenney SE, Prionas ND, Lindfors KK, Yaffe MJ. The characterization of breast anatomical metrics using dedicated breast CT. Med Phys. 2011;38(4):2180–2191. doi: 10.1118/1.3567147. [DOI] [PMC free article] [PubMed] [Google Scholar]
- 84.Vedantham S, Shi L, Karellas A, O'Connell AM. Dedicated breast CT: fibroglandular volume measurements in a diagnostic population. Med Phys. 2012;39(12):7317–7328. doi: 10.1118/1.4765050. [DOI] [PMC free article] [PubMed] [Google Scholar]
- 85.Han T, Lai CJ, Chen LG, Liu XM, Shen YT, Zhong YC, Ge SP, Yi Y, Wang TP, Yang WT. Breast density measurement: 3D cone beam computed tomography (CBCT) images versus 2D digital mammograms. Proc SPIE. 2009;7258:72580L–72581L. [Google Scholar]
- 86.Blackmore KM, Dick S, Knight J, Lilge L. Estimation of mammographic density on an interval scale by transillumination breast spectroscopy. J Biomed Opt. 2008;13(6):064030. doi: 10.1117/1.3041498. [DOI] [PubMed] [Google Scholar]
- 87.Cerussi AE, Berger AJ, Bevilacqua F, Shah N, Jakubowski D, Butler J, Holcombe RF, Tromberg BJ. Sources of absorption and scattering contrast for near-infrared optical mammography. Acad Radiol. 2001;8(3):211–218. doi: 10.1016/S1076-6332(03)80529-9. [DOI] [PubMed] [Google Scholar]
- 88.Shah N, Cerussi AE, Eker C, Espinoza J, Butler J, Fishkin J, Hornung R, Tromberg B. Noninvasive functional optical spectroscopy of human breast tissue. Proc Natl Acad Sci. 2001;98(8):4420–4425. doi: 10.1073/pnas.071511098. [DOI] [PMC free article] [PubMed] [Google Scholar]
- 89.Blackmore KM, Knight JA, Jong R, Lilge L. Assessing breast tissue density by transillumination breast spectroscopy (TIBS): an intermediate indicator of cancer risk. Br J Radiol. 2007;80(955):545–556. doi: 10.1259/bjr/26858614. [DOI] [PubMed] [Google Scholar]
- 90.Blackmore KM, Knight JA, Lilge L. Association between transillumination breast spectroscopy and quantitative mammographic features of the breast. Cancer Epidemiol Biomarkers Prev. 2008;17(5):1043–1050. doi: 10.1158/1055-9965.EPI-07-2658. [DOI] [PubMed] [Google Scholar]
- 91.Glide-Hurst CK, Duric N, Littrup P. Volumetric breast density evaluation from ultrasound tomography images. Med Phys. 2008;35(9):3988–3997. doi: 10.1118/1.2964092. [DOI] [PubMed] [Google Scholar]
- 92.Glide C, Duric N, Littrup P. Novel approach to evaluating breast density utilizing ultrasound tomography. Med Phys. 2007;34(2):744–753. doi: 10.1118/1.2428408. [DOI] [PubMed] [Google Scholar]
- 93.Chen JH, Huang CS, Chien KC, Takada E, Moon WK, Wu JH, Cho N, Wang YF, Chang RF. Breast density analysis for whole breast ultrasound images. Med Phys. 2009;36(11):4933–4943. doi: 10.1118/1.3233682. [DOI] [PubMed] [Google Scholar]
- 94.Moon WK, Shen YW, Huang CS, Luo SC, Kuzucan A, Chen JH, Chang RF. Comparative study of density analysis using automated whole breast ultrasound and MRI. Med Phys. 2011;38(1):382–389. doi: 10.1118/1.3523617. [DOI] [PMC free article] [PubMed] [Google Scholar]
- 95.Tagliafico A, Tagliafico G, Astengo D, Airaldi S, Calabrese M, Houssami N. Comparative estimation of percentage breast tissue density for digital mammography, digital breast tomosynthesis, and magnetic resonance imaging. Breast Cancer Res Treat. 2013;138:311–317. doi: 10.1007/s10549-013-2419-z. [DOI] [PubMed] [Google Scholar]
- 96.Tagliafico AS, Tagliafico G, Cavagnetto F, Calabrese M, Houssami N. Estimation of percentage breast tissue density: comparison between digital mammography (2D full field digital mammography) and digital breast tomosynthesis according to different BI-RADS categories. Br J Radiol. 2013;86(1031):20130255. doi: 10.1259/bjr.20130255. [DOI] [PMC free article] [PubMed] [Google Scholar]
- 97.Salvatore M, Margolies L, Kale M, Wisnivesky J, Kotkin S, Henschke CI, Yankelevitz DF. Breast density: comparison of chest CT with mammography. Radiology. 2014 Jan;270(1):67–73. doi: 10.1148/radiol.13130733. [DOI] [PubMed] [Google Scholar]
- 98.Geeraert N, Klausz R, Cockmartin L, Muller S, Bosmans H, Bloch I. Comparison of volumetric breast density estimations from mammography and thorax CT. Phys Med Biol. 2014;59(15):4391–4409. doi: 10.1088/0031-9155/59/15/4391. [DOI] [PubMed] [Google Scholar]
- 99.Moon WK, Lo CM, Goo JM, Bae MS, Chang JM, Huang CS, Chen JH, Ivanova V, Chang RF. Quantitative analysis for breast density estimation in low dose chest CT scans. J Med Syst. 2014;38(3):21. doi: 10.1007/s10916-014-0021-5. [DOI] [PubMed] [Google Scholar]
- 100.Wang XY, Chen JH, Liao YH, Fwu PT, Lin M, Su MY. Presented at the 21th ISMRM Meeting, Salt Lake City. 2013. Comparative measurement of breast volume and dense tissue volume based on breast MRI and low dose chest CT. [Program Number: 3366] [Google Scholar]
- 101.Simick M, Jong R, Wilson B, Lilge L. Non-ionizing near infrared radiation transillumination spectroscopy for breast tissue density and assessment of breast cancer risk. J Biomed Opt. 2004;9:794–803. doi: 10.1117/1.1758269. [DOI] [PubMed] [Google Scholar]
- 102.Blyschak K, Simick M, Jong R, Lilge L. Classification of breast tissue density by optical transillumination spectroscopy: optical and physiological effects governing predictive value. Med Phys. 2004;31:1398–1414. doi: 10.1118/1.1738191. [DOI] [PubMed] [Google Scholar]
- 103.Srinivasan S, Pogue B, Jiang S, Dehghani H, Kogel C, Soho S, Gibson JJ, Tosteson TD, Poplack SP, Paulsen KD. Interpreting hemoglobin and water concentration, oxygen saturation and scattering measured in vivo by near infrared breast tomography. Proc Natl Acad Sci. 2003;100:12349–12354. doi: 10.1073/pnas.2032822100. [DOI] [PMC free article] [PubMed] [Google Scholar]
- 104.Taroni P, Pifferi A, Salvagnini E, Spinelli L, Torricelli A, Cubeddu R. Seven-wavelength time-resolved optical mammography extending beyond 1000 nm for breast collagen quantification. Opt Express. 2009;17(18):15932–15946. doi: 10.1364/OE.17.015932. [DOI] [PubMed] [Google Scholar]
- 105.Knight JA, Blackmore KM, Wong J, Tharmalingam S, Lilge L. Optical spectroscopy of the breast in premenopausal women reveals tissue variation with changes in age and parity. Med Phys. 2010;37(2):419–426. doi: 10.1118/1.3276737. [DOI] [PubMed] [Google Scholar]
- 106.Simick MK, Lilge L. Optical transillumination spectroscopy to quantify parenchymal tissue density: an indicator for breast cancer risk. Br J Radiol. 2005;78(935):1009–1017. doi: 10.1259/bjr/14696165. [DOI] [PubMed] [Google Scholar]
- 107.Pham TH, Coquoz O, Fishkin JB, Anderson E, Tromberg BJ. Broad bandwidth frequency domain instrument for quantitative tissue optical spectroscopy. Rev Sci Instrum. 2000;71:2500–2513. [Google Scholar]
- 108.Bevilacqua F, Berger AJ, Cerussi AE, Jakubowski D, Tromberg BJ. Broadband absorption spectroscopy in turbid media by combined frequency-domain and steady state methods. Appl Opt. 2000;39:6498–6507. doi: 10.1364/ao.39.006498. [DOI] [PubMed] [Google Scholar]
- 109.Jakubowski DB, Cerussi AE, Bevilacqua F, Shah N, Hsiang D, Butler J, Tromberg BJ. Monitoring neoadjuvant chemotherapy in breast cancer using quantitative diffuse optical spectroscopy: a case study. J Biomed Opt. 2004;9:230–238. doi: 10.1117/1.1629681. [DOI] [PubMed] [Google Scholar]
- 110.Taroni P, Quarto G, Pifferi A, Ieva F, Paganoni AM, Abbate F, Balestreri N, Menna S, Cassano E, Cubeddu R. Optical identification of subjects at high risk for developing breast cancer. J Biomed Opt. 2013;18(6):060507. doi: 10.1117/1.JBO.18.6.060507. [DOI] [PubMed] [Google Scholar]
- 111.Taroni P, Pifferi A, Quarto G, Spinelli L, Torricelli A, Abbate F, Balestreri N, Ganino S, Menna S, Cassano E. Effects of tissue heterogeneity on the optical estimate of breast density. Biomed Opt Express. 2012;3(10):2411–2418. doi: 10.1364/BOE.3.002411. [DOI] [PMC free article] [PubMed] [Google Scholar]
- 112.Shah N, Cerussi AE, Jakubowski D, Hsiang D, Butler J, Tromberg BJ. Spatial variations in optical and physiological properties of healthy breast tissue. J Biomed Opt. 2004;9(3):534–540. doi: 10.1117/1.1695560. [DOI] [PubMed] [Google Scholar]
- 113.Kukreti S, Cerussi AE, Tanamai W, Hsiang D, Tromberg BJ, Gratton E. Characterization of metabolic differences between benign and malignant tumors: high-spectral-resolution diffuse optical spectroscopy. Radiology. 2010;254(1):277–284. doi: 10.1148/radiol.09082134. [DOI] [PMC free article] [PubMed] [Google Scholar]
- 114.O'Sullivan TD, Leproux A, Chen JH, Bahri S, Matlock A, Roblyer D, McLaren CE, Chen WP, Cerussi AE, Su MY. Optical imaging correlates with magnetic resonance imaging breast density and reveals composition changes during neoadjuvant chemotherapy. Breast Cancer Res. 2013;15(1):R14. doi: 10.1186/bcr3389. [DOI] [PMC free article] [PubMed] [Google Scholar]
- 115.Kim WH, Moon WK, Kim SJ, Yi A, Yun BL, Cho N, Chang JM, Koo HR, Kim MY, Bae MS. Ultrasonographic assessment of breast density. Breast Cancer Res Treat. 2013;138(3):851–859. doi: 10.1007/s10549-013-2506-1. [DOI] [PubMed] [Google Scholar]
- 116.Moon WK, Lo CM, Chang JM, Bae MS, Kim WH, Huang CS, Chen JH, Kuo MH, Chang RF. Rapid breast density analysis of partial volumes of automated breast ultrasound images. Ultrason Imaging. 2013;35(4):333–343. doi: 10.1177/0161734613505998. [DOI] [PubMed] [Google Scholar]