

Abstract
The structure and function of the human brain are highly stereotyped, implying a conserved molecular program responsible for its development, cellular structure, and function. We applied a correlation-based metric of “differential stability” (DS) to assess reproducibility of gene expression patterning across 132 structures in six individual brains, revealing meso-scale genetic organization. The highest DS genes are highly biologically relevant, with enrichment for brain-related biological annotations, disease associations, drug targets, and literature citations. Using high DS genes we identified 32 anatomically diverse and reproducible gene expression signatures, which represent distinct cell types, intracellular components, and/or associations with neurodevelopmental and neurodegenerative disorders. Genes in neuron-associated compared to non-neuronal networks showed higher preservation between human and mouse; however, many diversely-patterned genes displayed dramatic shifts in regulation between species. Finally, highly consistent transcriptional architecture in neocortex is correlated with resting state functional connectivity, suggesting a link between conserved gene expression and functionally relevant circuitry.
The adult human brain is composed of many regions with distinct distributions of cell types and patterns of functional connectivity. Underlying this complexity is differential transcription, whereby different brain regions and their constituent cell types express unique combinations of genes during their developmental specification and maturation and in their mature functional state. Despite a range of brain sizes across individuals and variation in sulcal patterning in the neocortex, the general anatomical positioning of and connectivity between regions is highly stereotyped between individuals, suggesting that a significant proportion of the transcriptional coding for this common architecture is conserved across the human population.
We aimed to identify the core or “canonical” transcriptional machinery conserved across individuals, in contrast to numerous studies that explore genetic variants associated with disease traits by analyzing enormous sample sizes in population studies1, 2. If common expression relationships can be identified with high confidence in modest sample sizes and with good anatomical coverage of various brain regions, the resulting “default gene network” could provide a base template for understanding the genetic underpinnings of highly conserved features of brain organization and a baseline from which deviations in individual patients may be measured and associated with diseases such as autism, schizophrenia, epilepsy, and major depression. While prior studies have identified gene networks associated with normal and diseased brain architecture in limited brain regions3–7, the new availability of a dataset with vastly enhanced structural coverage allows an explicit approach aimed at identifying network structure common across individuals that is related to structural and functional organization of the entire brain.
We approached this problem by identifying genes with highly consistent patterning across anatomical structures in six independent human brains of the Allen Human Brain Atlas (http://human.brain-map.org/) using the concept of differential stability (DS), which we define as the tendency for a gene to exhibit reproducible differential expression relationships across brain structure8. To understand large-scale transcriptome organization, we apply weighted gene co-expression network analysis (WGCNA)9, 10 to sets of high DS genes. This and other quantitative network-based approaches have proven to be powerful tools for elucidating cell type, anatomic, and species-specific patterning. Studies using these methods suggest that, largely because of their nonparametric statistically robust nature, conserved differential expression relationships may be more descriptive of transcriptome organization than absolute magnitude of expression level3, 5, 11–13. We find that high DS genes, and the gene networks involving them, show highly significant enrichment of functional ontology, disease and drug association terms as well as strong relationships to anatomical structure and functional connectivity, indicating they may represent essential transcriptional features of the human brain.
RESULTS
Conserved transcriptional patterning in adult human brain
To identify genes with highly conserved patterning across brain regions, we analyzed the complete dataset from the Allen Human Brain Atlas consisting of six neurotypical adult whole brains. This included 3 Caucasian males, 2 African American males and 1 Caucasian woman, the first two of which were part of an initial report on the project3. For each brain, 345–911 samples spanning one (n=4) or both (n=2) hemispheres were analyzed using whole genome Agilent microarrays. In total, samples from 232 discrete brain structures were sampled at least once in at least one brain. We first focused on comparing expression patterns for a smaller set of 96 brain regions that were sampled at least twice in at least five brains, pooling across hemispheres (Supplementary Table 1). Figure 1a shows the number of genes (out of the 81.8% expressed in all 6 brains, Supplementary Methods) that are differentially expressed between pairs of these regions in at least five of six specimens. Large transcriptional differences are seen between major structures. Heterogeneity within subdivisions is also evident, such as the distinctive patterning of primary visual cortex compared to other cortical regions3, 14 and complex differentiation of nuclei in the brainstem. In contrast, cortex, cerebellum, and amygdala are notably homogenous across their constituent subdivisions. This representation highlights the magnitude of meso-scale (fine but not cellular resolution) similarities and differences between brain regions. In addition to the open access data resource (www.brain-map.org), this new map, its associated genes, meta-data, and anatomic guide are available for dynamic online browsing (http://casestudies.brain-map.org/ggb).
Figure 1. Reproducible differential gene expression between brain regions across six individuals.
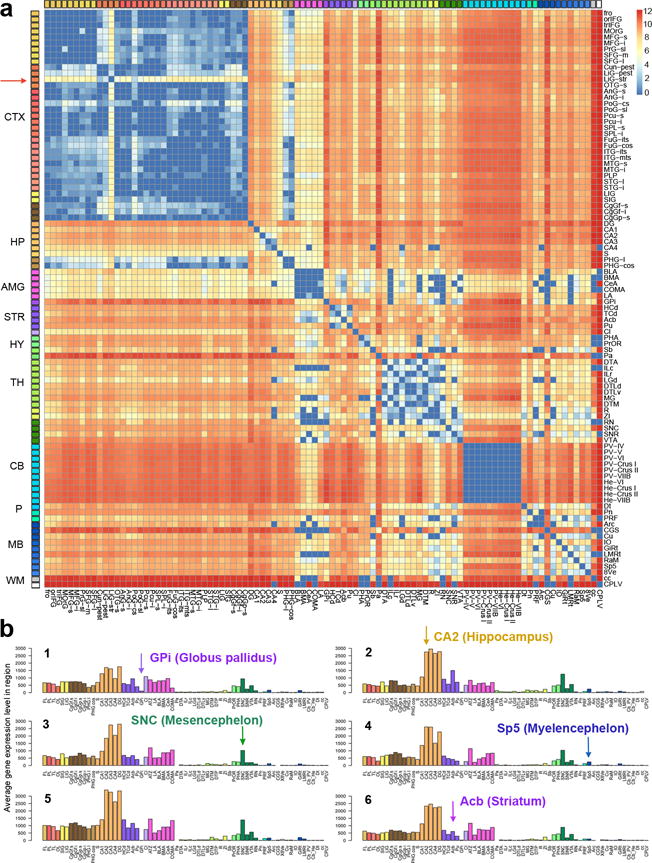
(a) Consensus map of all genes differentially expressed between any pair of 96 regions in at least five of six specimens. Each matrix entry represents the number of genes with at least a fold change > 3 in expression level between those two structures (unpaired t-test, Benjamini & Hochberg FDR corrected q-value q< 0.01). The scale is log base 2 with deep blue indicating no genes that are differentially expressed above threshold. Large differences between major brain structures are apparent, with comparative homogeneity within structures such as cerebellum, amygdala, and cerebral cortex. LiG-str (Lingual Gyrus – striate cortex) contains primary visual cortex (red arrow), which shows differential expression relative to the rest of cerebral cortex. (b) Consistent expression pattern of PCDH8 across individual brains (numbered 1–6), with cortical and cerebellar samples reduced to major lobes (shown for 65/132 structures for readability) (FL: frontal lobe, OL: occipital lobe, TL: temporal lobe, PL: parietal lobe). CTX: cortex; HP: hippocampus; AMG: amygdala; STR: striatum; HY: hypothalamus; TH: thalamus; CB: cerebellum; P: pons; MB: midbrain; WM: white matter; GPi, Globus pallidus, internal segment; CA2, Hippocampal CA2 subfield; SNC, substantia nigra, pars compacta; Sp5, spinal trigeminal nucleus; Acb, nucleus accumbens.
In addition to globally conserved differential relationships, the patterning for any given gene across structures in different individuals is often well conserved. Figure 1b shows the CNS-specific cell adhesion proto-cadherin family member PCDH8, implicated in the development of schizophrenia15, having a distinctive brain-wide pattern that is highly consistent across all six brains. High conservation of anatomical patterning across individuals has been proposed to explain common core functionality of the human brain16, 17, and we sought to test that hypothesis with this dataset. So as to not overly bias the analysis toward the homogeneous cortex and cerebellum, here we treated all samples from the same cortical or cerebellar lobes as a single brain region (Supplementary Table 1). Finally, by including all available structures, we retain a set of 132 of the original 232 structures, which are used for the remainder of the analysis.
Genes with conserved patterning relate to brain function
To quantify reproducibility of expression, we measure the tendency of any one gene to have consistently higher expression in one region than another across all brains sampled. We call this concept differential stability (DS), which we quantify as the average Pearson correlation ρ between pairs of brain specimens over a set of anatomic regions. This concept of reproducibility of structural patterning is well defined and can be captured nearly equivalently by a variety of other metrics (see Supplementary Methods). DS effectively measures the fraction of preserved differential relationships between regions, with a bias for stronger differentials (Fig. 2a). We denote the DS of a gene g over a set of anatomic regions S as ΔS(g), which ranges between ΔBR=0.970 to −0.057 for the 17,348 uniquely annotated human transcripts represented on the microarrays (Supplementary Table 2).
Figure 2. Relationship of DS to brain structure, function and disease.
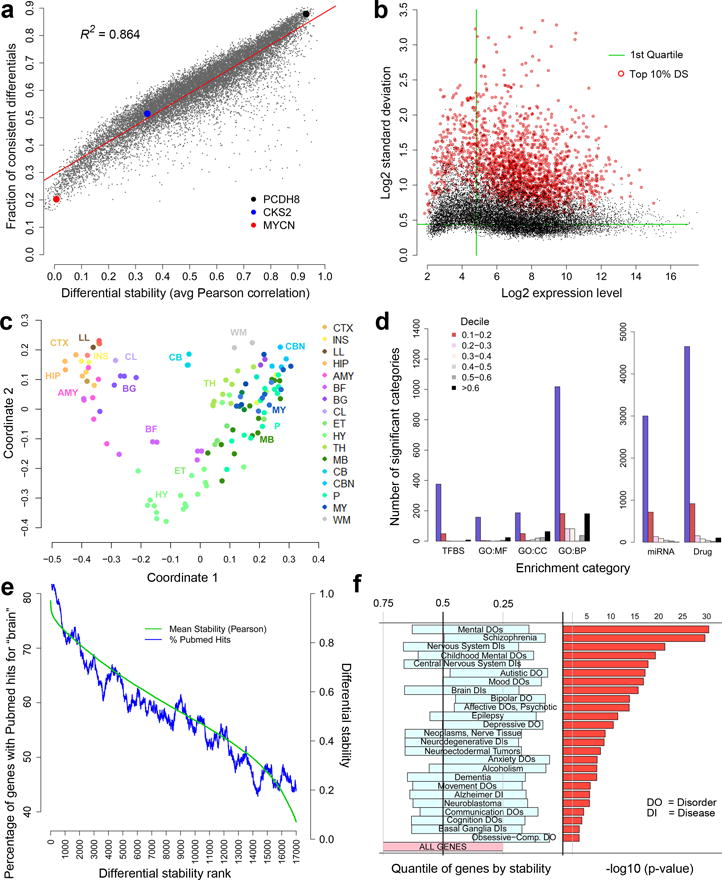
(a) DS is strongly correlated with the fraction of conserved differential gene expression relationships between brain regions (81 regions in >=5/6 brains, averaged across each pair of brains). PCDH8 (black) has high DS, whereas CKS2 (blue) and MYCN (red) show greater variability among individuals. (b) Variation over 132 structures (s.d.) versus expression level for all 17,348 genes. There is no significant relationship between the highest DS genes (top 10% highlighted in red), and expression level (ρ=0.064). Green lines indicate 25th percentile in mean expression level and s.d., respectively. (c) Multi-dimensional scaling analysis to represent transcriptional similarity between anatomical structures using the top 10% of DS genes. Anatomical subdivisions generally cluster according to their membership in major brain structures, common ontogenetic origin and topographic proximity (see Supplementary Table 1 for abbreviations). (d) Highest DS genes are significantly overrepresented (B&H corrected, FDR q<0.01) in functional annotations, dramatically so for drug targets (TFBS=transcription factor binding site; GO:MF=Gene Ontology Molecular Function; CC=Cellular Component; BP=Biological Process; miRNA = miRNA binding site). (e) Strong relationship between DS rank and frequency of study in the literature. Genes ordered by DS score on x-axis; the y-axis shows the fraction of genes in sliding windows of 600 genes (blue) scored for brain citation based on PubMed queries of the form “gene name” + “brain” (scoring 0 no hit, 1 for positive hits). (f) DS distribution of genes associated with brain diseases relative to all genes, showing the 25th to 75th percentile range for each gene set from Autworks (left panel). Diseases are sorted by a hypergeometric test (right panel), assessing significance of overlap between each gene set and the top 10% of DS genes (-log10 p-values).
The gene with highest DS is FOXG1 (ΔBR=0.970), a transcription factor regulating the development of the early born Cajal-Retzius cells in the cerebral cortex18, 19. PCDH8 (shown in Fig. 1B) also has high DS, with ΔBR=0.931. Calcium channels and genes associated with calcium/calmodulin signaling (NRGN, CAMK2A, CAMKV) are overrepresented among high DS genes (p<1.32e-04, BH corrected) indicating a strong conservation of these signaling pathways. Interestingly, potassium channels (p<1.70e-12) are the most over-represented among high DS genes, exhibiting diverse and specific expression patterns (Supplementary Fig. 1). The DS metric selects for genes with moderate to high expression level and moderate to high variability across structures; however, there is no significant relationship (ρ=0.064) between mean gene expression level and high DS (Fig. 2b).
Previous studies have demonstrated transcriptional similarity based on anatomical proximity3, 14, which may reflect phylogenetic and ontogenetic distance20. Consistent with this observation, the relationship between anatomical structures based on these top DS genes generally resembles the physical topography and developmental origins of brain regions, as shown by multidimensional scaling (MDS) in which distance is determined by correlation between samples (Fig. 2c). This ordering and separation between structures is progressively less preserved with decreasing DS (Supplementary Figure 2). In contrast, low DS genes with ubiquitous expression (lower 25th percentile in variability across brain regions, below the horizontal green line in Fig. 2b; Supplementary Table 3), such as the ubiquitin isoforms UBB and UBC, are typically not brain specific. Instead, they appear to provide the basal machinery common to all cell and are enriched for housekeeping functions such as RNA binding (p<3.26e-21), KEGG spliceosome pathway (p<6.4e-13), and mitochondrial ribosomal proteins (p<1.32e-10).
The top 10th percentile set of genes (n=1735) ranked by DS is significantly over-represented in many functional categories (Fig. 2d), including gene ontology (GO) molecular function, cellular component and biological processes associated with neuronal function, and transcription factor binding sites (Supplementary Table 4). Furthermore, the top DS genes have a disproportionate number of drug interactions and a monotonically decreasing association with miRNA targets. Specifically, the first DS decile collectively has 4651 interactions with small molecule drugs and chemicals from major databases (including DrugBank and the Comparative Toxicogenomic Database, Methods), more than 30 times the number in the third decile. There is also a strong relationship between DS and the probability a given gene has been studied in the context of the brain (Fig. 2e, blue).
Finally, brain-related diseases are associated with higher DS genes. The distribution of genes associated with neurological and psychiatric diseases is shifted towards high DS compared to all genes (Fig. 2f), based on 2289 gene sets from the Autworks database (http://autworks.hms.harvard.edu/)21. Genes sets associated with mental disorders (p<8.06e-31) are significantly enriched in the top 10% of DS genes (Fig. 2f; Supplementary Table 5), in particular those for schizophrenia (p<9.14e-30), autism (p<3.45e-17), epilepsy (p<1.00e-11), bipolar disorder (p<4.94e-14), and major depression (p<4.60e-10). This result was independently reproduced in gene sets from the Simons Foundation Autism Research Initiative Database (https://gene.sfari.org/autdb/Welcome.do; n=666; p<1.19e-38) and Alzheimer’s-related genes from the Alzheimer’s Forum (www.alzforum.org; n=630; p<3.55e-07). Taken together these observations indicate that tightly regulated structural transcription is quite important for brain function and dysfunction.
A canonical brain transcription co-expression network
Given the relevance of high DS genes to brain function demonstrated above, we sought to understand the gene regulatory landscape by deriving a core set of co-expression modules based on high DS genes that capture most of the variation between regions. Despite the cellular heterogeneity inherent in different brain regions, network analytic techniques like weighted gene co-expression network analysis (WGCNA)10 have revealed biologically meaningful trends in meso-scale sampled transcriptome data that relate to anatomy and brain function. Indeed, previous analysis using WGCNA on the first human brain from this dataset identified co-expression modules that were generally corroborated in the second brain3.
Using the six brains now available, we identified a consensus network22 common to all brains (Fig. 3a, panel 1), using the 50% highest DS genes (ΔBR>0.5284, g=8674, Supplementary Methods). This network identified 32 major transcriptional patterns, or modules, each represented by a characteristic expression pattern across brain structures, the module eigengene (ME), in each brain (Fig. 3a, panel 2). All genes were then assigned to one of the 32 modules if their average correlation to the corresponding ME across all six brains was greater than 0.4. The great majority of all genes (90.1%, 15,627) are correlated with this relatively small set of patterns (Supplementary Table 6), and the MEs derived from these genes are highly stable (Fig. 3b). Furthermore, these patterns are likely to be representative of a larger population as they are highly consistent across all six individuals, and patterns identified using any five brains could be found reproducibly in the sixth (Supplementary Methods; Supplementary Fig. 3).
Figure 3. Consensus co-expression patterns of the adult brain.
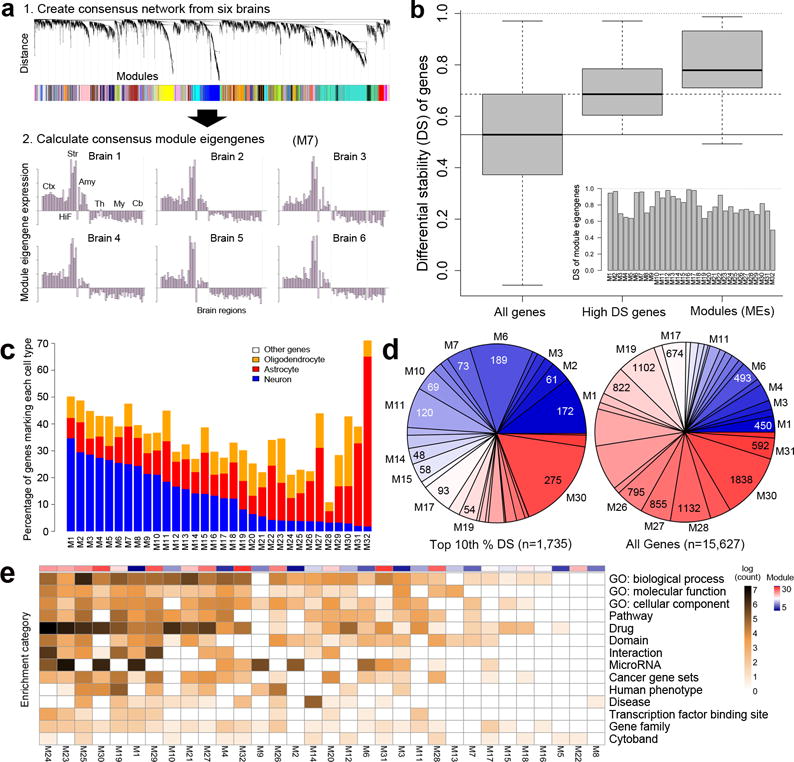
(a) Schematic showing network construction using consensus WGCNA on high DS genes22. Panel 1: Assignment of genes to modules. Panel 2: Module eigengene expression for M7 showing consistent patterning across all 6 brains with peak expression in the striatum. (b) Distribution of DS scores for all genes (left) and genes with ΔBR> 0.528 used for initial network construction (middle). DS metric applied to MEs demonstrates very high consistency of module patterns across brains (right). Inset shows DS score for each ME. (c) Percentage of known neuron, astrocyte and oligodendrocyte-enriched genes in 32 modules, ordered by proportion of neuron-enriched gene membership. (d) Module composition for the top 10% of DS genes (left) versus all genes (right), with modules color-coded from high (blue) to low (red) neuron-enriched gene membership. Note larger proportion of genes assigned to more neuronal modules for high DS genes compared to all genes. (e) Majority of gene annotations are associated with a subset of modules. Log counts of number of significant (B&H corrected, FDR q<0.05) enrichments for gene ontology terms, protein interaction, cytoband, gene families, pathways, and drug interactions. Modules ordered from most (M24, left) to fewest (M8, right) annotations, with neuron-enriched gene membership indicated in top color bar.
Previous studies demonstrated that brain gene modules often correspond to expression in major cell classes including neurons and glia3, 5. To ask how these 32 modules represent expression in specific cell types, we assessed the distribution of genes within each module that are known to be enriched (at least 1.5-fold) for neurons, oligodendrocytes and astrocytes in mouse cultured preparations23 (Supplementary Table 7). While not a perfect comparison given the differences between species and in vivo versus in vitro, there was a clear ordering of modules that could be seen based on predominance of neuronal gene expression (Fig. 3c). These proportions ranged widely from those with largely neuronal signatures (M1-M15) to essentially non-neuronal (M16-M32). Interestingly, the proportion of genes assigned to modules with high neuronal expression (M1-M15, blue in Fig. 3d) was significantly greater for the highest DS gene set (top 10%).
To characterize each module functionally, we used the ToppGene portal (https://toppgene.cchmc.org/;24; Supplementary Methods) to identify significant enrichments in gene ontology, pathways, cytoband, disease association, transcription factor binding sites, micro RNAs, drug targets, and protein-protein interactions (Fig. 3e; Supplementary Table 8). Interestingly, over 96% of all annotations were associated with just 17 of the 32 modules (left-most in Fig. 3e) including those restricted to the highly studied nigro-striatal pathway structures associated with Parkinson’s disease (M10 and M12) as well as a set of predominantly non-neuronal modules (M24, M23, M25, M30; Table 1). Consistent with the overlap with neuronal genes, modules M1-M6 contain by far the most neuronal function-related annotations, including synapse structure and transmission, neurogenesis and neural projection, channel dynamics. The most non-neuronal modules (M21-M32) show strong and unique associations with vasculature development (M21, q<1.17e-17, FDR 0.01), immune system function (M25, q<3.71e-35), and myelination and glial ensheathment (M30, q<1.48e-06). While by construction there are no common genes between any pairs of modules, there are common functional interactions between modules and enrichments based on ontology, pathway, and function. These relationships generally reflect neuronal versus non-neuronal module content and are summarized in Supplementary Figure 4.
Table 1. Ontological and functional associations of the canonical modules.
Each module is given with a representative hub gene, anatomic description, ontology and pathway, drug and disease associations.
| Module (Hub gene) | Anatomy | Ontology/Pathway (q-value FDR) | Drug/Disease (q-value FDR) |
|---|---|---|---|
| MO1 (GABRB3) | Telecephalon | Synaptic transmission, q<1.07e-17, regulation of synaptic pasticity, q<1.04e-10 (*) | Cocaine related disorders, q<4.51e-09, nicotene addiction, q<5.38e-06 (*) |
| M03 (KCNAB2) | Hippocampus, thalamus, pons, medulla | Neurotransmitter transport, q<4.28e-06 (*), axon part, 8.62e-07 (*) | Abnormality of pyramidal motor function, q<1.99e-03 |
| M04 (GABARAPL1) | Thalamocortical | Synaptic vesicle cycle, q<4.66e-14 (*), insulin receptor recycling, q<2.72e-05 (*) | Huntington’s Disease, q<1.28e-04 (*) |
| M06 (MEF2C) | Neocortex, claustrum | Postsynaptic membrane, q<2.5e-05, cell signaling, q<3.58e-06 | Clozapine (schizophrenia, bipolar disease), q<1.87e-03 |
| M07(NGEF) | Striatum, neocortex, amygdala | Calcium signaling pathway. q<1.07e-04, dendritic spine membrane, q<1.69e-03(*) | Fluxoxetine (depression, OCD), q< 4.34e-03 |
| M09 (PGAP1) | Hippocampus, amygdala, hypothalamus | Synaptic membrane, q<5.23e-04, zinc finger, CH-2, q<6.23e-03 | Cognitive impairment, q<5.99e-04, Amyotrophic lateral sclerosis, q<1.74e-03 (*) |
| M10 (ADORA2A) | Striatum | Monoamine GPCRs, q<7.27e-05 (*), dopamine receptor signaling, q<3.30e-05(*) | Drug induced dyskinesia, q< 1.23e-06 (*), haloperidol (schizophrenia, Tourette’s), q< 9.76e-07 |
| M11 (NTNG1) | Dorsal thalamus | Cadherin signaling pathway, q<2.02e-03 (*), cholinergic synapse, q<2.45e-04 (*) | Alzheimer disease-presenilin pathway, q< 2.78e-03 (*) |
| M12 (SLC6A3) | Substantia nigra, ventral tegmental area | Adrenaline, noradrenaline, q<5.48e-06, and dopamine biosynthesis, q<8.39e-06 (*) | Cocaine addiction, q <5.64e-05, dopamine, q<3.68e-06 |
| M14 (TLE6) | Hypothalamus | Neuropeptide signaling, q<9.75e-03 (*), GPCR ligand binding, q<1.76e-04 (*) | X-linked mental retardation, 2.47e-03 (*), Praeder-Willi syndrome, q< 2.47e-03 (*) |
| M15(NEFH) | Deep cerebellar nuclei, brainstem | Neuron projection, q<3.42e-03, neurofilament, q<3.49e-04 (*) | Dexamethasone(cerebral Inflamatory), q<4.99e-03 |
| M16 (SLC47A1) | Dentate gyrus | Protocadherin genes, q<5.740e-04 (*) | Depressive disorder, 8.48e-03(*), Parkinson’s, q<8.48e-03 |
| M17 (CBLN3) | Cerebellar cortex | Zinc fingers, C2H2-type, q<3.66e-05, spinal cord development, q<8.83e-03 (*) | |
| M19 (VDAC2) | Thalamus, cerebellar nuclei, brainstem | Vasculature development, q<1.17e-17 (*), mitochondrial, q<5.50e-82 | Ataxia, q<2.65e-09 (*), Leigh’s syndrome, q<2.18e-08 (*), Alzheimer’s disease, q<3.98e-22 (*) |
| M20 (B3GAT1) | White matter, neocortex, basal ganglia, ventral thalamus | Eukaryotic translation, q< 6.32e-03 (*), ribosomal nucleolus, q<4.82e-14 | Disease progression, q<5.79e-05, selenium, q<2.00e-06, Abnormal blood glucose, q<1.20e-03 (*) |
| M21 (GBP4) | Sensory-motor nuclei, choroid | Vasculature development, q<1.17e-17 (*) | Toluene (abuse), q<3.61e-15, losartan (stroke), q<8.13e-08, azidothymidine (HIV), q<1.17e-07 |
| M24 (POGZ) | Cerebellar cortex, dentate gyrus, white matter, basal ganglia | Zinc fingers, C2H2-type, q<7.37e-40, chromatin organization, q<2.77e-16 (*) | Beta-methylcholine, q<1.53e-16, ellipticine (cancer), q<1.32e-09 |
| M25 (RGS10) | Ependyma, white matter, substantia nigra | Immune system regulation, q< 3.71e-35 (*), inflamatory response, q<3.70e-26 (*) | Systemic lupus erythematosus, q < 8.49E-29 (*), Malignant glioblastoma, q<1.01e-9 |
| M26 (MYCBP) | Ependyma | Cilium organization, q<1.47e-28 (*), Axoneme,q<1.79e-33 (*) | Breathing disregulation, q < 2.25e-05 (*) |
| M28 (SERPINA6) | Interbrain-hindbrain nuclei | G-protein coupled receptors, q<4.06e-07 (*), olfactory receptors, q<1.0e-03 (*) | |
| M29 (GAS5) | White matter, substantia nigra, globus pallidus | Cytosolic ribosome, q<2.96e-102 (*), translation activity, q<1.81e-85 (*) | Influenza lifecyle, q<4.87E-69 (*), Vigabatrin (seizures, epilepsy), q<1.70e-18, |
| M30 (VAMP3) | White matter, ventral thalamus, globus pallidus | Myelination, neuron ensheathment, q<1.48e-06(*) | Cognitive impairment, q<8.99e-06 (*), Hereditory spastic parapaligia, q< 7.83 e-03 (*) |
| M32 (SLC25A18) | Striatum, amygdala, substantia nigra | Glial cell differentiation, q<4.04E-05, astrocyte differentiation, q<2.42e-04 (*) | Dexamethasone (corticosteriod), q<1.58e-07, deafness, q<6.67e-3(*) |
indicates uniquely associated with the module. Modules not reported are weakly annotated. All q-values 0.01 FDR.
From a global anatomical perspective, the 32 gene modules were predominantly enriched either in the telencephalon or in non-telencephalic deeper brain structures (Fig. 4a). Individual modules were enriched in distinct combinations of structures (Fig. 4b; Supplementary Figs. 5–8) and were associated with distinct functional pathways, disease and drug interactions (Table 1; Supplementary Fig. 9). For example, M1 is highly enriched in cortex, hippocampus, amygdala, and striatum, with genes associated with synaptic transmission and in genes down-regulated in Alzheimer’s disease. Some modules were remarkably selective for particular brain regions, such as M6 in cortex, M10 in striatum, M11 in thalamus, M12 in the substantia nigra, M14 in hypothalamus, M16 in dentate gyrus, and M17 in the cerebellum. In agreement with known function, M12 is uniquely associated with dopamine biosynthesis (q<8.39e-06) and cocaine addiction (q<5.64e-05). Other modules showed more complex anatomical patterning, such as non-telencephalic expression (M19), the inverse of M1. M19 is associated with mitochondria (q<5.50e-82) and demyelination (q<2.57e-04), and has strong disease associations with Alzheimer’s (q<3.98e-22), Parkinson’s (q<1.62e-27), and the neurodevelopmental disorder Leigh’s syndrome (q<2.18e-08). Consistent with its non-neuronal enrichment noted above, M25 is enriched in the glia-rich corpus callosum and internal portion of the globus pallidus, and is associated with immune response (q<3.71e-35) and systemic lupus erythemetosis (q<8.49e-29). The complete set of module patterns are provided in Supplementary Figures 5–8, and the complete functional annotations in Supplementary Table 8.
Figure 4. Anatomical specificity of module expression.
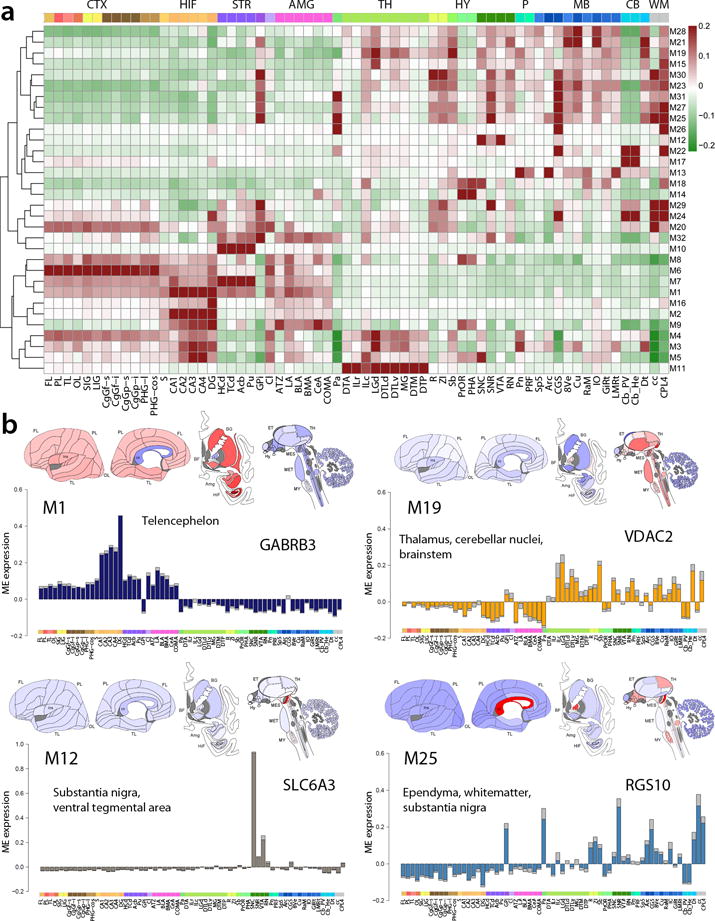
(a) Hierarchical clustering of the modules M1-M32 with anatomic ordering fixed from cortex to brainstem. Individual modules are enriched in specific structures, with a major partition between predominantly telencephalic versus deeper brain region enrichment. (b) Anatomical patterning of 4 representative modules with average ME expression values plotted on brain diagrams and on bar plots (SEM error), with a representative hub gene. Anatomical structures (color-coded by major structure) ordered from neocortex (left) to brainstem (right). Plots for all modules provided in Supplementary Figures 5–8.
Finally, a small number (302) of high DS genes appear to have unique spatial expression patterns, and were not strongly correlated to any of the 32 module eigengenes. 50 of these genes are shown in Figure 5, illustrating the diversity of their expression patterns. Surprisingly, among these outlier patterns are a number of extensively studied genes, including somatostatin (SST), CART prepropeptide (CARTPT), Met proto-oncogene (MET) and Calbindin 1 (CALB1), as well as regional markers (i.e., UTS2D, amygdala; SLC17A8, claustrum; and RRS1, inferior olive). These uniquely patterned yet stable genes are enriched in GPCR pathway and signaling events (q<2.59e-09, Supplementary Table 9). This set is over-represented for genes identified through association analysis of regulatory and non-synonymous SNPs involved in neurotransmission and neurodevelopment (q<2.11e-15)25 and that confer susceptibility to bipolar and obsessive-compulsive disorders and major depression, as well as anorexia nervosa (q<7.23e-12)26. Thus, while the great majority of genes are correlated with a small number of global expression patterns across the brain, a small number of functionally important genes have patterns of spatial regulation that are distinct from these modules.
Figure 5. Unique anatomical patterning of a subset of high DS genes.
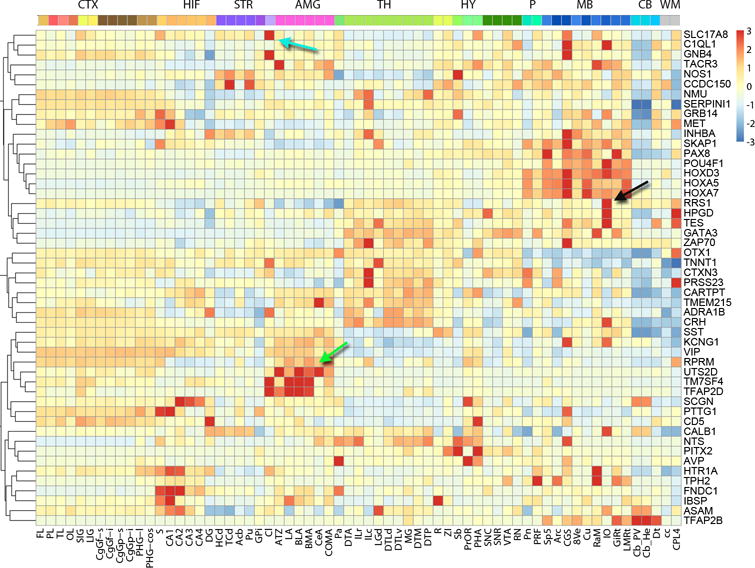
Relative (z-score normalized) expression of 50 genes (rows) across anatomical structures (columns) ordered from cortex to brainstem, clustered by expression pattern. The solute carrier family 17, member 8 (SLC17A8) gene is primarily expressed in the claustrum (Cl, cyan arrow), ribosome biogenesis regulator homolog (RRS1) is enriched in the inferior olivary nucleus (IO, black), and urotensin 2B (UTS2D, green) in the amygdala. These anatomically specific genes have low correlation with any of the 32 major modules.
Differential gene module conservation from human to mouse
Are these core transcriptional modules unique to the human brain or do they reflect mammalian brain architecture more generally? To address this question we compared anatomical distributions and within-module co-expression metrics in human to those in mouse, a dominant model organism in biomedical research. We created an expression matrix for a set of 53 mouse structures unequivocally matching those in the human microarray data, using spatially quantified in situ hybridization (ISH) data for the 2651 genes with n≥2 data in the Allen Mouse Brain Atlas27 (Methods, Supplementary Table 1). We then created a mouse module eigengene for each of the 32 modules defined in human, using the subset of genes present in both species. We used a previously described module preservation index22 to assess the degree to which the co-expression structure of genes within these mouse modules is conserved. Some modules were well preserved (Fig. 6a), including the neuronal-enriched modules M1, M6 and M7, whereas many of the most non-neuronal modules (M25-M32) were poorly preserved. Because this metric is an aggregate score of all genes in a module, we then scored the percentage of genes in each module whose mouse patterns were well correlated with the structural expression pattern of the corresponding human module eigengene (ρ > 0.4). In general, this percentage varied with neuronal content (Fig. 6b), and decreased with decreasing DS (data not shown). In addition, the most neuron-associated modules had the largest number of genes with highly correlated patterns across structures. Interestingly, each module also contained genes that were not only poorly correlated to the human module, but were instead very highly correlated (ρ > 0.8) to a different human module eigengene. Supplementary Table 10 lists the module assignments for each cross-species gene, and whether the gene’s patterning is conserved in mouse.
Figure 6. Module preservation from human to mouse.
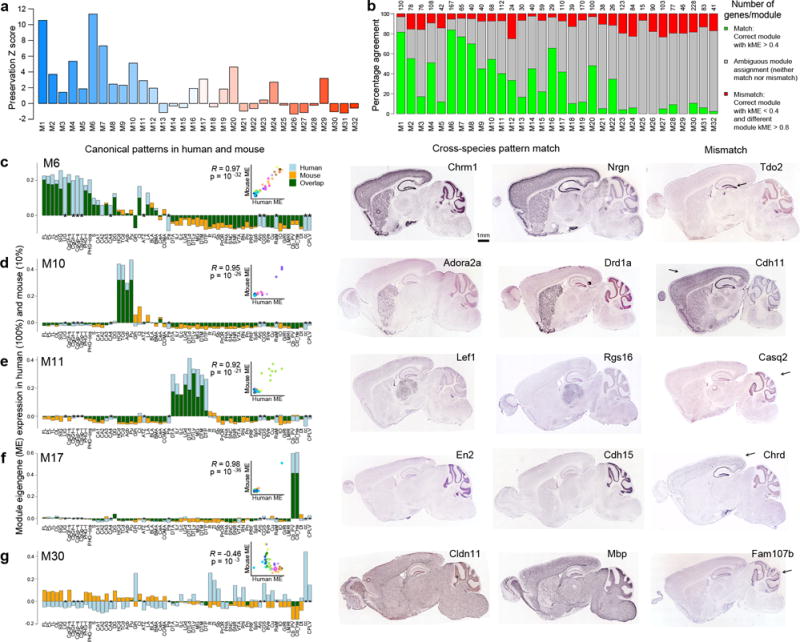
(a) Mouse-human module preservation index, which measures conserved within-module gene co-expression in an anatomy-independent fashion, shows the highest preservation of some of the most neuronal modules (M1, M6, M7). (b) Conservation of anatomical patterning, defined as the proportion of mouse genes correlated at ρ > 0.4 to the corresponding human ME (green bars). A subset of genes in each module are both poorly correlated to the human eigengene (gray bars), and very highly correlated to a different human module eigengene (ρ > 0.8, red bars). (c–g) Correspondence of ME anatomical patterning between human and mouse. Histogram representation of ME pattern in human (light blue) and mouse (orange), with overlap in green, demonstrating highly conserved patterns for M6, M10, M11 and M17, while M30 is weakly anti-correlated. Inset panels show correlation between mouse and human. Asterisks indicate samples present in human but not mouse. Mouse ISH for genes with matching and mismatched patterns in right panels, representing genes in the green and red categories in (b). Arrows indicate areas of differential regulation in mouse. All ISH images from the Allen Mouse Brain Atlas.
Despite massive differences in size and measurement techniques of these two data modalities, many of the modules had very highly correlated expression across specific anatomical regions (Fig. 6c–g). For example, the forebrain-enriched and neuron-associated M6, striatal M10, thalamic M11 and cerebellar M17 had nearly identical patterning. In contrast, the module eigengenes for the non-neuronal module M30 was very poorly correlated. Despite this variation in the overall strength of correlation across species, individual genes with matching anatomical and cellular patterns could be found for each module (left 2 ISH panels in Fig. 6c–g). On the other hand, for each module there were genes whose pattern fundamentally shifts between species (far right ISH panels), for example from thalamic to cerebellar in M11 or from glial to neuronal in M30. Thus, it appears that even in highly preserved modules, some individual genes differ in their patterning across species. The frequency of these changes in gene regulation varies by module, with better general pattern conservation in the more strongly neuronal modules.
Functional connectivity relates to transcription in cortex
Despite its relative homogeneity compared to other brain regions, human neocortex shows variations in transcriptional patterns that are consistent across individuals and are correlated with topographical position across the cortical sheet3. Recent work has revealed that functional brain networks determined using resting-state functional magnetic resonance imaging (fMRI) can be recapitulated using correlated gene expression in postmortem brain tissue28. To explore whether genes with highly consistent cortical patterning across individuals drive this functional organization, we compared transcriptional variation of high DS genes with recent resting state functional connectivity data from the Human Connectome Project (HCP, www.humanconnectome.org)29. We generated a parcellated connectivity matrix C (netmat, Methods) averaged across 447 subjects (rightmost panel in Fig. 7a) using the partial correlation30 among spatially contiguous nodes derived from the resting-state network identified by Yeo et al. (2011)31. We then mapped each cortical region containing transcriptional data onto these corresponding 52 parcels, and analyzed parcels containing at least one gene expression sample.
Figure 7. Cortical DS and Functional Connectivity.
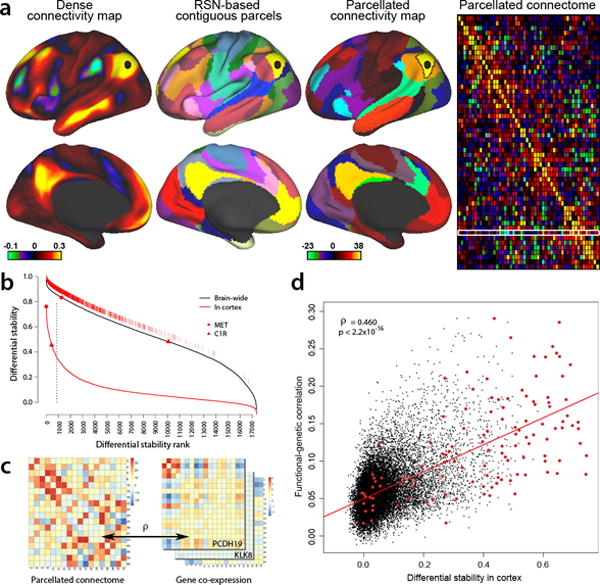
(a) Resting-state functional connectivity from Human Connectome Project (HCP) data (www.humanconnectome.org;29, 45). (Column 1): Functional connectivity from a seed in lateral parietal cortex (black disk), based on a group-average of 468 HCP subjects and showing the full correlation results (scale: Fisher z-transformed ρ); dataset accessible via https://db.humanconnectome.org/data/projects/HCP_500). (Column 2): 52 left-hemisphere contiguous parcels (50 mm2 or larger) from the 17 resting-state networks (RSN) identified by Yeo et al. (2011). (Column 3): parcellated connectivity map for a default-mode network (DMN) parcel (black outline) containing the selected seed, based on 447 HCP subjects (a subset of the above 468) and using partial correlation (scale: z-score). (Column 4): Group-average (n=447) parcellated connectome showing relative connection strength between regions, also based on partial correlation. White rectangular outline identifies connectivity map shown in col. 3. (b) Ranked cortical DS genes (solid red) and brain wide DS genes (black). Top 5th percentile g=867 cortex DS genes (vertical line) are shown as hatch marks just above the whole-brain DS curve. Red disk and triangle show two genes with differing brain-wide and cortical DS. (c) Functional correlation of parcellated RSN connectome (left panel) is compared with genetic co-expression similarity for each gene in each subject (right panel), using the same set of cortical parcels and by calculating the Pearson’s correlation between the vectorized upper diagonal elements of the matrices. (d) DS versus functional-genetic correlation for 17,348 genes. Higher cortical DS genes are more predictive of functional cortical connectivity (ρ=0.46, p<2.2e-16), whereas the correlation is substantially weaker for brain wide DS (ρ=0.17; data not shown). Red points are 132 genes identified as drivers of functional connectivity in a postmortem brain tissue data set whose polymorphisms significantly affect resting-state functional connectivity in a large sample of healthy adolescents28.
Because the transcriptional differences between cortical areas are generally smaller than between major brain regions, we recalculated DS selectively for cortex using those 52 cortical regions matching the functional parcels above. A smaller percentage of genes have high DS in cortex (Fig. 7b); in contrast to whole brain, the top 5th percentile (n=867) of DS cortex genes had ΔCTX>0.357 versus ΔBR>0.854 for whole brain. The rank ordering of genes by whole-brain DS vs cortex-only DS differs markedly, with only 31% of the top 5% of cortical DS genes in the top 5% of brain-wide DS, (Fig. 7b). For example, the MET proto oncogene, a functional marker of gliobastoma (see http://glioblastoma.alleninstitute.org/;32) is ranked first in cortex (ΔCTX=0.761), but ranked 985 for the whole brain. In contrast, the classical complement pathway C1R gene that mediates immune and antibody response and is synthesized by both neurons and glia33 has cortical rank 569 vs. a brain-wide rank of 10094; the C1R gene may contribute to inflammatory and degenerative diseases of the CNS including Alzheimer’s disease33–35. Thus, the DS metric applied to cortex alone identifies genes having more subtle but consistent variation across functionally defined cortical parcels that is not captured when highly distinct structures across the whole brain are included. Local DS scores across 20 major brain structures are supplied in Supplementary Table 11.
To examine which genes have spatial expression patterns that correlate with functional connectivity patterns, and whether this is related to cortical DS, we correlated (Pearson ρ) the parcellated connectome matrix C with gene co-expression matrices E(g) for each of 17,348 genes with data pooled to the same regions (Fig. 7c, Supplementary Methods). Fig. 7d shows that higher cortical DS of a gene is predictive of a stronger correlation between functional connectivity and cortical gene expression pattern (ρ = 0.46, p<2.2e-16; the correlation with brain-wide DS alone was much weaker (ρ=0.17), indicating that the conserved cortical genes correlate most strongly with cortical functional connectivity. Further, we found that 136 genes whose polymorphisms significantly affect resting-state functional connectivity in a large sample of healthy adolescents28 have both higher correlation of expression with functional connectivity (μ=0.12, p<2.2e-192) and higher DS (ΔCTX=0.40, p<1.2e-325) in human cortex (red points, Fig. 7d), though they constitute only a minority (15%) of the highest cortical 5th percentile DS genes. Significant ontological categories of this highest cortical 5th percentile DS genes include main axon (p<7.84e-09), neuron projection (p<2.2e-04), calcium and sodium channel activity (p<3.46e-11), and axon guidance Reactome pathway (p<2.22e-04). These categories are consistent with a role for these genes in neuronal connectivity and function as suggested in other studies28. Supplementary Table 12 gives the functional genetic correlations and associated p-values for all 6 brains.
DISCUSSION
While a great deal of human brain genomic research focuses on individual variation to understand the genetic underpinnings of neurological and neuropsychiatric disease, less emphasis has been placed on understanding the core, “canonical” brain transcriptional regulatory architecture common to all humans. Using the rich microarray profiling dataset in the Allen Human Brain Atlas (http://human.brain-map.org), we demonstrate that many genes show highly consistent patterns of transcriptional regulation across brain regions that can be quantified using a metric of differential stability (DS). Those genes with the most consistent anatomical patterning across individuals appear to be particularly significant for brain function and disease. Remarkably, the highest 10% of brain-wide DS genes are substantially overrepresented for known drug targets and are highly significantly enriched for functional annotations of many cellular functions and biological pathways. This suggests that these genes represent a functionally critical set whose transcriptional regulation is tightly controlled. While we recognize there may remain ascertainment bias in the selection of regional transcriptional patterns insofar as they may be preferentially annotated in available studies, these findings appear relevant as we find that genes with non-specific patterning or ubiquitous expression tend to represent more basal cell functions. Interestingly, approximately 9% of this most conserved gene set has no functional annotation to date, thus representing a set of rich targets for future research into human brain function.
Taking this concept of conserved patterning from genes to gene networks, we demonstrate the existence of a relatively small (32) set of consensus co-expression gene networks that explain the vast majority (90.1%, ρ>0.4) of transcriptional variation across adult brain regions. Although the anatomical sampling in this study was not cell type-specific, some of these networks appear to represent co-expression in broad cell classes such as telencephalic neurons, oligodendrocytes, astrocytes and vasculature, as observed previously3, 5. A second set of networks show striking enrichment in specific brain regions such as the striatum, thalamus, cerebellum and substantia nigra, presumably reflecting unique and coherent expression signatures responsible for the functions of specific neuronal types in these regions. The final set of networks were more difficult to interpret, showing consistent but more complex distributed anatomical patterning and enriched in genes associated with organelles or cellular machinery such as mitochondria, the proteasome, ribonucleoprotein complexes and chromatin. These networks may represent core intracellular pathways that tend to be co-expressed and also differentially enriched in particular brain regions. A small set of highly patterned and consistent genes were not correlated to these consensus networks but rather showed unique patterns. Surprisingly, many of those genes are well studied as markers of specific cell types (e.g. VIP and SST for GABAergic interneurons) or developmental zones (homeobox genes) and are not representative of the patterning of the great majority of genes.
Prior studies of the adult and developing brain have applied similar network methods to understand co-expression relationships in normal or disease states. Oldham et al. (2008) identified sets of modules in normal human cortex, caudate nucleus and cerebellum reflecting the composition of these regions (i.e., different cell types and cellular processes)5. More recent papers studied several brain regions across development. For example, Kang et al (2011) created a network using data from six brain structures across pre- and post-natal development and found modules related to different spatiotemporal profiles4, while Voineagu et al (2011) studied changes in expression modules in the autistic brain7. In our initial assessment of the first two brains in the Allen Human Brain Atlas3, we identified groups of genes related both to major cell types (i.e., astrocytes, choroid plexus, etc.), as well as to specific brain regions (i.e., striatum, cerebellum). This study builds upon and complements our initial results in two important ways: first, we sample brain regions at relatively equal depth by decreasing representation of cortex and cerebellum in the analysis, and second, we perform a consensus network analysis, which exclusively identifies common patterns across brains. Despite similarities in data type and methodology, these differences in analysis strategies and experimental design make direct comparisons with previous studies challenging. We also note DS provides complementary information from the network-based gene correlations (kME) presented here and in previous studies, and that both are valuable for understanding brain function (Supplementary Analysis).
Many differences in gene regulation across species have been previously described36–39. For example, a study of ~700 genes in human versus mouse cortex by in situ hybridization found approximately 25% of genes having at least subtle differences in areal or cellular patterning39, and the frequency of differences appears to vary as a function of evolutionary distance37. Here we find that the different co-expression networks vary in their conservation between species as well. In general, both the co-expression statistics and anatomical patterning of neuron-associated modules were better preserved than glia-associated modules, similar to findings from a meta-analysis of microarray studies which showed better preservation of neuronal gene co-expression compared to glial and disease-related genes36. Why glial expression would be less well conserved is unclear, although major differences in glial structure and function between human and mice have been described38. One possible explanation is that result may reflect the difference between clear anatomical parcellation of neuronal types into specific nuclei in both species compared to more widely distributed patterning of glia; therefore, differences in glial distribution across species would make glial modules appear less conserved. However, this does not seem likely to explain this difference. First, glial modules are among the most stable and robust in the brain despite the lack of strict anatomical segregation. Furthermore, this lack of conservation for glial modules was observed both anatomically and also in the within-module correlation of glial genes which is independent of anatomical distribution. Interestingly, many individual genes shift their global expression from one major pattern to another. This may represent a mechanism for species differentiation where mutations lead to dramatic shifts in gene regulation across brain regions.
Functional connectivity as measured using fMRI is a powerful but indirect measure of network organization that can provide high spatial resolution but should not be considered a surrogate for direct anatomical connectivity29, 30. The canonical transcriptional architecture of the human brain may in some respects be considered a genetic analog to group average anatomical or functional architecture revealed by MRI40, 41, 42. As before28, we report here a significant correlation between the transcriptional patterning in the neocortex and functional connectivity (as manifested by the partial correlation functional connectivity matrix), and we obtain this result with an independent imaging dataset (HCP). This correlation was only evident for genes having consistent cortical patterning across individuals (i.e., high DS in cortex), in part because the high cortical DS genes show more variation across cortex and in part because these genes represent the consistent transcriptional features. There might be a causal relationship, as suggested for mice, in which genes associated with neuronal connectivity are particularly likely to also be correlated with long-range connectivity patterns43, 44. Exploring the nature of such relationships will be an interesting new avenue of research, facilitated by our identification of many genes that are involved.
Transcriptional regulation patterns are informative about human brain organization at multiple scales. The DS metric, when applied only to neocortex where transcriptional variation is much less than between major brain regions, identifies genes that vary consistently across cortical regions, and these genes are preferentially correlated with resting state functional cortical architecture. Since many of the core co-expression networks described here at the meso-scale appear to reflect the underlying cellular architecture, it is likely that discrete cell types similarly display highly conserved transcriptional regulation critical to cellular function. The recent explosion of cell type and single cell profiling techniques, coupled with the emphasis on cellular characterization through the BRAIN initiative and other efforts will provide the means to explore the canonical cell type architecture of normal and diseased human brains in the near future.
ONLINE METHODS
AHBA data and normalization
The study used the completed 6 human brain data set from the Allen Human Brain Atlas (http://human.brain-map.org/). Briefly, approximately 500 anatomically discrete samples were collected from cortex, subcortex, cerebellum, and brainstem of each brain and profiled for genome-wide gene expression using a custom Agilent 8x60K cDNA array chip. Two methods were used to dissect samples: (1) a scalpel-based manual macrodissection method primarily for cortical and other relatively large uniform samples; and (2) laser microdissection (LMD) for small or oddly-shaped structures such as subcortical or brainstem areas. Over the multi-year course of the project, 6 brains were processed serially (i.e., expression profiles for the first brain were completed before profiling the second brain), and multiple batches of samples were submitted per brain. Due to the complexity and timing of entire process, assessing and minimizing non-biological systematic biases among different batches within a brain and across all brains while keeping biological variations is a crucial step in the data analysis. The same control samples are included in all batches to serve this purpose. Within each batch, array-specific biases characterized by probe GC content, location in the chip, and experiment-wise mean intensity are corrected. The 75th percentile expression levels of all samples in each batch are then aligned. Within a brain, cross-batch correction is done so that the mean expression levels of control samples in the batches may be aligned. Adjustment is made due to the bias introduced in sample quality and expression level by different dissection methods. Across brains, brain-wise mean expressions as well as control samples’ mean expression are aligned. More details on the microarray data normalization are available at http://human.brain-map.org/.
Annotation
In addition to the Allen Institute Human Brain Atlas and Mouse Atlas databases, the ToppGene (https://toppgene.cchmc.org) portal24 was used to access an extensive list of databases, and to calculate p-values from hypergeometric tests, corrected for multiple comparisons. Those used in this study included the following: gene ontology (GO) annotations (biological process, cellular component, and molecular function); pathway annotations (Biosystems, BIOCYC, KEGG, and REACTOME); microRNA targets (the full set indicated on https://toppgene.cchmc.org/navigation/database.jsp, including MicroRNA.org, Pic Tar, and TargetScane); computational cancer related gene sets (from Broad MSigDb - http://www.broadinstitute.org/gsea/msigdb/collections.jsp); drug annotations (from Drug Bank, Comparitive Toxicogenomics Database, including marker and therapeutic, and Broad Institute CMAP). Significant genes were identified using the ToppFun application. For disease annotations we used the Autworks database (http://autworks.hms.harvard.edu), listing genes associated with 2,288 disease states, including Autism. Gene sets from the Simons Foundation Autism Research Initiative Database (https://gene.sfari.org/autdb/Welcome.do) were also compared for Autism relevance. Alzheimer’s-related genes were retrieved from the Alzheimer’s Forum (www.alzforum.org).
Correlation metrics and differential stability
Average Pearson correlation over 15 pairs of 6 brains was used for measuring differential stability between brains and networks. For each gene g expressing in a pair of brains Bi(g), Bj(g) with common anatomic structures S, compute the Pearson correlation ρs (Bi(g), Bj(g)). The differential stability of Δs(g) is defined as the average ρs over (n=15) pairs of brains. Pearson correlation was used for comparing genes to modules5. The R package (www.r-project.org) was used for statistical analysis throughout. See Supplementary Analysis for comparable metrics.
WGCNA consensus network construction
The general framework of WGCNA has been described in detail previously10, and it has been packaged into a user-friendly R library9. In short, Pearson’s correlations were calculated for all pairs of genes, and then a signed similarity (Sij) parameter was derived: Sij = (1 + cor(xi,xj))/2, where gene expression profiles xi and xj consist of the expression of genes i and j across multiple microarray samples. In the signed network, the similarity between genes reflects the sign of the correlation of their expression profiles. The signed similarity (Sij) was then raised to power β to represent the connection strength (aij): aij = Sijβ (here β=14). This step aims to emphasize strong correlations and reduce the emphasis of weak correlations on an exponential scale. The resulting adjacency matrix is then transformed into a topological overlap matrix, defined as that essentially assesses to what extent each pair of genes has common expression patterns with all other genes in the network. Topological overlap has been shown to be a more biologically relevant metric than adjacency in many cases10.
Here we constructed a signed network for each brain, summarizing gene expression across the subset of 132 broad brain structures sampled in each of six adult human brains (as described below). Since we are primarily interested in finding expression patterns conserved between brains, these networks included only the 50% of genes with highest differential stability score (N=8674, DS>0.5284). From these six individual brain networks we then created a consensus network to identify common expression patterns across individuals, following the published method22 with a few modifications. Specifically, the consensus network was created by calculating the component-wise minimum values for topologic overlap (TO) across all six brains, after appropriately scaling each individual network. Genes were hierarchically clustered using 1-TO as the distance measure, and initial module assignments were determined by using a dynamic tree-cutting algorithm (cutreeHybrid using all default parameters, except deepSplit=4, cutHeight=0.999, minClusterSize=30, and pamStage=FALSE)46.
Modules were then iteratively merged until all pairs of module eigengenes (ME; i.e., the first principle component of the module) were correlated with R<0.8, using the following strategy: 1) calculate the MEs; 2) identify the most highly correlated pair of MEs; 3) if R>0.8 merge these two modules and repeat steps 1–3. Next, modules were assessed for coherency and incoherent modules were removed from consideration using the following strategy: 1) calculate the MEs; 2) calculate the Pearson correlation between each gene and each ME—referred to as a gene’s module membership (kME)5—and re-assign each gene to the module to which it is most highly correlated; 3) find the module for which the largest number of genes were reassigned; 4) if <70% of the genes in this module remain in the module after re-assignment, remove the module and repeat steps 1–4. Finally, after generation, merging, and deletion of modules, all 17,348 expressed genes were assigned to modules based on kME (as above), and genes with kME<0.4 against all modules were considered unassigned. Module eigengenes were calculated using all available data, but for brevity visualizations only include the 62 structures present in all six brains (Supplementary Table 1) in addition to CGS, CPLV, and Pa. This method is entirely automated, resulting in an unbiased collection of distinct, yet well-defined modules. This same strategy was used to construct networks and define modules for the 50% of genes with the lowest differential stability and for the leave-one-out analysis. Alternative network strategies are discussed in detail in the Supplemental Analysis.
Module enrichment analysis
Module enrichment analysis was performed using the userListEnrichment R function in the WGCNA library47. These tests included enrichment for gene ontology categories, brain cell types, brain regions, disease classes, and results from previous network analyses, with primary references cited in the main text as appropriate. All p-values in this analysis were Bonferroni corrected for multiple hypergeometric test comparisons. The ToppGene facility (https://topgene.cchmc.org)24 was used for access to annotation databases as discussed above.
Gene expression quantification in mouse
Expression levels of mouse in situ hybridization data from the Allen Mouse Brain Atlas were quantified using “expression energy” (fraction of stained volume * average intensity of stain), as described previously18, 27. Coronal data for 2,651 genes with expression in human and reproducible coronal and sagittal series in mouse (ρ>0.7) were included for comparison between species. For each of 53 human structures, average expression energy was calculated across all voxels in matched mouse structures. These values were treated the same way as microarray intensities for between-species correlations and network statistics. Genes in mouse were assigned to the same modules as their human orthologs. See Supplementary Methods for details on the comparison between mouse and human MEs.
Comparison with mouse ISH data
The Allen Institute Mouse Brain atlas has a comprehensive informatics pipeline (see Informatics Data Processing, http://help.brain-map.org/display/mousebrain/Documentation). While this data set only contains replicates for approximately 25% of genes, there are 2651 genes which both had highly correlated expression patterns (ρ>0.7) in the voxel mapped coronal and sagittal series in mouse ISH data, and which could also be mapped using the orthologous gene symbols in mouse and human. In cases where gene symbol matching was ambiguous, the gene was omitted from the analysis. We mapped regions of the human ontology to analogous regions of the mouse (Supplementary Table 1). In total 62 structures were represented in all six human brains, and of those 53 had regions that could be defined in the voxel based mouse ISH data. In some cases this was due to species differences, where a human structure was not present in mouse, and in other cases it was due to technical details due to the level of annotation in mouse or human. In human, the networks were created by using all available regions in each brain (with contraction of cortex and cerebellum as noted above, ~100 regions per brain) but then visualized using only 65 structures (as discussed earlier). In mouse, the data was processed by finding the average expression energy (see web documentation above) of the 250 most highly expressed voxels in each of the 53 regions (or all voxels if fewer than 250 in a region), and then treating the resulting 2651x53 matrix as a microarray matrix. Modules eigengenes were calculated by first assigning to each mouse gene the corresponding module label from the human high DS network, and then calculating the MEs by applying the moduleEigengenes function in the WGCNA library to the mouse expression energy matrix. The resulting MEs in mouse are compared with the corresponding values in human as discussed in the main text.
We note that, although we used all available mouse data, these 2651 genes were initially chosen to be run in coronal section because they were potentially biologically interesting in some way, and therefore represent a biased set of genes. Having said this, these genes were distributed across all of the human modules and therefore represent a fairly complete set of expression patterns at the whole-brain level. While the specific proportions of genes that agree between species may not be representative of the transcriptome as a whole, the assignment of genes as either conserved or not conserved in the text should accurately reflect their actual conservation based on these two data sets.
Functional connectivity
Resting-state functional connectivity was analyzed using data from the Human Connectome Project (HCP; http://www.humanconnectome.org/documentation/S500/). A group-average functional connectivity matrix (“dense connectome”) was generated from 468 subjects with complete 1 hour resting-state fMRI datasets (see Supplementary Methods). A cortical left-hemisphere parcellation was generated using the 17-network resting-state-network parcellation of31, subdivided into 52 spatially contiguous left-hemisphere parcels, each at least 50 mm2 in cortical surface area. Parcellated connectomes were based on resting-state data from 447 HCP subjects using the 52 contiguous left hemisphere parcels and using FSLNets (http://fsl.fmrib.ox.ac.uk/fsl/fslwiki/FSLNets) to estimate partial correlation parcellated connectomes (see Supplementary Methods).
Differential stability in cortex and resting state network analysis
The resting-state functional connectivity analysis was based on data from the Human Connectome Project (HCP) (http://www.humanconnectome.org/documentation/S500/). To generate the functional connectivity map shown in Fig. 7a, a group-average functional connectivity matrix (“dense” functional connectome) was generated from 468 subjects having complete resting-state fMRI datasets (the ‘R468’ group). Each of four 15-min resting state runs for each subject in the group was cleaned (denoised) using 24-parameter motion regression followed by ICA+FIX denoising30, 48. The resulting cleaned runs were combined across the 468 related subjects, respectively, applying variance normalization of the time series using the same approach as MELODIC49, followed by a group- PCA approach (MIGP - MELODIC’s Incremental Group-PCA) that approximates full temporal concatenation of all subjects’ data. PCA is then used to output the strongest 4500 spatial eigenvectors (PCA components, weighted by the eigenvalues). Each gray ordinate’s spatial eigenvectors were correlated with those of every other gray ordinate to produce a dense connectome.
To generate a parcellation covering the entire left hemisphere with spatially contiguous parcels closely related to functional organization, we started with the 17-network resting-state-network parcellation of Yeo et al., (2011). This was subdivided into 52 spatially contiguous left-hemisphere parcels, each at least 50 mm2 in cortical surface area (based on the average surface area of each tile in standard-mesh cortical midthickness surfaces in a group of 196 HCP subjects). To generate the parcellated connectomes that are illustrated in Fig. 7a (right panel) and were used for the analyses in Fig. 7c–d, we used resting-state data from 447 HCP subjects having complete resting-state (and also task-fMRI) scans and used the aforementioned 52 contiguous parcels of the left hemisphere. Cleaned (as above) resting state time series were averaged across the gray ordinates within each left hemisphere parcel. FSLNets (http://fsl.fmrib.ox.ac.uk/fsl/fslwiki/FSLNets) was used to estimate partial correlation parcellated connectomes (52×52) in each resting state run of each subject, and these matrices were converted to z-scores. The z-scores were averaged across runs, and a one-sample t-test was performed across subjects (also converted to z-scores) to produce a group partial correlation parcellated connectome.
The next step is to map the Allen Human Brain Atlas (AHBA) tissue samples to the HCP 52 region parcellation so that comparison can be made. Using the MNI centroid coordinate of the AHBA samples, and by manually examining each of the AHBA tissue samples using the online tools one can assign as set of HCP space voxels to each AHBA tissue sample. As each of the 52 parcels is composed of a set of voxels, we now have potentially one-to-many map from AHBA tissue to HCP parcels. If all ABHA tissue samples belong to a common HCP parcel we average the gene expression of that tissue in the corresponding parcel. However, some of the 52 parcels represent smaller regions of the brain and therefore there is no unique assignment of AHBA gene expression tissue samples to that region. Therefore if a collection of AHBA tissue samples intersects more than one region, we average the gene expression values as before but fractionally weight the expression contribution to each of the interesting HCP parcels. This has the effect of allowing some assignment of expression without overweighting non-unique samples. Supplementary Table 12 gives the sample distribution by parcels as well as the uniquely assigned samples.
To obtain the expression correlation matrix for a given gene (Fig. 7c, right panel), we transformed the expression values of that gene into z-scores over all the sampled brain regions (averaging sample data for those samples contained in the same parcel), and calculated the “co-expression” as the outer product of this z-score vector. Thus, if two regions both show high expression or low expression of the gene of interest, they will have a high positive co-expression value for that gene, whereas if they show opposite expression patterns, they will have a large negative value for that gene. After generating these matrices, we compared each of the 17,348 gene co-expression matrices to the parcellated connectome matrix by calculating the Pearson’s correlation between the vectorized upper diagonal elements of the matrices (Fig. 7d). We also obtained a significance value for each gene-connectivity comparison using the randomized gene co-expression matrices. Supplementary Table 12 gives the complete distribution of tissue samples by HCP parcel for the 52 regions and the functional genetic correlations and p-values.
Statistics of the methods
Standard methods are presented without detailed description. Less standard methods are described in the main text, in the Online Methods, or through citations to references where they are described in detail. To the best of our knowledge, statistical tests were chosen such that the data meet assumptions of the specific statistical test.
Supplementary Material
Acknowledgments
The authors thank the Allen Institute for Brain Science founders, Paul G. Allen and Jody Allen, for their vision, encouragement, and support. Research was supported by the Allen Institute for Brain Science. We also gratefully acknowledge support from the National Institute of Drug Abuse, grant 4R33DA027644, Dennis Wall of Stanford University School of Medicine, and 1U54MH091657 (NIH Blueprint for Neuroscience Research).
Footnotes
AUTHOR CONTRIBUTIONS
M.H., J.M., and V.M. performed the primary analyses, with supporting analyses by A.L. G.-B., F.C., K.A.B., P.G., Z.Y., L.S., A.-L. B., and J.S. Graphics and networks analysis were done by D.F., T.D., L.N., C.D., and J.M. Annotation analysis was done by A.G.J. and B.J.A., M.F.G. and D.L.D. performed resting state analysis with V.M., S.M., D.C. VE. Data processing and normalization was done by C.K.-L, L.N., C.D., A.B., J.P., and M.H. J.M., D.R.H, D.C. VE, A.J., C.K., and E.L wrote the manuscript.
References
- 1.Manolio TA, Collins FS. The HapMap and genome-wide association studies in diagnosis and therapy. Annual review of medicine. 2009;60:443–456. doi: 10.1146/annurev.med.60.061907.093117. [DOI] [PMC free article] [PubMed] [Google Scholar]
- 2.McCarthy MI, Hirschhorn JN. Genome-wide association studies: potential next steps on a genetic journey. Human molecular genetics. 2008;17:R156–165. doi: 10.1093/hmg/ddn289. [DOI] [PMC free article] [PubMed] [Google Scholar]
- 3.Hawrylycz M, et al. An anatomically comprehensive atlas of the adult human brain transcriptome. Nature. 2012;489:391–399. doi: 10.1038/nature11405. [DOI] [PMC free article] [PubMed] [Google Scholar]
- 4.Kang HJ, et al. Spatio-temporal transcriptome of the human brain. Nature. 2011;478:483–489. doi: 10.1038/nature10523. [DOI] [PMC free article] [PubMed] [Google Scholar]
- 5.Oldham M, et al. Functional organization of the transcriptome in human brain. Nature neuroscience. 2008;11:1271–1282. doi: 10.1038/nn.2207. [DOI] [PMC free article] [PubMed] [Google Scholar]
- 6.Roth RB, et al. Gene expression analyses reveal molecular relationships among 20 regions of the human CNS. Neurogenetics. 2006;7:67–80. doi: 10.1007/s10048-006-0032-6. [DOI] [PubMed] [Google Scholar]
- 7.Voineagu I, et al. Transcriptomic analysis of autistic brain reveals convergent molecular pathology. Nature. 2011;474:380–384. doi: 10.1038/nature10110. [DOI] [PMC free article] [PubMed] [Google Scholar]
- 8.Shaw GT, Shih ES, Chen CH, Hwang MJ. Preservation of ranking order in the expression of human Housekeeping genes. PloS one. 2011;6:e29314. doi: 10.1371/journal.pone.0029314. [DOI] [PMC free article] [PubMed] [Google Scholar]
- 9.Langfelder P, Horvath S. WGCNA: an R package for weighted correlation network analysis. BMC Bioinformatics. 2008;9:559–559. doi: 10.1186/1471-2105-9-559. [DOI] [PMC free article] [PubMed] [Google Scholar]
- 10.Zhang B, Horvath S. A general framework for weighted gene co-expression network analysis. Statistical applications in genetics and molecular biology. 2005;4 doi: 10.2202/1544-6115.1128. [DOI] [PubMed] [Google Scholar]
- 11.Miller JA, et al. Transcriptional landscape of the prenatal human brain. Nature. 2014;508:199–206. doi: 10.1038/nature13185. [DOI] [PMC free article] [PubMed] [Google Scholar]
- 12.Oldham M, Horvath S, Geschwind D. Conservation and evolution of gene coexpression networks in human and chimpanzee brains. Proceedings of the National Academy of Sciences of the United States of America. 2006;103:17973–17978. doi: 10.1073/pnas.0605938103. [DOI] [PMC free article] [PubMed] [Google Scholar]
- 13.Ponomarev I, Wang S, Zhang L, Harris RA, Mayfield RD. Gene coexpression networks in human brain identify epigenetic modifications in alcohol dependence. The Journal of neuroscience : the official journal of the Society for Neuroscience. 2012;32:1884–1897. doi: 10.1523/JNEUROSCI.3136-11.2012. [DOI] [PMC free article] [PubMed] [Google Scholar]
- 14.Bernard A, et al. Transcriptional architecture of the primate neocortex. Neuron. 2012;73:1083–1099. doi: 10.1016/j.neuron.2012.03.002. [DOI] [PMC free article] [PubMed] [Google Scholar]
- 15.Bray NJ, et al. Screening the human protocadherin 8 (PCDH8) gene in schizophrenia. Genes, brain, and behavior. 2002;1:187–191. doi: 10.1034/j.1601-183x.2002.10307.x. [DOI] [PubMed] [Google Scholar]
- 16.Geschwind D, Konopka G. Neuroscience in the era of functional genomics and systems biology. Nature. 2009;461:908–915. doi: 10.1038/nature08537. [DOI] [PMC free article] [PubMed] [Google Scholar]
- 17.Konopka G, et al. Human-specific transcriptional networks in the brain. Neuron. 2012;75:601–617. doi: 10.1016/j.neuron.2012.05.034. [DOI] [PMC free article] [PubMed] [Google Scholar]
- 18.Hanashima C, Fernandes M, Hebert JM, Fishell G. The role of Foxg1 and dorsal midline signaling in the generation of Cajal-Retzius subtypes. The Journal of neuroscience : the official journal of the Society for Neuroscience. 2007;27:11103–11111. doi: 10.1523/JNEUROSCI.1066-07.2007. [DOI] [PMC free article] [PubMed] [Google Scholar]
- 19.Siegenthaler JA, Miller MW. Generation of Cajal-Retzius neurons in mouse forebrain is regulated by transforming growth factor beta-Fox signaling pathways. Developmental biology. 2008;313:35–46. doi: 10.1016/j.ydbio.2007.09.036. [DOI] [PMC free article] [PubMed] [Google Scholar]
- 20.Zapala MA, et al. Adult mouse brain gene expression patterns bear an embryologic imprint. Proceedings of the National Academy of Sciences of the United States of America. 2005;102:10357–10362. doi: 10.1073/pnas.0503357102. [DOI] [PMC free article] [PubMed] [Google Scholar]
- 21.Nelson TH, et al. Autworks: a cross-disease network biology application for Autism and related disorders. BMC medical genomics. 2012;5:56. doi: 10.1186/1755-8794-5-56. [DOI] [PMC free article] [PubMed] [Google Scholar]
- 22.Langfelder P, Luo R, Oldham M, Horvath S. Is My Network Module Preserved and Reproducible? PLoS Comput Biol. 2011;7:e1001057–e1001057. doi: 10.1371/journal.pcbi.1001057. [DOI] [PMC free article] [PubMed] [Google Scholar]
- 23.Cahoy J, et al. A transcriptome database for astrocytes, neurons, and oligodendrocytes: a new resource for understanding brain development and function. The Journal of neuroscience : the official journal of the Society for Neuroscience. 2008;28:264–278. doi: 10.1523/JNEUROSCI.4178-07.2008. [DOI] [PMC free article] [PubMed] [Google Scholar]
- 24.Chen J, Bardes EE, Aronow BJ, Jegga AG. ToppGene Suite for gene list enrichment analysis and candidate gene prioritization. Nucleic acids research. 2009;37:W305–311. doi: 10.1093/nar/gkp427. [DOI] [PMC free article] [PubMed] [Google Scholar]
- 25.Gratacos M, et al. Identification of new putative susceptibility genes for several psychiatric disorders by association analysis of regulatory and non-synonymous SNPs of 306 genes involved in neurotransmission and neurodevelopment. American journal of medical genetics. Part B, Neuropsychiatric genetics : the official publication of the International Society of Psychiatric Genetics. 2009;150B:808–816. doi: 10.1002/ajmg.b.30902. [DOI] [PubMed] [Google Scholar]
- 26.Pinheiro AP, et al. Association study of 182 candidate genes in anorexia nervosa. American journal of medical genetics. Part B, Neuropsychiatric genetics : the official publication of the International Society of Psychiatric Genetics. 2010;153B:1070–1080. doi: 10.1002/ajmg.b.31082. [DOI] [PMC free article] [PubMed] [Google Scholar]
- 27.Lein ES, et al. Genome-wide atlas of gene expression in the adult mouse brain. Nature. 2007;445:168–176. doi: 10.1038/nature05453. [DOI] [PubMed] [Google Scholar]
- 28.Richiardi J, et al. BRAIN NETWORKS. Correlated gene expression supports synchronous activity in brain networks. Science. 2015;348:1241–1244. doi: 10.1126/science.1255905. [DOI] [PMC free article] [PubMed] [Google Scholar]
- 29.Van Essen DC, et al. The WU-Minn Human Connectome Project: an overview. NeuroImage. 2013;80:62–79. doi: 10.1016/j.neuroimage.2013.05.041. [DOI] [PMC free article] [PubMed] [Google Scholar]
- 30.Smith SM, et al. Functional connectomics from resting-state fMRI. Trends in cognitive sciences. 2013;17:666–682. doi: 10.1016/j.tics.2013.09.016. [DOI] [PMC free article] [PubMed] [Google Scholar]
- 31.Yeo BT, et al. The organization of the human cerebral cortex estimated by intrinsic functional connectivity. Journal of neurophysiology. 2011;106:1125–1165. doi: 10.1152/jn.00338.2011. [DOI] [PMC free article] [PubMed] [Google Scholar]
- 32.De Bacco F, et al. The MET oncogene is a functional marker of a glioblastoma stem cell subtype. Cancer research. 2012;72:4537–4550. doi: 10.1158/0008-5472.CAN-11-3490. [DOI] [PubMed] [Google Scholar]
- 33.Hosokawa M, Klegeris A, Maguire J, McGeer PL. Expression of complement messenger RNAs and proteins by human oligodendroglial cells. Glia. 2003;42:417–423. doi: 10.1002/glia.10234. [DOI] [PubMed] [Google Scholar]
- 34.Rosenmann H, et al. A polymorphism in the complement component C1r is not associated with sporadic Alzheimer’s disease. Neuroscience letters. 2003;336:101–104. doi: 10.1016/s0304-3940(02)01218-1. [DOI] [PubMed] [Google Scholar]
- 35.Walker DG, Dalsing-Hernandez JE, Lue LF. Human postmortem brain-derived cerebrovascular smooth muscle cells express all genes of the classical complement pathway: a potential mechanism for vascular damage in cerebral amyloid angiopathy and Alzheimer’s disease. Microvascular research. 2008;75:411–419. doi: 10.1016/j.mvr.2007.10.004. [DOI] [PMC free article] [PubMed] [Google Scholar]
- 36.Miller J, Horvath S, Geschwind D. Divergence of human and mouse brain transcriptome highlights Alzheimer disease pathways. Proceedings of the National Academy of Sciences of the United States of America. 2010;107:12698–12703. doi: 10.1073/pnas.0914257107. [DOI] [PMC free article] [PubMed] [Google Scholar]
- 37.Morris JA, et al. Divergent and nonuniform gene expression patterns in mouse brain. Proc Natl Acad Sci U S A. 2010;107:19049–19054. doi: 10.1073/pnas.1003732107. [DOI] [PMC free article] [PubMed] [Google Scholar]
- 38.Oberheim NA, Wang X, Goldman S, Nedergaard M. Astrocytic complexity distinguishes the human brain. Trends in neurosciences. 2006;29:547–553. doi: 10.1016/j.tins.2006.08.004. [DOI] [PubMed] [Google Scholar]
- 39.Zeng H, et al. Large-scale cellular-resolution gene profiling in human neocortex reveals species-specific molecular signatures. Cell. 2012;149:483–496. doi: 10.1016/j.cell.2012.02.052. [DOI] [PMC free article] [PubMed] [Google Scholar]
- 40.Damoiseaux JS, et al. Consistent resting-state networks across healthy subjects. Proc Natl Acad Sci U S A. 2006;103:13848–13853. doi: 10.1073/pnas.0601417103. [DOI] [PMC free article] [PubMed] [Google Scholar]
- 41.Greicius MD, Krasnow B, Reiss AL, Menon V. Functional connectivity in the resting brain: a network analysis of the default mode hypothesis. Proc Natl Acad Sci U S A. 2003;100:253–258. doi: 10.1073/pnas.0135058100. [DOI] [PMC free article] [PubMed] [Google Scholar]
- 42.Richiardi J, et al. Correlated gene expression supports synchronous activity in brain networks. Science. 2015;348:1241–1244. doi: 10.1126/science.1255905. [DOI] [PMC free article] [PubMed] [Google Scholar]
- 43.French L, Pavlidis P. Relationships between gene expression and brain wiring in the adult rodent brain. PLoS Comput Biol. 2011;7:e1001049. doi: 10.1371/journal.pcbi.1001049. [DOI] [PMC free article] [PubMed] [Google Scholar]
- 44.French L, Tan PP, Pavlidis P. Large-Scale Analysis of Gene Expression and Connectivity in the Rodent Brain: Insights through Data Integration. Frontiers in neuroinformatics. 2011;5:12. doi: 10.3389/fninf.2011.00012. [DOI] [PMC free article] [PubMed] [Google Scholar]
- 45.Smith SM, et al. Resting-state fMRI in the Human Connectome Project. NeuroImage. 2013;80:144–168. doi: 10.1016/j.neuroimage.2013.05.039. (additional references for methods below) [DOI] [PMC free article] [PubMed] [Google Scholar]
- 46.Langfelder P, Zhang B, Horvath S. Defining clusters from a hierarchical cluster tree: the Dynamic Tree Cut package for R. Bioinformatics. 2008;24:719–720. doi: 10.1093/bioinformatics/btm563. [DOI] [PubMed] [Google Scholar]
- 47.Miller J, et al. Strategies for aggregating gene expression data: the collapseRows R function. BMC bioinformatics. 2011;12:322–322. doi: 10.1186/1471-2105-12-322. [DOI] [PMC free article] [PubMed] [Google Scholar]
- 48.Salimi-Khorshidi G, et al. Automatic denoising of functional MRI data: combining independent component analysis and hierarchical fusion of classifiers. NeuroImage. 2014;90:449–468. doi: 10.1016/j.neuroimage.2013.11.046. [DOI] [PMC free article] [PubMed] [Google Scholar]
- 49.Beckmann CF, Smith SM. Probabilistic independent component analysis for functional magnetic resonance imaging. IEEE transactions on medical imaging. 2004;23:137–152. doi: 10.1109/TMI.2003.822821. [DOI] [PubMed] [Google Scholar]
Associated Data
This section collects any data citations, data availability statements, or supplementary materials included in this article.