

Abstract
Background
Hepatocellular carcinoma (HCC) is the most common malignant tumor of the liver. Non-alcoholic fatty liver disease (NAFLD) is a frequent chronic liver disorder in developed countries. NAFLD can progress through the more severe non alcoholic steatohepatitis (NASH), cirrhosis and, lastly, HCC. Genetic and epigenetic alterations of coding genes as well as deregulation of microRNAs (miRNAs) activity play a role in HCC development. In this study, the C57BL/6J mouse model was long term high-fat (HF) or low-fat (LF) diet fed, in order to analyze molecular mechanisms responsible for the hepatic damage progression.
Methods
Mice were HF or LF diet fed for different time points, then plasma and hepatic tissues were collected. Histological and clinical chemistry assays were performed to assess the progression of liver disease. MicroRNAs’ differential expression was evaluated on pooled RNAs from tissues, and some miRNAs showing dysregulation were further analyzed at the individual level.
Results
Cholesterol, low and high density lipoproteins, triglycerides and alanine aminotransferase increase was detected in HF mice. Gross anatomical examination revealed hepatomegaly in HF livers, and histological analysis highlighted different degrees and levels of steatosis, inflammatory infiltrate and fibrosis in HF and LF animals, demonstrating the progression from NAFLD through NASH. Macroscopic nodules, showing typical neoplastic features, were observed in 20 % of HF diet fed mice. Fifteen miRNAs differentially expressed in HF with respect to LF hepatic tissues during the progression of liver damage, and in tumors with respect to HF non tumor liver specimens were identified. Among them, miR-340-5p, miR-484, miR-574-3p, miR-720, whose expression was never described in NAFLD, NASH and HCC tissues, and miR-125a-5p and miR-182, which showed early and significant dysregulation in the sequential hepatic damage process.
Conclusions
In this study, fifteen microRNAs which were modulated in hepatic tissues and in tumors during the transition NAFLD-NASH-HCC are reported. Besides some already described, new and early dysregulated miRNAs were identified. Functional analyses are needed to validate the results here obtained, and to better define the role of these molecules in the progression of the hepatic disease.
Electronic supplementary material
The online version of this article (doi:10.1186/s12885-015-2007-1) contains supplementary material, which is available to authorized users.
Keywords: microRNA, NAFLD, NASH, HCC, High fat diet, Low fat diet
Background
Hepatocellular carcinoma (HCC) is the most frequent liver tumor and the third cause of cancer mortality worldwide [1]. HCC etiopathogenesis is mainly related to viral infections (HBV, HCV) [2], aflatoxin B1 and tobacco exposure [3, 4], or chronic alcohol consumption [5]. Deregulation at the level of several key signal transduction pathways (such as Wnt/β-catenin, MAPK, JAK-STAT, p53) have been extensively described in HCC pathogenesis [6].
Non alcoholic fatty liver disease (NAFLD) is the most frequent liver disorder in western countries and occurs in individuals who do not abuse alcohol. NAFLD can be due to higher fat intake with diet, “de novo” lipogenesisis, or adipose tissue lipolysis increase [7]. It is characterized by accumulation of triglycerides within hepatocytes (steatosis), attributable to an imbalance between storage and removal of lipids, and it is associated with obesity and metabolic syndrome [8]. In a number of cases, NAFLD progresses from simple steatosis to non alcoholic steatohepatitis (NASH), a form of hepatic damage characterized by the recruitment of pro-inflammatory immune cells, and lastly toward cirrhosis and hepatocellular carcinoma [7]. It has been calculated that a percentage variable between 4 and 22 % of HCC cases can be ascribed to NAFLD [8]. However, molecular mechanisms responsible for NAFLD-NASH-HCC progression are not fully understood.
MicroRNAs (miRs, miRNAs) are short non-coding molecules able to regulate gene expression at the post-transcriptional level. MicroRNAs are involved in fundamental cellular processes, such as growth, proliferation and differentiation, apoptosis, metabolism, oncogenesis and metastasis [9, 10]. Many miRNAs have been described in the initiation and progression of liver cancer [11, 12]. Several down-regulated (i.e. miR-1, miR-7, miR-34a, miR-122, miR-125b, miR-200) or up-regulated (i.e. miR-17, miR-18, miR-19, miR-155, miR-93, miR-221/222) miRNAs have been identified as tumor suppressor or oncomirs, respectively, by targeting and regulating genes involved in cell proliferation, apoptosis, angiogenesis and metastasis [13]. Several studies have furthermore shown expression level dysregulation and modulation of microRNAs in NAFLD, NASH, and then HCC. Among them, miR-122, miR-21, miR-155, miR-23a, miR-143, whose target genes have been characterized in both NAFLD (i.e. PPARα, PTEN C/EBPβ, ORP8, G6PC) and HCC (i.e. CCNG1, IGF-1R, ADAM17, PTEN, SOCS1, C/EBPβ, FNDC3B) [14]. In addition, miRNAs have been described to be modulated even in steatosis/NASH (i.e. miR-155, miR-370, miR-34a, miR-200a/b, miR-99a/b), fibrosis (i.e. miR-200a/b, miR-221/222, miR-34a, miR-16, miR-99b), cirrhosis (i.e. miR-34a, miR-21, miR-31, miR-181b), and HCC (i.e. miR-16, miR-33, miR-21, miR-31, miR-181a/b, miR-99a, miR-200a/b) [15]. However, miRNAs specifically involved in the progression of liver disease are not fully characterized. Therefore, to better define and identify microRNAs playing a pivotal role in this process, we analyzed in a time-dependent and dynamic manner the expression levels of miRNAs in livers from a long term high fat diet fed C57BL/6J mouse model, with the purpose to put into relation the expression levels of miRNAs with the progression of the liver’s injury.
Methods
Mouse strain and housing
C57BL/6J mice were purchased from Charles Rivers Laboratories (France) and maintained at 21 °C on a 12 h light–dark cycle. Twenty days old male mice obtained from the established colony were randomly split in 3 groups (10 animals each), and fed with a high fat diet (5.56 Kcal/g, fat 58 Kcal%, whose coconut oil hydrogenated 54 %; carbohydrate 25.5 Kcal%) (D12331, OpenSource, Research Diets) for 3, 6, and 12 months. Analogously, 3 groups of control animals (10 animals each) were fed with the control low fat diet (4.07 Kcal/g, fat 10.5 Kcal%; carbohydrate 73.1 Kcal%, whose sucrose 60 %) (D12329, Open Source, Research Diets). Mice were weighed at approximately one-month intervals and periodically analyzed for signs of disease or morbidity. Mice were sacrificed by CO2 asphyxiation, weighed, and head-to-tail measured. Laparotomy was then performed, and the liver was visualized and rapidly excised, weighed and photographed. The following parameters were considered: liver appearance, color and weight. Liver tumors were counted and measured. All experimental procedures involving animals and their care were performed in conformity with national and international laws and policies (European Economic Community Council Directive 86/609, OJ 358, 1 Dec 12, 1987; Italian Legislative Decree 116/92, Gazzetta Ufficiale della Repubblica Italiana n. 40, Feb 18, 1992; National Institutes of Health Guide for the Care and Use of Laboratory Animals, NIH publication no. 85–23, 1985). The project was approved by the Italian Ministry of Health and the internal Committee of the University of L’Aquila. All efforts were made to minimize suffering.
Assessment of microscopic hepatic lesions
Specimens obtained from livers were washed in PBS and immediately immersed in 10 % formalin in phosphate buffered saline (PBS) (pH 7.4), then standard procedures for paraffin embedding were performed. Serial 3 μm sections were stained with Hematoxylin and Eosin (H&E) to assess the liver general architecture and inflammation. Masson’s trichrome stain was also performed in order to detect connective tissue and fibrosis. The stained sections were then observed by using Olympus BX51 Light Microscope (Olympus, Optical Co., Ltd, Tokyo, Japan).
Biochemical assays
After sacrifice, blood was collected in heparin by cardiac puncture, and plasma was immediately recovered and stored at −80 °C for subsequent analyses. A panel of biomarkers for characterizing the metabolic features of liver disease was analyzed by using Architect system and kits (Abbott Diagnostics), according to the manufacturer’s instructions.
RNA extraction
Liver tissues and excised tumors were sectioned and stored in RNAlater® stabilization solution (Ambion) at −80 °C. RNA was extracted from whole hepatic specimens and tumors by using miRVana™ microRNA isolation kit (Life Technologies), according to the manufacturer’s instructions.
Real-time quantitative PCR
Identical amounts of total RNAs extracted from animals belonging to the same experimental group were pooled together and subjected (700 ng per RNAs’ pool) to RT-PCR by using the TaqMan MicroRNA reverse transcription kit and the Megaplex RT primer pool (Life Technologies). Subsequently, microfluidic Rodent MicroRNA arrays v3.0 (Life Technologies) were used, according to the manufacturer’s instructions. Three replicates for each pooled sample were analyzed. MicroRNAs’ expression levels were evaluated by comparative assay. Samples were analyzed on a ViiA7 instrument (Life Technologies) and data were processed by ViiA7 software (Life Technologies). ΔΔCt method was used to determine the relative miRNAs’ expression levels. Mamm U6 was used as endogenous control. Global normalization analysis was also performed (Expression Suite, Life Technologies). Some specific MicroRNA Assays (Life Technologies) were performed on each single sample (3 replicates) in order to assess the miRNAs’ expression at the individual level. Further data analysis was carried out by using Expression Suite (Life Technologies) or GraphPad Prism (GraphPad software).
Results
Diet-induced obesity
C57BL/6J male mice and, with lower evidence females, have been already described to be predisposed and susceptible to NAFLD and diet-induced obesity with respect to other strains (A/J), in both short and long-term fatty diet fed models [16, 17]. In our model, we analyzed the effects of a HF diet on liver disease induction. For this purpose, C57BL/6J mice groups were treated for different times with HF (majority of calorie count due to hydrogenated coconut oil) or LF (majority of calorie count due to sucrose) high-calorie diets. Body weights’ patterns of HF and LF diet-treated animals are reported in Fig. 1a. HF mice developed significant weight increase, as detected after 3, 6 and 12 months (P3, 6, 12M < 0.001), and associated obesity (Fig. 1b), further confirmed by BMI values (Fig. 1c). In particular, an overt accumulation of subcutaneous, visceral and thoracic fat was detected in HF mice (data not shown).
Fig. 1.
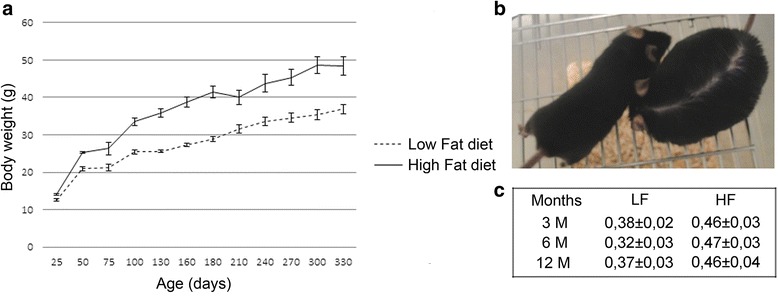
Body weight patterns. a Mice were high fat (HF) or low fat (LF) diet fed, and weighed at the indicated time points. Values are means of 10 mice ± SEM. b Representative picture of a 6 months LF (left) and HF (right) diet fed mouse. c Mean of body mass index values ± SEM
Histological liver features
Gross anatomical examination revealed, in livers from HF animals, hepatomegaly as well as paler color (Fig. 2a). Significant weight increase of HF livers was also detected (Fig. 2b). Two voluminous macroscopic nodules (1.5x1.3x1 and 0.7x0.6x0.5 cm in dimensions) (Fig. 2c) were observed in 2 HF mice (20 %) after 12 months of fatty diet regimen. No nodular formations were detected in the LF groups. Histomorphological analysis showed a wide spectrum of liver damage ranging from simple steatosis, consisting of isolated fat deposition in hepatocytes from 3 months HF mice (Fig. 3a, a1), more pronounced steatosis in 6 months animals (Fig. 3a, b1), and steatohepatitis in 12 months HF mice (Fig. 3a, c1, c2). Inflammatory infiltrate was characterized by lymphocytes, plasma cells, macrophages and polymorphonuclear leucocytes (PMN) (Additional file 1: Figure S1). Twelve months HF livers were also characterized by fibrosis (Fig. 3b, b1), and disarrangement of normal hepatic architecture with increase of cell density and frequent steatosis (b2). Moreover, a certain degree of cellular atypia, rare pseudoglandular structures and steatosis can be detected (b3, H&E original magnification 40X, arrows and red box, respectively). The latter aspects are common features of dysplastic nodules or early HCC. The described traits demonstrate the progression of liver damage through NAFLD, NASH, fibrosis and HCC. On the other hand, LF diet fed mice showed normal liver architecture after 3 months (Fig. 3a, a), scattered hepatic inflammatory cells in a small percentage of animals after 6 months (Fig. 3a, b, arrow) and accumulation of triglycerides in combination with hepatic inflammation after 12 months of LF diet treatment (Fig. 3a, c, arrows). Less severe fibrosis was detected in LF mice after 12 months (Fig. 3b, b). No fibrosis was detected in HF and LF mice after 3 and 6 months (Fig. 3b, a, a1) of treatment. In summary, concerning the progression of liver disease, steatosis, with ascending degree of severity, was found in 40 %, 90 % and 100 % of 3, 6 and 12 months HF diet fed mice (Fig. 4a, b). Inflammation was evident in 60 % of 6 months and 100 % of 12 months HF mice, whereas fibrosis was detected in 70 % of animals just after 12 months (Fig. 4a). Contextually, in LF mice, steatosis was not evidenced after 3 months, but was detected in 40 % and 100 % of animals after 6 and 12 months (Fig. 4a), albeit with lower degree of severity with respect to the corresponding HF groups (Fig. 4b). Inflammation, at the same way, was undetectable after 3 months and revealed in 10 % and 90 % of mice after 6 and 12 months of LF diet administration (Fig. 4a). Fibrosis was detected in 30 % of LF animals after 12 months (Fig. 4a). Significant cirrhosis was not evidenced by any mouse belonging to both HF and LF groups.
Fig. 2.
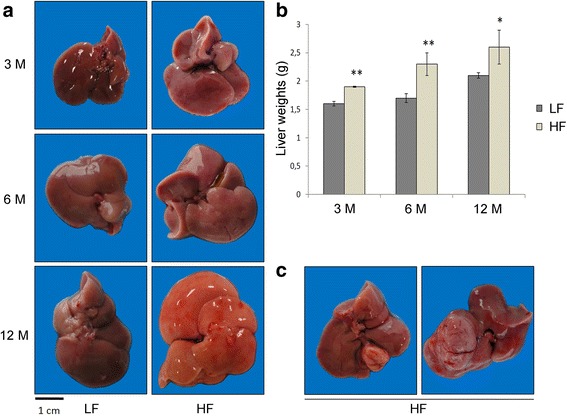
Livers from HF and LF diet fed mice. a Livers from 3, 6, 12 months LF (left) and HF (right) diet fed mice. b Liver weights, expressed as mean ± SEM. Statistical significance is indicated as follows: **, P < 0.08; *, P = 0.05. c Macroscopic nodules in 12 months HF diet fed mice
Fig. 3.
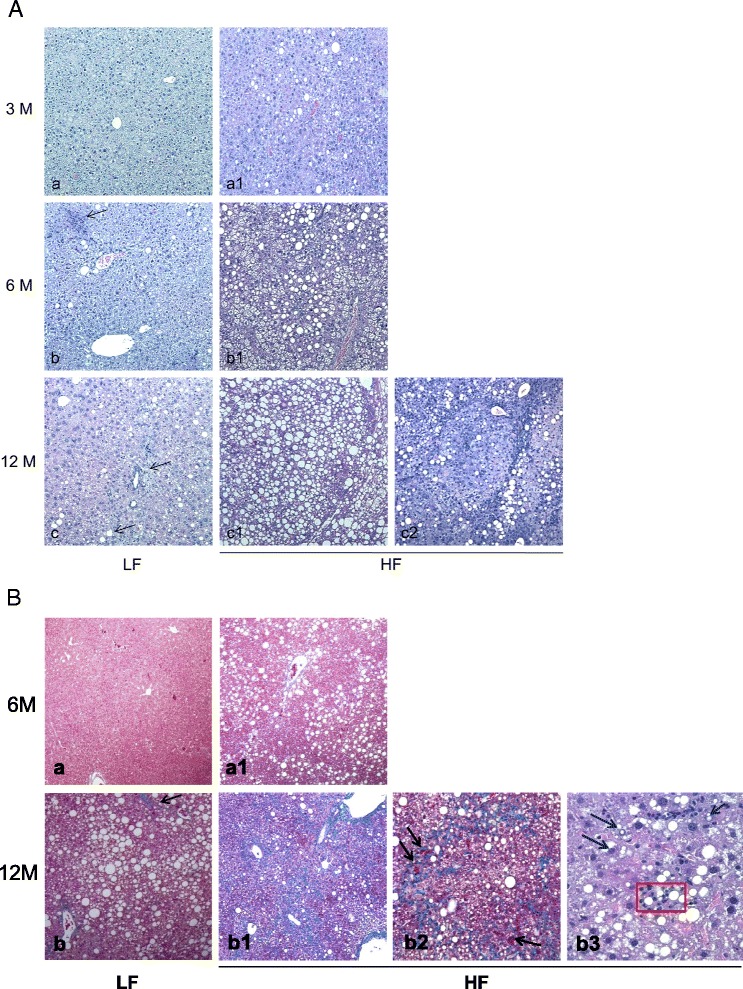
Histopathological features of hepatic tissues. A Histopathological features of hepatic tissues from 3 (a, a1), 6 (b, b1), 12 (c, c1, c2) months LF (left) and HF (right) mice (H&E staining; original magnification 10X). The microphotographs, from LF mice, show a normal liver architecture (a), scattered inflammation (b, arrow) and simple steatosis with mild inflammation (c, arrows). A wide spectrum of liver damage ranging from simple steatosis (a1) to mild steatosis (b1) and a severe steatosis with massive inflammation (c1, c2) are shown in microphotographs from HF mice. B Fibrosis is not evident in 6 months LF (a) and HF (a1) mice (Masson’s trichrome staining, original magnification, 10X). Mild fibrosis appears after 12 months in LF mice (b, arrow, original magnification, 10X), whereas 12 months HF mice show more severe fibrosis (b1, original magnification 10X), often organized in irregular thin trabeculae that border nodules with a variable number of small microscopic arteries (arrows), and a disarrangement of normal hepatic architecture with an increase of cell density and frequent steatosis (b2). Moreover, there is a certain degree of cellular atypia, rare pseudoglandular structures and steatosis (b3, H&E original magnification 40X, red box and arrows respectively). These aspects are common features of dysplastic nodules or early HCC
Fig. 4.
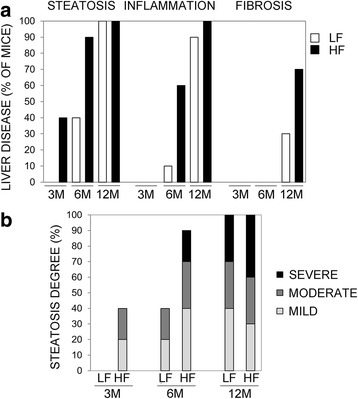
Progression of liver disease. a Percentage of HF/LF mice showing steatosis, hepatic inflammation and fibrosis. b Degree of steatosis in HF and LF diet fed animals
Clinical chemistry assays
In order to assess the evolution of the hepatic damage and the relative metabolic features, a panel of plasma biomarkers was examined in non-fasting mice through the experimental time points (Table 1). Significant increase of cholesterol (CHOL), as well as high density lipoproteins (UHDL), low density lipoproteins (DLDL), and triglycerides (TRIG) was detected in HF mice after 3, 6, 12 months (UHDL) or 3, 6 months of treatment (CHOL, DLDL, TRIG). Alanine aminotranferase (ALT) was significantly increased after 3 and 12 months of HF diet administration. ALT increase was also revealed in HF mice after 6 months, but no statistically significant difference was evidenced. Data obtained indicate metabolic dysfunctions, development and progression of liver injury, confirming the role of HF metabolic regimen. Similar results were obtained in studies on short term lard-containing HF diets fed mice, where LDL, HDL, AST, ALT, TRIG significant increase was detected [18–20]. Significant ALT increase was also described by Hill-Baskin et al. [17]. Levels of ALT, AST, and AST/ALT ratio have been taken into consideration as possible markers for NAFLD and its progression, although liver biopsy remains the gold standard for diagnosis [21, 22].
Table 1.
Plasma biomarkers in HF and LF diet fed animals. Values are mean ± SEM. P < 0.05 was considered for statistically significant differences (marked with an asterisk)
| Marker | 3M HF | 3M LF | P3M | 6M HF | 6M LF | P6M | 12M HF | 12M LF | P12M |
|---|---|---|---|---|---|---|---|---|---|
| ALT (U/l) | 43.2 ± 3.5 | 23.3 ± 3 | 0.001* | 70.5 ± 11.7 | 50.2 ± 18.9 | 0.16 | 89 ± 23 | 45.6 ± 6.7 | 0.03* |
| AST (U/l) | 204.8 ± 59.3 | 155.3 ± 46.2 | 0.27 | 135.33 ± 20.4 | 200.78 ± 50.7 | 0.33 | 156.8 ± 24.2 | 202.9 ± 32.1 | 0.12 |
| GLUC (mg/dl) | 491.6 ± 56.3 | 425 ± 30.2 | 0.19 | 452.33 ± 13.8 | 359.56 ± 25.4 | 0.07 | 388.5 ± 32.9 | 398.2 ± 30.3 | 0.39 |
| TRIG (mg/dl) | 139.6 ± 8.7 | 87.2 ± 6.8 | <0.001* | 122.6 ± 10.4 | 72.4 ± 5.2 | 0.002* | 100.7 ± 7.6 | 82.2 ± 6.2 | 0.06 |
| CHOL (mg/dl) | 214.1 ± 10.6 | 134 ± 7.9 | <0.001* | 233.78 ± 10.1 | 119.33 ± 8.8 | <0.001* | 208.3 ± 18.6 | 173.2 ± 10.1 | 0.06 |
| DLDL (mg/dl) | 10.1 ± 0.87 | 7.2 ± 0.6 | 0.008* | 14.3 ± 1.6 | 8 ± 1.1 | 0.005* | 15.1 ± 1.7 | 12.6 ± 1 | 0,07 |
| UHDL (mg/dl) | 112.6 ± 4 | 73.2 ± 3.8 | 0.002* | 107.33 ± 3.3 | 61 ± 3.8 | <0.001* | 100.1 ± 6.5 | 80 ± 2.4 | 0.01* |
ALT alanine aminotransferase, AST aspartate aminotransferase, GLUC glucose, TRIG triglycerides, CHOL cholesterol, DLDL direct low density lipoprotein, UHDL ultra high density lipoprotein assay
MicroRNA analysis
A panel of miRNAs was subjected to analysis during the progression of the liver disease. Among them, some miRNAs revealed a modulation during the transition of the hepatic damage. Results are shown in Fig. 5. MiRs’ differential expression was evaluated by comparing pooled mRNAs from 3, 6, 12 months HF vs LF liver tissues (Fig. 5a) and pooled mRNAs from tumors vs pooled mRNAs from 12 months HF non-tumor tissues (Fig. 5b). MammU6 was used as endogenous control. Some miRNAs were overexpressed in tumors (miR-155, miR-193b, miR-27a, miR-31, miR-99b, miR-484, miR-574-3p, miR-125a-5p, miR-182), whereas others displayed down-regulation (miR-20a, miR-200c, miR-93, miR-340-5p, miR-720) or a comparable level of expression (miR-200a) with respect to non tumor tissues. Depending on the treatment’s duration, different modulation of miRs’ expression was detected in HF tissues during the progression of the hepatic damage (Fig. 5a). Mir-155 level increased after 12 months of HF treatment; miR-193b, which was down-regulated after 3 months of treatment, showed weak ascending expression, whereas miR-31 and miR-93 revealed fluctuant levels during the treatment, with slight down-regulation after 12 months. MiR-20a, miR-200c, miR-27a, miR-99b displayed a global, more or less marked, down-regulation during the treatment. MiR-200a revealed a modulation, being down-regulated after 6 months and over-expressed after 12 months of HF diet. MiR-340-5p, miR-484, miR-574-3p, and miR-720 showed fluctuant levels of slight down-regulation or over-expression during the treatment. MiR-182 showed marked over-expression, as detected already after 3 months of treatment, whereas miR-125a-5p was always down-regulated in HF compared to LF tissues. Similar results were also obtained by analyzing data using global normalization (Additional file 2: Figure S2). To assess the strength of data shown in Fig. 5, the expression levels of miR-125a-5p and miR-182 were analyzed in individual livers from HF and LF diet fed mice through experimental time points and in tumors. MiR-125a-5p and miR-182 expression was evaluated by taking into consideration a LF reference sample belonging to the same group (Fig. 6). Significant down-regulation of miR-125a-5p was detected in HF mice after 3 months of HF diet regimen and confirmed after 6 months (Fig. 6a). Twelve months HF diet-treated mice showed, at the same way, significant down-regulation of miR-125a-5p (Fig. 6a). Conversely, miR-125a-5p over-expression was detected in tumors with respect to paired HF non tumor tissues (Fig. 6b). Significant miR-182 over-expression was detected in 3 months and, although less pronounced and not statistically significant, in 6 months HF diet fed mice (Fig. 6c). Significant miR-182 over-expression was observed in 12 months HF mice (Fig. 6c). Over-expression was further confirmed in tumors from 12 months treated animals (Fig. 6d).
Fig. 5.
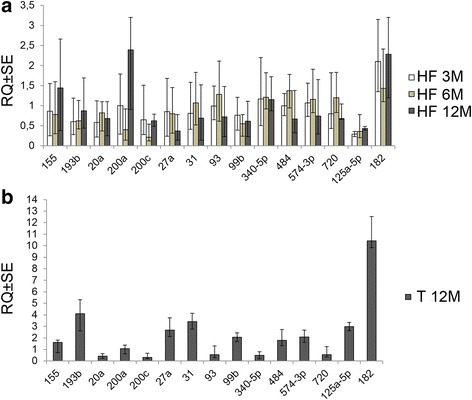
MiRNAs differentially modulated during the progression of the hepatic damage. a RQ (relative quantification) values ± SE (Y axis) obtained by comparing HF to LF pooled RNAs from hepatic tissues. b RQ values ± SE (Y axis) of pooled RNAs from tumor tissues with respect to pooled RNAs from HF hepatic non-tumor tissues. Results are from 3 replicates. MammU6 was used as endogenous control
Fig. 6.
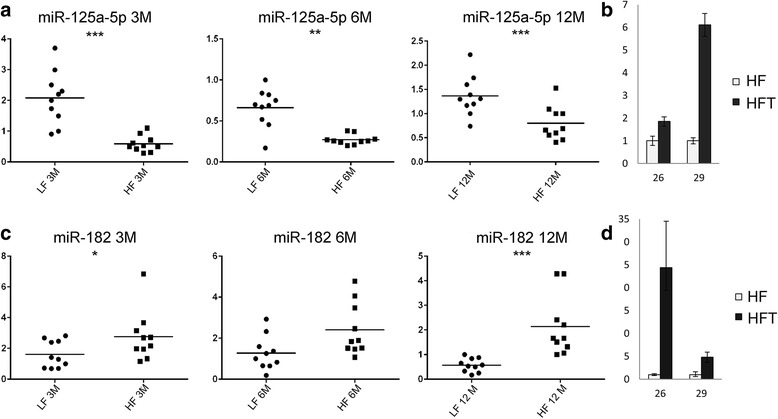
Differential expression of miR-125a-5p and miR-182 in livers and tumors, at the individual level. (a) (c) RQ (relative quantification) values ± SE (Y axis) in LF and HF mice (X axis) after diet treatment for 3, 6, and 12 months. MammU6 was used as endogenous control. RQ values were calculated with respect to one reference LF mouse in each experimental group (ID#: 2LF 3 M; 11LF, 6 M; 21LF, 12 M). Statistical significance is marked as follows: *, P < 0.05; **, P < 0.004; ***, P < 0.002 (b) (d) RQ values ± SE (Y axis) obtained by comparing tumors (HFT, black) vs. paired non tumor HF livers (light gray). 26 and 29 are ID numbers of mice with tumors
Discussion
Nonalcoholic fatty liver disease is the most frequent chronic liver disease in western countries. It exhibits intra-hepatic fat accumulation and can progress through the more severe nonalcoholic steatohepatitis, leading, in a percentage of cases, to end-stage cirrhosis and HCC. Currently, some serum biomarkers are taken into consideration to diagnose and predict the progression of the disease, despite their limited prognostic usefulness, sensitivity, and tissue specificity. Several biomarkers, such as alpha-fetoprotein, alone or also in combination with osteopontin, glypican-3, laminin, VEGF (vascular endothelial growth factor), or hyaluronic acid, have been used to assess, without particularly significant results, HCC occurrence in NAFLD patients [23–27]. Liver biopsy is still the most accurate procedure to diagnose and provide information about staging of liver disease, although studies have demonstrated that patients with initial NAFLD clinical manifestation and diagnosis do not develop HCC and that a regression may be also possible in pre-cirrhotic stages of the disease [28]. Therefore, there is an urgent need to identify new diagnostic and prognostic markers able to follow the progression through NAFLD-NASH and HCC initiation and development.
MicroRNAs are short endogenous molecules which act in post-transcriptional gene regulation. Due to their role and structure, scientific evidences highlight the promising value of microRNAs as biomarkers at the diagnostic and prognostic level. In this study, we used a mouse model predisposed to NAFLD and obesity to analyze the progression of high-fat diet induced liver disease through NAFLD-NASH up to HCC initiation and development. Depending on the treatment’s duration, HF-fed animals showed an increase of body and liver weights, degree of steatosis, presence of inflammatory infiltrate and fibrosis, demonstrating the progression of liver disease. As described, the LF group showed pathological features similar to the HF, which, however, appeared later and with lower severity. This could be explained by the fact that the control LF diet here used, with higher caloric content than a standard diet, is formulated low in fat, but high in sucrose. Previous studies have discussed the role of high-carbohydrate diets on lipid accumulation and the effects of chronic fructose consumption on different tissues: in liver, inflammation, dyslipidemia, and steatosis have been described [29–31]. This could trigger the de novo lipogenesis process, with delayed lipid accumulation and cellular damage in livers in comparison to that observed in HF mice. A recent work, performed on 15 weeks-old high fructose or sucrose diet fed C57BL/6 mice, showed fatty infiltration of necroinflammatory areas, which are characteristic features of the transition to NASH, enhanced lipogenesis, gluconeogenesis and anti-oxidant imbalance, demonstrating an adverse effect of fructose or sucrose-rich diets on liver [32]. Biochemical assays highlighted increasing values of plasma biomarkers in HF animals, characterizing the presence of metabolic dysfunctions and liver damage. No particular evidence of cirrhosis was detected, and a percentage of HF fed mice (2/10) developed tumors after 12 months. Fifteen miRs resulted differentially expressed in livers, by comparing HF- and LF-diet treated animals, and in tumors with respect to non tumor HF liver tissues, providing evidence of their modulation during the progression of diet-induced liver damage. As summarized in Table 2, some among them were already described in NAFLD, NASH, fibrosis or HCC, whereas others are for the first time here identified. MiR-155, whose expression increased after 12 months HF diet treatment, resulted over-expressed in tumors and in HF tissues with respect to LF. Previous studies have demonstrated that miR-155 plays an important role in hepatic lipid metabolism, has a protective role against HF diet-induced non alcoholic liver steatosis [33], and was found to be up-regulated in NASH models of methyl-deficient diet, in HCC induced by choline-deficient and amino acid-defined diet, and in primary human HCC [34, 35]. Moreover, it has been demonstrated that miR-155 deficiency can attenuate steatosis and fibrosis [36]. In addition, anti-miR-155 has shown in vitro and in vivo potential therapeutic efficacy, by restoring the expression of C/EBPβ and FOXP3 [37].
Table 2.
Dysregulated miRNAs and their involvement in liver disease. ICC intrahepatic cholangiocarcinoma, HNSCC head and neck squamous cell carcinoma
| MicroRNA | Liver disease | Target gene(s) |
|---|---|---|
| miR-155 | Protective role against non alcoholic steatosis [33] | LXR-α[33] C/EBPβ, FOXP3 [35–37] |
| Up-regulated in NASH [34] | ||
| Up-regulated in HCC [35] | ||
| MiR-155 deficiency attenuates steatosis and fibrosis [36] | ||
| miR-193b | Down-regulated in HBV+ HCC [43] | CCND1, ETS1 [43] |
| NF1 (HNSCC) [46] | ||
| Smad3 (glioma) [47] | ||
| miR-20a | Down-regulated in HCC [49] | Mcl-1 [49] |
| miR-200a | Up-regulated in NAFLD [51] | ZEB1, ZEB2 [54] |
| Down-regulated in HCC [52] | ||
| miR-200c | Up-regulated in NAFLD [51] | ZEB1, ZEB2, NCAM1 [54] |
| Down-regulated in HCC and ICC [54] | ||
| miR-27a | Up-regulated in HBV+ HCC [55] | RXRα, PPARα/γ, FASN, SREBP1, SREBP2 [58, 59] |
| miR-31 | Up-regulated in fibrosis [60] | FIH1 [60] |
| Up-regulated in HCC [17, 53] | ||
| miR-93 | Up-regulated in HCC [61, 62] | PTEN, CDKN1A [62] |
| miR-99b | Up-regulated in HCC [69] | mTOR (pancreatic cancer) [66] |
| CLDN11 [69] | ||
| miR-125a-5p | Down-regulated in HCC [89] | SIRT7 [89] |
| Biomarker in liver disease [93] | ||
| miR-182 | Up-regulated in NAFLD-fibrosis [98] | FOXO3 [98] |
| MTSS1 [94], Cebpa [95], | ||
| Up-regulated in HCC [94–97] | EphrinA5 [96], FOXO1 [97] |
MiR-193b was down-regulated after 3 and 6 months of HF regimen and revealed over-expression in tumor samples. The role of this miR in carcinogenesis is quite controversial: miR-193b was described as a tumor suppressor and appeared down-regulated in several cancers, such as melanoma, breast, prostate carcinoma, and human HCC tissues, mainly HBV-positive [38–43]. In vitro and in vivo experimental data demonstrated that miR-193b directly targeted CCND1 (cyclin D1) and the transcription factor ETS1 [43]. In a study on two HF diet fed mouse models, showing marked susceptibility (C57BL/6J) or resistance (Balb/c) to NAFLD and insulin resistance phenotype, significant up- or down-regulation of key genes which may be involved in homeostatic adaptation to HF regimen has been detected. Among them, are CCND1 and ETS1, whose up-regulation was detected in both strains or in C57BL/6J alone, respectively [44]. This evidence could be in agreement with miR-193b down-regulation detected in our model during the first 6 months of HF diet treatment. With this regard, ETS1/miR-193b 3′UTR alignment can be identified in Mus musculus (microrna.org: SVR score −0.121, PhastCons 0.66). On the other hand, miR-193b over-expression was described by Braconi et al. [45] in HCV-positive HCC tissues and cells. MiR-193b over-expression was also detected in head and neck squamous cell carcinoma [46], where neurofibromin1 (NF1) was described as a target, and in glioma [47], where this miR acted as an oncomiR by targeting Smad3, one of the major TGF-β signaling transducers. Beside, a study on a mouse model demonstrated that forced expression of Smad3 may reduce liver susceptibility to chemically-induced carcinogenesis by promoting apoptosis through Bcl-2 transcriptional repression [48]. With this regard, two miR-193b target sites are predicted on mouse Smad3 3′-UTR (microRNA.org: miR-SVR score −0.1684 and −0.0002; PhastCons 0.5285 and 0.5702, respectively), leaving hypothesize that miR-193b over-expression could be involved in hepatocarcinogenesis through Smad3 down-regulation.
MiR-20a was down-regulated in liver tissues and in tumors from HF mice. MiR-20a down-regulation was described in human HCC, where Mcl-1 (myeloid cell leukemia sequence 1), an anti-apoptotic member of Bcl-2 family, was identified as miR-20a target [49]. In accordance, a miR-20a predicted target site is located on Mus musculus Mcl-1 3′UTR (microRNA.org: mirSVR score −0.9773, PhastCons 0.710).
MiR-200a and c, members of the miR-200 family, showed different behavior: after expression level’s decrease (6 months), miR-200a increased during the progression of hepatic damage (12 months), whereas miR-200c revealed a trend of down-regulation during HF diet treatment and in tumors. It is known that miR-200 family plays a role as tumor suppressor by inhibiting epithelial-to-mesenchymal transition (EMT) and repressing cancer stem cells; in addition, its deregulation has been described in several tumor types, including hepatocarcinoma [50]. MiR-200a was found to be up-regulated in NAFLD [51], significantly down-regulated in human HCC samples and, along with miR-200 family members, has been described as a marker able to distinguish between cirrhotic and cancer tissues [52, 53]. MiR-200c was also found to be up-regulated in NAFLD and down-regulated in human HCC as well as in intrahepatic cholangiocarcinoma (ICC) samples [51, 54]. With regard to ICC, Oishi et al. [54] found that miR-200c and miR-141, were negatively correlated with genes involved in the TGF-β, NF-κB and Smad signaling pathway. In addition, these two miRs were able to induce epithelial differentiation and to suppress EMT by inhibition of ZEB1 and ZEB2. The same authors also described NCAM1, a known hepatic stem cells marker strictly connected to EMT process, as a miR-200c direct target. Analogously, several miR-200c binding sites are predicted on Mus musculus ZEB1, ZEB2 and NCAM1 3′UTR, indicating its putative role in the mouse model here presented.
MiR-27a showed expression decrease, starting faintly after 3 months up to 12 months of HF diet administration. Conversely, it was over-expressed in tumors. Literature data reveal that miR-27a may have an oncogenic role, being up-regulated in HBV-related HCC tissues and HCC cell lines [55], and promoting proliferation in liver cancer cells by diminishing TGF-β tumor suppressive activity [56]. MiR-27a was also found in a hypomethylated status which led to its over-expression in HCC cells [57]. MIR-27a was described to be involved in lipid metabolism, by regulating RXRα, PPARα/γ, FASN, SREBP1, SREBP2, and was able to inhibit HCV replication in human hepatoma cells [58]. Ji et al. [59] demonstrated that miR-27a/b were over-expressed in primary culture activated rat hepatic stellate cells (HSCs). Normal HSCs are in the space of Disse, storing bunches of vitamin A-riching lipid droplets. On the contrary, activated HSCs lose cytoplasmic lipid droplets and trans-differentiate to proliferative, fibrogenic myofibroblasts which play an essential role in liver fibrosis initiation. In the above-mentioned study, miR-27a/b downregulation was demonstrated to be able to activate HSCs to switch to a more quiescent phenotype, with decreased cell proliferation and restored cytoplasmic lipid droplets. Seen in this context, it could be supposed that miR-27a hypoexpression (6M, weak, and 12M) in HF diet model might act as a protective mechanism in limiting the progression of liver damage during the phases of the disease, and, on the other hand, its over-expression in tumors could be associated to promotion of heavier liver injury with consequent HCC initiation.
MiR-31 was detected up-regulated in tumors with respect to livers from 12 months HF mice. MiR-31 up-regulation was also described in human HCC samples and in a similar C57BL/6J high-fat diet fed model [17, 51]. MiR-31 up-regulation was also described in fibrosis [60].
MiR-93 showed slight hypo-expression after 12 months HF diet and resulted down-regulated in HCC. Although, previous reports described an increase of miR-93 level during hepatic tumorigenesis [61], and over-expression in human HCC cell lines and tissues [62], miR-93 down-regulation significantly correlated with worse prognosis in colorectal cancer, where it was described to suppress oncogenesis by regulating Wnt/β-catenin pathway [63, 64].
MiR-99b was weakly down-regulated during HF diet administration and, conversely, up-regulated in tumors. MiR-99b was described to contribute to irradiation resistance in human pancreatic cancer by targeting mTOR [65], whose activity is also known to play a role in NAFLD-NASH [66–68]. In this context, miR-99b hypoexpression in our model might contribute to induce mTOR expression and function in the progression through NAFLD and NASH. A mir-99b/mTOR site alignment is also predicted on mouse (mirSVR score, −1.2245; PhastCons score, 0.7484). In a very recent work [69] miR-99b was up-regulated in HCC, where it promoted metastasis by inhibiting claudin 1 (CLDN1). In silico analysis displays two predicted miR-99b sites also on mouse CLDN1 (PhastCons 0.55 and 0.60).
No data are reported about the expression and role of miR-340-5p, miR-484, miR-574-3p, and miR-720 in NAFLD, NASH and HCC tissues. The above-mentioned miRs appear to be up- (miR-484 and miR-574-3p) or down-regulated (miR-340-5p, miR-720) in tumor tissues. Just one study showed miR-574-3p increase in sera from HCC and liver cirrhosis patients [70]. Controversial evidences about the role of those miRNAs in oncogenesis are reported in several studies. MiR-340 has been described as a tumor suppressor in breast [71], NSCLC [72], and melanoma [73]. Significant miR-484 level increase was described in sera from early breast cancer [74] and in melanoma [75], whereas miR-484 down-regulation was displayed in urine from prostate cancer patients [76]. MiR-574-3p was identified over-expressed in plasma from head and neck [77] and in prostate cancer patients [78]. On the contrary, it was found down-regulated in colorectal [79] and esophageal cancer [80]. MiR-720 was described to inhibit breast tumor invasion and migration by targeting the metastasis promoter TWIST1 [81]. Conversely, it resulted hyper-expressed in colorectal cancer [82].
MiR-125a-5p is transcribed as a cluster with let-7 and miR-199b. Similarly to miR-99b, miR-125a-5p revealed hypo-expression during the treatment. On the other hand, it increased and showed over-expression in tumors. Interestingly, miR-125a-5p differential expression, detected on pooled RNAs, is maintained with statistical significance in mice HF fed for 3, 6, and 12 months individually analyzed, and in tumors, suggesting miR-125a-5p potential high impact at the functional level starting from the early stage of the liver disease. MiR-125a-5p seems to possess oncogenic or tumor suppressor activities. It was described as an epidermal growth factor signaling-regulated miRNA which can negatively regulate human lung cancer cell migration and invasion in vitro, is frequently down-regulated in lung cancer [83], and seems to play a role in enhancing in vitro cell migration and invasion in NSCLC [84]. Yang et al. [85] described miR-125a-5p up-regulated in lung squamous cell carcinoma (SCC), whereas miR-125a-5p low expression levels in tissues or serum have been associated with enhanced malignant potential in gastric and breast cancer [86, 87]. MiR-125a-5p was described over-expressed in thyroid carcinomas [88] and hypo-expressed in human HCC [89], where it was shown to target the 3′UTR of SIRT7, a member of the Sirtuin family, whose activity in cancer, ER and genomic stress response, hepatosteatosis has already been investigated and is still controversial [90]. Two predicted miR-125a-5p interaction sites are also detected on mouse SIRT7 (microRNA.org: mirSVR score −0.0006, −0.3021; PhastCons 0.5087, 0.5259, respectively). MiR-125a-5p is also involved in lipid metabolism [91] and its level has been found increased in hyperlipidemic and/or hyperglycemic patients’ sera [92]. MiR-125a-5p serum levels have been also described as biomarkers in liver diseases [93].
MiR-182 showed over-expression already after 3 months of HF diet, and this trend was markedly maintained in mice, also at the individual level, during the treatment and in tumors. Several studies demonstrated miR-182 involvement in HCC and metastasis, by controlling the expression of genes with tumor suppressor activity, such as the metastasis suppressor MTSS1 [94], Cebpa [95], ephrinA5 [96], and FOXO1 [97]. MiR-182 was also down-regulated in fibrosis related to NAFLD, where FOXO3 was described as a target [98]. MiR-182/Cebpa/ephrinA5/FOXO1/FOXO3 alignments can be also predicted on Mus musculus, putatively indicating a role of miR-182 in the regulation of those genes. Our data demonstrate early involvement of miR-182 in the transition of liver injury, which is maintained up to HCC initiation and development, indicating that early deregulation of this microRNA could be one among the factors putatively responsible for the hepatic disease here represented, and for its progression.
Conclusions
In this study, based on the sequential analysis of the progression of HF diet-induced hepatic damage through NAFLD-NASH-HCC in a long term-fed mouse model, fifteen microRNAs were described to be modulated and differentially expressed in hepatic tissues and in tumors, providing a “signature” in the transition of liver injury until HCC development. A number of dysregulated microRNAs in this model were already described in the pathogenesis of liver disease and showed concordant level of expression with respect to that already described in literature (miR-155, miR-20a, miR-182, miR-200a, miR-200c, miR-27a, miR-31, miR-99b) or discordant expression level (miR-193b, miR-93, miR-125a-5p). Four dysregulated microRNAs (miR-340-5p, miR-484, miR-574-3p, miR-720), never described in liver damage and tumorigenesis, were here detected. Interestingly, two miRNAs (miR-125a-5p and miR-182) showed significant early dysregulation, indicating a putative role and involvement starting from the first stages of the liver disease. In conclusion, the study provides new information about dysregulated microRNAs in diet-induced liver damage and hepatocarcinogenesis. Additional functional analyses are needed to validate the results here obtained, and to better define the role of these molecules in the progression of the hepatic disease.
Acknowledgements
This work was supported by MIUR-FIRB grant n. RBAP10A9H9 to Edoardo Alesse. We thank Mauro Di Vito Nolfi for his support in artwork.
Abbreviations
- ER
endoplasmic reticulum
- HCC
hepatocellular carcinoma
- HF
high fat
- LF
low fat
- miRNA
microRNA
- NAFLD
non-alcoholic fatty liver disease
- NASH
non-alcoholic steato-hepatitis
- PMN
polymorphonuclear leukocytes
Additional files
Inflammatory infiltrate. Lymphocytes (green arrows), plasma cells (yellow arrows), macrophages (red arrows), and PMN (blue arrow). (PPTX 1448 kb)
MiRNAs differentially modulated during the progression of the hepatic damage. (A) RQ (relative quantification) values ± SE (Y axis) obtained by comparing HF to LF pooled RNAs from hepatic tissues. (B) RQ values ± SE (Y axis) of pooled RNAs from tumor tissues with respect to pooled RNAs from HF hepatic non-tumor tissues. Results are from 3 replicates. Global normalization mode was used for the analysis. Samples marked with the asterisk show P ≤ 0.05. (PDF 284 kb)
Footnotes
Competing interests
The authors declare that they have no competing interests.
Authors’ contributions
AT conceived experiments, set-up HF/LF mouse model, performed miRNA analysis, wrote the manuscript. GC handled mice, collected, processed and analyzed tissue samples, collected qRT-PCR data. FDV and AG handled mice, collected, processed and analyzed tissues. DV and MF performed H&E staining. VM collected and processed tissues. AV and RS performed H&E, Masson’s trichrome stain, and histological analysis. RB performed clinical chemistry assays. DC revised manuscript. FZ and EA conceived project and revised manuscript. All authors have read and approved the manuscript.
Contributor Information
Alessandra Tessitore, Phone: +39 0862433518, Email: alessandra.tessitore@univaq.it.
Germana Cicciarelli, Email: ge.c@live.it.
Filippo Del Vecchio, Email: filippo.delvecchio1@graduate.univaq.it.
Agata Gaggiano, Email: agata.gaggiano@gmail.com.
Daniela Verzella, Email: danielaverzella@tiscali.it.
Mariafausta Fischietti, Email: f.fausta@hotmail.it.
Valentina Mastroiaco, Email: valentina.mastroiaco@graduate.univaq.it.
Antonella Vetuschi, Email: antonella.vetuschi@univaq.it.
Roberta Sferra, Email: roberta.sferra@univaq.it.
Remo Barnabei, Email: barnabeiremo@vodafone.it.
Daria Capece, Email: dariacapece@gmail.com.
Francesca Zazzeroni, Email: francesca.zazzeroni@univaq.it.
Edoardo Alesse, Email: edoardo.alesse@univaq.it.
References
- 1.Bosetti C, Turati F, La Vecchia C. Hepatocellular carcinoma epidemiology. Best Pract Res Clin Gastroenterol. 2014;28(5):753–770. doi: 10.1016/j.bpg.2014.08.007. [DOI] [PubMed] [Google Scholar]
- 2.Cramp ME. HBV + HCV = HCC? Gut. 1999;45(2):168–169. doi: 10.1136/gut.45.2.168. [DOI] [PMC free article] [PubMed] [Google Scholar]
- 3.Soini Y, Chia SC, Bennett WP, Groopman JD, Wang JS, De Benedetti VM, et al. An aflatoxin-associated mutational hotspot at codon 249 in the p53 tumor suppressor gene occurs in hepatocellular carcinomas from Mexico. Carcinogenesis. 1996;17(5):1007–1012. doi: 10.1093/carcin/17.5.1007. [DOI] [PubMed] [Google Scholar]
- 4.Tsukuma H, Hiyama T, Oshima A, Sobue T, Fujimoto I, Kasugai H, et al. A case–control study of hepatocellular carcinoma in Osaka, Japan. Int J Cancer. 1990;45(2):231–236. doi: 10.1002/ijc.2910450205. [DOI] [PubMed] [Google Scholar]
- 5.Donato F, Tagger A, Gelatti U, Parrinello G, Boffetta P, Albertini A, et al. Alcohol and hepatocellular carcinoma: the effect of lifetime intake and hepatitis virus infections in men and women. Am J Epidemiol. 2002;155(4):323–331. doi: 10.1093/aje/155.4.323. [DOI] [PubMed] [Google Scholar]
- 6.Aravalli RN, Cressman EN, Steer CJ. Cellular and molecular mechanisms of hepatocellular carcinoma: an update. Arch Toxicol. 2013;87(2):227–247. doi: 10.1007/s00204-012-0931-2. [DOI] [PubMed] [Google Scholar]
- 7.Cohen JC, Horton JD, Hobbs HH. Human fatty liver disease: old question and new insights. Science. 2011;332(6037):1591–1523. doi: 10.1126/science.1204265. [DOI] [PMC free article] [PubMed] [Google Scholar]
- 8.Michelotti GA, Machado MV, Diehl AM. NAFLD, NASH and liver cancer. Nat Rev Gastroenterol Hepatol. 2013;10:656–665. doi: 10.1038/nrgastro.2013.183. [DOI] [PubMed] [Google Scholar]
- 9.Bartel DP. MIcroRNAs: genomics, biogenesis, mechanism and function. Cell. 2004;116(2):281–297. doi: 10.1016/S0092-8674(04)00045-5. [DOI] [PubMed] [Google Scholar]
- 10.Di Leva G, Garofalo M, Croce CM. MicroRNAs in cancer. Annu Rev Pathol. 2014;9:287–314. doi: 10.1146/annurev-pathol-012513-104715. [DOI] [PMC free article] [PubMed] [Google Scholar]
- 11.Sidhu K, Kapoor NR, Pandey V, Kumar V. The “macro” world of MicroRNAs in hepatocellular carcinoma. Front Oncol. 2015;5:68. doi: 10.3389/fonc.2015.00068. [DOI] [PMC free article] [PubMed] [Google Scholar]
- 12.Gramantieri L, Fornari F, Callegari E, Sabbioni S, Lanza G, Croce CM, et al. MicroRNA involvement in hepatocellular carcinoma. J Cell Mol Med. 2008;12(6A):2189–2204. doi: 10.1111/j.1582-4934.2008.00533.x. [DOI] [PMC free article] [PubMed] [Google Scholar]
- 13.Hung CH, Chiu YC, Chen CH, Hu TH. MicroRNAs in hepatocellular carcinoma: carcinogenesis, progression, and therapeutic target. Biomed Res Int. 2014;2014:486407. doi: 10.1155/2014/486407. [DOI] [PMC free article] [PubMed] [Google Scholar] [Retracted]
- 14.Tian Y, Wong VW, Chan HL, Cheng AS. Epigenetic regulation of hepatocellular carcinoma in non-alcoholic fatty liver disease. Semin Cancer Biol. 2013;23(6PtB):471–482. doi: 10.1016/j.semcancer.2013.08.010. [DOI] [PubMed] [Google Scholar]
- 15.Gori M, Arciello M, Balsano C. MicroRNAs in non-alcoholic fatty liver disease: novel biomarkers and prognostic tools during the transition from steatosis to hepatocarcinoma. Biomed Res Int. 2014;2014:741465. doi: 10.1155/2014/741465. [DOI] [PMC free article] [PubMed] [Google Scholar]
- 16.Surwit RS, Van Tilburg MA, Parekh PI, Lane JD, Feinglos MN. Treatment regimen determines the relationship between depression and glycemic control. Diabetes Res Clin Pract. 2005;69(1):78–80. doi: 10.1016/j.diabres.2004.11.002. [DOI] [PubMed] [Google Scholar]
- 17.Hill-Baskin AE, Markiewski MM, Buchner DA, Shao H, DeSantis D, Hsiao G, et al. Diet-induced hepatocellular carcinoma in genetically predisposed mice. Hum Mol Genet. 2009;18:2975–2988. doi: 10.1093/hmg/ddp236. [DOI] [PMC free article] [PubMed] [Google Scholar]
- 18.Chen Y, Yang C, Chang S, Hu M. C/EBP beta and C/EBP delta expression is elevated in the early phase of ethanol-induced hepatosteatosis in mice. Acta Pharmacol Sin. 2009;30:1138–1143. doi: 10.1038/aps.2009.109. [DOI] [PMC free article] [PubMed] [Google Scholar]
- 19.Frauloub JC, Ogg-Diamantino R, Fernandes-Santos C, Barbosa Aguila M, Mandarim–de-Larceda C. A mouse model of metabolic syndrome; insulin resistance, fatty liver and non-alcoholic fatty pancreas disease (NAFDP) in C57BL/6 mice fed a high fat diet. J Clin Biochem Nutr. 2010;46:212–223. doi: 10.3164/jcbn.09-83. [DOI] [PMC free article] [PubMed] [Google Scholar]
- 20.Yang XW, Shen GZ, Cao LQ, Jiang XF, Peng HP, Shen G, et al. MicroRNA-1269 promotes proliferation in human hepatocellular carcinoma via downregulation of FOXO1. BMC Cancer. 2014;14:909. doi: 10.1186/1471-2407-14-909. [DOI] [PMC free article] [PubMed] [Google Scholar]
- 21.McClain CJ, Mokshagundam SP, Barve SS, Song Z, Hill DB, Chen T, et al. Mechanisms of non-alcoholic steatohepatitis. Alcohol. 2004;34(1):67–79. doi: 10.1016/j.alcohol.2004.07.007. [DOI] [PubMed] [Google Scholar]
- 22.Obika M, Noguchi H. Diagnosis and evaluation of nonalcoholic fatty liver disease. Exp Diabetes Res. 2012;2012:145754. doi: 10.1155/2012/145754. [DOI] [PMC free article] [PubMed] [Google Scholar]
- 23.Lydatakis H, Hager P, Kostadelou E, Mpousmpoulas S, Pappas S, Diamantis I. Non-invasive markers to predict the liver fibrosis in non-alcoholic fatty liver disease. Liver Int. 2006;26(7):864–871. doi: 10.1111/j.1478-3231.2006.01312.x. [DOI] [PubMed] [Google Scholar]
- 24.Bertino G, Ardiri M, Malguarnera M, Malguarnera N, Bertino N, Calvagno GS. Hepatocellular carcinoma serum markers. Semin Oncol. 2012;39(4):410–433. doi: 10.1053/j.seminoncol.2012.05.001. [DOI] [PubMed] [Google Scholar]
- 25.Liu H, Li P, Zhai Y, Qu CF, Zhang LJ, Tan YF, et al. Diagnostic value of glypican-3 in serum and liver for primary hepatocellular carcinoma. World J Gastroenterol. 2010;16(35):4410–4415. doi: 10.3748/wjg.v16.i35.4410. [DOI] [PMC free article] [PubMed] [Google Scholar]
- 26.Singhal A, Jayaraman M, Dhanasekaran N, Kholi V. Molecular and Serum markers in hepatocellular carcinoma: predictive tools for prognosis and recurrence. Crit Rev Oncol Hematol. 2012;82(2):116–140. doi: 10.1016/j.critrevonc.2011.05.005. [DOI] [PubMed] [Google Scholar]
- 27.Nagoshi S. Osteopontin: versatile modulator of liver diseases. Hepatol Res. 2013;44(1):22–30. doi: 10.1111/hepr.12166. [DOI] [PubMed] [Google Scholar]
- 28.Bhala N, Jouness RI, Bugianesi E. Epidemiology and natural history of patients with NAFLD. Curr Parm Des. 2013;19(29):5169–76. doi: 10.2174/13816128113199990336. [DOI] [PubMed] [Google Scholar]
- 29.Dekker MJ, Su Q, Baker C, Rutledge AC, Adeli K. Fructose: a highly lipogenic nutrient implicated in insulin resistance, hepatic steatosis, and the metabolic syndrome. Am J Physiol Endocrinol Metab. 2010;299:E685–E694. doi: 10.1152/ajpendo.00283.2010. [DOI] [PubMed] [Google Scholar]
- 30.Nomura K, Yamanouchi T. The role of fructose-enriched diets in mechanisms of non-alcoholic fatty liver disease. J Nutr Biochem. 2012;23(3):203–208. doi: 10.1016/j.jnutbio.2011.09.006. [DOI] [PubMed] [Google Scholar]
- 31.Longato L. Non-alcoholic fatty liver disease (NAFLD): a tale of fat and sugar? Fibrogenesis Tissue Repair. 2013;6(1):14. doi: 10.1186/1755-1536-6-14. [DOI] [PMC free article] [PubMed] [Google Scholar]
- 32.Schultz A, Barbosa-da-Silva S, Aquila MB, Mandarim-de-Lacerda CA. Diffences and similarities in hepatic lipogenesis, gluconeogenesis and oxidative imbalance in mice fed rich in fructose or sucrose. Food Funct. 2015;6(5):1684–1691. doi: 10.1039/C5FO00251F. [DOI] [PubMed] [Google Scholar]
- 33.Miller AM, Gilchrist DS, Nijjar J, Araldi E, Ramirez CM, Lavery CA, et al. MiR-155 has a protective role in the development of non-alcoholic hepatosteatosis in mice. PLoS One. 2013;8(8):e72324. doi: 10.1371/journal.pone.0072324. [DOI] [PMC free article] [PubMed] [Google Scholar]
- 34.Pogribny IP, Starlard-Davenport A, Tryndyak VP, Han T, Ross SA, Rusyn I, et al. Difference in expression of hepatic microRNAs miR-29c, miR-34a, miR-155, and miR-200b is associated with strain-specific susceptibility to dietary nonalcoholic steatohepatitis in mice. Lab Invest. 2010;90:1437–1446. doi: 10.1038/labinvest.2010.113. [DOI] [PMC free article] [PubMed] [Google Scholar]
- 35.Wang B, Majumder S, Nuovo G, Kutay H, Volinia S, Patel T, et al. Role of miR-155 at early stages of hepatocarcinogenesis induced by choline-deficient and amino acid defined diet in C57BL/6 mice. Hepatology. 2009;50:1152–1161. doi: 10.1002/hep.23100. [DOI] [PMC free article] [PubMed] [Google Scholar]
- 36.Csak T, Bala S, Lippai D, Kodys K, Catalano D, Iracheta-Vellve A, et al. MicroRNA-155 Deficiency Attenuates Liver Steatosis and Fibrosis without Reducing Inflammation in a Mouse Model of Steatohepatitis. Plos One. 2015;10:e0129251. doi: 10.1371/journal.pone.0129251. [DOI] [PMC free article] [PubMed] [Google Scholar]
- 37.Zhang M, Zhou X, Wang B, Yung BC, Lee LJ, Ghoshal K, et al. Lactosylated gramicidin-based lipid nanoparticles (Lac-GLN) for targeted delivery of anti-miR-155 to hepatocellular carcinoma. Control Release. 2013;168:251–261. doi: 10.1016/j.jconrel.2013.03.020. [DOI] [PMC free article] [PubMed] [Google Scholar]
- 38.Chen J, Feilotter HE, Pare’ GC, Zhang X, Pemberton JGW, Garady C, et al. MicroRNA-193b represses cell proliferation and regulates cyclin d1 in melanoma. Am J Pathol. 2010;176:2520–2529. doi: 10.2353/ajpath.2010.091061. [DOI] [PMC free article] [PubMed] [Google Scholar]
- 39.Li HF, Yan PJ, Shao ZM. Downregulation of miR-193b contributes to enhance urokinase-type plasminogen activator (uPA) expression and tumor progression and invasion in human breast cancer. Oncogene. 2009;28:3937–3948. doi: 10.1038/onc.2009.245. [DOI] [PubMed] [Google Scholar]
- 40.Tahiri A, Leivonen SK, Lüders T, Steinfeld I, Ragle Aure M, Geisler J, et al. Deregulation of cancer-related miRNAs is a common event in both benign and malignant human breast tumors. Carcinogenesis. 2014;35:76–85. doi: 10.1093/carcin/bgt333. [DOI] [PubMed] [Google Scholar]
- 41.Yang Z, He M, Wang K, Sun G, Tang L, Xu Z. Tumor suppressive microRNA-193b promotes breast cancer progression via targeting DNAJC13 and RAB22A. Int J Clin Exp Pathol. 2014;7:7563–7570. [PMC free article] [PubMed] [Google Scholar]
- 42.Rauhala HE, Jalava SE, Isotalo J, Bracken H, Lehmusvaara S, Tammela TL, et al. miR-193b is an epigenetically regulated putative tumor suppressor in prostate cancer. Int J Cancer. 2010;127(6):1363–72. doi: 10.1002/ijc.25162. [DOI] [PubMed] [Google Scholar]
- 43.Xu C, Liu S, Fu H, Li S, Tie Y, Zhu J, et al. MicroRNA-193b regulates proliferation, migration and invasion in human hepatocellular carcinoma cells. Eur J Cancer. 2010;46(15):2828–2836. doi: 10.1016/j.ejca.2010.06.127. [DOI] [PubMed] [Google Scholar]
- 44.Waller-Evans H, Hue C, Fearnside J, Rothwell AR, Lockstone HE, Caldérari S, et al. Nutrigenomics of high fat diet induced obesity in mice suggests relationships between susceptibility to fatty liver disease and the proteasome. PLoS One. 2013;8(12):e82825. doi: 10.1371/journal.pone.0082825. [DOI] [PMC free article] [PubMed] [Google Scholar]
- 45.Braconi C, Valeri N, Gasparini P, Huang N, Taccioli C, Nuovo G, et al. Hepatitis C Virus proteins modulate microRNA expression and chemosensitivity in malignant hepatocytes. Clin Cancer Res. 2010;16(3):957–966. doi: 10.1158/1078-0432.CCR-09-2123. [DOI] [PMC free article] [PubMed] [Google Scholar]
- 46.Lenarduzzi M, Hui A, Alajez NM, Shi W, Williams J, Yue S, et al. MicroRNA-193b enhances tumor progression via down regulation of neurofibromin 1. PLoS One. 2013;8(1):e53765. doi: 10.1371/journal.pone.0053765. [DOI] [PMC free article] [PubMed] [Google Scholar]
- 47.Zhong Q, Wang T, Lu P, Zhang R, Zou J, Yuan S. MiR-193b promotes cell proliferation by targeting smad3 in human glioma. J Neurosci Res. 2014;92:619–626. doi: 10.1002/jnr.23339. [DOI] [PubMed] [Google Scholar]
- 48.Yang YA, Zhang GM, Feigenbaum L, Zhang YE. Smad3 reduces susceptibility to hepatocarcinoma by sensitizing hepatocytes to apoptosis through downregulation of Bcl-2. Cancer Cell. 2006;9:445–457. doi: 10.1016/j.ccr.2006.04.025. [DOI] [PMC free article] [PubMed] [Google Scholar]
- 49.Fan MQ, Huang CB, Gu Y, Xiao Y, Sheng JX, Zhong L. Decrease expression of microRNA-20a promotes cancer cell proliferation and predicts poor survival of hepatocellular carcinoma. J Exp Clin Cancer Res. 2013;32(1):21. doi: 10.1186/1756-9966-32-21. [DOI] [PMC free article] [PubMed] [Google Scholar]
- 50.Feng X, Wang Z, Fillmore R, Xi Y. MiR-200, a new star miRNA in human cancer. Cancer Lett. 2014;344:166–173. doi: 10.1016/j.canlet.2013.11.004. [DOI] [PMC free article] [PubMed] [Google Scholar]
- 51.Feng YY, Xu XQ, Ji CB, Shi CM, Guo XR, Fu JF. Aberrant hepatic microRNA expression in nonalcoholic fatty liver disease. Cell Physiol Biochem. 2014;34:1983–1997. doi: 10.1159/000366394. [DOI] [PubMed] [Google Scholar]
- 52.Dhayat SA, Mardin WA, Kohler G, Bahde R, Vowinkel T, Wolters H, et al. The microRNA-200 family-A potential diagnostic marker in hepatocellular carcinoma? J Surg Oncol. 2014;110:430–438. doi: 10.1002/jso.23668. [DOI] [PubMed] [Google Scholar]
- 53.Karakatsanis A, Papaconstantinou I, Gazouli M, Lyberopoulou A, Polymeneas G, Voros D. Expression of MicroRNAs, miR-21, miR-31, miR-122, miR-145, miR-146a, miR-200c, miR-221, miR-222, and miR-223 in patients with hepatocellular carcinoma or intrahepatic cholangiocarcinoma and its prognostic significance. Mol Carcinog. 2013;52:297–303. doi: 10.1002/mc.21864. [DOI] [PubMed] [Google Scholar]
- 54.Oishi N, Kumar MR, Roessler S, Ji J, Forgues M, Budhu A, et al. Transcriptomic profiling reveals hepatic stem-like gene signatures and interplay of miR-200c and epithelial-mesenchymal transition in intrahepatic cholangiocarcinoma. Hepatology. 2012;56:1792–1803. doi: 10.1002/hep.25890. [DOI] [PMC free article] [PubMed] [Google Scholar]
- 55.Wu XJ, Li Y, Liu D, Zhao LD, Bai B, Xue MH. MiR-27a as an oncogenic microRNA of hepatitis B virus-related hepatocellular carcinoma. Asian Pac J Cancer Prev. 2013;14:885–889. doi: 10.7314/APJCP.2013.14.2.885. [DOI] [PubMed] [Google Scholar]
- 56.Huang S, He X, Ding J, Liang L, Zhao Y, Zhang Z, et al. Upregulation of miR-23a ~ 27a ~ 24 decreases transforming growth factor-beta-induced tumor-suppressive activities in human hepatocellular carcinoma cells. Int J Cancer. 2008;123:972–978. doi: 10.1002/ijc.23580. [DOI] [PubMed] [Google Scholar]
- 57.He XX, Kuang SZ, Liao JZ, Xu CR, Chang Y, Wu YL, et al. The regulation of microRNA expression by DNA methylation in hepatocellular carcinoma. Mol Biosyst. 2015;11:532–539. doi: 10.1039/C4MB00563E. [DOI] [PubMed] [Google Scholar]
- 58.Shirasaki T, Honda M, Shimakami T, Horii R, Yamashita T, Sakai Y, et al. MicroRNA-27a regulates lipid metabolism and inhibits hepatitis C virus replication in human hepatoma cells. J Virol. 2013;87:5270–5286. doi: 10.1128/JVI.03022-12. [DOI] [PMC free article] [PubMed] [Google Scholar]
- 59.Ji J, Zhang J, Huang G, Qian J, Wang X, Mei S. Over-expressed microRNA-27a and 27b influence fat accumulation and cell proliferation during rat hepatic stellate cell activation. FEBS Lett. 2009;583:759–766. doi: 10.1016/j.febslet.2009.01.034. [DOI] [PubMed] [Google Scholar]
- 60.Hu J, Chen C, Liu Q, Liu B, Song C, Zhu S, et al. The role of the miR-31/FIH1 pathway in TGF-β-induced liver fibrosis. Clin Sci (Lond) 2015;129:305–17. doi: 10.1042/CS20140012. [DOI] [PubMed] [Google Scholar]
- 61.Pineau P, Volinia S, McJunkin K, Marchio A, Battiston C, Terris B, et al. miR-221 overexpression contributes to liver tumorigenesis. Proc Natl Acad Sci U S A. 2010;107:264–269. doi: 10.1073/pnas.0907904107. [DOI] [PMC free article] [PubMed] [Google Scholar]
- 62.Ohta K, Hoshino H, Wang J, Ono S, Iida Y, Hata K, et al. MicroRNA-93 activates c-Met/PI3K/Akt pathway activity in hepatocellular carcinoma by directly inhibiting PTEN and CDKN1A. Oncotarget. 2015;6:3211–3224. doi: 10.18632/oncotarget.3085. [DOI] [PMC free article] [PubMed] [Google Scholar]
- 63.Xiao ZG, Deng ZS, Zhang YD, Zhang Y, Huang ZC. Clinical significance of microRNA-93 downregulation in human colon cancer. Eur J Gastroenterol Hepatol. 2013;25(3):296–301. doi: 10.1097/MEG.0b013e32835c077a. [DOI] [PubMed] [Google Scholar]
- 64.Tang Q, Zou Z, Zou C, Zhang Q, Huang R, Guan X, et al. Micro-RNA-93 suppresses colorectal cancer development via Wnt/β-Catenin pathway downregulation. Tumor Biol. 2015;36(3):1701–1710. doi: 10.1007/s13277-014-2771-6. [DOI] [PubMed] [Google Scholar]
- 65.Wei F, Liu Y, Guo Y, Xiang A, Wang G, Xue X, et al. miR-99b-targeted mTOR induction contributes to irradiation resistance in pancreatic cancer. Mol Cancer. 2013;12:81. doi: 10.1186/1476-4598-12-81. [DOI] [PMC free article] [PubMed] [Google Scholar]
- 66.Xirouchakis E, Manousou P, Tsartsali L, Georgopoulos S, Burroughs AK. Insights into the pathogenesis of NAFLD: the role of metabolic and pro-inflammatory mediators. Ann Gastroenterol. 2009;22:24–33. [Google Scholar]
- 67.Quan HY, Kim DY, Kim SJ, Jo HK, Kim GW, Chung SH. Betulinic acid alleviates non-alcoholic fatty liver by inhibiting SREBP1 activity via the AMPK–mTOR–SREBP signaling pathway. Biochem Pharmacol. 2013;85:1330–1340. doi: 10.1016/j.bcp.2013.02.007. [DOI] [PubMed] [Google Scholar]
- 68.Sapp V, Gaffney L, EauClaire SF, Matthews RP. Fructose leads to hepatic steatosis in Zebrafish that is reversed by mechanistic target of Rapamycin (mTOR) inhibition. Hepatology. 2014;60:1581–1592. doi: 10.1002/hep.27284. [DOI] [PubMed] [Google Scholar]
- 69.Yang J, Liu X, Yuan X, Wang Z. MiR-99b promotes metastasis of hepatocellular carcinoma through inhibition of claudin 11 expression and may serve as a prognostic marker. Oncol Rep. 2015;34:1415–23. doi: 10.3892/or.2015.4104. [DOI] [PubMed] [Google Scholar]
- 70.Gui J, Tian Y, Wen X, Zhang W, Zhang P, Gao J, et al. Serum microRNA characterization identifies miR-885-5p as a potential marker for detecting liver pathologies. Clin Sci (Lond) 2011;120:183–93. doi: 10.1042/CS20100297. [DOI] [PMC free article] [PubMed] [Google Scholar]
- 71.Wu ZS, Wu Q, Wang CQ, Wang XN, Huang J, Zhao JJ, et al. MiR-340 inhibition of breast cancer cell migration and invasion through targeting of oncoprotein c-Met. Cancer. 2011;117:2842–52. doi: 10.1002/cncr.25860. [DOI] [PubMed] [Google Scholar]
- 72.Fernandez S, Risolino M, Mandia N, Talotta F, Soini Y, Incoronato M, et al. MiR-340 inhibits tumor cell proliferation and induces apoptosis by targeting multiple negative regulators of p27 in non-small cell lung cancer. Oncogene. 2015;34:3240–50. doi: 10.1038/onc.2014.267. [DOI] [PMC free article] [PubMed] [Google Scholar]
- 73.Poenitzsch Strong AM, Setaluri V, Spiegelman VS. MicroRNA-340 as a modulator of RAS-RAF-MAPK signaling in melanoma. Arch Biochem Biophys. 2014;563:118–24. doi: 10.1016/j.abb.2014.07.012. [DOI] [PMC free article] [PubMed] [Google Scholar]
- 74.Zearo S, Kim E, Zhu Y, Zhao JT, Sidhu SB, Robinson BG, et al. MicroRNA-484 is more highly expressed in serum of early breast cancer patients compared to healthy volunteers. BMC Cancer. 2014;14:200. doi: 10.1186/1471-2407-14-200. [DOI] [PMC free article] [PubMed] [Google Scholar]
- 75.Sand M, Skrygan M, Sand D, Georgas D, Gambichler T, Hahn SA, et al. Comparative microarray analysis of microRNA expression profiles in primary cutaneous malignant melanoma, cutaneous malignant melanoma metastases, and benign melanocytic nevi. Cell Tissue Res. 2013;351:85–98. doi: 10.1007/s00441-012-1514-5. [DOI] [PubMed] [Google Scholar]
- 76.Haj-Ahmad TA, Abdalla MA, Haj-Ahmad Y. Potential Urinary Protein Biomarker Candidates for the Accurate Detection of Prostate Cancer among Benign Prostatic Hyperplasia Patients. J Cancer. 2014;5:103–14. doi: 10.7150/jca.6890. [DOI] [PMC free article] [PubMed] [Google Scholar]
- 77.Summerer I, Unger K, Braselmann H, Schuettrumpf L, Maihoefer C, Baumeister P, et al. Circulating microRNAs as prognostic therapy biomarkers in head and neck cancer patients. Br J Cancer. 2015;113:76–82. doi: 10.1038/bjc.2015.111. [DOI] [PMC free article] [PubMed] [Google Scholar]
- 78.Bryant RJ, Pawlowski T, Catto JW, Marsden G, Vessella RL, Rhees B, et al. Changes in circulating microRNA levels associated with prostate cancer. Br J Cancer. 2012;106:768–74. doi: 10.1038/bjc.2011.595. [DOI] [PMC free article] [PubMed] [Google Scholar]
- 79.Della Vittoria Scarpati G, Calura E, Di Marino M, Romualdi C, Beltrame L, Malapelle U, et al. Analysis of differential miRNA expression in primary tumor and stroma of colorectal cancer patients. Biomed Res Int. 2014;2014:840921. doi: 10.1155/2014/840921. [DOI] [PMC free article] [PubMed] [Google Scholar]
- 80.Liu SG, Qin XG, Zhao BS, Qi B, Yao WJ, Wang TY, et al. Differential expression of miRNAs in esophageal cancer tissue. Oncol Lett. 2013;5:1639–1642. doi: 10.3892/ol.2013.1251. [DOI] [PMC free article] [PubMed] [Google Scholar]
- 81.Li LZ, Zhang CZ, Liu LL, Yi C, Lu SX, Zhou X, et al. MiR-720 inhibits tumor invasion and migration in breast cancer by targeting TWIST1. Carcinogenesis. 2014;35:469–78. doi: 10.1093/carcin/bgt330. [DOI] [PubMed] [Google Scholar]
- 82.Wang X, Kuang Y, Shen X, Zhou H, Chen Y, Han Y, et al. Evaluation of miR-720 prognostic significance in patients with colorectal cancer. Tumour Biol. 2015;36:719–27. doi: 10.1007/s13277-014-2697-z. [DOI] [PubMed] [Google Scholar]
- 83.Wang G, Mao W, Zheng S, Ye J. Epidermal growth factor receptor-regulated miR-125a-5p – a metastatic inhibitor of lung cancer. FEBS J. 2009;276:5571–5578. doi: 10.1111/j.1742-4658.2009.07238.x. [DOI] [PMC free article] [PubMed] [Google Scholar]
- 84.Jiang L, Huang Q, Zhang S, Zhang Q, Chang J, Qiu X, et al. Hsa-miR-125a-3p and hsa-miR-125a-5p are downregulated in non-small cell lung cancer and have inverse effects on invasion and migration of lung cancer cells. BMC Cancer. 2010;10:318. doi: 10.1186/1471-2407-10-318. [DOI] [PMC free article] [PubMed] [Google Scholar]
- 85.Yang Y, Li X, Yang Q, Wang X, Zhou Y, Jiang T, et al. The role of microRNA in human lung squamous cell carcinoma. Cancer Genet Cytogen. 2010;200:127–133. doi: 10.1016/j.cancergencyto.2010.03.014. [DOI] [PubMed] [Google Scholar]
- 86.Nishida N, Mimori K, Fabbri M, Yokobori T, Sudo T, Tanaka F, et al. MicroRNA-125a-5p is an independent prognostic factor in gastric cancer and inhibits the proliferation of human gastric cancer cells in combination with Trastuzumab. Clin Cancer Res. 2011;17:2725–2733. doi: 10.1158/1078-0432.CCR-10-2132. [DOI] [PubMed] [Google Scholar]
- 87.Hsieh TH, Hsu CY, Tsai CF, Long CY, Chai CY, Hou MF, et al. MiR-125a-5p is a prognostic biomarker that targets HDAC4 to suppress breast tumorigenesis. Oncotarget. 2015;6:494–509. doi: 10.18632/oncotarget.2674. [DOI] [PMC free article] [PubMed] [Google Scholar]
- 88.Dettmer MS, Perren A, Moch H, Komminoth P, Nikiforov YE, Nikiforova MN. MicroRNA profile of poorly differentiated thyroid carcinomas-new diagnostic and prognostic insights. J Mol Endocrinol. 2014;52(2):181–189. doi: 10.1530/JME-13-0266. [DOI] [PMC free article] [PubMed] [Google Scholar]
- 89.Kim JK, Noh JH, Jung KH, Eun JW, Bae HJ, Kim MG, et al. Sirtuin7 oncogenic potential in human hepatocellular carcinoma and its regulation by the tumor suppressors MiR-125a-5p and MiR-125b. Hepatology. 2013;57:1055–1067. doi: 10.1002/hep.26101. [DOI] [PubMed] [Google Scholar]
- 90.Kiran S, Anwar T, Kiran M, Ramakrishna G. Sirtuin 7 in cell proliferation, stress and disease: rise of the Seventh Sirtuin! Cell Signal. 2015;27:673–682. doi: 10.1016/j.cellsig.2014.11.026. [DOI] [PubMed] [Google Scholar]
- 91.Hu Z, Shen WJ, Kraemer FB, Azhar S. MicroRNAs 125a and 455 repress lipoprotein-supported steroidogenesis by targeting scavenger receptor class B type I in steroidogenic cells. Mol Cell Biol. 2012;32:5035–5045. doi: 10.1128/MCB.01002-12. [DOI] [PMC free article] [PubMed] [Google Scholar]
- 92.Simionescu N, Niculescu LS, Sanda GM, Margina D, Sima AV. Analysis of circulating microRNAs that are specifically increased in hyperlipidemic and/or hyperglycemic sera. Mol Biol Rep. 2014;41:5765–5773. doi: 10.1007/s11033-014-3449-2. [DOI] [PubMed] [Google Scholar]
- 93.Zheng J, Zhou Z, Xu Z, Li G, Dong P, Chen Z, et al. Serum microRNA-125a-5p, a useful biomarker in liver diseases correlates with disease progression. Mol Med Rep. 2015;12(1):1584–1590. doi: 10.3892/mmr.2015.3546. [DOI] [PubMed] [Google Scholar]
- 94.Wang J, Li J, Shen J, Wang C, Yang L, Zhang X. MicroRNA-182 downregulates metastasis suppressor 1 and contributes to metastasis of hepatocellular carcinoma. BMC Cancer. 2012;12:227. doi: 10.1186/1471-2407-12-227. [DOI] [PMC free article] [PubMed] [Google Scholar]
- 95.Wang C, Ren R, Hu H, Tan C, Han M, et al. MiR-182 is up-regulated and targeting Cebpa in hepatocellular carcinoma. Chin J Cancer Res. 2014;26:17–29. doi: 10.3978/j.issn.1000-9604.2014.01.01. [DOI] [PMC free article] [PubMed] [Google Scholar]
- 96.Wang TH, Yeh CT, Ho JY, Ng KF, Chen TC. OncomiR miR-96 and miR-182 promote cell proliferation and invasion through targeting EphrinA5 in hepatocellular carcinoma. Mol Carcinog. 2015;8. [DOI] [PubMed]
- 97.Leung WK, He M, Chang AW, Law PT, Wong N. Wnt/beta-catenin activates miR-183/96/182 expression in hepatocellular carcinoma that promotes cell invasion. Cancer Lett. 2015;362(1):97–105. doi: 10.1016/j.canlet.2015.03.023. [DOI] [PubMed] [Google Scholar]
- 98.Leti F, Malenica I, Doshi M, Courtright A, Van Keuren-Jensen K, Legendre C, et al. High-throughput sequencing reveals altered expression of hepatic microRNAs in nonalcoholic fatty liver disease-related fibrosis. Transl Res. 2015;166:304–14. doi: 10.1016/j.trsl.2015.04.014. [DOI] [PMC free article] [PubMed] [Google Scholar]