Abstract
A novel method is reported for simultaneous registration of location (axial direction) and orientation (circumferential direction) of two intravascular ultrasound (IVUS) pullbacks of the same vessel taken at different times. Monitoring plaque progression or regression (e.g., during lipid treatment) is of high clinical relevance. Our method uses a 3D graph optimization approach, in which the cost function jointly reflects similarity of plaque morphology and plaque/perivascular image appearance. Graph arcs incorporate prior information about temporal correspondence of the two IVUS sequences and limited angular twisting between consecutive IVUS images. Additionally, our approach automatically identifies starting and ending frame pairs in the two IVUS pullbacks. Validation of our method was performed in 29 pairs of IVUS baseline/follow-up pullback sequences consisting of 8,622 IVUS image frames in total. In comparison to manual registration by three experts, the average location and orientation registration errors ranged from 0.72 mm to 0.79 mm and from 7.3° to 9.3°, respectively, all close to the inter-observer variability with no difference being statistically significant (p = NS). Rotation angles determined by our automated approach and expert observers showed high correlation (r2 of 0.97 to 0.98) and agreed closely (mutual bias between the automated method and expert observers ranged from −1.57° to 0.15°). Compared with state-of-the-art approaches, the new method offers lower errors in both location and orientation registration. Our method offers highly automated and accurate IVUS pullback registration and can be employed in IVUS-based studies of coronary disease progression, enabling more focal studies of coronary plaque development and transition of vulnerability.
Index Terms: Atherosclerosis, natural history, intravascular ultrasound, image registration, graph-based method
I. Introduction
When studying natural course of plaque development in human coronary arteries in vivo using intravascular ultrasound (IVUS), registration of axial location and circumferential orientation of each image frame in corresponding baseline and follow-up IVUS pullback data is of paramount importance if location-specific quantitative comparisons between the two timepoints are to be determined [1]–[5]. With large patient cohorts involved in baseline/follow-up studies (e.g., 506 patients in [4]) and large numbers of IVUS image frames for each pullback (e.g., 80–133 frames after ECG gating [3]), manual registration of location and orientation is an extremely tedious task and requires expert knowledge. As a result, current clinical baseline/follow-up studies are not utilizing all available information due to undetermined frame location/orientation correspondences. Consequently, studies of mechanical forces, morphology and composition of lesions are only examined in culprit locations or over long vessel segments and are typically circumferentially averaged [1]–[4], [6]. Such approaches limit our ability to develop better understanding of the focal baseline/follow-up associations since the coronary artery disease evolves frequently in a focal and eccentric manner [4], [7], [8].
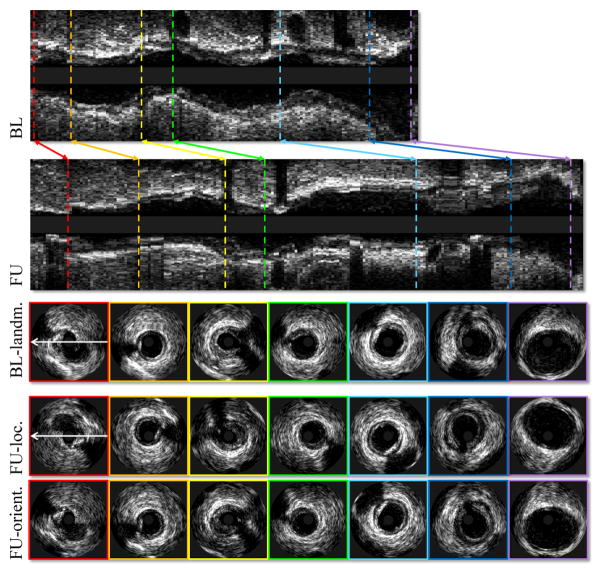
Automated location/orientation registration methods for IVUS pullbacks have attracted substantial research interest in recent years. Despite several methods reported [9]–[13], no perfect solution emerged delivering reliable registration results. The registration task is indeed very challenging [12], [13]. The challenges associated with motion artifacts, longitudinal oscillations, artifactual angular twisting, stuck/accelerated IVUS catheter during pullback acquisitions, vessel-morphologic changes due to plaque progression/regression at follow-up, etc. Fig. 1 provides an example of IVUS pullback registration with seven frame pairs manually registered. Clearly, in focal analyses of coronary artery disease progression [5], complete one-to-one correspondences between all baseline and follow-up frames would be preferred.
Fig. 1.
Example of IVUS pullback registration. From top to bottom: Baseline pullback in longitudinal view; follow-up pullback in longitudinal view; baseline landmark frames in cross-sectional view; corresponding IVUS frames; corresponding IVUS frames in proper orientation. In this case, the correspondences were determined visually by a human expert.
For automated registration of frame locations, the most intuitive approach is linear fitting (distance normalization) between two identified landmarks (e.g., side-branches) [9], [10]. This method works well when the transducer pullback exhibits a constant speed, which is not always the case in clinical settings. Non-rigid temporal alignment methods [11]–[13] (e.g., dynamic time warping, DTW [14]) treat the alignment task independently from the orientation registration task – consequently, the alignment results may not be optimal in the circumferential direction. In addition, these methods only rely on vessel morphologic features (area or shape) or plaque components, which may change for a long-term follow-up as a result of plaque progression/regression. For automated registration of orientation, a cross-correlation based method (rotating each follow-up image locally [9]) and a Catmull-Rom spline based method (rotating all the follow-up images globally [10]) have been reported. These two approaches achieve sub-optimal rotation results for two already location-aligned IVUS image sequence. In addition, the former method depends on Virtual Histology (VH)-IVUS defined plaque constituents and needs manual interaction to determine the rotational registration angle. The latter method suffers from artifactual angular twisting between consecutive image frames.
More generally, in the fields of computer vision and medical imaging, the problem of spatio-temporal registration/alignment of image sequences has been investigated for several years. Related work mainly followed two lines of approaches, including feature-based approaches [15]–[17] appropriate when the appearance varies from sequence to sequence, and direct approaches [15], [17]–[20] that fit similar intensities between sequences. The spatio-temporal registration/alignment algorithms use a particular transform to achieve optimality, typically based on gradient descent [15], [18], Powell methods [17], [20] or dynamic programming [21].
Compared with previous IVUS pullback location/orientation registration methods that treat the registration of location and orientation as separate tasks, we propose a novel joint spatio-temporal approach for IVUS pullback registration. By combining these two aspects in one global optimization task of finding an optimal path in a 3D graph, the location and orientation are registered simultaneously. To increase the robustness to the changes of vessel morphologic features, our method combines advantages from feature-based and direct approaches by incorporating plaque thickness and plaque/perivascular pixel similarities which provides more robust correspondence in two time points. To ensure geometrically feasible registration, graph arcs incorporate prior information about baseline–follow-up correspondences of the two IVUS sequences as well as information about limited-range angular twisting between consecutive IVUS image frames. To initialize the registration procedure, global and local similarities of two IVUS pullbacks are extracted from the 3D graph to automatically identify the most proximal and most distal image pair correspondences. To the extent of our knowledge, our approach is the first in the literature to simultaneously establish temporal (location) and spatial (orientation) correspondences between two different image sequences of two similar dynamic scenes by using a graph-based method, which has been traditionally used in image segmentation to detect boundaries or surfaces [22]–[26] or in deformable image registration to obtain the displacement field [27]–[29]. Partial results of this work have been reported in [30]. The current study provides more sophisticated methodology including regularization graph arcs, concise cost function, and automated model initialization, as well as a more comprehensive evaluation in a larger patient population.
Our system registers image sequences in a highly automated fashion as long as sufficiently accurate lumen and external elastic lamina (EEL) segmentations are available for all frames of both image sequences. This means that there is no need to provide a variety of manually obtained guiding information, such as branch locations/orientations [9]–[12], plaque characterization [9], [11], [12], matching anatomic landmarks [9], [10], and co-registration angles [9]. IVUS segmentation suitable for further analysis is invariably required for quantitative IVUS-based studies of coronary atherosclerosis [1]–[6], [8], [31], [32].
II. Methods
A. 3D Graph Construction
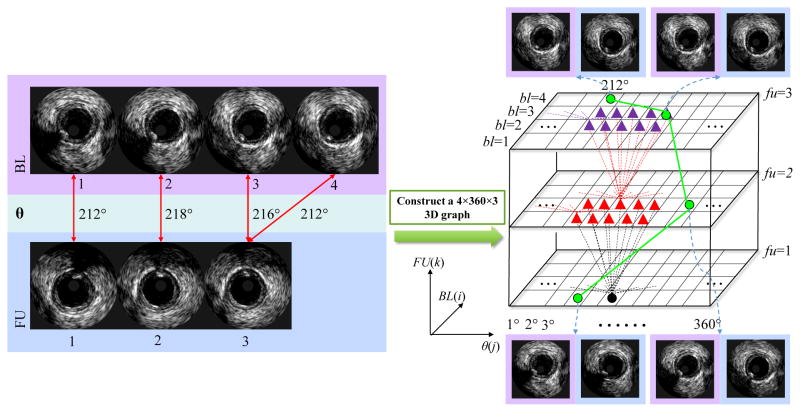
Given a pair of baseline and follow-up IVUS pullbacks, a 3D directed graph is constructed and searched for the optimal path (Fig. 2). In the 3D graph, each node represents the possible location and orientation correspondences of a baseline and a follow-up image frame pair. For example, the uppermost green graph node with coordinates (bl = 4, θ = 212°, fu = 3) in Fig. 2 represents correspondence of a follow-up frame #3 with 212° rotation with a baseline frame #4. The complete registration is defined by a sequence of nodes, which for each (bl, θ, fu) coordinate triplet forms a path in the 3D graph defining a possible location and orientation correspondence of baseline and follow-up image frames. Costs assigned to each node in the 3D graph reflect similarities of IVUS image data appearance and plaque morphology between the baseline and follow-up. An optimal path is defined as the path with the lowest global cost, which in an overall sense defines the frame-to-frame location and orientation registration of two image sequences. Clearly, such a registration is optimal with respect to the employed cost function.
Fig. 2.
Construction of a 3D graph used for solving the registration problem. This illustrative example assumes a baseline pullback (4 frames) and a follow-up pullback (3 frames). Green lines depict the optimal path through the graph determining the registration solution.
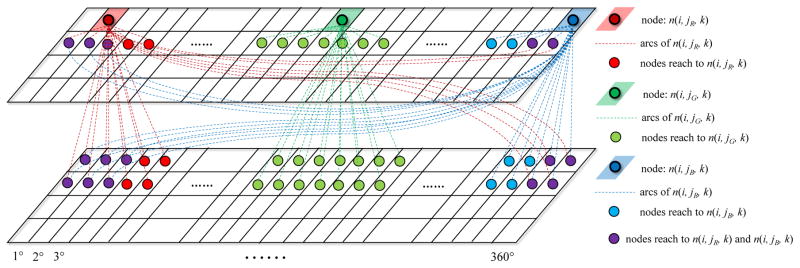
To calculate the lowest cost path, a dynamic programming algorithm is employed [21], [33]. A three-dimensional cumulative cost matrix C is computed according to node costs c(i, j, k) (bl = i, θ = j°, fu = k, see Section II-B for details) and node connections. The design of the node connections assumes limited angular twisting between consecutive image pairs [9], [34]. In each stage of the dynamic programming, the best one of the N = 3 × (2 × θtwist + 1) possible preceding nodes is selected, where θtwist is the rotational constraint of angular frame-to-frame twisting. The node connection diagram is visualized in Fig. 3. Nodes at any location (e.g., the red, green, or blue shaded nodes in Fig. 3) in the 3D graph, can be reached from any nodes in the other three rows (nodes connected by red, green, or blue arcs in Fig. 3), which potentially correspond to preceding baseline/follow-up frame pairs. As a result, each element C(i, j, k) (bl = i, θ = j°, fu = k) in the matrix C is computed as
Fig. 3.
Node connections for three different graph locations are shown as red, green, and blue dashed lines. This illustrative example assumes θtwist = 3°. Note that the graph node connections seamlessly connect nodes at any location, including connections across the graph boundaries.
| (1) |
where i is the i-th baseline image, j is the rotation angle of the k-th follow-up image, Δθ∈{−θtwist, …, θtwist}. Note that when j + Δθ≤ 0 and j + Δθ > 360, the connections will link to 360 + j + Δθ and j + Δθ − 360, respectively, shown as the connections to purple nodes in Fig. 3. fp(Δθ) is the smoothness penalty function for different angular twisting Δθ. The angular twisting between consecutive IVUS images depends on the geometrical vessel morphology and vessel movement in the 4D case. It can be analytically determined using fusion with X-ray angiography [34]. Under ideal circumstances, such twisting should be identical between the two pullbacks and thus their differences should be zero. While this cannot be assured in clinical setting when artificial catheter movements may add an unpredictable component, the relative frame-to-frame differences should be small but they are cumulative. Therefore, we increasingly penalize twisting Δθ in either direction as follows
| (2) |
where ω controls the penalty weight. The elements C(i, j, 1) in the first layer (follow-up frame 1) and the elements C(1, j, k) in the first rows of each layer (baseline frame 1) are initialized as
| (3) |
| (4) |
The initialization condition is set as
| (5) |
As is typical for dynamic programming, the optimal path through the 3D matrix C is determined by backtracking from element min(C(I, j, K)) to C(1, j, 1) by following the minimum values of the neighboring elements, where I and K represent the last frames in baseline and follow-up, respectively.
B. Cost Function Design
Design of node-associated costs is always problem-specific. For IVUS pullback registration, Each cost c(i, j, k) reflects the similarity between the i-th baseline image and the k-th follow-up image with j-degree rotation. The similarity is designed as a combination of feature-based and direct approaches based on three terms: 1) perivascular tissue, including pixels outside of the EEL border (the green region in Fig. 4(c)); 2) plaque appearance, including the pixels between the EEL and lumen borders (the orange region in Fig. 4(c)); and 3) plaque thickness, defined as the distance between lumen and EEL borders at 360 circumferential wedges centered at the lumen centroid. Such a cost function design is depicted in Fig. 4 and formulated as
Fig. 4.
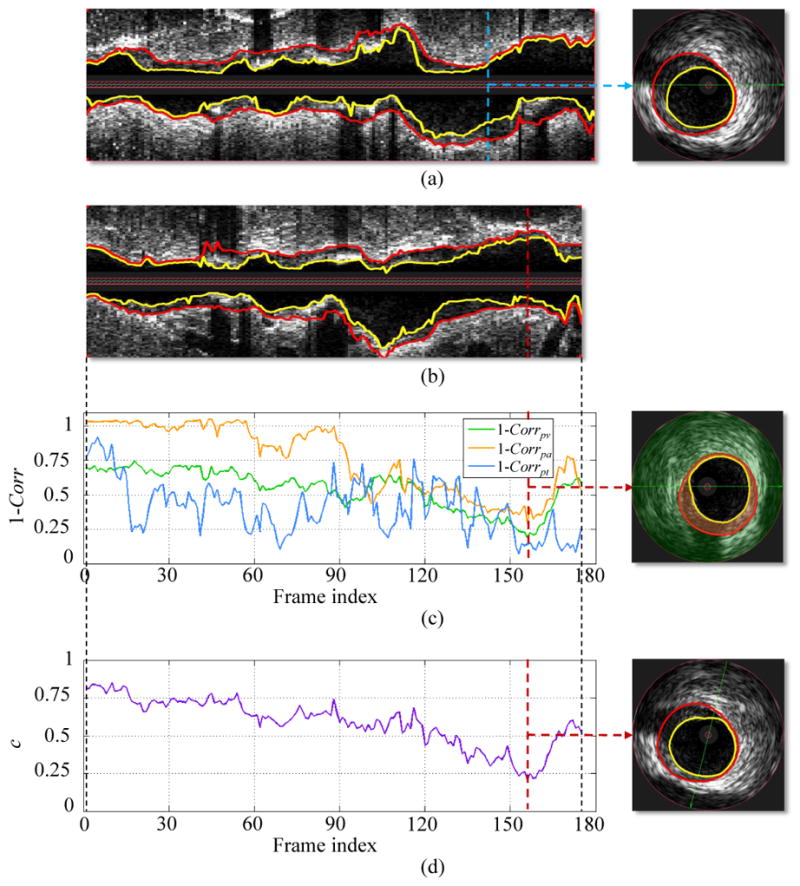
Cost function designed for IVUS pullback registration. (a) Longitudinal and cross-sectional views of a baseline IVUS pullback with expert-defined segmentation (lumen - yellow, EEL - red). (b) Longitudinal view of corresponding follow-up IVUS pullback. (c) Cost function of 1 − Corrpv, 1 − Corrpa, and 1 − Corrpt. Costs are calculated by comparing the IVUS image frame given in panel (a) with all follow-up IVUS image frames in panel (b). Each value on a curve corresponds to the minimal value with respect to all possible rotations of a follow-up frame. In the cross-sectional view, the perivascular tissue and plaque are overlaid with green and orange colors, respectively. (d) Cost function c considering all follow-up images.
| (6) |
Calculation of Corr(i, j, k) is based on the normalized cross-correlation approach as detailed in [9], α, β, and γ are the weights for the perivascular tissue, plaque appearance, and plaque thickness terms, respectively, satisfying α + β + γ = 1. In [9], the calculation of Corrpa relies on the VH-derived indexed values to describe plaque component similarity. In our implementation, IVUS image pixel intensities are directly used to reveal the plaque appearance similarity while avoiding the dependency on VH. Since the Corrpt used in [9] cannot discriminate between two similar plaque shapes with different sizes, a size factor was added to represent differences of mean plaque thickness between baseline and follow-up:
| (7) |
where j is the rotation angle of a follow-up image being registered, and are average plaque thickness values of the i-th baseline and the k-th follow-up images, respectively, σfi and σgkare their respective standard deviations, n is the number of plaque thickness values which were set to 360, and rd is the plaque thickness index calculated in the radial directions. Note that when computing these Corr values, coinciding lumen centroids for the baseline and rotated follow-up image pairs are provided by our automated segmentation and operator-guided refinement algorithm [26]. This cost function design follows the rules for characteristic calcifications, perivascular landmarks, and plaque shape, which cardiologists use to match baseline and follow-up IVUS pullbacks [31].
C. Identification of Starting and Ending Frame Pairs
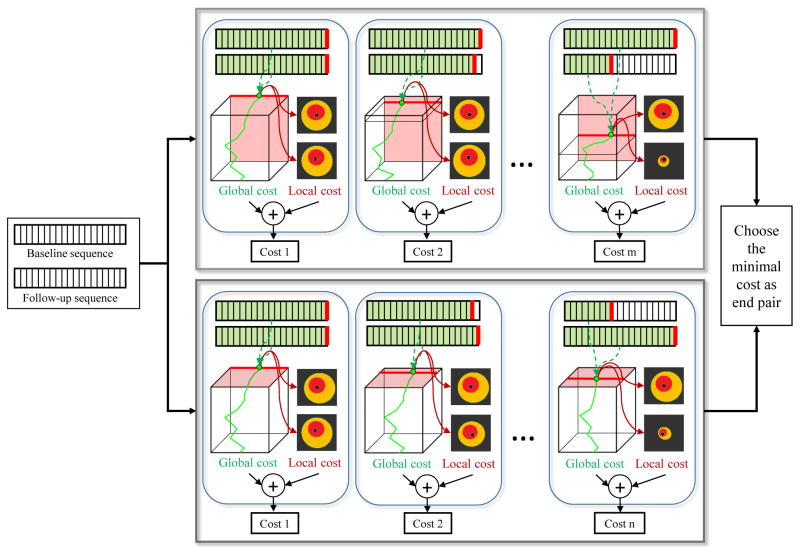
For the baseline and follow-up IVUS acquisition in the same vessel, the starting and ending positions of pullbacks are not always the same. Therefore, before applying the proposed registration method, we should identify the most proximal and most distal corresponding image frame pairs. Our strategy combines global and local costs embedded in the 3D graph-based framework. Fig. 5 demonstrates identification of the ending frame pair, which is determined by the following equation:
| (8) |
where Gc(i, j, k) is the global cost. Gc(i, j, k) corresponds to mean cost of the optimal path (green solid line in Fig. 5), which backtracks from element (bli, θj, fuk) (green point in Fig. 5) in the 3D cumulative cost matrix C (cube in Fig. 5), and is defined as:
| (9) |
Fig. 5.
Schema of the proposed global and local method for identification of ending pair. Given a baseline and follow-up IVUS sequence pair, our method constructs a 3D graph and follows two tracks: In the first track, the last baseline frame is fixed and the follow-up frame iteratively shifted by the minimal required length of baseline–follow-up overlap (25 mm in our case). In each iteration, global and local costs embedded in the 3D graph are extracted and combined. By fixing the last follow-up frame and iteratively shifting the baseline frame, another series of costs are obtained in the second track. The frame pair providing minimal cost is chosen as the ending pair.
C(i, j, k) is computed according to Eq. (1); ne is the number of elements which form the optimal path. Such a design of the global cost represents the average similarity between two registered IVUS image sequences with (i, k) as the ending frame pair. Lc(i, j, k) is the local cost, associated with the similarity between the i-th image in baseline and the k-th image with rotation angle θj in follow-up, as defined in Eq. (6). I and K represent the last frames in baseline and follow-up, respectively. After the ending pair is identified, both the 3D cumulative cost matrix C and the cost matrix c are inverted and the same global and local approach is used to identify the starting pair with a searching range constrained by the minimal required lengths of the baseline/follow-up pullback overlap (25 mm overlap required in our studies).
Subsequently, the aforementioned selection order is inverted by identifying the starting pair first followed by obtaining the ending pair. This, two start/end pairs are available and the final solution is identified by choosing the lower total cost (global and local) from these two solutions. The 3D graph is subsequently constructed and the optimal path is determined, simultaneously registering the IVUS pullback with respect to location and orientation.
D. Post-processing
In clinical data, the pullback lengths (number of frames) of the imaged vessel segment at baseline and follow-up may differ dramatically. Reasons come from many aspects, including primary heart rate, different segment covered, resistance to transducer withdrawal, anatomic considerations, problems with the pullback device, etc. [32]. As a result, our registration of baseline and follow-up may generate one-to-many or many-to-one correspondences. To achieve one-to-one correspondence among baseline and follow-up, the registered frame pair with the minimal cost (Eq. (6)) is selected and used to define the overall correspondence of the two pullback IVUS frame pairs.
III. Experimental Methods
A. Patient Data
The performance of the proposed method was evaluated in 29 serial IVUS-VH studies of patients with stable coronary artery disease enrolled in the PREDICT study (ClinicalTrials.gov Identifier: NCT01773512) at the Charles University Hospital, Prague. The PREDICT study aims at prediction of extent and risk profile of coronary atherosclerosis and their changes during lipid-lowering therapy based on non-invasive techniques. From 33 patients in total, 29 patients satisfied inclusion criteria [6], [32] and were selected for this baseline/follow-up registration study.
IVUS imaging was performed in the standard fashion using the IVUS phased-array probe (Eagle Eye 20 MHz 2,9F monorail, Volcano Corporation, Rancho Cordova, California), IVUS console, Gold standard software, and motorized pullback at 0.5mm/s (research pullback device, model R-l00, Volcano Corporation, Rancho Cordova, California). After 8–14 months patients underwent repeat cardiac catheterization and IVUS of the same coronary artery.
The Volcano IVUS imaging system provided EKG R-wave gated IVUS image sequences with 8,622 gated frames in total (72 to 235 frames per pullback), 0.27 to 0.67 mm distances between adjacent frames depending on the heart rate, and 500 × 500 pixels per image frame. Both baseline and follow-up pullbacks were at least 30 mm long, with at least 25 mm long mutual overlap.
B. Independent Standard
Three experts defined the ground truth for baseline/follow-up IVUS pullback registration. The experts were blinded to the results of the computer registration and had the following levels of expertise:
Expert 1 (TK): Cardiologist with 16 years clinical experience in coronary imaging (mainly IVUS).
Expert 2 (AW): IVUS analyst with 17 years of IVUS experience.
Expert 3 (ZC): IVUS analyst with 4 years of IVUS experience.
For each frame of each IVUS pullback, luminal and EEL surfaces were automatically segmented using our fully three-dimensional LOGISMOS graph-based approach [23], [24], which shows excellent performance compared to the state-of-the-art algorithms on a public available IVUS image database [35]. Automatically determined surfaces were reviewed and algorithmically refined by an expert cardiologist using our previously reported computer-aided refinement approach [26]. Examples of the final segmentation can be seen in Fig. 4.
To evaluate the performance of the automated registration, 262 frame pairs with well-identifiable landmarks (baseline ↔ follow-up) were determined by Expert 1. The 262 follow-up frames were further rotated by Expert 1 to make their circumferential positions coincide with their corresponding baseline frames, where 5° steps were used. Expert 1 devoted about 50 minutes to each baseline/follow-up registration; 24 hours of expert effort were needed to define the ground truth in all 29 baseline/follow-up pairs. The remaining two experts (Experts 2 and 3) were provided the 262 landmarks in baseline pullbacks and were asked to find corresponding follow-up frames and properly rotate them to determine inter-observer variability of manual registration.
C. Registration Accuracy and Statistical Analysis
The registration results were first qualitatively evaluated by visually checking for gross inaccuracies. To quantify the success rate of the locational registration, distances (mm) between the expert-identified follow-up frames and the automatically registered frames were used as the performance measure (Eq. (10)). To quantitatively evaluate the orientation registration performance, rotational registration angles of corresponding frames were compared with those determined by the expert (Eq. (11)). All results are reported as the mean error ± the standard deviation.
| (10) |
| (11) |
where Lx and Ox are the automatically registered location and orientation, and Ly and Oy denote the independent standard.
For statistical analysis, differences between manual and computer registered locations were determined using a Wilcoxon signed-ranks test [36] to reflect non-normal distribution, while angular differences between orientations were determined using a paired Students t-test, both with p < 0.05 deemed statistically significant. Linear regression analysis [37] and Bland-Altman plots [38] were used to compare the rotation angle differences. To reveal the true angular difference between two rotations, angular values were first transformed to the range [−180°, 360°].
D. Comparison with Other Methods
Performance of our method was compared to the inter-observer variability of manually-performed registration, the work of Timmins et al. [9], our earlier-reported side-branch guided (SBG) approach [10], the DTW framework [14] with area-based costs [11], [12], and DTW framework [14] with correlation-based costs (Eq. (6)). For the method in [9], the location registration is actually the same as SBG (piecewise distance normalization) [10], the manual co-registration angle was derived from the first corresponding side-branch pairs obtained in [10]. Other parameters were set as in [9]. In the DTW framework, due to the sliding window approach [11], the method is not designed to register pullbacks of different length; the extremes of path search strategy [12] did not work well on our data set in a preliminary experiment (e.g., failed in 8 out of the 29 pullback pairs). Therefore, we used our automatically-determined start/end frame pairs to initialize the DTW framework for a relatively fair comparison of the registration performance. For DTW framework with area-based costs, the first four features used in [11], [12] were employed and the areas of calcified and fibro-lipidic plaque were derived from VH in our implementation, and the directional penalty [11], [12] was set as 0.05 by optimizing the accuracy using Expert 1 landmark frame registration as the ground truth. For DTW framework with correlation-based costs, we first optimized the orientation for each frame pair followed by locational registration in the DTW framework for which the orientation was used as a single fixed cost.
E. Computational Resources
The proposed system was tested on an HP Z400 workstation with 3.33 GHz Xeon W3680 CPU, 24 GB of RAM, running Windows 7 SP1 Enterprise. The mean execution times are reported in terms of the complete registration process, the identification of starting/ending frame pairs, and the frame-by-frame registration, respectively.
F. Registration Method Parameters
According to our earlier studies, the node connection parameters θtwist used for the registration graph construction need not exceed 15° [34]. Others reported that the average rotation between consecutive EKG-gated IVUS image frames is 5.74°±0.15° [9]. Generally, the registration solution is more constrained for lower values of θtwist and thus less computationally demanding. Here, θtwist = 6° was experimentally set as a trade-off between accuracy and efficiency and its exact value was not critical for the method’s performance. The smoothness penalty weight ω was set as 0.1. Considering that perivascular landmarks (side-branch, small vein, myocardium proximity, etc.) can provide more consistent correspondence than plaque appearance and plaque thickness between baseline/follow-up, α was set to 0.5 to emphasize the importance of the perivascular tissue term; both β and γ were set to 0.25 to let the plaque appearance term and plaque thickness term contribute equally.
IV. Results
A. Qualitative Assessment of Registration Performance
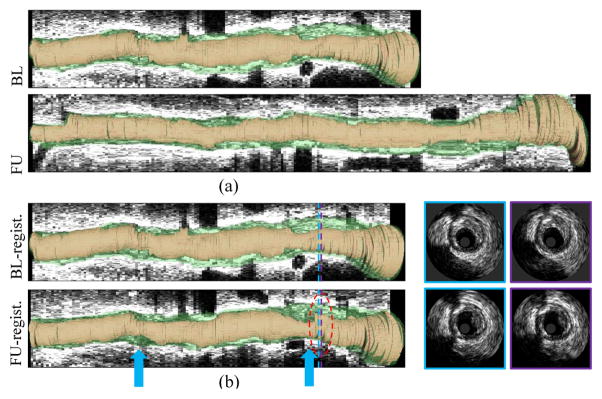
Fig. 6 shows the automated registration of the pullback pairs shown in Fig. 1. Prior to registration, the reconstructed baseline and follow-up longitudinal views looked quite different (Fig. 1). After registration (Fig. 6), both the longitudinal and cross-sectional views show good correspondences between baseline and follow-up. The automatically (fourth row in Fig. 6) and manually (fifth row in Fig. 1) registered follow-up cross-sectional images are visually comparable in both appearance and orientation. Fig. 7 shows a 3D reconstruction of the lumen and EEL surfaces before and after automated registration. It can be visually appreciated that two segments become narrower (blue arrows in Fig. 7) and that plaque rupture is shown at follow-up (red circle in Fig. 7).
Fig. 6.
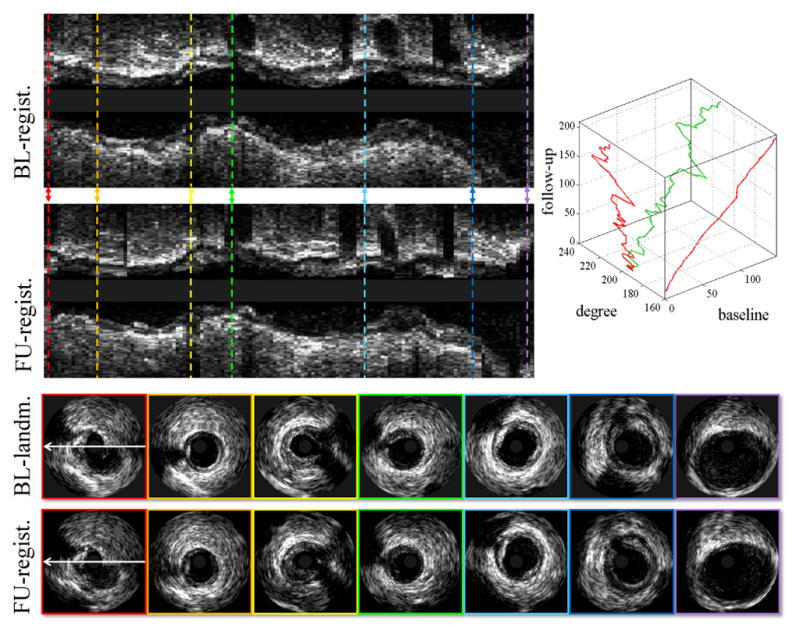
Automated registration of pullback pair from Fig. 1. From the first to the fourth row: Registered baseline pullback; registered follow-up pullback; baseline landmarks selected by Expert 1; registration results obtained by our automated method. Optimal path (green path) in 3D (bl, θ, fu) space and its projections (red paths) on 2D (bl, fu) plane and 2D (θ, fu) plane generated by our method for this example are shown in the upper-right panel.
Fig. 7.
Three-dimensional visualization of IVUS pullback registration. (a) Original pullback pair. (b) Automatically registered pullback pair. Lumen shown in orange, EEL surface in green. Notice that two segments become narrower (blue arrows) and that plaque rupture is visible at follow-up (red circle, in which two registered IVUS image pairs are shown on the right side).
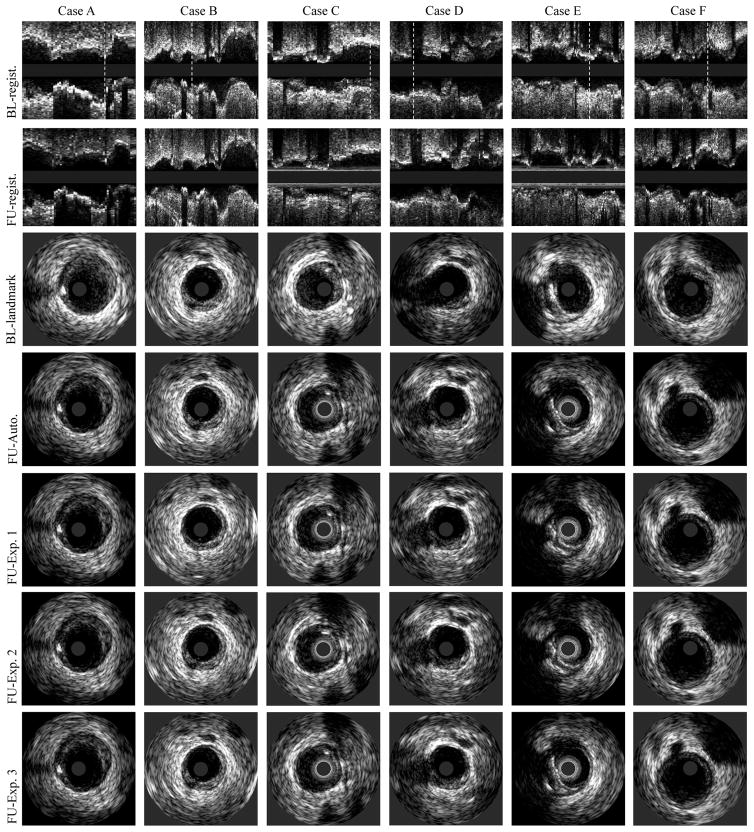
Fig. 8 shows six examples of registration results obtained by a) our new method and b) three experts. When visually comparing our results with expert registration, good agreement was reached across a variety of image-induced challenges and morphology changes (note matching of the following clues in Fig. 8): side-branches (cases B, D, E, F), shadows (cases A, E), big and small calcifications (cases E, A, C), small veins (cases B, F), and myocardium proximity (cases C, F).
Fig. 8.
IVUS pullback registration. From the first row to the seventh row: our baseline/follow-up registration results in longitudinal views, baseline landmarks selected by Expert 1, corresponding follow-up registration obtained by our method, Expert 1, Expert 2, and Expert 3. White dotted lines indicate positions of the landmark locations shown in cross-sectional views.
B. Quantitative Assessment of Registration Performance
Table I shows the location and orientation registration errors of our 3D graph based method and the inter-observer variability. Compared to three expert registration results, the reported 3D-graph-based method achieved mean distance errors ranging from 0.72 mm to 0.79 mm with the mean angle errors ranging from 7.3° to 9.3°. There were no significant differences between our method and experts in location and orientation registration (p=NS). The maximal distance and angle errors generated by our method were 8.4 mm and 147°, respectively, comparable to the maximum disagreements between experts. For the 262 baseline landmarks selected by Expert 1, our method failed to determine eight corresponding follow-up frames; 7 of these were the most distal landmarks from 7 patients and 1 was the most proximal landmark. Similarly, Expert 2 failed to identify three of the most distal landmarks in three patients, stating that the corresponding landmarks were beyond the coverage of the follow-up pullbacks.
TABLE I.
Distance and rotational registration errors of inter-observer variability and our method. LM: landmarks. No differences were statistically significant
| User | ΔL(mm) | Max ΔL(mm) | ΔO(°) | Max ΔO(°) | No. LM |
|---|---|---|---|---|---|
| Exp. 1 vs. Exp. 2 | 0.67 ± 1.28 | 10.73 | 9.47±16.53 | 130 | 259 |
| Exp. 1 vs. Exp. 3 | 0.62 ± 0.95 | 6.00 | 9.17±15.39 | 120 | 262 |
| Exp. 2 vs. Exp. 3 | 0.66 ± 1.31 | 10.73 | 6.53±14.37 | 175 | 259 |
| 3D graph vs. Exp. 1 | 0.75 ± 1.22 | 8.40 | 9.27±13.52 | 103 | 254 |
| 3D graph vs. Exp. 2 | 0.79 ± 1.17 | 7.93 | 7.33±10.67 | 125 | 253 |
| 3D graph vs. Exp. 3 | 0.72 ± 1.16 | 8.40 | 7.70±11.51 | 147 | 254 |
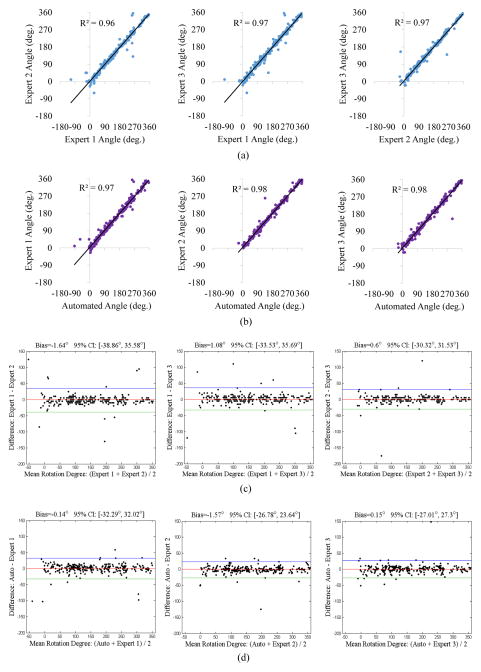
For statistical analysis of orientation registration, linear regression analysis (Fig. 9(a)–(b)) demonstrated that the automatically registered frame orientations exhibited high correlation with expert registrations (R2 ranging from 0.97 to 0.98), comparable to inter-observer variability. The Bland-Altman plots (Fig. 9(c)–(d)) revealed that the rotation angles determined by our method and experts agreed well with bias values ranging from −1.57° to 0.15°, comparable to inter-observer variability ranging from −1.64° to 1.08°.
Fig. 9.
Linear regression analysis and Bland-Altman plots comparing frame orientation differences among experts (a,c), and between our method and experts (b,d).
Table II summarizes the location and orientation registration errors of Timmins method [9], SBG approach [10], DTW framework with area-based costs [11], [12], DTW framework with correlation-based costs, and of our new method. The proposed 3D graph based method achieved lower errors in both the location and orientation registration.
TABLE II.
Comparison of location and orientation registration errors of the Timmins method [9], SBG [10], DTW-area [11], [12], DTW-correlation (which uses the DTW framework of [14] with our correlation-based costs), and our 3D graph method. Note that our 3D graph method shows consistently lower registration errors. Note also that DTW-area [11], [12] was not designed for orientation registration.
| Standard | Timmins method [9] | SBG [10] | DTW-area [11], [12] | DTW-correlation | 3D graph | |||||
|---|---|---|---|---|---|---|---|---|---|---|
| ΔL(mm) | ΔO(°) | ΔL(mm) | ΔO(°) | ΔL(mm) | ΔO(°) | ΔL(mm) | ΔO(°) | ΔL(mm) | ΔO(°) | |
| Exp. 1 | 1.35±1.55 | 19.40±23.81 | 1.35±1.55 | 11.70±15.42 | 1.23±1.62 | - | 0.79±1.19 | 18.57±35.26 | 0.75±1.22 | 9.27±13.52 |
| Exp. 2 | 1.35±1.76 | 18.15±22.95 | 1.35±1.76 | 11.00±14.39 | 1.13±1.56 | - | 0.82±1.18 | 17.53±36.05 | 0.79±1.17 | 7.33±10.67 |
| Exp. 3 | 1.19±1.49 | 18.32±22.95 | 1.19±1.49 | 10.90±14.11 | 1.14±1.57 | - | 0.73±1.08 | 17.32±34.72 | 0.72±1.16 | 7.70±11.51 |
The mean execution time for the complete automated registration process was 3.2 ± 1.5 minutes per pullback pair. Identification of starting/ending frame pairs and performing complete 3D frame-by-frame registration required 2.3 ± 1.1 and 0.9 ± 0.4 minutes per pullback pair, respectively. While the computation of the cost function was time consuming (about 6–24 hours per patient, depending on the length of the respective IVUS pullback) and was computed in parallel on a computer cluster in about two days for all 29 patients, such training is only performed once and its computational demands do not affect the analysis speed.
V. Discussion
A. Importance of Automated IVUS Pullback Registration
As mentioned in Section I, current clinical studies of the natural course of plaque progression and regression rely on tedious, time-consuming, and subjective registration of location and orientation of longitudinal IVUS pullbacks. We have reported in Section III-B that registering IVUS baseline and follow-up IVUS pullbacks by an expert cardiologist (Expert 1) required 50 minutes per pullback pair – and only landmark-frame pairs were registered. Clearly, it is extremely time-consuming to establish frame level correspondence manually, and almost impossible when the patient cohort is large. Given the variety of challenges presented in IVUS pullback data [12], [13], [32], manual registration requires relatively high-level of experience and expert interpretation. It is also subject to considerable intra- and inter-observer variability. As a result, current clinical studies mostly rely on comparisons of integral features determined over relatively long vessel segments and thus combining large tissue areas. This regional rather than local approach hinders our ability to achieve better understanding of local plaque progression and local plaque vulnerability [5], [9].
B. Comparison with Other Methods
To automatically register frame location, some of the previous methods simply normalize the frame distances between manually detected side-branches [9], [10]. As demonstrated in Table II, the distance registration errors of this type of method are relatively large mainly because of the irregularities in catheter speed in IVUS acquisitions. Notably, such errors were observed even when many frames with branches (already manually identified in these approaches [9], [10]) were used as landmarks. Other methods only make use of morphology-based features [11]–[13] such as vessel/plaque area and shape context, thus overlooking important image-based features such as plaque and perivascular tissue appearance, which demonstrated excellent performance in terms of location registration errors (see ΔL of “DTW-correlation” in Table II). Therefore, the registration results of such approaches [11], [12] are not robust enough to properly register follow-up frames with similar vessel areas or shape properties. Other reasons causing the DTW framework with area-based costs [11], [12] not to be sufficiently accurate on our data are likely attributed to: 1) portion of patient data used in [11], [12] were repeatedly acquired shortly after each other and at the same disease and intervention stages, thus without any morphologic changes. In contrast, our follow-up data were acquired after 1 year with possible plaque progression-induced changes of morphology; 2) although some data used in [11], [12] suffered from significant morphologic changes, only side-branch locations were used as landmarks in their evaluation; 3) in our data, the numbers of IVUS frames in baseline and follow-up sequence pairs are frequently quite different, which makes the registration task more challenging.
To automatically register frame orientation, previous solutions [9], [10] ignore the problem that appears when a stuck/accelerated IVUS pullback occurs during acquisition. Additionally, for methods relying on local optimization [9], if there is an incorrect locationally registered frame pair, the rotation angle may also be incorrect and using this incorrect angle to constrain consecutive image pair orientation registration will affect the result (refer to the relatively large ΔO of [9] in Table II). Furthermore, due to the lack of prior information about limited angular twisting, the DTW framework with correlation-based costs approach exhibited large orientation registration errors (refer to ΔO of “DTW-correlation” in Table II). In our globally optimal approach, the final orientation registration was not affected in this way.
C. Advantages of the Reported Method
An important advantage of the reported method is that it simultaneously registers locations and orientations of all frames in the two longitudinal IVUS pullbacks in a geometrically feasible manner. Subsequently, it is more robust than methods which register location or orientation separately. Furthermore, our system is designed to be highly automated as long as segmentation of lumen and EEL borders is available for all frames of the two image sequences. While our method was only tested on IVUS data, it may be easily extended to other intravascular imaging modalities solely by modifications of the objective function, including intracororonary optical coherence tomography (OCT) [39] or OCT-IVUS data co-registration [40] [41].
The contributions of our new method can be summarized as follows.
To the best of our knowledge, this is the first approach to simultaneously establish frame-to-frame correspondence in location and orientation between two image sequences using a 3D graph-based method.
The proposed 3D graph structure allows incorporating rotation-related features and catheter twisting prior for registration, and the designed clinical knowledge-based cost function is robust to vessel morphologic changes.
The reported method can automatically identify the starting and ending frame pairs in two image sequences.
D. Limitations
Similar to most of previous IVUS pullback registration approaches, our method relies on the segmentation of lumen and EEL, which is used to determine plaque and perivascular regions and also provides a common lumen centroid for both the baseline and follow-up image pairs to calculate the correlation terms in Eq. (6). Inaccurate or ambiguous segmentation may result in incorrect final registration. Sensitivity of the registration to such segmentation inaccuracies need further evaluation in our future work. A potential solution for avoiding segmentation dependency may be to identify discriminative regions to measure the structural similarity between two images as used in video-volume registration for endoscopic 3D motion tracking [20]. Nevertheless, accurate IVUS segmentation is a common pre-requisite to any quantitative IVUS-based studies of coronary atherosclerosis and as such must always be accomplished regardless of the registration needs [1]–[6], [8], [31], [32].
Even though our proposed method outperforms previous methods especially in handling irregular catheter speeds and dealing with morphologic change, it may not perform well if the IVUS pullback include images with a pronounced frame-to-frame “jump,” in which a large number of image frames is missing in one of the paired pullbacks either due to gating issues or a sudden movement of the catheter (e.g., after being slowed down by local plaque’s resistance). A possible approach to solve this problem is to increase the node-connection distance during the graph construction. The trade-off, however, may be a loss of image sequence continuity. Alternatively, utilizing branch detection algorithms either automatically [42] or semi-automatically [43] may help constrain the range of frames considered for registration.
Another limitation of our method is that the computation burden of cost function calculation may increase noticeably with increasing length of the registered IVUS sequences. Potentially, such a problem could be overcome by employing an acceleration algorithm [44]. However, integration of such a speed-up delivering solution is beyond the scope of this work and may be attempted in the future. Recently, we have developed an efficient, integrated, side-branch constrained framework that is not subject to length-dependent computational complexity increases [45].
VI. Conclusion
The presented results demonstrate that our automated 3D graph-based registration method outperforms recent semiautomated approaches and achieves registration accuracy closely approaching inter-observer variability. The presented 3D graph-based framework yields globally optimal registration of location and orientation of baseline and follow-up IVUS pullbacks, which is achieved in a single optimization step by using a 3D dynamic programming algorithm. By incorporating rotation-related features and catheter twisting prior in the graph structure, designing a comprehensive knowledge-based cost function, and extracting global and local graph information for identification of starting/ending image pairs, our work delivers highly automatic, accurate and robust IVUS pullback registration. The new method was tested in 29 in vivo IVUS pullback pairs from 29 patients. The experimental results yielded location and orientation registration errors that were close to the inter-observer variability. Our method has a potential to enable large-volume focal studies of natural course of plaque development in human coronary arteries in vivo.
Acknowledgments
This work was supported in part by the NIH grants R01HL063373, R01EB004640, and a grant LH12053 from the Ministry of Education, Youth and Sports of the Czech Republic.
The authors would like to thank the anonymous reviewers for their constructive suggestions, as well as Drs. Junjie Bai and Jui-Kai Wang for valuable suggestions regarding specifics of efficient graph optimization.
Contributor Information
Ling Zhang, Email: ling-zhang@uiowa.edu, Iowa Institute for Biomedical Imaging and the Department of Electrical & Computer Engineering, University of Iowa, Iowa City, IA 52242, USA.
Andreas Wahle, Iowa Institute for Biomedical Imaging and the Department of Electrical & Computer Engineering, University of Iowa, Iowa City, IA 52242, USA.
Zhi Chen, Iowa Institute for Biomedical Imaging and the Department of Electrical & Computer Engineering, University of Iowa, Iowa City, IA 52242, USA.
Li Zhang, Iowa Institute for Biomedical Imaging and the Department of Electrical & Computer Engineering, University of Iowa, Iowa City, IA 52242, USA.
Richard W. Downe, Iowa Institute for Biomedical Imaging and the Department of Electrical & Computer Engineering, University of Iowa, Iowa City, IA 52242, USA
Tomas Kovarnik, The 2nd Department of Internal Medicine of General University Hospital in Prague and Charles University, Prague, Czech Republic.
Milan Sonka, Email: milan-sonka@uiowa.edu, Iowa Institute for Biomedical Imaging and the Department of Electrical & Computer Engineering, University of Iowa, Iowa City, IA 52242, USA.
References
- 1.Stone GW, Maehara A, Lansky AJ, de Bruyne B, Cristea E, Mintz GS, Mehran R, McPherson J, Farhat N, Marso SP, et al. A prospective natural-history study of coronary atherosclerosis. New England Journal of Medicine. 2011;364(3):226–235. doi: 10.1056/NEJMoa1002358. [DOI] [PubMed] [Google Scholar]
- 2.Kubo T, Maehara A, Mintz GS, Doi H, Tsujita K, Choi SY, Katoh O, Nasu K, Koenig A, Pieper M, et al. The dynamic nature of coronary artery lesion morphology assessed by serial virtual histology intravascular ultrasound tissue characterization. Journal of the American College of Cardiology. 2010;55(15):1590–1597. doi: 10.1016/j.jacc.2009.07.078. [DOI] [PubMed] [Google Scholar]
- 3.Samady H, Eshtehardi P, McDaniel MC, Suo J, Dhawan SS, Maynard C, Timmins LH, Quyyumi AA, Giddens DP. Coronary artery wall shear stress is associated with progression and transformation of atherosclerotic plaque and arterial remodeling in patients with coronary artery disease. Circulation. 2011;124(7):779–788. doi: 10.1161/CIRCULATIONAHA.111.021824. [DOI] [PubMed] [Google Scholar]
- 4.Stone PH, Saito S, Takahashi S, Makita Y, Nakamura S, Kawasaki T, Takahashi A, Katsuki T, Nakamura S, Namiki A, et al. Prediction of progression of coronary artery disease and clinical outcomes using vascular profiling of endothelial shear stress and arterial plaque characteristics: the prediction study. Circulation. 2012;126(2):172–181. doi: 10.1161/CIRCULATIONAHA.112.096438. [DOI] [PubMed] [Google Scholar]
- 5.Timmins LH, Molony DS, Eshtehardi P, McDaniel MC, Oshinski JN, Samady H, Giddens DP. Focal association between wall shear stress and clinical coronary artery disease progression. Annals of Biomedical Engineering. 2014:1–13. doi: 10.1007/s10439-014-1155-9. [DOI] [PubMed] [Google Scholar]
- 6.Kovarnik T, Mintz GS, Skalicka H, Kral A, Horak J, Skulec R, Uhrova J, Martasek P, Downe RW, Wahle A, et al. Virtual histology evaluation of atherosclerosis regression during atorvastatin and ezetimibe administration. Circulation Journal. 2011;76(1):176–183. doi: 10.1253/circj.cj-11-0730. [DOI] [PubMed] [Google Scholar]
- 7.Asakura T, Karino T. Flow patterns and spatial distribution of atherosclerotic lesions in human coronary arteries. Circulation Research. 1990;66(4):1045–1066. doi: 10.1161/01.res.66.4.1045. [DOI] [PubMed] [Google Scholar]
- 8.Wahle A, Lopez JJ, Olszewski ME, Vigmostad SC, Chandran KB, Rossen JD, Sonka M. Plaque development, vessel curvature, and wall shear stress in coronary arteries assessed by X-ray angiography and intravascular ultrasound. Medical Image Analysis. 2006;10(4):615–631. doi: 10.1016/j.media.2006.03.002. [DOI] [PMC free article] [PubMed] [Google Scholar]
- 9.Timmins L, Suever J, Eshtehardi P, McDaniel M, Oshinski J, Samady H, Giddens D. Framework to co-register longitudinal virtual histology-intravascular ultrasound data in the circumferential direction. IEEE Transactions on Medical Imaging. 2013;32(11):1989–1996. doi: 10.1109/TMI.2013.2269275. [DOI] [PubMed] [Google Scholar]
- 10.Zhang L, Downe RW, Chen Z, Sun S, Masiarov T, Kovarnik T, Lopez J, Sonka M, Wahle A. Side-branch guided registration of intravascular ultrasound pullbacks in coronary arteries. MICCAI Workshop in Computing and Visualization for IntraVascular Imaging and Computer Assisted Stenting (CVII-STENT); 2014. pp. 44–51. [Google Scholar]
- 11.Alberti M, Balocco S, Carrillo X, Mauri J, Radeva P. Medical Image Computing and Computer-Assisted Intervention–MICCAI 2012. Springer; 2012. Automatic non-rigid temporal alignment of IVUS sequences; pp. 642–650. [DOI] [PubMed] [Google Scholar]
- 12.Alberti M, Balocco S, Carrillo X, Mauri J, Radeva P. Automatic non-rigid temporal alignment of intravascular ultrasound sequences: method and quantitative validation. Ultrasound in Medicine & Biology. 2013;39(9):1698–1712. doi: 10.1016/j.ultrasmedbio.2013.03.005. [DOI] [PubMed] [Google Scholar]
- 13.Vukicevic AM, Stepanovic NM, Jovicic GR, Apostolovic SR, Filipovic ND. Computer methods for follow-up study of hemodynamic and disease progression in the stented coronary artery by fusing IVUS and X-ray angiography. Medical & Biological Engineering & Computing. 2014;52(6):539–556. doi: 10.1007/s11517-014-1155-9. [DOI] [PubMed] [Google Scholar]
- 14.Zhou F, Torre F. Canonical time warping for alignment of human behavior. Advances in Neural Information Processing Systems. 2009:2286–2294. [Google Scholar]
- 15.Caspi Y, Irani M. Spatio-temporal alignment of sequences. IEEE Transactions on Pattern Analysis and Machine Intelligence. 2002;24(11):1409–1424. [Google Scholar]
- 16.Padua FL, Carceroni RL, Santos GA, Kutulakos KN. Linear sequence-to-sequence alignment. IEEE Transactions on Pattern Analysis and Machine Intelligence. 2010;32(2):304–320. doi: 10.1109/TPAMI.2008.301. [DOI] [PubMed] [Google Scholar]
- 17.Grau V, Becher H, Noble JA. Registration of multiview real-time 3-D echocardiographic sequences. IEEE Transactions on Medical Imaging. 2007;26(9):1154–1165. doi: 10.1109/TMI.2007.903568. [DOI] [PubMed] [Google Scholar]
- 18.Ledesma-Carbayo MJ, Kybic J, Desco M, Santos A, Suhling M, Hunziker P, Unser M. Spatio-temporal nonrigid registration for ultrasound cardiac motion estimation. IEEE Transactions on Medical Imaging. 2005;24(9):1113–1126. doi: 10.1109/TMI.2005.852050. [DOI] [PubMed] [Google Scholar]
- 19.Elen A, Choi HF, Loeckx D, Gao H, Claus P, Suetens P, Maes F, D’hooge J. Three-dimensional cardiac strain estimation using spatio–temporal elastic registration of ultrasound images: A feasibility study. IEEE Transactions on Medical Imaging. 2008;27(11):1580–1591. doi: 10.1109/TMI.2008.2004420. [DOI] [PubMed] [Google Scholar]
- 20.Luo X, Mori K. A discriminative structural similarity measure and its application to video-volume registration for endoscope three-dimensional motion tracking. IEEE Transactions on Medical Imaging. 2014;33(6):1248–1261. doi: 10.1109/TMI.2014.2307052. [DOI] [PubMed] [Google Scholar]
- 21.Felzenszwalb PF, Zabih R. Dynamic programming and graph algorithms in computer vision. IEEE Transactions on Pattern Analysis and Machine Intelligence. 2011;33(4):721–740. doi: 10.1109/TPAMI.2010.135. [DOI] [PMC free article] [PubMed] [Google Scholar]
- 22.Sonka M, Winniford MD, Collins SM. Robust simultaneous detection of coronary borders in complex images. IEEE Transactions on Medical Imaging. 1995;14(1):151–161. doi: 10.1109/42.370412. [DOI] [PubMed] [Google Scholar]
- 23.Li K, Wu X, Chen DZ, Sonka M. Optimal surface segmentation in volumetric images - a graph-theoretic approach. IEEE Transactions on Pattern Analysis and Machine Intelligence. 2006;28(1):119–134. doi: 10.1109/TPAMI.2006.19. [DOI] [PMC free article] [PubMed] [Google Scholar]
- 24.Yin Y, Zhang X, Williams R, Wu X, Anderson DD, Sonka M. LOGISMOS–layered optimal graph image segmentation of multiple objects and surfaces: cartilage segmentation in the knee joint. IEEE Transactions on Medical Imaging. 2010;29(12):2023–2037. doi: 10.1109/TMI.2010.2058861. [DOI] [PMC free article] [PubMed] [Google Scholar]
- 25.Xu X, Niemeijer M, Song Q, Sonka M, Garvin MK, Reinhardt JM, Abràmoff MD. Vessel boundary delineation on fundus images using graph-based approach. IEEE Transactions on Medical Imaging. 2011;30(6):1184–1191. doi: 10.1109/TMI.2010.2103566. [DOI] [PMC free article] [PubMed] [Google Scholar]
- 26.Sun S, Sonka M, Beichel RR. Graph-based IVUS segmentation with efficient computer-aided refinement. IEEE Transactions on Medical Imaging. 2013;32(8):1536–1549. doi: 10.1109/TMI.2013.2260763. [DOI] [PMC free article] [PubMed] [Google Scholar]
- 27.Glocker B, Komodakis N, Tziritas G, Navab N, Paragios N. Dense image registration through MRFs and efficient linear programming. Medical Image Analysis. 2008;12(6):731–741. doi: 10.1016/j.media.2008.03.006. [DOI] [PubMed] [Google Scholar]
- 28.Zikic D, Glocker B, Kutter O, Groher M, Komodakis N, Kamen A, Paragios N, Navab N. Linear intensity-based image registration by markov random fields and discrete optimization. Medical Image Analysis. 2010;14(4):550–562. doi: 10.1016/j.media.2010.04.003. [DOI] [PubMed] [Google Scholar]
- 29.Heinrich H, Jenkinson M, Brady M, Schnabel JA. MRF-based deformable registration and ventilation estimation of lung CT. IEEE Transactions on Medical Imaging. 2013;32(7):1239–1248. doi: 10.1109/TMI.2013.2246577. [DOI] [PubMed] [Google Scholar]
- 30.Zhang L, Wahle A, Chen Z, Zhang L, Downe RW, Kovarnik T, Sonka M. Joint registration of location and orientation of intravascular ultrasound pullbacks using a 3D graph based method. SPIE Medical Imaging: Image Processing. 2015:94 131I.1–94 131I.8. doi: 10.1109/TMI.2015.2444815. [DOI] [PMC free article] [PubMed] [Google Scholar]
- 31.von Birgelen C, Hartmann M, Mintz GS, Baumgart D, Schmermund A, Erbel R. Relation between progression and regression of atherosclerotic left main coronary artery disease and serum cholesterol levels as assessed with serial long-term (≥12 months) follow-up intravascular ultrasound. Circulation. 2003;108(22):2757–2762. doi: 10.1161/01.CIR.0000103664.47406.49. [DOI] [PubMed] [Google Scholar]
- 32.Mintz GS, Garcia-Garcia HM, Nicholls SJ, Weissman NJ, Bruining N, Crowe T, Tardif JC, Serruys PW. Clinical expert consensus document on standards for acquisition, measurement and reporting of intravascular ultrasound regression/progression studies. EuroIntervention. 2011;6(9):1123–30. doi: 10.4244/EIJV6I9A195. [DOI] [PubMed] [Google Scholar]
- 33.Sonka M, Hlavac V, Boyle R. Image processing, analysis, and machine vision. Cengage Learning; 2014. [Google Scholar]
- 34.Wahle A, Prause GPM, DeJong SC, Sonka M. Geometrically correct 3-D reconstruction of intravascular ultrasound images by fusion with biplane angiography-methods and validation. IEEE Transactions on Medical Imaging. 1999;18(8):686–699. doi: 10.1109/42.796282. [DOI] [PubMed] [Google Scholar]
- 35.Balocco S, Gatta C, Ciompi F, Wahle A, Radeva P, Carlier S, Unal G, Sanidas E, Mauri J, Carillo X, et al. Standardized evaluation methodology and reference database for evaluating IVUS image segmentation. Computerized Medical Imaging and Graphics. 2014;38(2):70–90. doi: 10.1016/j.compmedimag.2013.07.001. [DOI] [PubMed] [Google Scholar]
- 36.Wilcoxon F. Individual comparisons by ranking methods. Biometrics Bulletin. 1945:80–83. [Google Scholar]
- 37.Cox DR, Hinkley DV. Theoretical statistics. CRC Press; 1979. [Google Scholar]
- 38.Martin Bland J, Altman D. Statistical methods for assessing agreement between two methods of clinical measurement. The Lancet. 1986;327(8476):307–310. [PubMed] [Google Scholar]
- 39.Ughi GJ, Adriaenssens T, Larsson M, Dubois C, Sinnaeve PR, Coosemans M, Desmet W, Dhooge J. Automatic three-dimensional registration of intravascular optical coherence tomography images. Journal of Biomedical Optics. 2012;17(2):0 260 051–02 600 511. doi: 10.1117/1.JBO.17.2.026005. [DOI] [PubMed] [Google Scholar]
- 40.Unal G, Lankton S, Carlier S, Slabuagh G, Chen Y. Fusion of IVUS and OCT through semi-automatic registration. MICCAI Workshop in Computing and Visualization for (Intra) Vascular Imaging (CVII); 2006. pp. 163–170. [Google Scholar]
- 41.Räber L, Heo JH, Radu MD, Garcia-Garcia HM, Stefanini GG, Moschovitis A, Dijkstra J, Kelbaek H, Windecker S, Serruys PW. Offline fusion of co-registered intravascular ultrasound and frequency domain optical coherence tomography images for the analysis of human atherosclerotic plaques. EuroIntervention. 2012;8(1):98–108. doi: 10.4244/EIJV8I1A16. [DOI] [PubMed] [Google Scholar]
- 42.Alberti M, Balocco S, Gatta C, Ciompi F, Pujol O, Silva J, Carrillo X, Radeva P. Automatic bifurcation detection in coronary IVUS sequences. IEEE Transactions on Biomedical Engineering. 2012;59(4):1022–1031. doi: 10.1109/TBME.2011.2181372. [DOI] [PubMed] [Google Scholar]
- 43.Downe RW, Wahle A, Garvin J, Kovarnik T, Horak J, Lopez J, Sonka M. Identification and 3-D modeling of coronary branches in intravascular ultrasound. MICCAI Workshop in Computing and Visualization for (Intra) Vascular Imaging (CVII); 2011. pp. 15–22. [Google Scholar]
- 44.Lewis J. Fast normalized cross-correlation. Vision Interface. 1995;10(1):120–123. [Google Scholar]
- 45.Zhang L, Wahle A, Chen Z, Downe RW, Lopez J, Kovarnik T, Sonka M. An integrated framework for spatio-temporal registration of intravascular ultrasound pullbacks. SPIE Medical Imaging: Ultrasonic Imaging and Tomography. 2015:94 190Y.1–94 190Y.7. [Google Scholar]


