

Abstract
High-throughput sequencing of reduced representation libraries obtained through digestion with restriction enzymes—generically known as restriction site associated DNA sequencing (RAD-seq)—is a common strategy to generate genome-wide genotypic and sequence data from eukaryotes. A critical design element of any RAD-seq study is knowledge of the approximate number of genetic markers that can be obtained for a taxon using different restriction enzymes, as this number determines the scope of a project, and ultimately defines its success. This number can only be directly determined if a reference genome sequence is available, or it can be estimated if the genome size and restriction recognition sequence probabilities are known. However, both scenarios are uncommon for nonmodel species. Here, we performed systematic in silico surveys of recognition sequences, for diverse and commonly used type II restriction enzymes across the eukaryotic tree of life. Our observations reveal that recognition sequence frequencies for a given restriction enzyme are strikingly variable among broad eukaryotic taxonomic groups, being largely determined by phylogenetic relatedness. We demonstrate that genome sizes can be predicted from cleavage frequency data obtained with restriction enzymes targeting “neutral” elements. Models based on genomic compositions are also effective tools to accurately calculate probabilities of recognition sequences across taxa, and can be applied to species for which reduced representation data are available (including transcriptomes and neutral RAD-seq data sets). The analytical pipeline developed in this study, PredRAD (https://github.com/phrh/PredRAD), and the resulting databases constitute valuable resources that will help guide the design of any study using RAD-seq or related methods.
Keywords: RAD-seq, reduced representation sequencing, PredRAD, experimental design, genome size prediction, restriction recognition sequence probability
Introduction
The use of type II restriction enzymes to obtain reduced representation libraries from nuclear genomes, combined with the power of next-generation sequencing technologies, is rapidly becoming one of the most commonly used strategies to generate genome-wide genotypic and sequence data in both model and nonmodel organisms (Baird et al. 2008; Andolfatto et al. 2011; Elshire et al. 2011; Peterson et al. 2012). The single nucleotide polymorphisms (SNPs) embedded in the resulting restriction site associated DNA (RAD) sequence tags (Miller, Dunham, et al. 2007; Baird et al. 2008) have myriad uses in biology, which range from genetic mapping (Wang et al. 2013; Weber et al. 2013) to population genomics (Hohenlohe et al. 2010; Andersen et al. 2012; White et al. 2013), phylogeography (Emerson et al. 2010; Reitzel et al. 2013), phylogenetics (Wagner et al. 2012; Eaton and Ree 2013; Herrera and Shank 2015; Herrera et al. 2015), and SNP marker discovery (Scaglione et al. 2012; Toonen et al. 2013).
The choice of appropriate type II restriction enzyme(s) is critical for the effective design and application of RAD sequencing (RAD-seq) and a rapidly growing number of related methods such as genotyping-by-sequencing (Elshire et al. 2011), multiplexed shotgun genotyping (Andolfatto et al. 2011), double digest RAD-seq (Peterson et al. 2012), and ezRAD (Toonen et al. 2013). This choice determines the number of RAD markers that can be obtained, which in turn dictates the amount of sequencing needed for a desired coverage level, the number of samples that can be multiplexed, the monetary cost, and ultimately the success of a project. The theoretical maximum number of RAD markers that can be obtained for a given combination of restriction enzyme and biological species can be easily calculated as twice the frequency (absolute number of occurrences) of the enzyme’s recognition sequence (RS) (which for type II restriction enzymes is also the cleavage site) in the genome, but only when the fully sequenced genome is available. For cases in which the whole genome sequence is not available (i.e., most cases), this number can be approximated as twice the product of the genome size and the probability of the enzyme’s RS in a given genome.
Genome Sizes
Genome sizes can be approximated in nonmodel organisms through sequencing-independent techniques such as Feulgen densitometry (Hardie et al. 2002) or flow cytometry (Vinogradov 1994; Dolezel et al. 2007). However, these techniques have well-known limitations: 1) Flow cytometry often requires the availability of fresh tissue material with accessible intact cells or nuclei, thus diminishing its applicability to field-collected and fixed samples; and 2) both flow cytometry and Feulgen densitometry can be affected by staining interference with cytosolic compounds and variability in DNA packaging among cell types, which can significantly impact the accuracy and reproducibility of measurements (see reviews by Hardie et al. 2002; Dolezel and Bartos; and references therein). Therefore, alternative methods for genome size estimation are desirable.
Type II restriction enzymes, which are endonucleases chiefly produced by prokaryotic micro-organisms, cleave double-stranded DNA (dsDNA) at specific unmethylated RSs that are 4–8 bp long and typically palindromic. These enzymes are thought to play an important role as defense systems against foreign phage dsDNA during infection or as selfish parasitic elements, and therefore have been the center of an evolutionary ‘arms race’ (Rambach and Tiollais 1974; Karlin et al. 1992; Rocha et al. 2001). Type II restriction enzymes are not known in eukaryotes and are not used as virulence factors by bacteria to infect eukaryotic hosts. Therefore there are no a priori reasons to believe that RSs in eukaryotic genomes are subject to selective pressures, but rather they should be evolutionarily neutral. A prediction from this neutrality hypothesis is that the frequency of restriction RSs in a genome will be linearly correlated with the size of that genome, unless the particular restriction RS is associated with nonneutral genomic elements. Hence, the genome size of a species can in theory be estimated from the number of markers obtained from a RAD-seq experiment, given that the restriction enzyme used shows the aforementioned linearity.
Recognition Sequence Probabilities
Flow cytometry has also been used as a sequencing-independent method to estimate the genomic guanine-cytosine (GC) composition (Vinogradov 1998; Šmarda et al. 2011), a widely suggested parameter for the estimation of the restriction enzyme’s RS probability (Baird et al. 2008; Davey and Blaxter 2011). Nonetheless, preliminary evidence suggests that restriction RS probability calculation, using GC composition as the only parameter, can yield predicted cleavage site frequencies that deviate significantly from observations, for particular combinations of taxa and restriction enzymes (Davey and Blaxter 2011; Davey et al. 2011). The extent and magnitude of these deviations across the eukaryotic tree of life remain unknown. Better models to calculate restriction RS probabilities across taxonomic groups are needed to improve the accuracy of predictions of cleavage site frequencies in species without sequenced genomes. These models could be applied using nongenomic data sets (e.g., transcriptomes) to obtain RS probability estimates, thus aiding the applicability of RAD-seq methods in nonmodel organisms.
Eukaryotic genomes have heterogeneous compositions with characteristic signatures at the level of di- and trinucleotides that are largely independent of coding status or function (Karlin and Mrázek 1997; Karlin et al. 1998; Gentles and Karlin 2001). Thus, it is possible that genome composition at these levels has a large influence on the abundance of short sequence patterns, such as RSs of restriction enzymes. Models incorporating the information from these genomic compositional signatures should improve the accuracy of restriction RS probability calculations.
Here we performed systematic in silico genome-wide surveys of genome compositions and RSs, for diverse and commonly used type II restriction enzymes, in 434 eukaryotic whole and draft genomes (supplementary table S1, Supplementary Material online) to: 1) Characterize restriction RS frequencies across the eukaryotic tree of life; 2) explore the potential for predicting genome sizes from restriction RS frequency data; 3) develop stochastic models based on genomic compositions to calculate probabilities of RSs across taxa; and 4) evaluate the applicability of these models to species for which only nongenomic data are available (i.e., not whole or draft genome assemblies), such as transcriptomes or RAD-seq data. The PredRAD analytical pipeline developed in this study (https://github.com/phrh/PredRAD), and the resulting databases constitute a valuable reference resource that will help guide restriction enzyme choice in future studies using broadly applicable RAD-related methods.
Materials and Methods
Observed Restriction Recognition Sequence Frequencies
Assemblies from eukaryotic whole genome shotgun (WGS) sequencing projects available as of December 2012 were retrieved primarily from the US National Center for Biotechnology Information (NCBI) WGS database (supplementary table S1, Supplementary Material online). Only one species per genus was included. Of the 434 genome assemblies included in this study, 42% corresponded to fungi, 21% to vertebrates, 16% to invertebrates, and 9% to plants. Only unambiguous nucleotide calls were taken into account. Genome sequence sizes were measured as the number of unambiguous nucleotides in the assembly. A set of 18 commonly used palindromic type II restriction enzymes with variable nucleotide compositions was screened in each of the genome assemblies (table 1). The number of cleavage sites present in each genome was obtained by counting the number of unambiguous matches for each RS pattern. Under optimal experimental conditions each cleavage site should produce two RAD tags, one in each direction from the restriction site. Therefore, we define the number of observed RAD tags in each genome assembly as twice the number of RS pattern matches.
Table 1.
Restriction enzymes included in this study
| Core Sequence | Restriction Enzyme | Recognition Sequence | Recognition Sequence Length (bp) | GC Content of Recongition Sequence (%) |
|---|---|---|---|---|
| GGCC | ||||
| NotI | GCGGCCGC | 8 | 100.0 | |
| CCGG | ||||
| SgrAI | CRCCGGYG | 8 | 87.5 | |
| BsrFI | RCCGGY | 6 | 83.3 | |
| NgoMIV | GCCGGC | 6 | 100.0 | |
| AgeI | ACCGGT | 6 | 66.7 | |
| MspI | CCGG | 4 | 100.0 | |
| TGCA | ||||
| SbfI | CCTGCAGG | 8 | 75.0 | |
| PstI | CTGCAG | 6 | 66.7 | |
| NsiI | ATGCAT | 6 | 33.3 | |
| AATT | ||||
| ApoI | RAATTY | 6 | 16.7 | |
| EcoRI | GAATTC | 6 | 33.3 | |
| MluCI | AATT | 4 | 0.0 | |
| TTAA | ||||
| MseI | TTAA | 4 | 0.0 | |
| CATG | ||||
| NspI | RCATGY | 6 | 50.0 | |
| NcoI | CCATGG | 6 | 66.7 | |
| PciI | ACATGT | 6 | 33.3 | |
| FatI | CATG | 4 | 50.0 | |
| GTAC | ||||
| KpnI | GGTACC | 6 | 66.7 |
To test for potential correlation between observed restriction RS frequencies for each enzyme and the phylogenetic relatedness among species, we calculated the Abouheif’s Cmean index of phylogenetic signal (Pavoine et al. 2008; Abouheif 1999) as implemented in the abouheif.moran function of the R package “adephylo” (Jombart et al. 2010). Abouheif’s Cmean performs well for traits evolving under a model of Brownian Motion, and does not depend on branch lengths of the phylogenetic tree, but focuses on the topology (Münkemüller et al. 2012). This later characteristic is important given the large phylogenetic scale of this study, which restricts us to use summary “supertrees” with uncertain branch lengths. To test the possible influence of the chosen phylogenetic tree, we compared the Abouheif’s Cmean index values calculated using a tree containing information for all evaluated species, which was extracted from the US NCBI phylogenetic taxonomy database on May 16, 2013, using the iTOL tool http://itol.embl.de. (Federhen 2012), with an equivalent tree obtained from the Open Tree of Life (OTL) synthetic draft phylogenetic tree database version 3 (Hinchliff et al. 2015), retrieved on September 28, 2015 and pruned using the R package “ape” (Paradis et al. 2004). The OTL tree had fewer branches than the NCBI tree due to the incompleteness of the OTL database at the time of writing.
Recovery of RAD Tags
The number of cleavage sites in a genome is not the only factor that determines the number of RAD loci that can be recovered experimentally. The architecture of each genome, and in particular the number of repetitive elements and gene duplications, can significantly decrease the number of unambiguous loci obtained via alignment to a reference genome or de novo assembly. To quantify this contribution, we assessed the proportion of RAD tags that can potentially be recovered unambiguously after empirical sequencing. We performed in silico sequencing experiments for all genome assembly–restriction enzyme combinations. For each restriction site located in the genome assemblies, 100 bp up- and downstream of the restriction site was extracted. This sequence read length is typical of sequencing experiments performed with current Hi-Seq platforms (Illumina, Inc.). The resulting RAD tags were aligned back to their original genome assemblies using BOWTIE v0.12.7 (Langmead et al. 2009). Only reads that produced a unique best alignment were retained.
Genome Size Estimation
To explore the potential for predicting genome sizes from restriction RS frequency data, we modeled their relationship using data from the 434 genomes and 18 restriction enzymes through linear regression. Genome sizes and restriction RS frequencies were log10 converted to handle the multiple orders of magnitude spanned within each variable. The nonparametric Spearman’s rank-order correlation coefficient (ρ) was calculated to measure the strength of association between genome sizes and restriction RS frequencies. Simple linear models were fitted using least-squares estimation of β parameters with the lm function in R. The linear model (eq. 1) used to predict genome size y, in units of base pairs, is defined as follows:
| (1) |
where x is the number of restriction RSs in the genome, and β0 and β1 are the estimated parameters. Table 2 provides the estimated values of β0 and β1 for each restriction enzyme.
Table 2.
Linear Regression Parameter Estimates and 95% CIs
| Enzyme | β0 | β1 | 95% CI β0 | 95% CI β1 |
|---|---|---|---|---|
| AgeI | 3.791226 | 1.081123 | 3.589084–3.993368 | 1.030957–1.131288 |
| ApoI | 3.909432 | 0.789828 | 3.771043–4.047820 | 0.764083–0.815571 |
| BsrFI | 3.595150 | 0.972785 | 3.336245–3.854053 | 0.917377–1.028193 |
| EcoRI | 3.915725 | 0.932289 | 3.836952–3.994497 | 0.914985–0.949591 |
| FatI | 2.719837 | 0.947207 | 2.639872–2.799802 | 0.933248–0.961165 |
| KpnI | 4.041810 | 0.984192 | 3.931500–4.152119 | 0.957826–1.010558 |
| MluCI | 3.432945 | 0.796619 | 3.281188–3.584701 | 0.770985–0.822252 |
| MseI | 3.963499 | 0.722786 | 3.813020–4.113977 | 0.696835–0.748737 |
| MspI | 3.084383 | 0.957434 | 2.846370–3.322395 | 0.912357–1.002510 |
| NcoI | 4.089533 | 0.910311 | 3.975127–4.203937 | 0.884724–0.935898 |
| NgoMIV | 5.115077 | 0.738618 | 4.881512–5.348642 | 0.681804–0.795430 |
| NotI | 6.432067 | 0.581703 | 6.254678–6.609455 | 0.522412–0.640993 |
| NsiI | 3.948432 | 0.908376 | 3.874564–4.022299 | 0.892446–0.924304 |
| NspI | 3.399772 | 0.930233 | 3.316885–3.482657 | 0.914012–0.946453 |
| PciI | 4.092091 | 0.885098 | 4.031567–4.152614 | 0.871942–0.898254 |
| PstI | 4.244698 | 0.850488 | 4.114538–4.374857 | 0.822215–0.878759 |
| SbfI | 5.782031 | 0.726905 | 5.671977–5.892083 | 0.693729–0.760080 |
| SgrAI | 5.500710 | 0.749462 | 5.245991–5.755428 | 0.677348–0.821576 |
Note.—CI, confidence interval.
Restriction Recognition Sequence Probability Calculation
To test the hypothesis that compositional heterogeneity in eukaryotic genomes can determine the frequency of cleavage sites of each genome, we characterized the GC content, as well as the mononucleotide, dinucleotide, and trinucleotide compositions of each genome and developed probability models to predict the expected frequency of RSs for each restriction enzyme. GC content was calculated as the proportion of unambiguous nucleotides in the assembly that are either guanine or cytosine, assuming that the frequency of guanine is equal to the frequency of cytosine. Mononucleotide composition was determined as the frequency of each one of the four nucleotides. Dinucleotide and trinucleotide compositions were determined as the frequency of each one of the 16 or 64 possible nucleotide combinations, respectively.
Mononucleotide and GC content sequence models were used to estimate the probability of a particular RS assuming that each nucleotide is independent of the others and of its position on the RS. The GC content model has only two parameters, the GC and adenine-thymine (AT) frequencies. In the mononucleotide model (eq. 2), there are four parameters, one for each of the four possible nucleotides.
| (2) |
Here, is the probability of nucleotide at the position of the RS s. n(s) is the length of the RS. In the GC content model, can take the values of or . In the mononucleotide model, can take the values of , , , or , where is the frequency of a given mononucleotide (X = A, G, C, or T ).
Dinucleotide and trinucleotide sequence models (eq. 3) were defined as first- and second-degree Markov chain transition probability models with 16 or 64 parameters, respectively (Karlin et al. 1992; Singh 2009). These models take into account the position of each nucleotide in the RS. Nucleotides along the RS are not independent from nucleotides in neighboring positions. The probability of a particular RS for these Markov chain models was calculated as follows:
| (3) |
where is the probability at the first position on the RS and is the conditional probability of a subsequent nucleotide on the RS depending on the previous n nucleotides. In the dinucleotide sequence model, and in the trinucleotide sequence models .
Genomic resources are unavailable for most species. However, reduced representation data sets that capture a small fraction of a genome, such as RNA-seq or RAD-seq data sets, are more widely available. We investigated the potential use of these data sets to estimate genome composition parameters for our predictive models and calculate RS probabilities for the selected set of 18 restriction enzymes. For this we selected a set of 27 species out of the 434 examined eukaryotic species with whole and draft genomes, which also have publically available transcriptome data (supplementary table S2, Supplementary Material online). We also used the data from the in silico RAD sequencing experiments (described above) as reduced representation data sets for these species. We estimated genome composition parameters from transcriptome and RAD-seq data sets, and calculated RS probabilities using the models.
Expectations versus Observations
To assess the effectiveness of the predictive RS models, we compared the number of observed restriction sites (frequency) in the genome assemblies with the expected predicted number according to each model using composition parameters estimated from whole and draft genome data sets. The expected number of restriction sites in a given genome was calculated as the product of the probability of a RS multiplied by the genome sequence size. To quantify the departures from expectation, we define a similarity index (SI) as follows:
where O and E are the observed and expected number of restriction sites, respectively. If SI = 0, then E = O. If SI < 0, then E > O, and vice versa.
To measure the overall similarity between the restriction RS probabilities calculated using known composition parameters from the genome and those calculated using estimated composition parameters from reduced representation transcriptome and genome data sets, we calculated the mean squared error (MSE) per species as follows:
| (4) |
where is the probability of a restriction RS (of an enzyme i ) calculated using composition parameters estimated from reduced representation data sets and is the probability of a restriction RS calculated using known composition parameters from genome data sets. Each enzyme was assigned an arbitrary number from 1 to 18 (n). When MSE = 0, the probabilities are identical. MSE value increases as similarity decreases.
Location of Recognition Sequences in Mammalian Genomes
To evaluate the possibility that RS frequency patterns inconsistent with evolutionary neutrality occurred in genomic areas subject to natural selection, we investigated the genomic locations of RSs relative to well-annotated conserved genomic elements. We obtained DNA sequences of genomic elements (sensu Siepel et al. 2005; Miller, Rosenbloom, et al. 2007) that are strongly conserved across mammals from the human, dog, and mouse genomes using the University of California Santa Cruz genome table browser (http://genome.ucsc.edu/cgi-bin/hgTables). We counted the number of occurrences of RSs for each of the 18 restriction enzymes in these conserved genomic elements (observed) and compared them, using the SI described above, with the expected number of occurrences in a random genome sample of equal size (calculated as the relative frequency of RSs in the whole genome [total number of RSs/genome size in base pairs] multiplied by the size of each of the conserved element data sets in base pairs).
The analytical software pipeline described here (PredRAD), visualization scripts, and output database files are publicly available at https://github.com/phrh/PredRAD.
Results
Frequencies of Recognition Sequences Are Highly Variable across Taxa
To characterize cleavage site frequencies across the Eukaryotic tree of life, we surveyed restriction RSs for 18 commonly used palindromic type II restriction enzymes in 434 whole and draft genome assemblies. Observed relative frequencies of RSs were highly variable among broad taxonomic groups for the set of restriction enzymes examined here (table 1), with clear clustering patterns determined by phylogeny (fig. 1). To measure the significance of the correlation between observed restriction RS frequencies for each enzyme and the phylogenetic relatedness among species, we calculated the Abouheif’s Cmean index of phylogenetic signal (Pavoine et al. 2008; Abouheif 1999). To test the possible influence of the chosen phylogenetic tree, we compared the Abouheif’s Cmean index values calculated using a tree extracted from NCBI phylogenetic taxonomy database (434 tips and 265 internal nodes) with an equivalent tree obtained from the OTL database (219 tips and 175 internal nodes; OTL tree had fewer branches due to the incompleteness of the database at the time of writing). We found that in both cases all correlations were significant (P < 0.05; fig. 1 and supplementary figs. S1 and S2, Supplementary Material online), but, as expected, the magnitude of the correlation (Abouheif’s Cmean value) was variable among restriction enzymes. The Abouheif’s Cmean values were remarkably similar, although generally smaller when calculated on the OTL tree than the NCBI tree. Most importantly, the differences in Abouheif’s Cmean values observed across restriction enzymes were mostly consistent in direction and magnitude between the two trees.
Fig. 1.—

Observed relative restriction recognition sequence frequencies. Left: Phylogenetic tree of all eukaryotic taxa analyzed in this study. The tree is based on the NCBI phylogenetic taxonomy tree retrieved on May 16, 2013 using the iTOL tool http://itol.embl.de. Branch colors and labels indicate broad taxonomic groups. Organism silhouettes and cartoons were created by the authors or obtained from http://phylopic.org. Right: Heatmap of the log10 of the observed relative frequency of restriction sites per megabase. Each row corresponds to a species from the tree on the left, and each column corresponds to a different restriction enzyme. Dot/line plot indicates the value of the Abouheif’s Cmean index of phylogenetic signal in the restriction recognition sequence frequencies for each restriction enzyme. Light gray dots/lines indicate the values obtained when using the NCBI tree and dark gray dots/lines indicate the values obtained when using the OTL tree. All Abouheif’s Cmean values are significant at α = 0.05 (P < 0.02).
As an example of this phylogenetic variability of observed relative frequencies of RSs, we observed 45.8 recognition sequences per megabase (RS/Mb) ± 24.6 (mean ± standard deviation [SD]) for NgoMIV in core eudicot plants, compared with 277.4 ± 131.3 RS/Mb in commelinid plants (monocots). Among closely related species the relative frequency patterns were similar and variability generally small. Observed relative frequencies of RS/Mb were inversely proportional to the length of the RS, with orders of magnitude differences among the 4, 6, and 8 cutters when compared within the same species; for example, in the starlet anemone Nematostella vectensis, there were 3917.6, 167.6, and 6.9 RS/Mb for the 4-cutter FatI, 6-cutter PstI, and 8-cutter SbfI, respectively. In contrast, nucleotide composition of the RS itself did not show a clear correlation with the observed relative frequency of cleavage sites. For example, 83.6 RS/Mb ± 25.1 were observed in Neopterygii vertebrates for KpnI (GGTACC) and 622.6 RS/Mb ± 119.1 were observed for PstI (CTGCAG), both RSs with the same GC content (66.7%).
Genome Sizes Can Be Predicted from Particular Recognition Sequence Frequencies
To explore the potential for predicting genome sizes from restriction RS frequency data, we modeled their relationship using data from the 434 genome assemblies and 18 restriction enzymes through linear regression. A general positive correlation between RS frequency and genome size was observed for all restriction enzymes, being significantly strong (Spearman’s correlation coefficient >0.95) for five of them: EcoRI, FatI, NsiI, NspI, and PciI (fig. 2). Predicted genome sizes, calculated using the linear models with estimated beta parameters for these five enzymes (table 2), matched actual observed genome size values extremely well (supplementary fig. S3, Supplementary Material online).
Fig. 2.—

Linear correlations of restriction recognition sequence frequencies and genome sizes. Scatter plots show the observed numbers of recognition sequences in a genome for a given restriction enzyme (x-axis) versus the size of the genome in base pairs (y-axis). The data for all the 434 examined genomes are shown. Each panel shows the data for a different restriction enzyme. Dot colors indicate broad taxonomic groups: Fungi (yellow), plants (green), invertebrates (blue), vertebrates (red), and others (black). Nonparametric Spearman’s rank-order correlation coefficients (ρ) are shown for each restriction enzyme. All ρ are significant at α = 0.05 (P < 1 × 10−68). Solid gray lines represent the best-fit linear models with 95% confidence intervals (gray dotted lines).
Genome Composition-based Models Outperform Traditional GC Content-based Models
To generate better models to calculate restriction RS probabilities, we developed stochastic models based on the GC content of each genome, as well as the mononucleotide, dinucleotide, and trinucleotide compositions for each restriction enzyme. We evaluated the fit of each model by comparing the in silico observed frequencies of cleavage sites with the expected frequencies predicted by the models using composition parameters estimated from the full genome assemblies. This fit was measured with an SI, defined as the binary logarithm of the quotient of the number of observed and expected cleavage sites. A positive SI indicates that the number of observed cleavage sites is greater than the expected, whereas a negative SI indicates a smaller number of observed sites than expected. If SI is equal to 0, then the number of observed sites is equal to the expectation. For example, an SI = 1 indicates that the number of observed cleavage sites for a particular enzyme in a given genome is twice the number of expected sites predicted by a particular model. Similarly, an SI = −1 indicates that the observed number is half the expected number. Trinucleotide composition models were in general a better predictor, in terms of their accuracy and precision, of the expected number of cleavage sites than any of the other models when full genome assemblies were used to estimate model parameters (figs. 3–5). The mononucleotide and GC content models produced relatively poorer predictions that were indistinguishable from one another (figs. 3–5). In a few cases the other models outperformed the trinucleotide model, for example, EcoRI (figs. 3–5). The fit of the predictions was highly variable among broad taxonomic groups but generally similar within, for example, in Neopterygii vertebrates an average SI of 0.14 ± 0.19 for AgeI with the dinucleotide model compared with −0.31 ± 0.19 in Sarcopterygii.
Fig. 4.—

Similarity indexes for trinucleotide and dinucleotide genome composition models calculated using known composition parameters from the full genome assemblies. Left: Phylogenetic tree as in figure 1. Center: Heatmap of the similarity indices for the trinucleotide model Right: Heatmap of the similarity indexes for the dinucleotide model. Each row corresponds to a species from the tree on the left, and each column corresponds to a different restriction enzyme. Cyan indicates SI < 0 (smaller number of observed sites than expected) and yellow indicates SI > 0 (greater number of observed sites than expected). If SI = 0, then the number of observed sites is equal to the expectation. An SI = 1 indicates that the number of observed cleavage sites for a particular enzyme in a given genome is twice the number of expected sites predicted by a particular model. Red line in the color scale box shows the distribution histogram of all values.
Fig. 3.—

Overall fit of genome composition models per restriction enzyme as measured by the Similarity Index when calculated using known composition parameters from the full genome assemblies. Vertical axes in the box and whisker plots indicate the values of the SI for each species per enzyme (see Methods). Horizontal axes in the box and whisker plots indicate the genome composition model: GC content (gc), mononucleotide (mono), dinucleotide (di), and trinucleotide (tri). Horizontal edges of range boxes indicate the first and third quartiles of the SI values under each composition model. The thick horizontal black line represents the median. Whiskers indicate the value of 1.5 times the interquartile range from the first and third quartiles. Outliers are defined as SI values outside the whiskers range and are represented by dots. Red dashed lines indicate SI = 0.
Fig. 5.—

Similarity indexes for mononucleotide and GC-content genome composition models calculated using known composition parameters from the full genome assemblies. Left: Phylogenetic tree as in figure 1. Center: Heatmap of the similarity indexes for the mononucleotide content model Right: Heatmap of the similarity indexes for the GC content model. As in figure 4, each row corresponds to a species from the tree on the left, and each column corresponds to a different restriction enzyme. Cyan indicates SI < 0 and yellow indicates SI > 0. Red line in the color scale box shows the distribution histogram of all values.
Recognition Sequence Probability Can Be Calculated from Nongenomic Data Sets
Genomic resources (whole or draft genomes) are unavailable for most species. Dunn and Ryan (2015) estimate that less than ∼0.015% of species have a sequenced draft genome to date. However, reduced representation data sets that capture a small fraction of a genome, such as RNA-seq or RAD-seq data sets, can now be easily and economically developed. We investigated the potential use of these data sets to estimate genome composition parameters for our predictive models and calculate RS probabilities of any given restriction enzyme. For this we selected a set of 27 species out of the 434 examined eukaryotic species with whole and draft genomes, which also have publically available transcriptome data. The restriction sequence probabilities calculated for the same panel of 18 restriction enzymes, as above, were remarkably similar between those calculated using known composition parameters from the whole and draft genomes and those calculated using estimated composition parameters from transcriptome data sets (fig. 6). Interestingly, the overall similarity between the two kinds of calculated probabilities (measured as the MSE calculated across all species) was greatest when probabilities were calculated using a mononucleotide composition model (0.046; when MSE = 0 the probabilities are identical; MSE value increases as similarity decreases), and decreased when dinucleotide and trinucleotide models were used (0.06 and 0.07, respectively). As expected, the species-specific MSE values were variable, and tended to decrease as the propotion of genome represented by the transcriptome increased (fig. 6).
Fig. 6.—
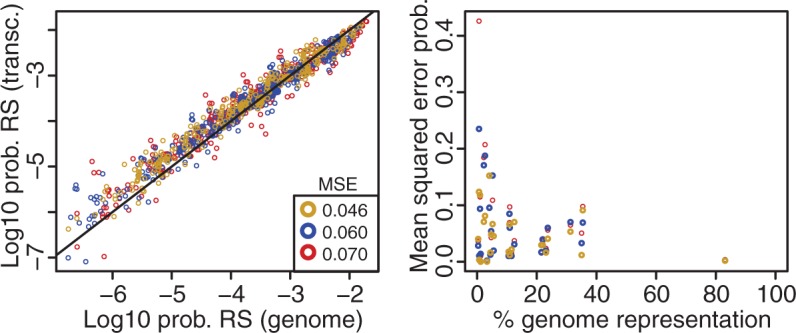
Left: Scatter plot of the probability of restriction RS probabilities calculated using known composition parameters from the full genome assemblies (x-axis) versus those calculated using estimated composition parameters from transcriptome data sets (y-axis). Each dot represents the combination of one of the 18 examined restriction enzymes and one of the 27 species in the reduced representation subset. Colors indicate the probabilities calculated by different models: Mononucleotides (yellow), dinucleotides (blue), and trinucleotides (red). Average MSE values for the probabilities calculated with each model are shown. Solid black line represents the identity line, in which x = y. Right: Scatter plot of the percentage of the genome represented by the transcriptome data sets (x-axis) versus per-species MSE values for the probabilities calculated with each model (y-axis). As before, colors indicate the probabilities calculated by different models: Mononucleotides (yellow), dinucleotides (blue), and trinucleotides (red).
We also calculated RS probabilities using parameters estimated from the in silico RAD-seq data for the same 27 species, finding great variability (fig. 7). The RS probabilities calculated using parameters estimated from RAD-seq data sets obtained with enzymes that showed strong correlations between RS frequency and genome size (fig. 2) were almost identical to the probabilities calculated using the known composition parameters from the whole or draft genome data sets (fig. 7 and supplementary fig. S4, Supplementary Material online). Contrastingly, the probabilities calculated from RAD-seq data sets obtained with enzymes that showed weaker correlations between RS frequency and genome size (such as NotI, NgoMIV, and SgrAI) were substantially dissimilar (fig. 7 and supplementary fig. S4, Supplementary Material online). Overall, as observed for the transcriptome data sets, the similarity between the two kinds of calculated probabilities (measured by the MSE) was greatest when probabilities were calculated using a mononucleotide composition model, and decreased when dinucleotide and trinucleotide models were used. Similarly, the species-specific MSE values tended to decrease as the proportion of genome represented by the RAD-seq data sets increased (supplementary fig. S4, Supplementary Material online), although in some cases (e.g., PstI and SbfI) they showed a marked decrease followed by an increase at higher representation proportions.
Fig. 7.—

Scatter plots of the probability of restriction RS probabilities calculated using known composition parameters from the genome (x-axis) versus those calculated using estimated composition parameters from in silico RAD-seq data sets (y-axis). Each dot represents the combination of one of the 18 examined restriction enzymes and one of the 27 species in the reduced representation subset. Colors indicate the probabilities calculated by different models: Mononucleotides (yellow), dinucleotides (blue), and trinucleotides (red). Average MSE values for the probabilities calculated with each model are shown. Solid black lines represents the identity lines, in which x = y.
Predicted frequencies of cleavage sites (absolute number of cleavage sites), obtained by multiplying known genome sizes with the probabilities calculated using composition models, were remarkably similar to the observed frequencies of cleavage sites in whole and draft genome data sets when the model parameters were estimated from transcriptome data sets, or from RAD-seq data sets generated with restriction enzymes showing strong correlations between RS frequency and genome size (supplementary figs. S5–S7, Supplementary Material online).
Discussion
Genome-Wide Surveys of Cleavage Sites across the Eukaryotic Tree of Life
Observed restriction RS frequencies for a given restriction enzyme are strikingly variable across broad eukaryotic taxonomic groups, but are similar among closely related species. This pattern is most evident in groups that have a larger taxonomic representation, such as mammals and eudicot plants. As more genome assemblies become available, patterns within many other underrepresented taxonomic groups will be further revealed. Quantitatively, the correlation between RS frequencies and phylogenetic relatedness, measured by the Abouheif’s Cmean index of phylogenetic signal, is significant in all examined cases. The fact that Abouheif’s Cmean values are similar and vary consistently between the two phylogenetic trees evaluated in this study (OTL and NCBI) indicates that the correlation between RS frequencies and phylogenetic relatedness is robust to the use of alternative phylogenetic hypotheses. The small observed differences in Abouheif’s Cmean values might be attributable to the differences in the number of branches between trees as well as the tree topology, especially in deeper unresolved parts of the eukaryotic tree of life. Altogether these observations are consistent with the hypothesis that the abundance of cleavage sites is largely determined by phylogenetic relatedness.
As expected, observed relative frequencies of cleavage sites with shorter RSs are on average higher than the observed frequencies with longer RSs. However, this pattern is not universal. There are several instances in which the relative frequency of cleavage sites for a high-denomination cutter is higher than that for a low-denomination cutter. For example, in primates the relative frequency of the 8-cutter SbfI (24.6 ± 1.7 RS/Mb) is significantly higher than the frequency of the 6-cutter AgeI (18.4 ± 1.4 RS/Mb). These deviations from expectation are indicative of enzyme-specific frequency biases for particular taxa, and, as illustrated in the results section, are not correlated with the base composition of RSs. These observations demonstrate that the expected relative frequencies of RSs cannot be naively extrapolated across enzyme types and divergent taxa, but rather specific knowledge of RS frequencies/probabilities and genome sizes is needed.
Predictability of Genome Sizes
For many of the examined type II restriction enzymes (e.g., EcoRI, FatI, NsilI, NspI, PciI), the observed frequencies of RSs in eukaryotic genomes are consistent with the idea that they behave neutrally, evolutionary speaking, and therefore can be readily used as parameters in linear models to estimate genome sizes (figs. 1 and 2). In contrast, the observed frequencies of RSs for some other type II restriction enzymes showed significant deviations from the predictions of this evolutionary neutrality hypothesis (e.g., BsrFI, NgoMIV, NotI, SbfI, SgrAI). A closer look at the genomic locations of the RSs of these deviant cases reveals that, in mammals, they are more likely to occur in conserved genomic elements than what would be expected by chance (fig. 8). Conserved genomic elements (sensu Siepel et al. 2005) are widely recognized as evidence of functional regions, mainly regulatory, under strong purifying (negative) selection (Bejerano et al. 2004; Katzman et al. 2007). Thus, this observation suggests that the association of some restriction RSs with nonneutral genomic elements in particular taxa can account for some of the observed biases and heterogeneity in the relative frequencies of cleavage site across the eukaryotic tree of life. Further comparative genomic studies in underrepresented clades promise to unravel additional potential mechanisms that can further explain observed deviations from expected neutral behavior.
Fig. 8.—
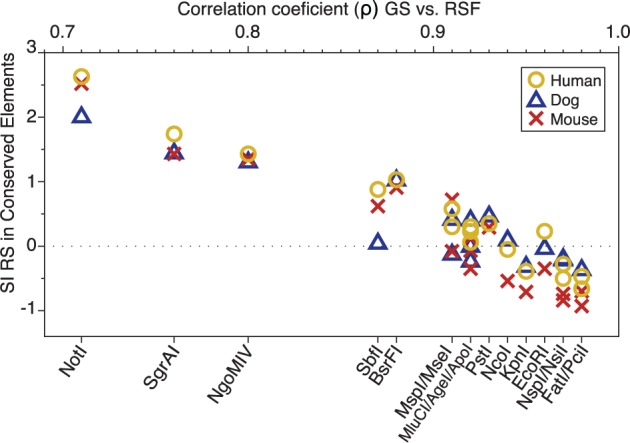
Scatter plot of the Spearman’s correlation coefficient (ρ) values between genome sizes and restriction recognition sequence frequencies (x-axis) versus SI values between observed and expected numbers of restriction recognition sequences in mammalian conserved element genomic regions (y-axis). Corresponding restriction enzyme names to each ρ value are shown. Colors and symbols indicate different taxa: Dog (blue triangles), mouse (red crosses), and human (yellow circles). Dashed line indicates SI = 0 (value at which expected and observed values are equal).
Predictability of Recognition Sequence Probabilities
Our analyses indicate that in most cases, when composition parameters are estimated from full genome assemblies, trinucleotide stochastic models are the best predictors, whereas the GC content and mononucleotide models are the worst predictors of the expected relative number of cleavage sites in a eukaryotic genome. It is likely that the greater number of parameters in the trinucleotide model (64, compared with 16, 4, and 2 of the dinucleotide, mononucleotide, and GC content model, respectively), combined with the greater k-mer length, is the cause of the better fit. However, this trend is not universal. As illustrated in the Results section, in a few cases the other models outperformed the trinucleotide composition model. Neither the GC content nor the length of the RS can confidently explain the observed discrepancies. Increasing the k-mer length above trinucleotide in the composition models (i.e., tetranucleotide, pentanucleotide, etc.) could improve their fit; however, this will come at a cost of increasing probability calculation error in reduced representation data sets (caused by sampling error in data sets composed by many short contigs vs. data sets composed by few long contigs) (figs. 6 and 7 and supplementary fig. S4, Supplementary Material online). Future cost-benefit evaluations of the overall influence of these factors (k-mer length and genome sampling error) will help elucidate their relative contributions to RS probability calculations using parameters estimated from nongenomic reduced representation data sets. In the meantime, we suggest generating a range of probability values from the different models when reduced representation data sets are used to calculate RS probabilities.
It is not surprising that the fit of the predictions made by the models is highly variable across taxonomic groups, given the high heterogeneity observed in the genetic composition patterns across the eukaryotic tree of life (Appendix). We conclude that the predictability of cleavage site frequencies in eukaryotic genomes needs to be treated on a case-specific basis, whereby the phylogenetic position of the taxon of interest, its genome size, and the probability of the RS of the selected restriction enzyme are the chief foci among the most determinant factors.
The remarkable similarity between probabilities calculated using parameters estimated from nongenomic (transcriptome and “neutral” RAD-seq data sets) and genomic data sets demonstrates the potential of using extant reduced representation data sets for planning further RAD sequencing projects. Although transcriptome data sets by definition are enriched in functional genomic regions (transcribed genes) that are known to be targets of natural selection at different levels (codons, protein domains, etc.) we find no evidence of substantial differences in the underlying mononucleotide, dinucleotide, and trinucleotide compositions compared with the overall genome-wide compositions. This observation is consistent with previous studies showing that genomic composition does not vary significantly between noncoding and coding regions (Karlin and Mrázek 1997; Karlin et al. 1998; Gentles and Karlin 2001). In the cases of RAD-seq data sets, there are clear biases in the underlying mononucleotide, dinucleotide, and trinucleotide compositions for data sets generated with restriction enzymes targeting “nonneutral” RSs (e.g., NotI, SgrAI, NgoMIV, SbfI, BsrFI) (figs. 7 and 8) compared with the overall genome-wide compositions, as evidenced by the calculated RS probabilities. As discussed above, these biases are likely caused in part by associations with conserved regions under strong selective pressures. RAD-seq data sets generated with restriction enzymes that are known to target nonneutral RSs should not be utilized for genome size estimation and restriction RS probability calculation as these would likely yield biased inferences.
Applications to Study Design with RAD-seq and Related Methodologies
For the design of a study using RAD-seq, or a related methodology, there are two fundamental questions that researchers commonly face: 1) what is the best restriction enzyme to use to obtain a desired number of RAD tags in the organism of interest? and 2) how many markers can be obtained with a particular enzyme in the organism of interest? The results from this study coupled with the developed software pipeline PredRAD will allow any researcher to obtain an approximate answer to these questions. The flow diagram in figure 9 illustrates a suggested workflow.
Fig. 9.—

Suggested workflow to obtain an approximation to the number of cleavage sites for a set of restriction enzymes in a species of interest. Yellow boxes indicate question checkpoints, blue boxes indicate experimental steps, and red boxes indicate computational steps that can be carried out with the PredRAD analytical pipeline.
In a best-case scenario for the practical design of a study using RAD-seq, or a related methodology, the species of interest is already included in the database presented here. In this case, the best proxy for the estimated number of RAD tags that could be obtained empirically through classic RAD-seq (Baird et al. 2008) would be twice the number of in silico observed cleavage sites for each restriction enzyme (each cleavage site is expected to produce two RAD tags, one in each direction from the cleavage site) minus the number of in silico tags that align to multiple regions in the genome. In the case of ddRAD and other methodologies that predominantly sequence in only one direction from the cleavage site (Peterson et al. 2012), the number of markers would then be approximately equal to the number of in silico observed cleavage sites for each restriction enzyme. However, additional combined analysis with the pair of restriction enzymes to be used in ddRAD is necessary in order to gain a more accurate estimate of the number of RAD tags that could be obtained empirically.
For most of the 434 genomes examined in this study, the recovery of RAD-tags after in silico sequencing was notably high, with a median percentage of suppressed alignments to the reference genome assembly of only 3% (supplementary fig. S8, Supplementary Material online). We observed no evident recovery bias by restriction enzyme, but rather bias was pronounced in a few individual species, likely indicating an enrichment of repetitive regions or duplications. For library preparation protocols in which a fragment size selection step is done without a prior shearing step, for example, ddRAD (Peterson et al. 2012) and ezRAD (Toonen et al. 2013), the “size.select” function of the software package SimRAD (Lepais and Weir 2014) constitutes a valuable complementary study design tool. If a new genome assembly becomes available for the target species and/or the researcher wishes to evaluate an additional restriction enzyme, PredRAD can be utilized with these data to quantify the number of cleavage sites and the recovery potential, as well as to estimate the probability of the new RS based on genome composition models.
In the scenario that the genome sequence of the species of interest is not available, the genome size and restriction RS probability for the enzyme(s) of interest can be estimated to obtain an approximation of RS frequencies (absolute numbers). Our observations demonstrate that a genome size range can be estimated by applying linear regression models to the number of markers obtained in an empirical RAD-seq experiment using a restriction enzyme targeting a neutral RS (e.g., EcoRI, NsilI, NspI, PciI; we advise caution using 4-cutter enzymes as in some taxa they can have cleavage frequencies that may effectively lead to sequencing the whole genome through RAD-seq [i.e., more than one cleavage site per 100 bp]). Alternatively, genome size can also be estimated via flow cytometry and/or Feulgen densitometry (Vinogradov 1994; Hardie et al. 2002; Dolezel et al. 2007) for comparison. A range of restriction RS probabilities can be obtained through genome composition models using parameters estimated from nongenomic reduced representation data sets, such as transcriptomes, neutral RAD-seq data sets, or even partial genome sequences, for the species of interest. Nongenomic data sets from closely related species could also be used to estimate these parameters, although the effect of evolutionary divergence on compositional differences warrants further exploration. Similarly, examination of other restriction enzymes with diverse RSs, in addition to the ones examined in this study, promises great potential to identify “gold standard” sets of enzymes for groups of taxa, with the goal of obtaining neutral RAD-seq datasets.
Although genome size and the relative frequency (probability) of restriction RSs are arguably the main determinant factors influencing the number of RAD tag markers that can be obtained experimentally, there are other factors that need to be considered during study design and data analysis steps. These include the following: genome differences among individuals; level of heterozygosity; the amount of methylation and other DNA modifications in the genome; the sensitivity of a particular cleavage enzyme to methylation and other DNA modifications; the efficiency of the enzymatic digestion; the number of repetitive regions and gene duplicates present in the target genome; the quality of library preparation and sequencing; the amount of sequencing; sequencing and library preparation biases; and the parameters used to clean, cluster, and analyze the data, among others, see Davey et al. (2013), Catchen et al. (2013), DaCosta and Sorenson (2014), and Mastretta-Yanes et al. (2014) for further discussions.
Conclusions
In this study, we performed systematic in silico genome-wide surveys of genome compositions and RSs, for diverse and commonly used type II restriction enzymes across the eukaryotic tree of life. Our observations reveal that RS frequencies for a given restriction enzyme are strikingly variable among broad eukaryotic taxonomic groups, being largely determined by phylogenetic relatedness. We demonstrate that genome sizes can be predicted from cleavage frequency data obtained with restriction enzymes targeting neutral RSs. Stochastic models based on genomic compositions are also effective tools to accurately calculate probabilities of RSs across taxa, and can be applied to species for which reduced representation genomic data are available (including transcriptomes and neutral RAD-seq datasets). The results from this study and the software developed from it will help guide the design of any study using RAD sequencing and related methods. As more genome assemblies become available in underrepresented taxonomic groups, the patterns of compositional biases and restriction site frequencies across the eukaryotic tree of life will become clearer and will improve our understanding of genome evolution.
Supplementary Material
Acknowledgments
Acknowledgments
This research was supported by the Office of Ocean Exploration and Research of the National Oceanic and Atmospheric Administration (NA09OAR4320129 to T.S.); the Division of Ocean Sciences of the National Science Foundation (OCE-1131620 to T.S.); the Astrobiology Science and Technology for Exploring Planets program of the National Aeronautics and Space Administration (NNX09AB76G to T.S.); and the Academic Programs Office (Ocean Ventures Fund to S.H.), the Ocean Exploration Institute (Fellowship support to T.M.S.), and the Ocean Life Institute of the Woods Hole Oceanographic Institution (internal grant to T.M.S. and S.H.). We thank Adam Reitzel, Ann Tarrant, and Casey Dunn for helpful discussions. Ann Tarrant, Eleanor Bors, Annette Govindarajan, and Jill McDermott provided constructive comments on this manuscript. We also thank GBE’s Associate Editor, Cécile Ané, and four anonymous reviewers for objective and intuitive comments that improved this manuscript.
Supplementary Material
Supplementary figures S1–S9 and tables S1 and S2 are available at Genome Biology and Evolution online (http://www.gbe.oxfordjournals.org/).
Appendix
A. Genomic Composition Patterns across the Eukaryotic Tree of Life
The odds ratios proposed by Burge et al. (1992) were used to estimate compositional biases of dinucleotides (eq. 5) and trinucleotides (eq. 6) across genomes. as follows:
| (5) |
| (6) |
where is the relative frequency of the mononucleotide X, is the relative frequency of the dinucleotide XY, and is the relative frequency of the trinucleotide XYZ. All frequencies take into account the antiparallel structure of dsDNA. N represents any mononucleotide. Both dinucleotides and trinucleotides are considered significantly underrepresented if the odds ratio is ≤0.78, significantly overrepresented if ≥1.23, and equal to expectation if equal to 1 (Karlin et al. 1998).
Our surveys of whole and draft genome sequence assemblies indicate that there are significant compositional biases for most dinucleotides and trinucleotides across the eukaryotes. Many of these biases are significant only within individual species scattered throughout the eukaryotic tree of life. However, there are several particular dinuclotides and trinucleotides that show significant biases across the eukaryotic tree of life. The dinucleotides CG, GC, TA, and CA/TG, and the trinucleotides CTA/TAG, AAA/TTT, TAA/TTA, and CCA/TGG show the most conspicuous bias patterns. Our observation that these biases are highly variable among broad taxonomic groups but generally similar within is congruent with findings from previous studies (Gentles and Karlin 2001). The most obvious biases across taxa are observed in the gnatostomate vertebrates; however, this is most likely due to rampant undersampling in most other groups of eukaryotes (vertebrate genome assemblies represent 21% of all the taxa in this study).
B. Dinucleotide Compositional Biases
Dinucleotide odds ratios () (Burge et al. 1992), a measurement of relative dinucleotide abundances given observed component frequencies used to explore genomic compositional biases, revealed significant compositional biases for all possible dinucleotides (supplementary fig. S9, Supplementary Material online). The dinucleotide compositional biases were highly variable among broad taxonomic groups (e.g., core eudicot plants) but generally similar within. Two dinucleotide complementary pairs, CG/GC and AT/TA, had highly dissimilar relative frequencies between the members of each pair. The largest biases were for CG, being significantly underrepresented in groups like core eudicot plants ( = 0.68 ± 0.11), gnathostomate vertebrates ( = 0.32 ± 0.12), the Pucciniales rust fungi ( = 0.66 ± 0.08), gastropod mollusks ( = 0.68, SD = 0.01), the Trebouxiophyceae green algae ( = 0.61 ± 0.19), and the Saccharomycetales yeast ( = 0.78 ± 0.17). CG was significantly overrepresented in groups like the Apocrita insects ( = 1.59 ± 0.18). The complementary dinucleotide GC was not particularly underrepresented in any broad taxonomic group, but tended toward overrepresentation in ecdysozoan invertebrates ( = 1.24 ± 0.12), being significant in several arthropod and nematode species. Other taxa that showed significant overrepresentation of GC dinucleotides included the Trebouxiophyceae ( = 1.39 ± 0.04) and microsporidia fungi ( = 1.28 ± 0.17). Relative abundances of the dinucleotide AT were within expectations for all eukaryotes, except for the fungus Sporobolomyces roseus ( = 0.78). Contrastingly, the TA dinucleotide tended toward underrepresentation throughout the eukaryotes ( = 0.8 ± 0.13), except in a few hypocreomycetid fungal species, for which it was significantly underrepresented. The TA dinucleotide was significantly underrepresented in trypanosomatids ( = 0.59 ± 0.03), choanoflagellids ( = 0.43 ± 0.09), chlorophytes ( = 0.62 ± 0.15), and stramenopiles ( = 0.70 ± 0.07), and marginally underrepresented in most euteleostei fish ( = 0.77 ± 0.04), archosaurs ( = 0.76 ± 0.03), and the Basidiomycota ( = 0.74 ± 0.09), among others.
The remaining dinucleotides had identical relative frequencies between the members of each complementary pair. The dinucleotide pair GG/CC was marginally underrepresented in most eukaryotes ( = 0.88 ± 0.15). In the Sarcopterygii vertebrates ( = 1.02 ± 0.06) and embryophyte plants ( = 1.03 ± 0.07), GG/CC relative frequencies closely conformed to expectation, whereby GG/CC was significantly overrepresented in handful of isolated ecdysozoan, microsporidia, and alveolate species, and significantly underrepresented in chlorophytes ( = 0.72, SD = 0.11), oomycetes ( = 0.71 ± 0.05), and in several species of the Basidiomycota and the Dothideomycetes. Only the choanoflagellate Salpingoeca and the green alga Asterochloris presented a marginally significant bias for the dinucleotide pair AA/TT ( = 0.77 and 0.75, respectively). Similarly, Salpingoeca was the only taxon to show a significant bias for AC/GT ( = 1.42). Dinucleotide pair CA/TG was among the pairs with largest biases. Significant overrepresentation of CA/TG was found in several groups with large CG underrepresentation such as gnathostomates ( = 1.31 ± 0.05), gastropods ( = 1.29 ± 0.05), the Pucciniales ( = 1.27 ± 0.02), the Trebouxiophyceae ( = 1.62 ± 0.14), as well as several species of core eudicots and the Saccharomycetales. Other groups with significant CA/TG overrepresentation include onchocercid nematodes ( = 1.26 ± 0.01), the Ustilaginomycotina fungi ( = 1.28 ± 0.05), trypanosomatids ( = 1.25 ± 0.04), and amoebozoans ( = 1.33 ± 0.06). Overrepresentation biases for the AG/CT dinucleotide pair were only present in amniotes ( = 1.26 ± 0.02), the Sporidiobolales fungi ( = 1.24 ± 0.01), and oxytrichid alveolates ( = 1.24 ± 0.04), and other isolated species. Most of these taxa also had large CG underrepresentation. Finally, most eukaryotes had GA/TC relative frequencies that conformed to expectations, except for few scattered species and small groups such as the Microbotryomycetes fungi ( = 1.45 ± 0.13), the Mamiellales green algae ( = 1.40 ± 0.08), and the Eimeriorina alveolates ( = 1.26 ± 0.02).
Biases in most of these dinucleotides are likely linked to important biological processes. Notably, the underrepresented dinucleotide CG is a widely known target for methylation related to transcriptional regulation (Bird 1980) and retrotransposon inactivation (Yoder et al. 1997) in vertebrates and eudicots. The corresponding overrepresentation of AG/CT fits the classic model of “methylation-deamination-mutation” by which a methylated cytosine in the CG pair tends to deaminate when unpaired and mutate into a thymidine with a corresponding CA complement. Interestingly, CG and GC dinucleotides are significantly overrepresented in several groups of apocritic insects, as well as in some fungi and single-cell eukaryotes. CG is not a primary target for methylation in Drosophila (Lyko et al. 2000), instead CT, and in lesser degree CA and CC, are methylated in higher proportion. None of these dinucleotide pairs is significantly underrepresented in apocritic insects. The widespread TA underrepresentation has been traditionally attributed to stop codon biases, thermodynamic instability, and susceptibility of UA to cleavage by RNAses in RNA transcripts (Beutler et al. 1989).
C. Trinucleotide Compositional Biases
Trinucleotide odds ratios () (Burge et al. 1992) are another important measurement used to explore genomic compositional biases. Among the examined taxa, these ratios revealed compositional biases for most possible trinucleotides (supplementary fig. S10, Supplementary Material online). However, most of these biases were only significant in scattered individual species (supplementary fig. S11, Supplementary Material online). Among the trinucleotide pairs with significant underrepresentation, CTA/TAG and CGA/TCG showed the most definite broad taxonomic patterns. CTA/TAG was significantly underrepresented in most taxa, except for groups like commelinid plants (monocots) ( = 0.87 ± 0.03), most core eudicots ( = 0.81 ± 0.02), eleutherozoans ( = 0.82 ± 0.01), molluscs ( = 0.83 ± 0.01), and gnathostomates ( = 0.82 ± 0.02)—exclusive of the chimaera Callorhinchus milii. Contrastingly, the trinucleotide CGA/TCG was only significantly underrepresented in most tetrapod vertebrates ( = 0.82 ± 0.02)—exclusive of muroid rodents, bovid ruminants, and the Afrotheria—a group containing aarvdvarks, hyraxes, and elephants.
The largest and more widespread overrepresentation biases were for the trinucleotide pair AAA/TTT, being significant in most eukaryotes, except for the majority of the Dikarya fungi ( = 1.18 ± 0.07). The trinucleotide pairs TAA/TTA and AAT/ATT were significantly overrepresented in many metazoan taxa, particularly in the Neopterygii vertebrates ( = 1.3 ± 0.05 and = 1.26 ± 0.05, respectively). AAG/CTT was significantly overrepresented in the Bacillariophyta diatoms ( = 1.24 ± 0.03), oomycetes ( = 1.28 ± 0.02), and the Saccharomycetales ( = 1.26 ± 0.04). Finally, CCA/TTG was significantly overrepresented in several tetrapod groups, including the Laurasiatheria—exclusive of the Chiroptera ( = 1.25 ± 0.02)—and Hominoidea ( = 1.23 ± 0.004).
The biases in CTA/TAG have been widely attributed to the stop codon nature of UAG. However, the trinucleotides corresponding to the other stop codons (Burge et al. 1992), UAA and UGA, are overrepresented or not biased across eukaryotes. The reasons behind other cases of trinucleotide biases are less understood.
Literature Cited
- Abouheif E. 1999. A method for testing the assumption of phylogenetic independence in comparative data. Evol Ecol Res. 1:895–909. [Google Scholar]
- Andersen EC, et al. 2012. Chromosome-scale selective sweeps shape Caenorhabditis elegans genomic diversity. Nat Genet. 44:285–290. [DOI] [PMC free article] [PubMed] [Google Scholar]
- Andolfatto P, et al. 2011. Multiplexed shotgun genotyping for rapid and efficient genetic mapping. Genome Res. 21:610–617. [DOI] [PMC free article] [PubMed] [Google Scholar]
- Baird NA, et al. 2008. Rapid SNP discovery and genetic mapping using sequenced RAD markers. PLoS One 3:e3376. [DOI] [PMC free article] [PubMed] [Google Scholar]
- Bejerano G, et al. 2004. Ultraconserved elements in the human genome. Science 304:1321–1325. [DOI] [PubMed] [Google Scholar]
- Beutler E, Gelbart T, Han J, Koziol JA, Beutler B. 1989. Evolution of the genome and the genetic code: selection at the dinucleotide level by methylation and polyribonucleotide cleavage. Proc Natl Acad Sci U S A. 86:192–196. [DOI] [PMC free article] [PubMed] [Google Scholar]
- Bird AP. 1980. DNA methylation and the frequency of Cpg in animal DNA. Nucleic Acids Res. 8:1499–1504. [DOI] [PMC free article] [PubMed] [Google Scholar]
- Burge C, Campbell AM, Karlin S. 1992. Over- and under-representation of short oligonucleotides in DNA sequences. Proc Natl Acad Sci U S A. 89:1358–1362. [DOI] [PMC free article] [PubMed] [Google Scholar]
- Catchen J, Hohenlohe PA, Bassham S, Amores A, Cresko WA. 2013. Stacks: an analysis tool set for population genomics. Mol Ecol. 22:3124–3140. [DOI] [PMC free article] [PubMed] [Google Scholar]
- DaCosta JM, Sorenson MD. 2014. Amplification biases and consistent recovery of loci in a double-digest RAD-seq protocol. PLoS One 9:e106713. [DOI] [PMC free article] [PubMed] [Google Scholar]
- Davey JW, Blaxter ML. 2011. RADSeq: next-generation population genetics. Brief Funct Genomics 9:416–423. [DOI] [PMC free article] [PubMed] [Google Scholar]
- Davey JW, et al. 2011. Genome-wide genetic marker discovery and genotyping using next-generation sequencing. Nat Rev Genet. 12:499–510. [DOI] [PubMed] [Google Scholar]
- Davey JW, et al. 2013. Special features of RAD sequencing data: implications for genotyping. Mol Ecol. 22:3151–3164. [DOI] [PMC free article] [PubMed] [Google Scholar]
- Dolezel J, Bartos J. 2005. Plant DNA flow cytometry and estimation of nuclear genome size. Ann Bot. 95:99–110. [DOI] [PMC free article] [PubMed] [Google Scholar]
- Dolezel J, Greilhuber J, Suda J. 2007. Estimation of nuclear DNA content in plants using flow cytometry. Nat Protoc. 2:2233–2244. [DOI] [PubMed] [Google Scholar]
- Dunn CW, Ryan JF. 2015. The evolution of animal genomes. Curr Opin Genet Dev. 35:25–32. [DOI] [PubMed] [Google Scholar]
- Eaton DAR, Ree RH. 2013. Inferring phylogeny and introgression using RADseq data: an example from flowering plants (Pedicularis: Orobanchaceae). Syst Biol. 62:689–706. [DOI] [PMC free article] [PubMed] [Google Scholar]
- Elshire RJ, et al. 2011. A robust, simple genotyping-by-sequencing (GBS) approach for high diversity species. PLoS One 6:e19379. [DOI] [PMC free article] [PubMed] [Google Scholar]
- Emerson KJ, et al. 2010. Resolving postglacial phylogeography using high-throughput sequencing. Proc Natl Acad Sci U S A. 107:16196–16200. [DOI] [PMC free article] [PubMed] [Google Scholar]
- Federhen S. 2012. The NCBI Taxonomy database. Nucleic Acids Res. 40:D136–D143. [DOI] [PMC free article] [PubMed] [Google Scholar]
- Gentles AJ, Karlin S. 2001. Genome-scale compositional comparisons in eukaryotes. Genome Res. 11:540–546. [DOI] [PMC free article] [PubMed] [Google Scholar]
- Hardie DC, Gregory TR, Hebert PD. 2002. From pixels to picograms: a beginners’ guide to genome quantification by Feulgen image analysis densitometry. J Histochem Cytochem. 50:735–749. [DOI] [PubMed] [Google Scholar]
- Herrera S, Shank TM. 2015. RAD sequencing enables unprecedented phylogenetic resolution and objective species delimitation in recalcitrant divergent taxa. bioRxiv. 019745: 1–44. [DOI] [PubMed] [Google Scholar]
- Herrera S, Watanabe H, Shank TM. 2015. Evolutionary and biogeographical patterns of barnacles from deep-sea hydrothermal vents. Mol Ecol. 24:673–689. [DOI] [PMC free article] [PubMed] [Google Scholar]
- Hinchliff CE, et al. 2015. Synthesis of phylogeny and taxonomy into a comprehensive tree of life. Proc Natl Acad Sci U S A. 112:12764–12769. [DOI] [PMC free article] [PubMed] [Google Scholar]
- Hohenlohe PA, et al. 2010. Population genomics of parallel adaptation in threespine stickleback using sequenced RAD tags. PLoS Genet. 6:e1000862. [DOI] [PMC free article] [PubMed] [Google Scholar]
- Jombart T, Balloux F, Dray S. 2010. Adephylo: new tools for investigating the phylogenetic signal in biological traits. Bioinformatics 26:1907–1909. [DOI] [PubMed] [Google Scholar]
- Karlin S, Burge C, Campbell AM. 1992. Statistical analyses of counts and distributions of restriction sites in DNA sequences. Nucleic Acids Res. 20:1363–1370. [DOI] [PMC free article] [PubMed] [Google Scholar]
- Karlin S, Campbell AM, Mrázek J. 1998. Comparative DNA analysis across diverse genomes. Annu Rev Genet. 32:185–225. [DOI] [PubMed] [Google Scholar]
- Karlin S, Mrázek J. 1997. Compositional differences within and between eukaryotic genomes. Proc Natl Acad Sci U S A. 94:10227–10232. [DOI] [PMC free article] [PubMed] [Google Scholar]
- Katzman S, et al. 2007. Human genome ultraconserved elements are ultraselected. Science 317:915. [DOI] [PubMed] [Google Scholar]
- Langmead B, Trapnell C, Pop M, Salzberg SL. 2009. Ultrafast and memory-efficient alignment of short DNA sequences to the human genome. Genome Biol. 10:R25. [DOI] [PMC free article] [PubMed] [Google Scholar]
- Lepais O, Weir JT. 2014. SimRAD: an R package for simulation-based prediction of the number of loci expected in RADseq and similar genotyping by sequencing approaches. Mol Ecol Resour. 14:1314–1321. [DOI] [PubMed] [Google Scholar]
- Lyko F, Ramashoye BH, Jaenisch R. 2000. DNA methylation in Drosophila melanogaster. Nature 408:538–540. [DOI] [PubMed] [Google Scholar]
- Mastretta-Yanes A, et al. 2014. Restriction site-associated DNA sequencing, genotyping error estimation and de novo assembly optimization for population genetic inference. Mol Ecol Resour. 15:28–41. [DOI] [PubMed] [Google Scholar]
- Miller MR, Dunham JP, Amores A, Cresko WA, Johnson EA. 2007. Rapid and cost-effective polymorphism identification and genotyping using restriction site associated DNA (RAD) markers. Genome Res. 17:240–248. [DOI] [PMC free article] [PubMed] [Google Scholar]
- Miller W, Rosenbloom K, et al. 2007. 28-Way vertebrate alignment and conservation track in the UCSC Genome Browser. Genome Res. 17:1797–1808. [DOI] [PMC free article] [PubMed] [Google Scholar]
- Münkemüller T, et al. 2012. How to measure and test phylogenetic signal. Methods Ecol Evol. 3:743–756. [Google Scholar]
- Paradis E, Claude J, Strimmer K. 2004. APE: analyses of phylogenetics and evolution in R language. Bioinformatics 20:289–290. [DOI] [PubMed] [Google Scholar]
- Pavoine S, Ollier S, Pontier D, Chessel D. 2008. Testing for phylogenetic signal in phenotypic traits: new matrices of phylogenetic proximities. Theor Popul Biol. 73:79–91. [DOI] [PubMed] [Google Scholar]
- Peterson BK, Weber JN, Kay EH, Fisher HS, Hoekstra HE. 2012. Double digest RADseq: an inexpensive method for de novo SNP discovery and genotyping in model and non-model species. PLoS One 7:e37135. [DOI] [PMC free article] [PubMed] [Google Scholar]
- Rambach A, Tiollais P. 1974. Bacteriophage having EcoRI endonucleases sites only in the nonessential sites of the genome. Proc Natl Acad Sci U S A. 71:3927–3930. [DOI] [PMC free article] [PubMed] [Google Scholar]
- Reitzel AM, Herrera S, Layden MJ, Martindale MQ, Shank TM. 2013. Going where traditional markers have not gone before: utility of and promise for RAD sequencing in marine invertebrate phylogeography and population genomics. Mol Ecol. 22:2953–2960. [DOI] [PMC free article] [PubMed] [Google Scholar]
- Rocha EPC, Danchin A, Viari A. 2001. Evolutionary role of restriction/modification systems as revealed by comparative genome analysis. Genome Res. 11:946–958. [DOI] [PubMed] [Google Scholar]
- Scaglione D, et al. 2012. RAD tag sequencing as a source of SNP markers in Cynara cardunculus L. BMC Genomics 13:3. [DOI] [PMC free article] [PubMed] [Google Scholar]
- Siepel A, et al. 2005. Evolutionarily conserved elements in vertebrate, insect, worm, and yeast genomes. Genome Res. 15:1034–1050. [DOI] [PMC free article] [PubMed] [Google Scholar]
- Singh GB. 2009. Stochastic models for biological patterns. In: Krawetz S, editor. Bioinformatics for systems biology. New York: Springer; p. 151–162. [Google Scholar]
- Šmarda P, Bureš P, Šmerda J, Horová L. 2011. Measurements of genomic GC content in plant genomes with flow cytometry: a test for reliability. New Phytol. 193:513–521. [DOI] [PubMed] [Google Scholar]
- Toonen RJ, et al. 2013. ezRAD: a simplified method for genomic genotyping in non-model organisms. PeerJ. 1:e203. [DOI] [PMC free article] [PubMed] [Google Scholar]
- Vinogradov A. 1998. Genome size and GC-percent in vertebrates as determined by flow cytometry: the triangular relationship. Cytometry 31:100–109. [DOI] [PubMed] [Google Scholar]
- Vinogradov A. 1994. Measurement by flow cytometry of genomic AT/GC ratio and genome size. Cytometry 16:34–40. [DOI] [PubMed] [Google Scholar]
- Wagner CE, et al. 2012. Genome-wide RAD sequence data provide unprecedented resolution of species boundaries and relationships in the Lake Victoria cichlid adaptive radiation. Mol Ecol. 22:787–798. [DOI] [PubMed] [Google Scholar]
- Wang J, et al. 2013. A Y-like social chromosome causes alternative colony organization in fire ants. Nature 493:664–668. [DOI] [PubMed] [Google Scholar]
- Weber JN, Peterson BK, Hoekstra HE. 2013. Discrete genetic modules are responsible for complex burrow evolution in Peromyscus mice. Nature 493:402–405. [DOI] [PubMed] [Google Scholar]
- White TA, Perkins SE, Heckel G, Searle JB. 2013. Adaptive evolution during an ongoing range expansion: the invasive bank vole (Myodes glareolus) in Ireland. Mol Ecol. 22:2971–2985. [DOI] [PubMed] [Google Scholar]
- Yoder JA, Walsh CP, Bestor TH. 1997. Cytosine methylation and the ecology of intragenomic parasites. Trends Genet. 13:335–340 [DOI] [PubMed] [Google Scholar]
Associated Data
This section collects any data citations, data availability statements, or supplementary materials included in this article.