

Abstract
Although prokaryotes are usually classified using molecular phylogenies instead of phenotypes after the advent of gene sequencing, neither of these methods is satisfactory because the phenotypes cannot explain the molecular trees and the trees do not fit the phenotypes. This scientific crisis still exists and the profound disconnection between these two pillars of evolutionary biology—genotypes and phenotypes—grows larger. We use rings and a genomic form of goods thinking to resolve this conundrum (McInerney JO, Cummins C, Haggerty L. 2011. Goods thinking vs. tree thinking. Mobile Genet Elements. 1:304–308; Nelson-Sathi S, et al. 2015. Origins of major archaeal clades correspond to gene acquisitions from bacteria. Nature 517:77–80). The Proteobacteria is the most speciose prokaryotic phylum known. It is an ideal phylogenetic model for reconstructing Earth’s evolutionary history. It contains diverse free living, pathogenic, photosynthetic, sulfur metabolizing, and symbiotic species. Due to its large number of species (Whitman WB, Coleman DC, Wiebe WJ. 1998. Prokaryotes: the unseen majority. Proc Nat Acad Sci U S A. 95:6578–6583) it was initially expected to provide strong phylogenetic support for a proteobacterial tree of life. But despite its many species, sequence-based tree analyses are unable to resolve its topology. Here we develop new rooted ring analyses and study proteobacterial evolution. Using protein family data and new genome-based outgroup rooting procedures, we reconstruct the complex evolutionary history of the proteobacterial rings (combinations of tree-like divergences and endosymbiotic-like convergences). We identify and map the origins of major gene flows within the rooted proteobacterial rings (P < 3.6 × 10⁻⁶) and find that the evolution of the “Alpha-,” “Beta-,” and “Gammaproteobacteria” is represented by a unique set of rings. Using new techniques presented here we also root these rings using outgroups. We also map the independent flows of genes involved in DNA-, RNA-, ATP-, and membrane- related processes within the Proteobacteria and thereby demonstrate that these large gene flows are consistent with endosymbioses (P < 3.6 × 10⁻⁹). Our analyses illustrate what it means to find that a gene is present, or absent, within a gene flow, and thereby clarify the origin of the apparent conflicts between genotypes and phenotypes. Here we identify the gene flows that introduced photosynthesis into the Alpha-, Beta-, and Gammaproteobacteria from the common ancestor of the Actinobacteria and the Firmicutes. Our results also explain why rooted rings, unlike trees, are consistent with the observed genotypic and phenotypic relationships observed among the various proteobacterial classes. We find that ring phylogenies can explain the genotypes and the phenotypes of biological processes within large and complex groups like the Proteobacteria.
Keywords: phylogenetic classification, genotypes, phenotypes, rooting rings, endosymbioses, chlorophylls, gene losses/gains
Introduction
Before gene sequencing was possible prokaryotes were classified according to their phenotypes using descriptors like “purple photosynthetic” or “green photosynthetic.” But with the advent of gene sequencing, they were classified using molecular phylogenetic trees. Almost immediately a crisis arose because these two presumably equivalent descriptions of evolution, genotype and phenotype, were contradictory. This issue still exists but has been largely ignored. Here we show that rings, unlike trees, allow one to see the connections between genotypes and phenotypes as alternative views of one evolutionary roadmap.
The importance of ring-like evolution has increasingly been recognized because, unlike molecular trees, rings can simultaneously accommodate two major modes of evolution: Tree-like bifurcations and endosymbiotic-like fusions. Thus rings can provide extremely general representations of evolutionary history. To illustrate their ability to provide a framework for understanding the evolution of life, consider the major gene flows present in the rings of life summarized in figure 1.
Fig. 1.—

The rings of life are summarized in this figure. The eukaryotes, shown in purple at the top of the rings, are the result of the convergence of multiple gene flows. The Proteobacteria are present in the upper left green ring representing the flow from the double membrane prokaryotes into the eukaryotes (Lake 2009a, 2009b) that introduced mitochondria and chloroplasts into the eukaryotes (shown in purple). A second flow of genes into the eukaryotes is shown in cyan at the top right. It corresponds to the gene flow that transported informational genes into the eukaryotic nucleus from the eocytes. This gene flow includes many proteins and RNAs that are involved in fundamental cell/molecular processes that are unique to eukaryotes and eocytes. Examples include the eocyte/eukaryotic ribosomal apparatus for protein synthesis, the mechanisms for RNA transcription, and the unique chromatins that are used for the bundling of chromosomes into nucleosomes. The root of the rings of life is shown at the lower left of the figure. This set of rings leads to the Actinobacteria, to the Firmicutes, to the Halobacteria, and to the double membrane prokaryotes, including the Proteobacteria.
In the upper ring, the green path represents genes (Rivera and Lake 2004) flowing from the double membrane prokaryotes into the eukaryotes, shown in purple at the top of the rings. This flow includes the photosynthetic gene flow (Nelson-Sathi et al. 2012) that subsequently produced the chloroplasts, mitochondria, and possibly a host organism for the eukaryotic nucleus (Rivera and Lake 2004). The flow shown in magenta at the top right of the upper ring represents the informational gene flow into the Eocytes and the Eukaryotes (Lake et al. 1984; Lake 1988; Cox et al. 2008; Williams et al. 2013; McInerney et al. 2014), and the phototrophic gene flow shown in yellow represents the beginnings of light-driven ATP (AdenosineTriPhosphate) biosynthesis (Lake et al. 1985). At the bottom of figure 1 the root of the rings of life is represented by the three rooted rings shown in blue, yellow, orange, green, and white (Lake and Sinsheimer 2013).
Note that the Proteobacteria emerge from a gene flow that is formed by the merger of two ancestral gene flows, the Actinobacterial (blue) and the Firmicute (green) gene flows. The rooted rings of life predict that the Actinobacteria and the Firmicutes fused to form the bouble membrane prokaryotes (Lake 2009a, 2009b). Because it was a fusion it defines “two” independent taxa, the Actinobacteria and the Firmicutes. Either of these two can be used to root the Proteobacteria. Thus gene presence–absence analyses of proteobacterial evolution that use either the Actinobacteria or the Firmicutes as immediate outgroups are predicted to support identical graphs. In contrast, the Halobacteria is a partial outgroup that is derived from two gene flows, only one of which flows into the Proteobacteria.
Reconstructing the evolution of the Proteobacteria is an important scientific goal in itself. Few other prokaryotic phyla, aside from the Cyanobacteria, have influenced Earth’s evolution so dramatically. For example, the Proteobacteria impacted eukaryotic evolution by producing the ancestral mitochondrion, thought to have been an Alphaproteobacterium. Furthermore, the Proteobacteria is the most speciose prokaryotic phylum on Earth and 44% of all known prokaryotic species are contained within it (Whitman et al. 1998). It consists of diverse free living, pathogenic, photosynthetic, sulfur metabolizing, and symbiotic species. Its history can tell us much about the diversification of life on Earth.
Proteobacterial History
Early classifications of photosynthetic prokaryotic diversity (Stanier et al. 1976) were based on prokaryotic phenotypes represented by processes such as photosynthesis and sulfur metabolisms. The two photosynthetic groups identified in these early studies were called the purple sulfur bacteria and the purple nonsulfur bacteria. The purple sulfur bacteria use sulfide or elemental sulfur as reducing agents and bacterial chlorophyll a for photosynthesis, whereas the purple nonsulfur bacteria use hydrogen and bacterial chlorophyll b for photosynthesis.
When the polymerase chain reaction made 16S ribosomal RNAs easy to sequence, new Proteobacterial classes were proposed on the basis of tree reconstructions and the purple bacteria were renamed the Proteobacteria. But the Proteobacterial classes did not fit the phenotypic classifications because some, but not all, Alpha-, Beta-, and Gammaproteobacteria are photosynthetic. Even today the analyses of entire genomes can neither resolve the phylogenetic relationships among proteobacterial classes, nor can they explain the phylogenetic distributions of well-known proteobacterial phenotypes such as photosynthesis. For example, the group originally known as the purple sulfur bacteria is present in two distinct classes (the Beta- and Gammaproteobacteria), and the group originally known as the purple nonsulfur bacteria is present in a different set of classes, the Alpha- and Betaproteobacteria. These two phenotypic classifications clearly conflict with all possible trees, because the Betaproteobacteria contain both purple sulfur and purple nonsulfur bacteria.
But how and why this happened remained unknown. The initial optimism that genomics could pinpoint major events in the evolution of the Proteobacteria vanished when neither ribosomal RNA- nor whole genome- based trees could explain the mutually contradictory distributions of photosynthesis and bacterial chlorophylls within the Proteobacteria. Even with large numbers of proteobacterial species available for analysis, no statistically significant tree-like phylogenetic signals could relate the proteobacterial classes to each other (Lerat et al. 2004), and sophisticated tree reconstructions (Creevey et al. 2004) could only resolve the relationships “within” the proteobacterial classes located at the tips of trees. Some suggested that this might be due to lateral gene transfers (LGTs), “… there is too little phylogenetic signal to permit firm conclusions about the mode of inheritance. Although there is clearly a central tendency in this data set … lateral gene transfers cannot be ruled out” (Susko et al. 2006). Recently, a comprehensive study showed that highly asymmetric “…transfers from bacteria to archaea are more than fivefold more frequent than vice versa” (Nelson-Sathi et al. 2015). Others recognized this problem and referred to it as the “Tree of One Percent” (Dagan and Martin 2006). In another comprehensive analysis of 329 proteobacteria genomes, the Gammaproteobacteria were categorized as showing “… the most chameleon-like evolutionary characteristics” (Kloesges et al. 2011). New evidence for a large photosynthetic flow of more than a thousand genes (Nelson-Sathi et al. 2012) and for the related phototrophic flow (Lake et al. 1985; Lake and Sinsheimer 2013), however, suggested that it might be possible to reconstruct the flow of photosynthesis within the Proteobacteria (Archibald 2008).
Motivated to understand the evolutionary origin of these major conflicts in terms of known evolutionary processes, we asked whether rings could explain the differences between proteobacterial genotypes and phenotypes. Using genome and protein family presence/absence analyses (Lake 2009a, 2009b; Lake and Sinsheimer 2013) and by devising new methods to root rings we reconstruct the evolution of the Alpha-, Beta-, and Gammaproteobacteria.
Results
An Overview of the Proteobacterial Rings
Ring analyses (Lake 2009a, 2009b; Rivera and Lake 2004) have been used to reconstruct major evolutionary gene flows within the rings of life. Using new, but related, methods we reconstruct the rings describing the evolution of the Alpha (A)-, Beta (B)-, and Gamma (Γ)-proteobacteria.
In the overview of the rings shown in figure 2 (Lake and Sinsheimer 2013), the gene flow originating from the local root (shown by the yellow arrow at the bottom of the rings) first divides into a yellow gene flow (on the left) and an orange gene flow (on the right). The yellow gene flow then bifurcates to form the cyan and the magenta gene flows that lead to the Alphaproteobacteria and the Betaproteobacteria, respectively. Subsequently, these two gene flows converge and form the purple gene flow which then merges with the orange flow and they ultimately form the Gammaproteobacteria.
Fig. 2.—

The gene flows representing the evolution of the A-, B-, and Γ- Proteobacteria are labeled and color coded. The start of the AΓ gene flow is marked by the cyan rectangle labeled αγ, the start of the ABΓ gene flow is marked by the yellow rectangle labeled αβγ, and the start of the BΓ gene flow is marked by the magenta rectangle labeled βγ.
The presence–absence counts that accompany these flows are shown in table 1. The three largest gene flows, marked in red in table 1, correspond to the flows of 619 Pfams into the Beta- and Gammaproteobacteria (−,+,+); 389 Pfams into the Alpha- and Gammaproteobacteria (+,−,+), and 3511 Pfams into the Alpha-, Beta-, and Gammaproteobacteria (+,+,+). It should be noted that, similar to three taxon tree reconstructions, the counts for the +++, + − −, − + −, and − − + ring terms are phylogenetically uninformative. This is because all rooted trees and rings have roots, represented by the term +++, and because all rooted trees and rings have external branches (represented by the terms + − −, − + −, and − − +).
Table 1.
Gene Presence/Absences
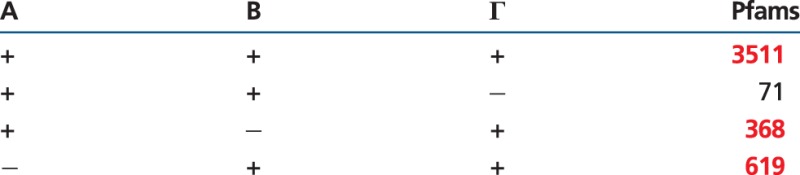 |
Note.—Significant Pfam flows are in red.
Thus when analyzing significant and nonsignificant patterns, only the patterns with two +’s are topologically informative. By using chi-squared probability ratios to evaluate whether 71 and 368, or 368 and 619 are drawn from the same normally distributed populations, we find that 368 and 619 are 1.33225 × 1030 times more likely to have been drawn from the same population than are 71 and 368. Hence the alpha–gamma (368) and beta–gamma (619) gene flows are inferred to be present in figure 2. The start sites for these two gene flows are labeled in figure 2.
Rooting the Rings
When roots are known, ring reconstructions are simplified. Recently, indels (inserts/deletions in genes) were used to root the rings of life shown in figure 1 (Lake and Sinsheimer 2013). Because the most reliable genomic-based rooting information is often provided by indels and because those indels used for the rooting in figure 1 had extremely strong statistical support, this provided an opportunity to test whether our ring analyses can provide additional support for the rooted rings.
Our analyses utilize ring outgroup rooting, a new algorithm developed here, to further test the rooted proteobacterial rings. Ring outgroup rooting allows one to test whether potential roots are valid or not. Outgroups to the Proteobacteria were discovered when the root of life was localized “to a segment of the deepest ring (P < 10−21 and P < 10−194)” using indel rooting (Lake and Sinsheimer 2013). Based on this rooting we obtained evidence that two lineages (one from the Actinobacteria and the other from the Firmicutes) merged to form the gene flow leading to the Proteobacteria (fig. 1).
Because gene flows from the Actinobacteria and from the Firmicutes merge to form the stem lineage leading to the Proteobacteria, either can be used to root the proteobacterial rings. The merger of these two gene flows makes it possible to test whether the indel-based root of the proteobacterial rings will also be recovered from ring analyses. The rings shown in figure 1 predict that the Halobacteria cannot be used to root the Proteobacteria because only one of the gene flows leading to the Halobacteria (the yellow flow) directly connects with the Proteobacteria. Although the orange gene flow also enters the Halobacteria (shown in fig. 1), it does not flow into the Proteobacteria and hence cannot be used to root the proteobacterial rings. Although the Halobacteria is not a valid outgroup, it nevertheless serves as a negative control for our analyses.
Rooting the Proteobacteria
To test whether the Actinobacteria, the Firmicutes, and the Halobacteria are outgroups to the Proteobacteria, we analyzed the relevant four-taxon Pfam presence/absence tables shown in table 2. Subtable 1, on the left, relates the Proteobacteria to the Actinobacteria; subtable 2, in the middle, relates the Proteobacteria to the Firmicutes; and subtable 3, on the right, relates the Proteobacteria to the Halobacteria. As in table 1, the statistically significant gene flows in table 2 are marked in red. Background gene levels, thought to be due to horizontal gene transfer (HGT)/lateral gene transfer (LGT), are identified by the largest gap between large and small gene flows using chi-squared analyses. Note that the same six significant gene flows (marked in red) are present when either the Firmicutes or the Actinobacteria are included in the analyses (subtables 1 and 2). This demonstrates that the Firmicutes and the Actinobacteria are immediate outgroups to the Proteobacteria because they have the same topological relationship to the proteobacterial rings. The probability that the same six signal patterns were chosen by chance from the set of 10 informative patterns for both the Firmicute- and the Actinobacterial outgroups is low (P < .0048 by the hypergeometric test), thus providing strong evidence that both outgroups have the same phylogenetic relationship to the Proteobacteria. In contrast, when the Halobacteria are included in the analyses only three of the six signal gene flows are present and there is no support for the Halobacteria having the same relationship to the Proteobacteria that was found for the Actinobacteria and the Firmicutes (P < 0.923, by the hypergeometric test). We conclude that the Firmicutes and the Actinobacteria are immediate outgroups to the Proteobacteria but that the Halobacteria is not an outgroup.
Table 2.
Rooting the Proteobacterial Rings with Outgroups
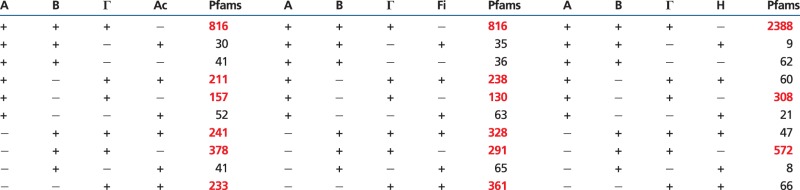 |
Note.—The outgroups are as follows: Actinobacteria, Ac; Firmicutes, Fi; Halobacteria, H. Significant Pfam flows are in red.
In contrast, because all three of the signals present within the Halobacteria in table 1 [(+,+,+), (+,−,+), (−,+,+)] are also the only signals present in table 2 [(+,+,+,−), (+,−,+,−), (−,+,+,−)], we conclude that this signal is generated solely by the proteobacterial rings and not from connections between the Halobacteria and the Proteobacteria. The observation that the findings presented in subtables 1 and 2 independently support the Firmicute/Actinobacterial fusion previously reported in the rooted rings of life (Lake and Sinsheimer 2013) is consistent with the Firmicutes and the Actinobacteria (but not the Halobacteria) being immediate outgroups to the Proteobacteria.
The Rooted Proteobacterial Rings
Because the Actinobacteria and the Firmicutes are outgroups to the Proteobacteria in the rings of life in figure 1 (Lake and Sinsheimer 2013), this suggests that genes flow from the root defined by the Actionbacteria and the Firmicutes into the Proteobacteria. With this rooting information we can now formally test the evolutionary origins of the Proteobacteria within the rings of life.
The rooted proteobacterial rings reconstructed from the Firmicute and the Actinobacterial subtables are shown in figure 3. In table 2, these gene flows are highlighted in red and nonsignificant gene flows, consistent with the background of HGT/LGT, are black. Note that the three red gene flows present in table 1 [(+,+,+), (+,−,+), and (−,+,+)] are also present in all three subtables in table 2 [(+,+,+,−), (+,−,+,−), and (−,+,+,−)]. Thus the αγ, βγ, and αβγ gene flow patterns that are explained by the graph in figure 2 are also present in the double rings structure at the top of figure 3. When either the Actinobacteria or the Firmicutes are included in the analyses, the top rings are connected to their Actinobacterial/Firmicute roots by the additional complex gene flows shown in gray. Accordingly, the data in table 2 are consistent with the proteobacterial rings and with the Actinobacteria and the Firmicutes being outgroups.
Fig. 3.—

The deeper gene flows that connect the ABΓ Proteobacterial to their Firmicute/Actinobacterial outgroups are shown in grey. The start sites of gene flows introduced by outgroup rooting are marked in color. They are the αγF (grey), the βγF (magenta), and the γF (grey) gene flows. Identical rings and similar gene flow counts are produced when these rings are rooted using the Actinobacteria as the outgroup, and the corresponding gene flows are labeled the αγA, βγA, and γA gene flows, respectively.
In contrast, there are no large gene flows in subtable 3 that directly connect the Proteobacteria to the Halobacteria, because all three informative patterns (those with at least two +s) which connect the Halobacteria with the Proteobacteria lack statistical support. Thus the Actinobacteria and the Firmicutes are outgroups in the ring sense, but the Halobacteria is not.
Although the details of the proteobacterial part of the ring shown in figure 3 are identical to those in figure 2, the deeper connections of the Proteobacteria to the Firmicutes and to the Actinobacteria involve additional gene flows. Those flows, shown in gray in figure 3, connect the Alpha-, Beta-, and Gammaproteobacteria to their Firmicute and Actinobacterial outgroups. Because the same six large gene flows, that is, the same connections, are present when either the Firmicutes or the Actionbacteria are used as outgroups, this further confirms by the hypergeometric test (population size = 10, successes in: A population = 6, sample size = 6, and successes in sample = 6, P < 0.00477) that they are sister outgroups as previously shown by indel rooting. Specifically, because Firmicutes and the Actionobacteria are supported by the same set of gene flows the graph representing the Firmicute data set shown in figure 3 must be the same as that representing the Actinobacterial data set with the Firmicutes replaced by the Actinobacteria.
The outgroups define the directions of gene flows as follows. Genes flow from the root at the bottom of figure 3 and subsequently bifurcate. The flows on the left and the right then divide a second time so that one path leads to the outgroup and the other to the Proteobacteria. Note that the directions of the arrows indicate the flow of genes and of time. We interpret the gene flows shown in presence/absence tables 1 and 2 as representing gene gains, as discussed below.
Detecting Gene Gains
We find that net gene gains can be reliably measured in presence–absence studies of large populations. We illustrate how this differential sensitivity to gene loss and gene gain arises when databases containing large numbers of individual organisms are studied. In figure 4, gene losses occurring within individual organisms (the circles in the upper box) are shown as missing +’s. Even though the loss of a particular gene from individual cells may be frequent, the elimination of that gene from an entire taxon is rare. It is because the gene must be lost from all individuals, which for even small populations rapidly becomes highly unlikely. Thus when genes are summed over large populations, as illustrated in the top box, it becomes highly unlikely for all of the organisms to have lost the same gene (upper row). In contrast, gene gain in even one organism, shown in red in the lower box, would be obvious when genes are tallied over all the members of the population (as in the lower right circle). When gene gains and losses are added together in presence/absence tables, the net result is that gene gains are detected whereas gene losses are hidden, as shown in the circle on the far right.
Fig. 4.—

The differential effects of gene losses and gains on the measurement of presence/absence counts. The large circle at the left represents genes initially present within the founding gene flow. Over time genes will be lost from some members of the population as shown by genomes (circles) within the box at the top. Similarly, over time genes will be gained by other members of the population, as shown by genomes (circles) within the box at the bottom. The large circle on the top line (to the right of the box) represents the number of different genes present in all organisms that have “lost” genes. For large populations like the ones studied here, few, if any, genes will be lost from every single member of the population. In contrast, the large circle on the bottom line represents the number of different genes present in organisms that have “gained” genes (shown by red +’s). This sum will increase over time as new genes emerge, even if only a very small percent of individuals within the population carry new genes. When the gene inventory from cells with losses is added to that from cells with gains, the net change will be an “increase” in the number of novel genes within the population. Thus the totals calculated in presence/absence analyses represent new genes. This is also consistent with the results of our rooting analyses using Firmicutes and Actinobacteria. In addition, a background of HGT/LGT will introduce new genes over time; however, the numbers of genes introduced are small as estimated by the difference between the large statistical differences between the gene flow and the background counts.
In summary, even though genes may be readily lost over time from individual organisms, it is extremely improbable for genes to be completely lost from large populations. In contrast, the gain of a single new gene by even one species can be detected when many taxa are sampled within a large population. For these reasons, we have used protein families (Pfams) for our analyses because, unlike genomes, Pfams can represent tens of thousands of species. This makes this database ideal for detecting gene gains, and for being insensitive to gene losses. Protein family PF00009 (GTP_EFTU), for example, contains 69,868 sequences from 24,054 discrete species. By using large databases the probability that ring analyses will detect new genes is exponentially increased, and the probability that genes which are easily lost will be scored as missing is greatly decreased. Consistent with these ring findings and with previous indel rooting studies (Lake and Sinsheimer 2013), our results provide strong support for the Rooted Proteobacterial Rings shown in figure 3.
Identifying Endosymbiotic Flows within the Rings
Rings can simultaneously describe divergent and convergent evolution. Divergences are responsible for tree-like evolution and the underlying tree-like evolutionary mechanisms responsible for them are well known, but convergences are only beginning to be understood.
In rings convergences may be caused by endosymbioses or by HGT/LGT. In the past it has been difficult to distinguish between these two alternative modes of evolution (Doolittle 2007). Traditionally, evidence for endosymbioses has come from membrane systems and from phylogenetic trees reconstructed from organellar DNA. For example, the endosymbiotic origins of mitochondria and chloroplasts were initially based on the observations that those organelles 1) were surrounded by inner and outer membranes and 2) had gene sequences that differed from the nuclear genes of their host cells. Subsequently, analyses of mitochondrial and chloroplast DNA sequences showed that they were related to the Alphaproteobacteria and to the Cyanobacteria, respectively. Even the nucleus has been proposed to have endosymbiotic origins (Lake and Rivera 1994) in the Eocyta (Lake 1988; Cox et al. 2008; Williams et al. 2013; McInerney et al. 2014) and viable mechanisms have been suggested for its acquisition (Martin and Muller 1998).
Within prokaryotes, endosymbioses are much harder to identify because separate compartments for host and guest DNA are not normally present. However, precedents exist for prokaryotic endosymbioses. For example, some eukaryotes contain endosymbiotic prokaryotes (Gammaproteobacteria), which contain their own endosymbionts (Betaproteobacteria), much like a set of nesting Russian dolls (von Dohlen et al. 2001). Additionally, even the inner and outer membranes of the double membrane, that is, gram negative, prokaryotes may have been derived as the result of an endosymbiosis between two ancient prokaryotes, a Firmicute and an Actinobacteria (Lake 2009a, 2009b). But prokaryotic examples of endosymbiosis are relatively rare, so that new computational methods are needed to distinguish endosymbiotic gene flows from LGT/HGT.
Given the subjective aspects of interpreting membrane organization within prokaryotes, we present a genomic-based method for discriminating between endosymbioses and gene transfers. In these analyses, the functions of the genes being transferred provide a basis for distinguishing endosymbioses from gene transfers. The essence of the test lies in determining the functions of the genes being transferred. Horizontally/laterally transferred genes tend to have specialized functions. For example, organisms living in aquatic environments are more likely to exchange genes with other organisms living in that environment, and so on. In contrast, endosymbioses transfer entire cells complete with all the genes necessary to survive as free living entities. They pass on genes that are essential for fundamental life processes such as translation, replication, energy production, and cellular compartmentalization (Jain et al. 2003).
Here we use these fundamental properties to test whether gene flows within the proteobacterial rings are consistent with endosymbiotic transfers, or whether they are consistent with HGT/LGT. This is accomplished by operationally defining endosymbiosis as a process that can be recognized by the simultaneous transfer of statistically significant numbers of genes responsible for fundamental cellular processes. Our tests explicitly follow the paths of inheritance of genes involving DNA, RNA, ATP, and membranes. We reason that if a gene flow involves just one or two (or even three?) of these cellular processes, then it might be the result of multiple LGT/HGT. If significant numbers of genes are transferred into gene flows for each of these four fundamental processes, then it is statistically highly unlikely that they were transferred by multiple independent LGT events. In contrast, endosymbioses are predicted to share similar patterns of gene flows for DNA, RNA, ATP, and membrane-related processes.
To test for endosymbioses, we explicitly search all Pfam descriptors for the appearance of these four terms representing fundamental life processes. From these we count the number of Pfams in which only one, two, or three of these four descriptors ares used. (For example, if a Pfam was to refer to three, or fewer, of the four descriptors shown in table 3, such as “DNA” and “RNA,” then that Pfam flow would not be counted as being consistent with an endosymbiotic flow. This procedure enables us to compute statistically independent counts of gene gains within each of these four categories.) Then we ask whether all four independent categories have the same evolutionary history, as measured by gene presence tables. If all four processes have the same evolutionary histories then we infer that they were transported as a single cellular unit, that is, that they represent endosymbiotic transfers. Alternatively, if any of these processes have different histories, then we infer that mechanisms other than endosymbioses, such as HGT, were responsible. By including only Pfams that refer to just one of these four descriptors, we independently measure support for each of the processes, that is, a Pfam referring to DNA and RNA, or to “ATP and membrane,” and so on would not be counted.
Table 3.
Distributions of Pfams and Cell Processes
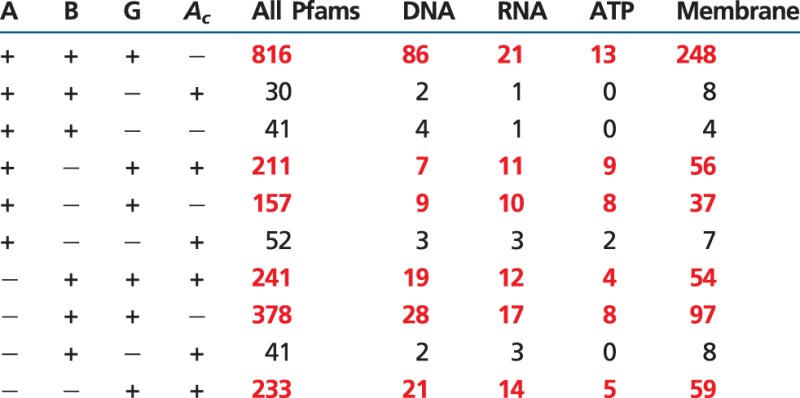 |
Note.—Significant Pfam flows are in red.
From the four independent sets of gene counts analyzed in table 3, we calculate lists of the numbers of informative patterns found in the proteobacterial rings. The six largest Pfam flows (shown in red) are present in the same rows for all four categories: DNA, RNA, ATP, and membranes. Because the six largest informative patterns in the DNA, RNA, ATP, and membrane columns are statistically independent and because they correspond to the same six largest informative patterns in the “All Pfams” column, we conclude that endosymbioses are responsible for the identical patterns observed for all four significant gene flows. The small probability that all four categories support the same rings happened by chance, P < 5.15 × 10⁻¹⁰, operationally identifies endosymbioses as the process responsible for the proteobacterial rings, and excludes LGT/HGT-related mechanism.
Discussion
Proteobacterial Genotypes and Phenotypes
Before ribosomal RNA and DNA sequencing was possible the phylogenetic relationships of the Proteobacteria, then known as the “purple bacteria,” were based on phenotypes. The purple bacteria consisted of two photosynthetic groups: The “purple sulfur bacteria” and the “purple nonsulfur bacteria.” One type contained “bacterial chlorophyll a” and the other contained “bacterial chlorophyll b” (Stanier et al. 1976). Thus photosynthesis initially seemed to provide a reasonable functional basis for classification within the purple bacteria.
However, when Margaret Dayhoff and collaborators published the first ribosomal RNA trees (Dayhoff 1972), the study of proteobacterial evolution was transformed. Two of the three 5S ribosomal RNA sequences analyzed in that work were from purple bacteria, and the third was from a human cell line. Her pioneering work, although not highly publicized or promoted, had a major effect on molecular phylogenomics. As more 5S and subsequently 16S rRNA (Ribosomal Ribonucleic Acid) sequences appeared the purple bacteria were renamed the Proteobacteria and were subdivided into the α-, β-, γ-proteobacteria and several minor classes.
Despite great initial optimism, ribosomal RNA (and protein) sequences were of little or no help in understanding the evolution of photosynthesis and other fundamental biological processes. Photosynthetic organisms were randomly scattered within the Proteobacteria.
With time it became obvious that molecular phylogenetic trees were not explaining the distribution of proteobacterial phenotypes. Photosynthetic species were often greatly outnumbered by nonphotosynthetic species and were randomly distributed across the Alpha-, Beta-, and Gammaproteobacteria. Phenotypes appeared to be haphazardly distributed.
This led to a scientific crisis in classification in the Kuhnian sense (Kuhn 1964). As this crisis progressed scientists increasingly began to discuss Proteobacterial systematics as if the genotypes of proteobacteria were completely unrelated to their phenotypes. For example, in the microbiology classic, Bergey’s Systematic Biology (Boone and Castenholz 2001), a separate section on the “Phenotypic characteristics of the Proteobacteria” follows the section describing the Proteobacterial classes based on rRNA sequencing. Today 15 years later a solution to this paradox has still not emerged.
How Rings Help Reconcile Proteobacterial Genotypes and Phenotypes
This state of confusion in microbiology motivated us to reconstruct the proteobacterial rings in the hope of discovering previously unknown phylogenetic connections within the Proteobacteria. We reasoned that if the rings of proteobacterial life could be reconstructed, then the gene contents within these flows might help explain the puzzling relationships between genotypes and
phenotypes.
To illustrate how rings explain phenotypes consider the distribution of photosynthetic phenotypes within the three Proteobacterial gene flows (αβ, βγ, and αβγ) studied here. The Pfam contents of these three gene flows are presented in supplementary material, Supplementary Material online. The +++ (αβγ) pattern contains 3511 Pfams. Thirty-seven of these contain unique photosynthetic-related keywords within their descriptors (photosynthesis (3), chlorophyll (2), and prokaryotic cytochrome (32)). Thus these 37 photosynthetic components are present in one or more Alpha-, Beta-, and Gammaproteobacterial species to produce the +++ photosynthetic gene flow. Thus the +++ clade is photosynthetic, even though many of the species within the +++ gene flow are probably not photosynthetic, whereas the other two statistically significant gene flows, + − + and − + +, contain no photosynthetic Pfams.
Thus there is just one photosynthetic proteobacterial gene flow, +++. And even within this photosynthetic flow most species are not photosynthetic. In contrast, there are no photosynthetic identifiers within the contents of the + − + and − + + Pfam flows, indicating that neither of these clades have photosynthetic origins.
Rethinking Proteobacterial Classification
The proteobacterial rings help us understand how the discrepancies between proteobacterial tree and phenotypic-based classification schemes arose. In order to understand phenotypes we downloaded the complete lists of protein families that are present in the Pfam flows analyzed in figure 1
The reason this is possible is quite simple, provided we keep in mind what we have learned from calculating gene/Pfam presence/absences. Namely, gene presences represent genes that are present in “some” members of the population today. There is no requirement that they be present in “all” members. Even though critical photosynthetic genes may be lost over time from individuals within a gene flow, as long as some organisms within the population can still perform photosynthesis, the gene flow is phenotypically photosynthetic, even though nonphotosynthetic members vastly outnumber nonphotosynthetic ones. This is especially true of phenotypes that are defined by intricate molecular complexes that, like photosystems, can be inactivated by the loss of a single gene. This helps explain 1) why neither Proteobacterial tree-based classifications nor phenotypic-based classifications could elucidate proteobacterial evolution, and 2) why and how rings can simultaneously describe the paths of evolution and the distribution of phenotypes.
The take home lesson is that collaboration, as in endosymbioses, works too! But it is not just collaboration that is needed. As has been emphasized for the last 150+ years, survival of the fittest is also needed. Evolution does not work just through one of these mechanisms, it uses both. Just as humans are the products of cooperation at the level of individuals, i.e., sexual reproduction, we are also the products of tree-like divergences through mutations.
Ever since Darwin and Wallace, tree-like evolution has been the primary focus of evolution, but it is now time for convergences and trees to share the limelight together. It is time to understand evolution as it can only be understood—through divergences and through convergences.
Supplementary Material
Supplementary material is available at Genome Biology and Evolution online (http://www.gbe.oxfordjournals.org/ ).
Acknowledgments
This work was supported by grants from the National Science Foundation (NSF-0719574 to J.A.L.), the NASA Astrobiology Institute (NASA Astrobiology DDF R9867-G3 to J.A.L., through Georgia Tech. Center for Ribosome Adaption and Evolution, Prof. Loren D. Williams, Director), and from the National Institute of Health (GM086887 to J.S.S.).
Literature Cited
- Archibald JM. 2008. The eocyte hypothesis and the origin of eukaryotic cells. Proc Natl Acad Sci U S A. 105:20049–20050. [DOI] [PMC free article] [PubMed] [Google Scholar]
- Boone D, Castenholz RW. 2001. The Archaea and the deep branching and phototrophic bacteria. In: Garrity GM, editor. Bergey’s manual of systematic bacteriology. Vol. 1, 2nd ed New York, Berlin, Heidelberg: Springer. [Google Scholar]
- Cox CJ, et al. 2008. The archaebacterial origin of eukaryotes. Proc Natl Acad Sci U S A. 105:20356–20361. [DOI] [PMC free article] [PubMed] [Google Scholar]
- Creevey CJ, et al. 2004. Does a tree-like phylogeny only exist at the tips in the prokaryotes? Proc R Soc Lond B. 271:2441–558. [DOI] [PMC free article] [PubMed] [Google Scholar]
- Dagan T, Martin W. 2006. The tree of one percent. Genome Biol. 7:118. [DOI] [PMC free article] [PubMed] [Google Scholar]
- Dayhoff M. 1972. The atlas of protein sequence and structure. Washington, DC: National Biomedical Research Foundation; p. 418. [Google Scholar]
- Doolittle WF, Bapteste E. 2007. Pattern pluralism and the Tree of Life hypothesis. Proc Natl Acad Sci U S A. 104:2043–2049. [DOI] [PMC free article] [PubMed] [Google Scholar]
- Jain R, Rivera MC, Moore JE, Lake JA. 2003. Horizontal gene transfer accelerates genome innovation and evolution. Mol Biol Evol. 20:1598–1602. [DOI] [PubMed] [Google Scholar]
- Kloesges T, et al. 2011. Networks of gene sharing among 329 proteobacterial genomes reveal differences in lateral gene transfer frequency at different phylogenetic depths. Mol Biol Evol. 28:1057–1074. [DOI] [PMC free article] [PubMed] [Google Scholar]
- Kuhn TS. 1964. The structure of scientific revolutions. Phoenix Edition. Chicago and London. Phoenix Books, University of Chicago Press. 142. [Google Scholar]
- Lake JA. 1988. Origin of the eukaryotic nucleus determined by rate-invariant analysis of ribosomal RNA sequences. Nature 331:184–186. [DOI] [PubMed] [Google Scholar]
- Lake JA. 2009a. Evidence for an early prokaryotic endosymbosis. Nature 460:967–970. [DOI] [PubMed] [Google Scholar]
- Lake JA. 2009b. Evidence for a new prokaryotic endosymbiosis. Nature 460:967–971. [DOI] [PubMed] [Google Scholar]
- Lake JA, Henderson E, Oakes M, Clark MW. 1984. Eocytes—a new ribosome structure indicates a kingdom with a close relationship to eukaryotes. Proc Natl Acad Sci U S A. 81:3786–3790. [DOI] [PMC free article] [PubMed] [Google Scholar]
- Lake JA, Rivera MC. 1994. Was the nucleus the first endosymbiont. Proc Natl Acad Sci U S A. 91:2880–2881. [DOI] [PMC free article] [PubMed] [Google Scholar]
- Lake JA, Sinsheimer JS. 2013. The deep roots of the rings of life. Genome Biol Evol. 5:2440–2448 [DOI] [PMC free article] [PubMed] [Google Scholar]
- Lake JA, et al. 1985. Eubacteria, halobacteria, and the origin of photosynthesis: the photocytes. Proc Natl Acad Sci U S A. 82:3716–3720. [DOI] [PMC free article] [PubMed] [Google Scholar]
- Lerat E, et al. 2004. Evolutionary origins of genomic repertoires in bacteria. PLoS Biol. 3:807–814. [DOI] [PMC free article] [PubMed] [Google Scholar]
- Martin W, Muller M. 1998. The hydrogen hypothesis for the first eukaryote. Nature 392:37–41. [DOI] [PubMed] [Google Scholar]
- McInerney JO, Cummins C, Haggerty L. 2011. Goods thinking vs. tree thinking. Mobile Genet Elements. 1(4):304–308. [DOI] [PMC free article] [PubMed] [Google Scholar]
- McInerney JO, O’Connell MJ, Pisani D. 2014. The hybrid nature of the Eukaryota and a consilient view of life on Earth. Nat Rev Microbiol. 12:449–455. [DOI] [PubMed] [Google Scholar]
- Nelson-Sathi S, et al. 2012. Acquisition of 1,000 eubacterial genes physiologically transformed a methanogen at the origin of Haloarchaea. Proc Natl Acad Sci U S A. 109:20537–20542. [DOI] [PMC free article] [PubMed] [Google Scholar]
- Nelson-Sathi S, et al. 2015. Origins of major archaeal clades correspond to gene acquisitions from bacteria. Nature 517:77–80. [DOI] [PMC free article] [PubMed] [Google Scholar]
- Rivera MC, Lake JA. 2004. The ring of life: evidence for a genome fusion origin of eukaryotes. Nature 431:152–155. [DOI] [PubMed] [Google Scholar]
- Stanier RY, Adelberg EA, Ingraham JL. 1976. The microbial world. 4th ed. Englewood Cliffs (NJ): Princeton-Hall, Inc. p. 871. [Google Scholar]
- Susko E, et al. 2006. Evolutionary origins of genomic repertoires in bacteria. Mol Biol Evol. 23:1019–1030.16495350 [Google Scholar]
- von Dohlen CD, et al. 2001. Mealybug beta-proteobacterial endosymbionts contain gamma-proteobacterial symbionts. Nature 412:433–436. [DOI] [PubMed] [Google Scholar]
- Whitman WB, Coleman DC, Wiebe WJ. 1998. Prokaryotes: the unseen majority. Proc Nat Acad Sci U S A. 95:6578–6583. [DOI] [PMC free article] [PubMed] [Google Scholar]
- Williams TA, Foster PG, Cox CJ, Embley TM. 2013. An archaeal origin of eukaryotes supports only two primary domains of life. Nature 504:231–236 [DOI] [PubMed] [Google Scholar]
Associated Data
This section collects any data citations, data availability statements, or supplementary materials included in this article.