Abstract
Purpose:
In cardiac single photon emission computed tomography (SPECT), respiratory-binned study is used to combat the motion blur associated with respiratory motion. However, owing to the variability in respiratory patterns during data acquisition, the acquired data counts can vary significantly both among respiratory bins and among projection angles within individual bins. If not properly accounted for, such variation could lead to artifacts similar to limited-angle effect in image reconstruction. In this work, the authors aim to investigate several reconstruction strategies for compensating the limited-angle effect in respiratory binned data for the purpose of reducing the image artifacts.
Methods:
The authors first consider a model based correction approach, in which the variation in acquisition time is directly incorporated into the imaging model, such that the data statistics are accurately described among both the projection angles and respiratory bins. Afterward, the authors consider an approximation approach, in which the acquired data are rescaled to accommodate the variation in acquisition time among different projection angles while the imaging model is kept unchanged. In addition, the authors also consider the use of a smoothing prior in reconstruction for suppressing the artifacts associated with limited-angle effect. In our evaluation study, the authors first used Monte Carlo simulated imaging with 4D NCAT phantom wherein the ground truth is known for quantitative comparison. The authors evaluated the accuracy of the reconstructed myocardium using a number of metrics, including regional and overall accuracy of the myocardium, uniformity and spatial resolution of the left ventricle (LV) wall, and detectability of perfusion defect using a channelized Hotelling observer. As a preliminary demonstration, the authors also tested the different approaches on five sets of clinical acquisitions.
Results:
The quantitative evaluation results show that the three compensation methods could all, but to different extents, reduce the reconstruction artifacts over no compensation. In particular, the model based approach reduced the mean-squared-error of the reconstructed myocardium by as much as 40%. Compared to the approach of data rescaling, the model based approach further improved both the overall and regional accuracy of the myocardium; it also further improved the lesion detectability and the uniformity of the LV wall. When ML reconstruction was used, the model based approach was notably more effective for improving the LV wall; when MAP reconstruction was used, the smoothing prior could reduce the noise level and artifacts with little or no increase in bias, but at the cost of a slight resolution loss of the LV wall. The improvements in image quality by the different compensation methods were also observed in the clinical acquisitions.
Conclusions:
Compensating for the uneven distribution of acquisition time among both projection angles and respiratory bins can effectively reduce the limited-angle artifacts in respiratory-binned cardiac SPECT reconstruction. Direct incorporation of the time variation into the imaging model together with a smoothing prior in reconstruction can lead to the most improvement in the accuracy of the reconstructed myocardium.
Keywords: cardiac SPECT, respiratory-binned acquisition, limited-angle effect, amplitude respiratory binning
1. INTRODUCTION
Myocardial perfusion imaging (MPI) with single photon emission computed tomography (SPECT) is widely used for diagnosis of coronary artery diseases.1 It can provide important diagnostic information about both myocardial perfusion and ventricular function. However, SPECT images are known to suffer from limited spatial resolution due to blur caused by both cardiac and respiratory motions,2 which could lead to inaccuracy in both regional myocardial perfusion and functional analysis of the left ventricle (LV).3
Toward alleviating the effect of respiratory motion, in the literature, there have been several approaches studied in cardiac SPECT imaging. For example, in Refs. 4 and 5, motion correction was first applied to the projection data, and the images were reconstructed afterward from the corrected projections in order to reduce the respiratory motion artifacts. Alternatively, a popular approach is to use respiratory gated/binned acquisition, e.g., Refs. 3 and 6. In the latter approach, data acquisition is performed for different portions of the respiratory cycle, during which the motion extent of the heart and diaphragm is reduced.3,7 Respiratory gating/binning can be achieved either by phase gating, which is based on the relative temporal position within the respiratory cycle, or by amplitude binning, which is based on the respiratory magnitude measured from an external tracking device.8 Owing to the large variability in respiratory patterns observed clinically, amplitude binning can potentially be more accurate than phase binning.8
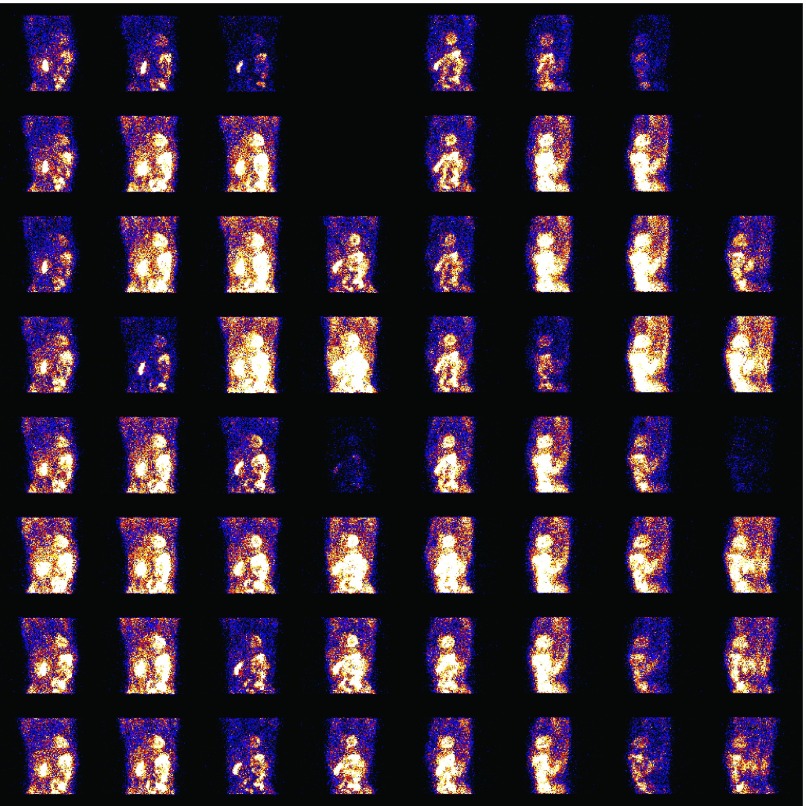
While respiratory gated/binned imaging has been well studied in CT, PET, and MRI,8–12 its application in conventional cardiac SPECT (with a rotating camera) is considerably more challenging for a number of reasons. Aside from the high noise levels, in a conventional SPECT scanner, typically only two or three projection angles are acquired at any given time. Because the respiratory motion is not constant during the acquisition period, the acquired data statistics can vary considerably not only among the respiratory bins but also among the projection angles within individual respiratory bins. This issue is further exacerbated with the increase in the number of respiratory bins (which is desired for reducing motion blur), where some projection angles may have little or even no data acquired during a particular respiratory position. To illustrate this, we show in Fig. 1 the data acquired for one respiratory bin over the different angles in a clinical acquisition, in which a total of seven bins were used based on magnitude binning. As can be seen in Fig. 1, the acquired data exhibit a great deal of variability among the projection angles. If not properly accounted for, this variability will lead to limited-angle artifacts in the reconstructed images.
FIG. 1.
Projection data acquired at 64 angles (arranged by 8 rows and 8 columns) for one respiratory bin in a clinical acquisition. Each image at a row/column position represents the data counts acquired at an angle position, wherein the image intensity is proportional to the count level.
It is noted that the limited-angle artifacts can also differ among the respiratory bins, because the distribution patterns over the projection angles in the acquired data vary among the different bins. Consequently, this difference will adversely affect the accuracy of motion estimation among the respiratory bins, which is critical for motion correction in respiratory-binned reconstruction. In order to address this issue, in Ref. 13, the projection data among the different bins were adjusted according to a common distribution pattern over the projection angles, the purpose being to reduce the variability among the different respiratory bins. This was demonstrated to lead to improved motion estimation accuracy. It is noted that the Poisson statistics were altered in the rescaled projection data.13
In this work, we aim to investigate the benefits of several different strategies in reconstruction for compensating the limited-angle effects in respiratory binned SPECT. It is reasonable to expect that by effectively suppressing the artifacts in the binned images, it will not only improve the reconstruction accuracy but also, importantly, allow for use of an increased number of binning intervals, thereby further reducing the respiratory motion blur in reconstruction.
First, we approach the problem by accurately modeling the uneven distribution of the data statistics (i.e., the associated acquisition time) acquired among different projection angles within a respiratory bin. In concept, this amounts to modulating the sensitivity of the detector response at each projection angle by the amount of acquisition time at that angle position accordingly. Afterward, we consider a simplified approach in which the acquired data are rescaled to accommodate the variation in acquisition time among the different projection angles, and the images are reconstructed from the rescaled data (which are used in place of the acquired data approximately), while without modifying the imaging model. In addition, we also explore the use of a spatial smoothing prior in reconstruction and investigate whether it can be effective for suppressing the limited-angle effect without unduly impacting on the spatial resolution in the reconstructed myocardium. We apply these different strategies, either individually or in combinations, using both maximum likelihood (ML) reconstruction and maximum a posteriori (MAP) reconstruction.
We note that this work is built on our preliminary work in Ref. 14, where we first explored the approach of compensating for the uneven distribution of the data statistics among different projection angles in ML reconstruction.
In our evaluation study, we first use Monte Carlo simulated imaging with 4D NURBS-based cardiac-torso (NCAT) phantom, wherein the ground truth is known for quantitative comparison. We evaluate the accuracy of the reconstructed myocardium using a number of metrics, including regional and overall accuracy of the myocardium, uniformity and spatial resolution of the LV wall, and detectability of perfusion defects using a channelized Hotelling observer (CHO). As a preliminary demonstration, we also tested on five sets of clinical acquisitions.
2. METHODS
2.A. Respiratory-binned imaging model
In cardiac SPECT imaging, a radio-labeled compound is first introduced into the body and subsequently a rotating gamma camera is used to record the photon events emitted from inside the body. For respiratory-binned imaging, the acquired data are rebinned into several respiratory intervals according to the respiratory position. The imaging process can be described by a linear model as
| (1) |
where gr, fr, and sr are vectors representing the acquired data, original image, and expected scatter component, respectively, of the rth binning interval, R is the number of respiratory bins, E[ ⋅ ] is the expectation operator, and H is a matrix describing the image system (a.k.a system matrix). In H, each element hi,j represents the probability that a photon emitted at voxel location j is detected at detector bin i without being scattered. In this study, both the depth dependent blur and attenuation effects are directly modeled in the system H.15
One implicit assumption in the imaging model in Eq. (1) is that the acquisition time is constant among the projection angles. However, as explained in the Introduction, this is no longer the case with respiratory-binned acquisition due to the uneven nature of the respiratory motion among different respiratory intervals. Consequently, the acquired data counts would vary among the projection angles in accordance with the variation in acquisition time. This problem becomes even more severe when the number of respiratory bins is increased (which is desirable for reducing respiratory motion blur). If not properly accounted for, this would result in limited-angle artifacts in the reconstruction. In the following, we describe the different compensation schemes used in this study, namely, (1) model based compensation, (2) data rescaling, and (3) smoothing prior.
2.B. Model based compensation
In order to account for the uneven distribution in acquisition among the different angles, we incorporate into the imaging model in Eq. (1) an explicit time factor for each projection angle. Specifically, let hp denote the corresponding projection operator at angle p, which is the system matrix H restricted to only angle p. Let τp,r denote the actual acquisition time at angle p during respiratory state r. Then, the acquired data at angle p in respiratory bin r, denoted by vector gp,r can be modeled by
| (2) |
where sp,r is the corresponding scatter component and P is the total number of projection angles.
In the modified model in Eq. (2), the image vector fr now represents the source distribution per unit time when the heart is at respiratory position r. That is, it corresponds to the expected amount of emissions per unit time at each voxel location. Thus, the binned images fr, r = 1, …, R, will have the same dynamic range in spite of the difference in acquisition time among the respiratory intervals. This is important for subsequent respiratory motion estimation from the reconstructed images. Of course, the imaging model in Eq. (2) requires the knowledge of timing information τp,r, which can be obtained in list-model acquisition.
To reconstruct the images, a straightforward approach is to reconstruct each bin separately from Eq. (2) then combine them with respiratory motion compensation. Alternatively, as in cardiac-binned 4D reconstruction,16 we can consider a joint reconstruction approach, in which all the respiratory bins are reconstructed simultaneously through motion compensation from the projection data. While potentially more accurate, the latter approach will also need a prereconstruction of the individual bins in order to estimate the necessary motion information. In this study, we will apply the first reconstruction approach, as our main purpose is to evaluate the effectiveness of different strategies for compensating the limited-angle effect in respiratory binned images.
In order to exploit the acquired data statistics, we seek a statistical approach for reconstructing the individual bins from Eq. (2). In particular, with ML reconstruction, the estimate of fr is obtained as
| (3) |
where p(gr|fr) is the likelihood function of gr parameterized by fr.
We assume a Poisson distribution for the noise model in SPECT. From the imaging model in Eq. (2), we have
| (4) |
where (hpfr)(i), gp,r(i), and sp,r(i) denote the ith elements of (hpfr), gp,r, and sp,r, respectively, at bin r, and I(p) denotes the set of detector locations at angle p.
2.C. Compensation with data rescaling
By defining and , we can rewrite imaging Eq. (2) as
| (5) |
Hence, if we treat and as the imaging data at angle p and bin r, and let and be the corresponding vectors, collectively over all angles, for bin r as earlier in Eq. (1), then we can rewrite Eq. (5) in terms of the original system matrix H as
| (6) |
Note that the resulting equation above now bears the same form as that in Eq. (1). Therefore, one can readily apply a traditional approach for reconstruction of fr in Eq. (6).
The rescaled data and above amount to achieving a uniform distribution in acquisition time among the projection angles.13 However, it is noted that the rescaled data no longer follow the same Poisson statistics as the original data. Thus, when the same reconstruction algorithm for Eq. (1) is applied for the rescaled data, the statistical model becomes only approximately true. To suppress this approximation error, in our experiments those angles with time factors τp,r too small (less than 10% of the average time at each angle within a respiratory bin), are discarded. The rescaled data are used for both motion estimation and final reconstruction.
2.D. Compensation with smoothing prior
Traditionally, smoothing priors are often used in a MAP framework to combat the imaging noise in the reconstruction. In this study, we explore the use of a spatial prior for suppressing the artifacts associated with the limited angle effect in respiratory binned data. Specifically, with p(fr) denoting a smoothing prior on the unknown fr, the MAP estimate is obtained as
| (7) |
In this study, we use a Gibbs prior for p(fr) which is defined as follows:
| (8) |
where ∇ is the 3D spatial gradient operator,16 j denotes the voxel location, N is the total number of voxels, and βs is a scalar weighting factor.18 The latter is used to control the level of smoothing in the reconstructed images. In particular, when βs = 0, MAP reconstruction corresponds to simply ML reconstruction.17,19
With the likelihood function defined in Eq. (4), the MAP estimate in Eq. (7) can be solved by minimizing the following objective function:
 |
(9) |
2.E. Reconstruction methods
To evaluate the effectiveness of the different compensation schemes described above, we consider in this study the following reconstruction methods, in which the different compensation schemes were used either individually or in combinations: (1) ML reconstruction without any compensation, (2) ML reconstruction with model based compensation, (3) ML reconstruction with data scaling compensation, (4) MAP reconstruction (i.e., spatial prior), (5) MAP reconstruction in addition to model based compensation, and (6) MAP reconstruction in addition to data scaling compensation.
For easy reference, when model based compensation is used in a reconstruction method, the corresponding results will be denoted by “corrected”; likewise, when data scaling is used, the results will be denoted by “rescaled”; when neither model based compensation nor data scaling is used, the results will be denoted by “uncorrected.” For example, the results from method no. 5 above will be referred to by “MAP-corrected,” and so on.
Finally, for the purpose of comparison, we also consider the reconstruction without respiratory binning, in which acquisitions from all respiratory bins are directly combined for the reconstruction. In such a case, angle compensation is no longer necessary. This method is referred to as “unbinned.”
2.F. Reconstruction algorithm
For the solution of the optimization problem in Eq. (9), we use the modified block sequential regularized expectation maximization (BSREM) algorithm owing to its globally convergent property.20 To simplify the notation, below we will use f to denote implicitly a respiratory bin fr under consideration; similarly, gp,r, τp,r will be denoted by gp, τp, respectively.
With BSREM, the set of projection data is first divided into a number of subsets Sd, d = 1, …, D, based on the projection angles, and the objective function in Eq. (9) is decomposed accordingly as . The image estimate f is updated iteratively as follows:
| (10) |
where n is the iteration index, d is the subiteration index, ℘ is a projection operator onto θ ≡ {f : δ ≤ f ≤ U − δ} with δ being a small positive number and U being a upper bound as defined in Ref. 20; in Eq. (10), αn is a relaxation parameter, and finally, Λ(f) = diag{λj(f)} is a diagonal scaling matrix in which the entry for update on fj is given by
| (11) |
where qj is chosen as
| (12) |
In Eq. (10), the gradient term ∇Jd(⋅) is obtained by taking the partial-derivatives of the objective function with respective to the individual voxels fj. Specifically, from Eq. (9), we have
| (13) |
In the experiment, D = 16 was used; the subsets were formed such that two consecutively updated subsets were separated as far as possible. The number of subsets was determined empirically to achieve fast numerical convergence based on previous studies in cardiac SPECT.15,16 We observed that while the number of subsets could affect the number of iterations used in BSREM, it had little effect on the reconstruction results upon convergence. The relaxation parameter αn was set as 1/((1/20) n + 1) and the number of iterations was set to 10. It was observed empirically that numerical convergence was obtained after ten iterations.
2.G. Motion-compensated combination of respiratory bins
Once the individual respiratory bins are reconstructed, they are subsequently combined with motion correction to form a single perfusion image with respect to a selected reference bin. This is achieved as follows:
| (14) |
where is the reconstructed bin r and Mr denotes the motion-compensation operator for transforming bin r into the reference bin position. In Eq. (14), , which is the total acquisition time for bin r. It is used to insure that the contributions from individual bins are proportional to their respective acquisition time, thereby maximizing the signal-to-noise ratio in the final average.
In the experiment, we used a translational model in the operator Mr for the myocardium across the different respiratory bins. While simple, a translational model was previously demonstrated to be effective for respiratory correction in cardiac SPECT owing to its limited resolution.21 To determine the motion extent of the respiratory bins, the myocardium was first segmented out based on the image intensity using a region growing method; afterward, its center of gravity was used to determine the motion vector for each bin with respect to the reference bin. In this study, we used the middle bin (bin no. 4 for R = 7) as the reference bin where the diaphragm is at the neutral position. In such a case, M4 is simply the identity operator.
2.H. Image data sets
2.H.1. Phantom simulation
The 4D NCAT 2.0 phantom22 was used to simulate binned SPECT imaging with Tc-99m labeled sestamibi as the imaging agent. The simulation was based on a Philips Prism 3000 SPECT system with a low-energy high-resolution (LEHR) collimator. The projection data were 64 × 64 bins with a pixel size of 0.634 cm. For a circular camera rotation of 28.5 cm radius, 64 projection sets were collected for each bin. The average spatial resolution at the location of the heart in the image slices was approximated 1.3 cm in full-width at half-maximum (FWHM). To simulate the continuous nature of both cardiac motion and respiratory motion during data acquisition, a set of 3D source images was first generated over 28 equally spaced intervals in amplitude within the extent of diaphragm motion with 2 cm in the superoinferior direction and 1.2 cm in the anteroposterior direction; in addition, cardiac beating was also simulated with 8 gates for each respiratory interval. Afterward, the 28 projection sets were rebinned into 7 respiratory bins based on amplitude, where all the cardiac gates were summed within each respiratory bin. Monte-Carlo simulation with SIMIND23 was used for the projection data. The following relative activity levels were introduced for the different organs: heart (ventricular and atrial walls) 1.0, liver 1.0, kidney 1.0, spleen 1.0, gall bladder 0.8, and tissue background 0.053. Attenuation, scatter, and detector response effects were all included in the simulation data. In the reconstruction, both attenuation and detector depth-dependent blur effects were directly modeled in the system matrix in Eq. (1); the scatter component was estimated using the triple energy window (TEW) method24 and included in the likelihood function.
The phantom was generated with the following body dimensions: 35.2, 26.7, and 41.7 cm in long-axis, short-axis, and height, respectively; the corresponding rib dimensions were 30, 22.7, and 37.3 cm, respectively. Two datasets were generated, one with a lesion and the other without. A transmural perfusion defect with 15% intensity reduction was introduced in the anterior–posterior region of the LV. The extent was 20° in the circumferential dimension, and 6 voxels in height along the long-axis dimension. The defect location was shown in Fig. 2(b). There was also a high concentration of activities in the liver. For attenuation correction, we used the averaged attenuation map over all respiratory bins and cardiac gates.
FIG. 2.
Illustration of different ROIs used in quantitative analyses of reconstructed myocardium: (a) A 2D slice of the myocardium and ROI for bias–variance (BV ROI) analysis; (b) lesion location for CHO detection; (c) ROI for LV uniformity measure; and (d) cross section for intensity profile. For illustration purpose, the individual pixels used in assessment of the LV wall are shown in (c) without interpolation.
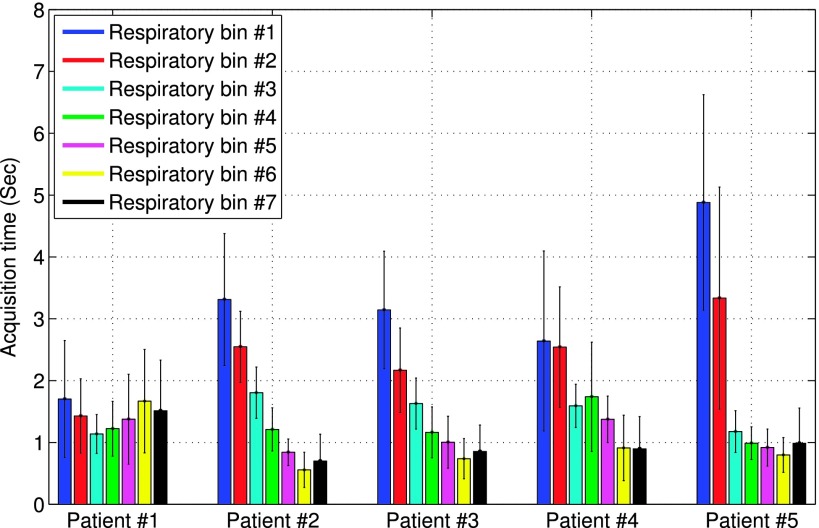
To simulate the uneven distribution of acquisition time among both projection angles and respiratory intervals, the acquisition time at each angle and respiratory bin τr,p in Eq. (2) was rescaled according to that obtained from five real clinical acquisitions. The time distribution patterns of these subjects are shown in Fig. 3, wherein the mean and standard deviation of τr,p among the projection angles are shown for each bin r of each subject. This resulted in five different patterns in acquisition time. Subsequently, Poisson noise was introduced for each acquisition pattern at a level of 8 × 10⁶ total counts as in a typical acquisition at our clinical site. For quantitative evaluation, 10 noise realizations were obtained for each acquisition pattern, and a total of 50 noise realizations were obtained separately for normal and defect simulation data.
FIG. 3.
Distribution patterns of acquisition time from five subjects. For each subject, the mean and standard deviation of the acquisition time over projection angles are shown for individual respiratory bins.
For the purpose of quantitative evaluation (as described subsequently), the reference bin (no. 4) was also reconstructed from the noiseless projection data (neither attenuation nor scatter was included in the projection data), with equal acquisition time for all angles, using the same BSREM algorithm above. This reconstructed image represents the ideal case of perfect acquisition without any limited-angle effect (referred to as “ideal” reference hereafter).
2.H.2. Clinical data
As a preliminary demonstration, we also tested the proposed approach on five sets of clinical data, which were acquired under IRB approval with informed content. The dataset was acquired in list-mode by a Philips BrightView SPECT/CT system with 64 projections over 180∘ and a 128 × 128 matrix. The pixel size was 0.467 cm. The acquisition started from right anterior oblique, passed through anterior and left anterior oblique, and ended at left lateral oblique. Events were recorded within a symmetric energy window centered on 140.5 keV with a width of 15%. A scatter window was also acquired which was centered at 120 keV with a 5% width. With patients quietly breathing, cone-beam CT imaging (60 s) was performed prior to emission and was used for the estimation of attenuation maps. A visual tracking system (Vicon Motion Systems, Inc., Lake Forest, CA) was used to record the respiratory magnitude, based on which the acquired data were rebinned into seven respiratory intervals.
For these five acquisitions, the time distribution patterns among the projection angles and respiratory bins were shown earlier in Fig. 3. The five objects, two male and three female, aged from 54 to 64. Among them four were diagnosed to have normal scans, and one had a small LAD infarct. The motion magnitude values of the LV are listed in Table I for the five subjects. For each subject, both the peak-to-peak displacement of the LV and its maximum displacement from the reference neutral position are given. These values were estimated from the reconstructed respiratory gates. The total acquisition counts for the five patients ranged from 13.2 × 10⁶ to 30.0 × 10⁶. For reconstruction, the TEW method24 was used for scatter correction.
TABLE I.
Motion magnitude values for the five subjects. For each subject, both the peak-to-peak displacement of the LV and its maximum displacement from the reference neutral position are given.
| Patients | 1 | 2 | 3 | 4 | 5 |
|---|---|---|---|---|---|
| Peak-to-peak (cm) | 2.29 | 0.92 | 0.80 | 0.94 | 2.15 |
| Peak-to-reference (cm) | 1.39 | 0.50 | 0.56 | 0.52 | 1.04 |
2.I. Numerical evaluation metrics
2.I.1. Overall error level of myocardium
To quantify the overall accuracy of the reconstructed myocardium, we compute the mean squared error (MSE) in a 30 × 28 × 20 volumetric region containing the entire LV. The MSE of this reconstructed region of interests (ROIs) is computed as
| (15) |
where and denote the reconstructed ROI and its reference, respectively, and M is the total number of voxels in the ROI. As described earlier, f∗ was the ideal reconstruction of the reference bin (i.e., bin no. 4).
2.I.2. Regional bias–variance analyses
To quantify the regional accuracy of the reconstructed LV, we conduct bias–variance analyses on a ROI selected on the LV wall, as shown in Fig. 2(a). Such analyses provide results on both the bias and variance levels of the regional intensity of the LV wall in the reconstruction. Consider a ROI consisting of m voxels. Let denote the mean intensity of the reference image f∗ in the ROI, i.e.,
| (16) |
Our goal is to quantify the statistical accuracy of an estimate of this quantity from different noisy reconstructions.
Let , q = 1, …, Q, denote the estimates of obtained from Q different noise realizations. The mean estimate is computed as
| (17) |
Then the bias and standard deviation (std) of this estimator are estimated, respectively, as
| (18) |
| (19) |
In our experiments, a total of Q = 50 noise realizations were used.
2.I.3. LV uniformity
We quantify the image uniformity of the LV wall reconstructed from the normal case data. For this purpose, a set of voxels are selected along the heart wall in one short-axis slice, as shown in Fig. 2(c), and the average deviation of the intensity of each voxel from the mean of this set of voxels is computed. Specifically, this measure is computed as follows:
| (20) |
where fROI(i) denotes the selected voxels on the heart wall and is the mean value of these selected voxels. A smaller U value indicates a more uniform LV wall.
2.I.4. LV resolution
In order to examine the effect of different compensation schemes on the spatial resolution in the reconstructed images, we plot the image intensity profile for a section across the LV wall, as shown in Fig. 2(d).
2.I.5. Lesion detectability
To quantify lesion detectability in the reconstructed images, which is relevant to diagnostic accuracy, a CHO is used.25 In the CHO, four rotationally symmetric, nonoverlapping input channels are used and the internal noise is included as in Ref. 24. In our experiments, a total of 100 noise realizations (50 lesion-present and 50 lesion-absent) were used and the reconstructed images by each method were assessed by the CHO. The detection performance was summarized using the area under the receiver operating characteristic (ROC) curve (denoted as Az). These ROC studies represented a “signal-known exactly” and “background-known exactly” observer study.
3. RESULTS AND DISCUSSIONS
3.A. Overall accuracy of reconstructed myocardium
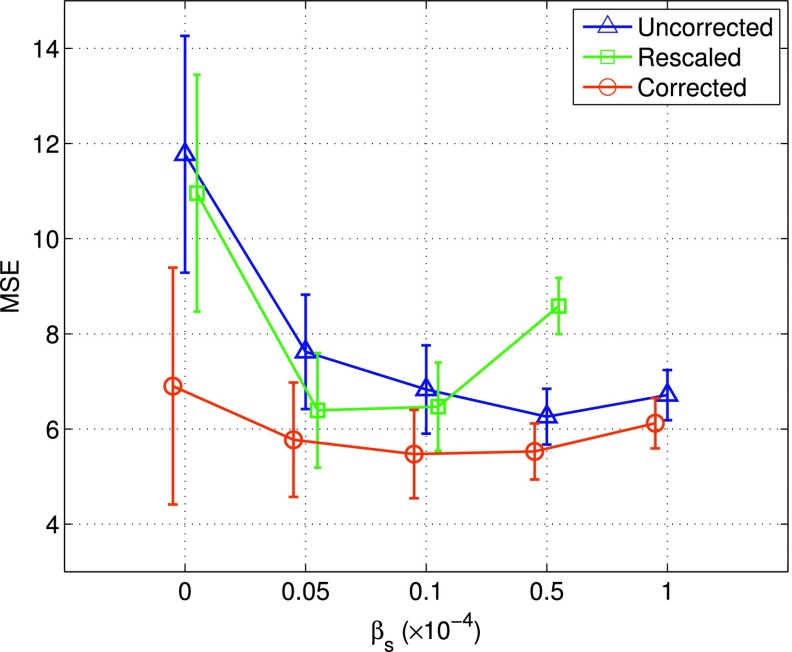
In Fig. 4 we show the MSE results of the reconstructed myocardium obtained by the different reconstruction methods as described in Sec. 2.D. These results were from 50 noise realizations of the normal NCAT, based on which the mean and standard-deviation were obtained. In Fig. 4, each curve corresponds to one of the following three compensation schemes in the reconstruction: (1) model based compensation (corrected), (2) data scaling (rescaled), (3) neither model based nor data scaling compensation (uncorrected). Each curve was started with ML reconstruction (i.e., βs = 0), followed by MAP reconstruction with increased smoothing βs = [0.05, 0.1, 0.5, 1.0] × 10−4.
FIG. 4.
MSE results of the reconstructed myocardium obtained with different correction schemes: (1) model based compensation (“corrected”), (2) data scaling (“rescaled”), (3) neither model based nor data scaling compensation (“uncorrected”). Each curve was started with ML reconstruction (βs = 0), followed by MAP reconstruction with increased smoothing. These results were obtained from 50 noise realizations. Note that four points are shown for rescaled as its MSE error is out of the optimal range once βs is beyond 0.5 × 10⁻⁴.
As can be seen from Fig. 4, when ML reconstruction was used (βs = 0), corrected could greatly reduce the MSE level (hence improved reconstruction accuracy) when compared to both rescaled and uncorrected. While rescaled also achieved reduced MSE over uncorrected, its improvement was much smaller than that of corrected.
Moreover, when spatial smoothing was used (i.e., MAP reconstruction), the MSE level could be further reduced in all three schemes. In particular, the best MSE =5.47 was obtained by corrected with βs = 0.1 × 10⁻⁴. In addition, with spatial smoothing, the MSE levels were reduced greatly in both uncorrected and rescaled. As to be seen subsequently, this indicates that use of a smoothing prior can also be effective for combating the limited angle effect in the reconstructed myocardium, though the improved accuracy could be potentially at the expense of an increased bias level in the reconstruction.
3.B. LV regional accuracy
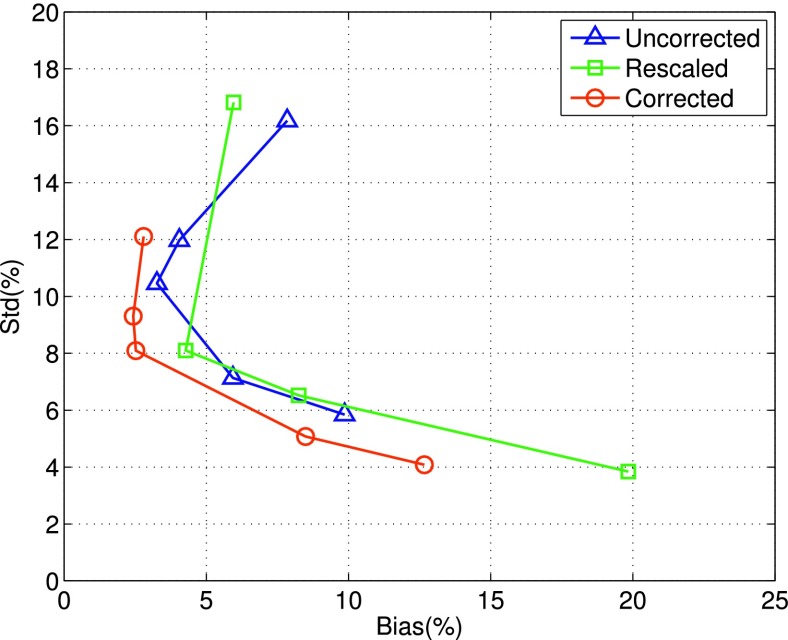
In Fig. 5, we show the results of bias vs std obtained by the different reconstruction methods for an ROI in the midsection of the LV [Fig. 2(a)]. As in Fig. 4, each curve in Fig. 5 corresponds to one of the three compensation schemes; in addition, each curve was started with ML reconstruction (i.e., βs = 0, the upper-left end point of the curve), followed by MAP reconstruction with increased smoothing βs = [0.05, 0.1, 0.5, 1.0] × 10−4. These results were also from 50 noise realizations of the normal NCAT.
FIG. 5.
Plots of bias vs standard-deviation (std) obtained by different reconstruction methods for an ROI in the midsection of the LV. Each curve corresponds to one of the three compensation schemes, i.e., corrected, rescaled, or uncorrected. It was started with ML reconstruction (upper-left endpoint of the curve), followed by MAP reconstruction with increased smoothing. These results were from 50 noise realizations.
It is noted from Fig. 5 that when ML reconstruction was used, corrected achieved both the smallest bias and std when compared to rescaled and uncorrected. Rescaled also reduced the bias level over uncorrected, albeit there was a slight increase in std.
Furthermore, when spatial smoothing (i.e., MAP reconstruction) was used, the std level was reduced in all three compensation schemes; however, the bias level was also noted to increase when the level of smoothing was further increased. Among them, corrected achieved the smallest bias level of 2.5% with std = 8.1%. At this std level, the bias levels of uncorrected and rescaled were roughly between 4% and 6%. These results indicate that compared to rescaled and uncorrected, corrected could achieve the smallest bias at a given std level, and vice versa.
3.C. LV uniformity
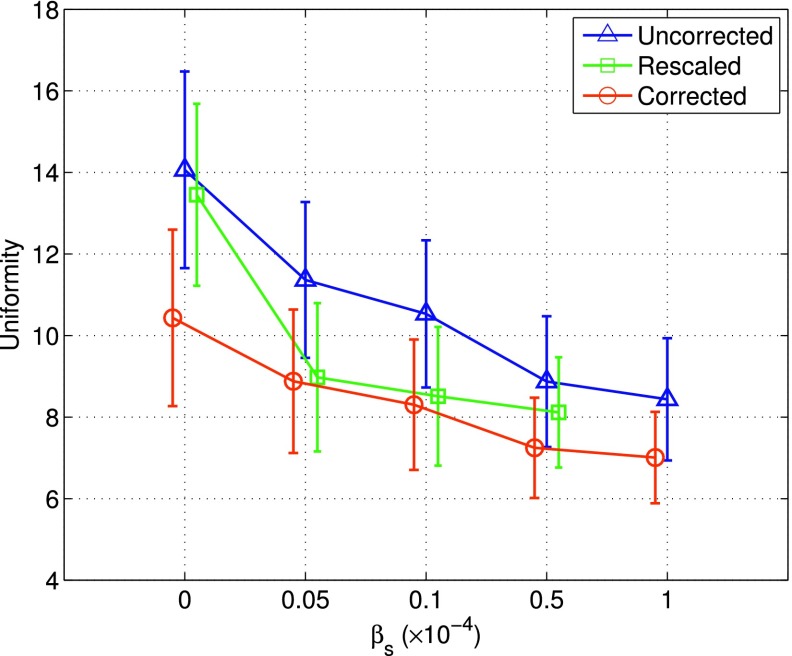
In Fig. 6, we show the uniformity measurements of the normal LV obtained by the different reconstruction methods. As can be seen, when ML reconstruction was used (βs = 0), corrected could achieve the smallest uniformity level (hence most uniform LV) when compared to both rescaled and uncorrected. When spatial smoothing (i.e., MAP reconstruction) was used, the uniformity measure was further improved with increased smoothing level in all the three methods. However, as shown in Fig. 5, this improvement in wall uniformity could be at the expense of increased regional bias in reconstruction. As to be demonstrated subsequently, these uniformity measurements are also consistent with what was observed in the reconstructed images.
FIG. 6.
Uniformity measurement of reconstructed LV from the average of 50 noise realizations. Each curve was started with ML reconstruction (βs = 0), followed by MAP reconstruction with increased smoothing. A smaller uniformity value indicates a more uniform LV.
3.D. LV resolution
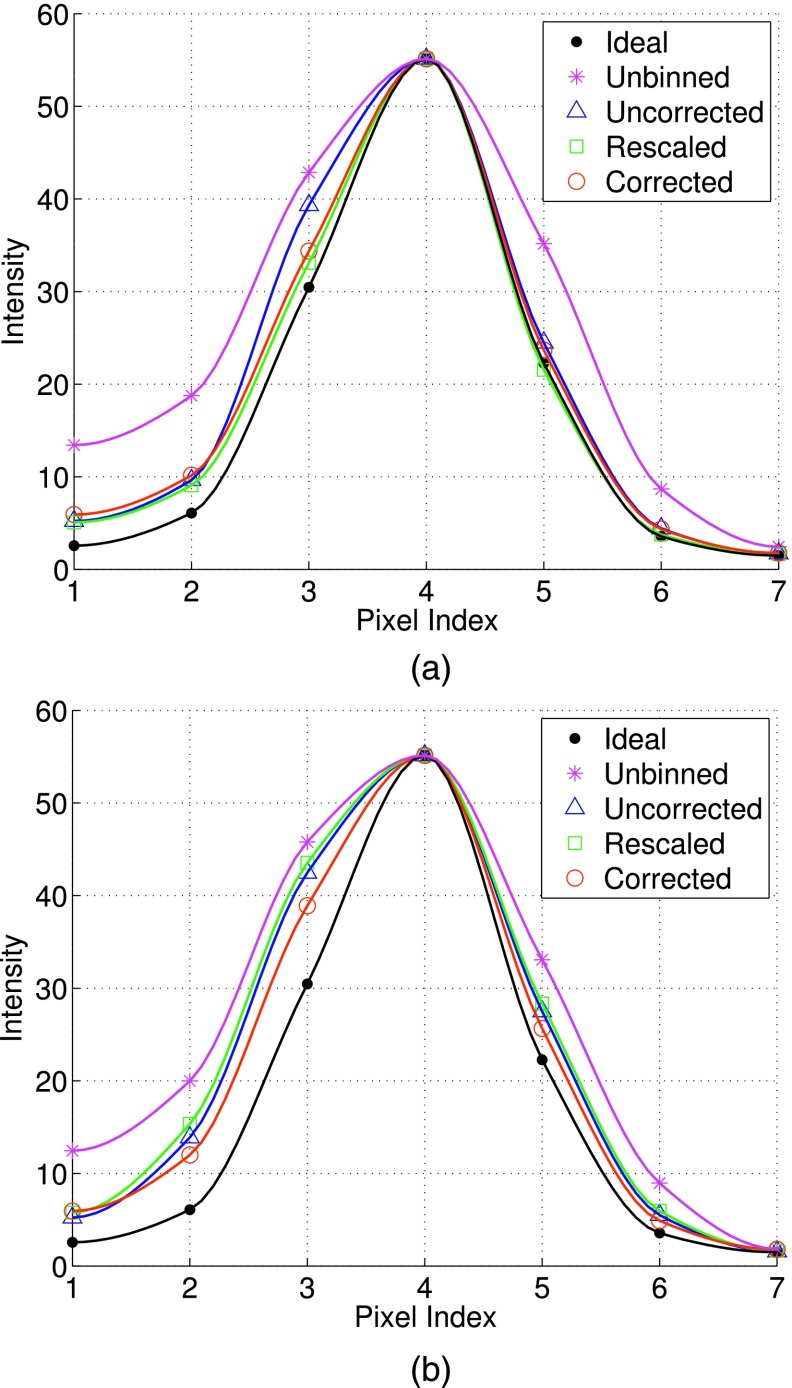
In Fig. 7, we show the intensity profiles of a section across the LV wall [Fig. 2(d)] obtained by the different reconstruction methods. Specifically, Fig. 7(a) shows the results when ML reconstruction was used, and Fig. 7(b) shows the results when MAP reconstruction was used. These results were from the average of 50 noise realizations. For MAP, the smoothing parameter was set based on the optimal MSE results for the different methods earlier in Fig. 4, i.e., 0.1 × 10⁻⁴, 0.5 × 10⁻⁴, 0.05 × 10⁻⁴, and 0.1 × 10⁻⁴ for unbinned, uncorrected, rescaled, and corrected, respectively. For comparison, the intensity profiles from the different methods were rescaled to have the same peak value as the ideal reference.
FIG. 7.
Cross-sectional intensity profiles of the LV obtained with different compensation schemes using: (a) ML reconstruction, and (b) MAP reconstruction. These plots are from the average of 50 noise realizations. To facilitate comparison, the peak intensity from different methods was scaled to be the same as that of ideal.
From Fig. 7(a), it is noted that the intensity profiles of both rescaled and corrected are closer to the ideal reference than that of uncorrected. This indicates that there is a slight resolution loss in the reconstructed LV wall (near the location of pixel no. 3) with uncorrected. As to be seen later in the reconstructed images, such a loss is attributed to the reconstruction artifacts by uncorrected. Furthermore, due to motion correction, uncorrected, rescaled, and corrected all show improvement in resolution over unbinned.
Moreover, from Fig. 7(b), we can see that the intensity profiles of all the three correction methods become wider (hence loss in resolution) than their respective counterparts in Fig. 7(a). Compared to the ideal reference, the most deviation in the MAP reconstruction occurs at pixel nos. 2 and 3 for the different correction methods; these pixels are located near the blood pool. This indicates a resolution loss in the LV wall due to the use of spatial smoothing in MAP. Nevertheless, it is noted that corrected is closer to the ideal reference than both rescaled and uncorrected. This can be attributed to the better accuracy in reconstruction by corrected, as demonstrated in both the MSE and bias–variance results above.
3.E. Lesion detectability
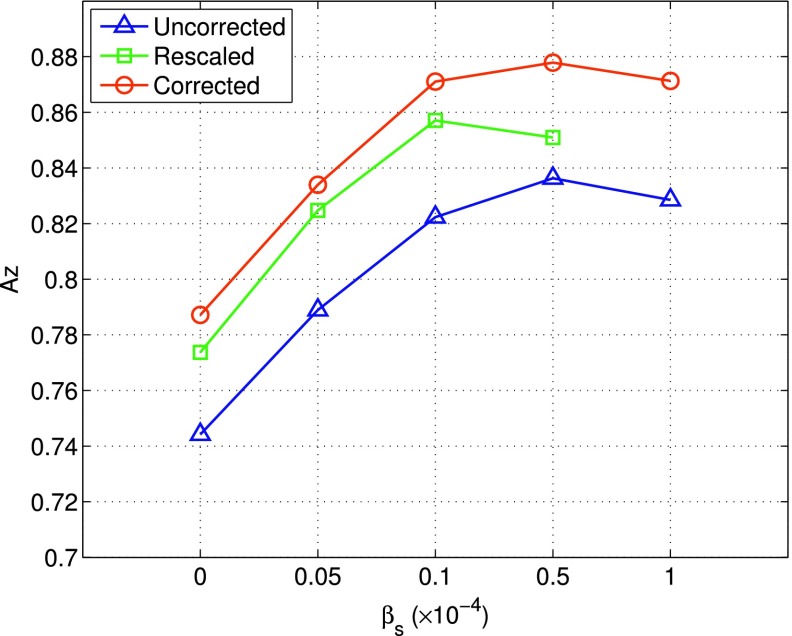
We show in Fig. 8 the lesion detectability results obtained by the different reconstruction methods. As can be seen, when ML reconstruction was used, rescaled achieved the highest Az = 0.861, when compared to both rescaled and uncorrected. When spatial smoothing (i.e., MAP reconstruction) was used, the Az value could be further improved to 0.878 for corrected with βs = 0.5 × 10⁻⁴.
FIG. 8.
CHO lesion detection results (measured in Az) obtained with different correction schemes: corrected, rescaled, and uncorrected. Each curve was started with ML reconstruction (βs = 0), followed by MAP reconstruction with increased smoothing.
3.F. Reconstructed NCAT images
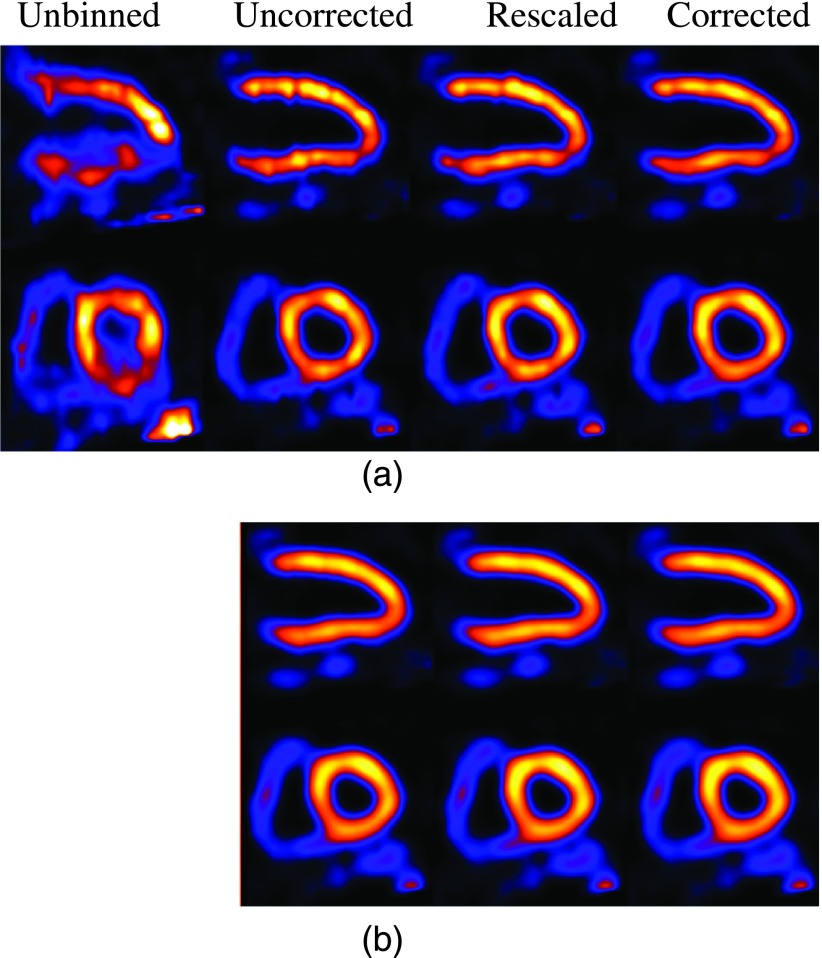
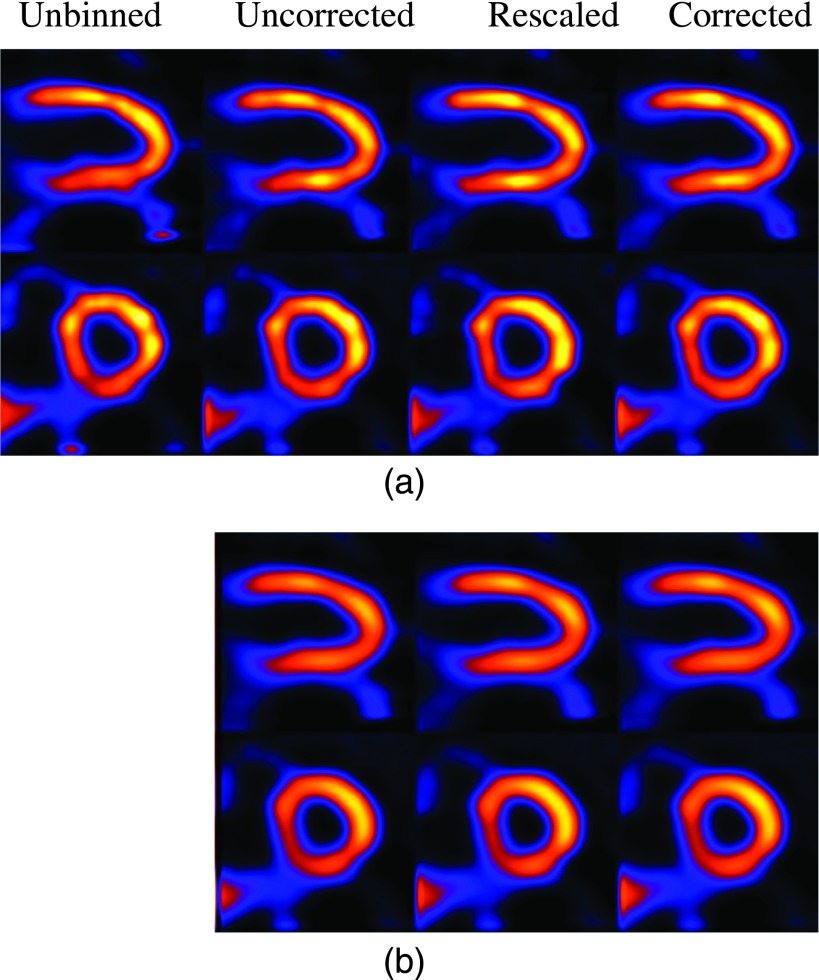
In Fig. 9, we show a set of images obtained by the different reconstruction methods from one realization (the acquisition time of patient no. 1 was used). Specifically, Fig. 9(a) show the results with ML reconstruction and Fig. 9(b) show the results with MAP reconstruction. For the latter, the smoothing parameter was set based on the optimal MSE results for the different methods.
FIG. 9.
Long-axis and short-axis views of reconstructed NCAT images with different correction schemes using (a) ML reconstruction and (b) MAP reconstruction.
From Fig. 9(a), it can be seen that artifacts are most notably present on the LV in uncorrected. While somewhat suppressed, these artifacts are still noticeable in rescaled. In comparison, they are least noticeable in corrected. In addition, in unbinned the anterior section of the LV wall is noted to be more blurred while the interior section suffers from intensity loss due to respiratory motion.
From Fig. 9(b), it can be seen that with spatial smoothing, the artifacts are effectively suppressed in almost all the different methods (with some residuals only slightly noticeable in uncorrected). Also, the LV wall is noted to be much more uniform in all the methods. Of course, this is at the expense of a potential loss in spatial resolution; the LV wall is noted to be a bit more blurry in both uncorrected and rescaled than in corrected. Interestingly, these observations are also consistent with the quantitative results on the reconstructed LV presented above.
3.G. Clinical images
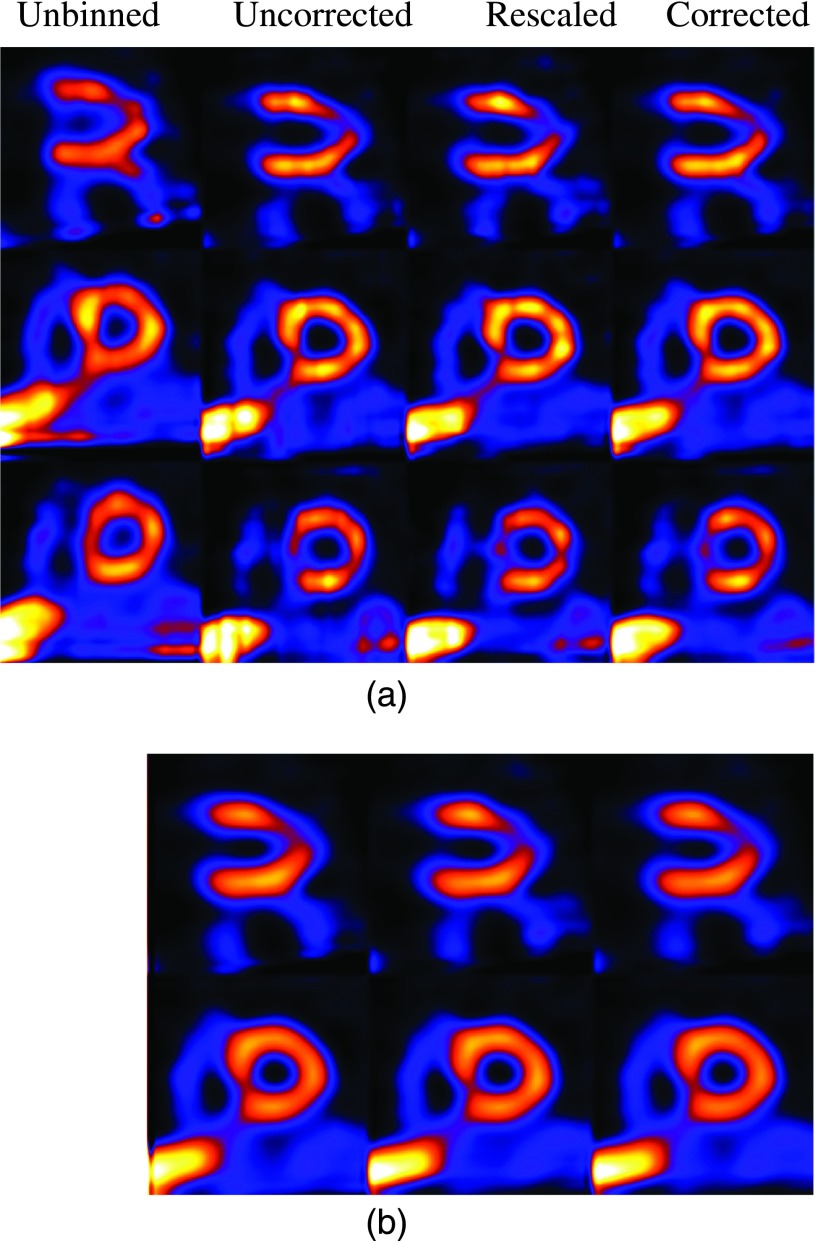
As a preliminary demonstration, in Figs. 10–12, we show some reconstruction results from clinical acquisitions with different correction methods. For brevity, results are shown for only three subjects (nos. 1, 3, and 5) reconstructed with ML and MAP. In these results, the spatial parameter in MAP was set empirically as βs = 0.0001. As can be seen, in these subjects the images from corrected exhibit the least artifacts when compared with rescaled and uncorrected. It is also noted that the level of artifacts varies among the three subjects, with the most improvement observed in subject no. 1 as shown in Fig. 10. This is due to the underlying variability among these subjects in terms of their respiratory patterns. Specifically, Fig. 10 shows a significant distortion in the reconstructed LV without respiratory correction (i.e., unbinned), and thus the most improvement in the reconstruction by corrected. For subject no. 3 as shown in Fig. 11, due to the small motion magnitude (Table I) and relatively even distribution of the respiratory bins (Fig. 3), the reconstructed images are similar from the different methods. For subject no. 5 as shown in Fig. 12, there is a perfusion defect near the apex; for better visualization of the defect, one additional short-axis slice positioned in the defect region is shown. As can be seen, Fig. 12 shows noticeable blur in the extent of the perfusion defect in the unbinned reconstruction (e.g., third row); the reconstructed images from corrected show improved wall uniformity in the normal region when compared with the other methods. Furthermore, for these three patients, the image artifacts are effectively suppressed in MAP reconstruction; there are some residual artifacts only slightly noticeable in the long-axis view in uncorrected for subject no. 1. In addition, the LV wall is noted to be more blurry in MAP than in ML for all the subjects. These results are also consistent with the simulated NCAT images observed earlier in Fig. 9. While not shown, similar results were also obtained for subject nos. 2 and 4; both subjects had similar motion magnitude to subject no. 3, except that the former exhibited more limited-angle artifacts. As in subject no. 1, these artifacts were also suppressed by the different compensation methods.
FIG. 10.
Long-axis and short-axis views of reconstructed images of patient no. 1 with different correction schemes using ML (a) and MAP (b) reconstruction.
FIG. 11.
Long-axis and short-axis views of reconstructed images of patient no. 3 with different correction schemes using ML (a) and MAP (b) reconstruction.
FIG. 12.
Long-axis and short-axis views of reconstructed images of patient no. 5 with different correction schemes using ML (a) and MAP (b) reconstruction. One additional slice positioned in the defect region is shown in the third row in (a).
3.H. Discussions
Collectively, the results in Figs. 9–12 show a great deal of variability in image quality among the different human subjects and NCAT images. We believe that this is caused by a multitude of complex factors associated with data acquisition, including (1) acquisition time variations both among respiratory intervals and among projection angles within individual intervals, (2) variation in respiration magnitude among subjects, (3) variation in acquired counts among subjects, and (4) variation in patient body size. These factors contribute to reconstruction artifacts in different ways. For example, from Table I, it can be seen that subject no. 1 has the largest motion in magnitude, which is consistent with the motion distortion observed in unbinned reconstruction in Fig. 10. However, it can also be seen from Table I that subject no. 5 is similar to subject no. 1 in motion magnitude, but the motion blur observed in Fig. 12 is not as severe. This difference between the two subjects can be attributed to their respiratory patterns shown in Fig. 3. Compared to subject no. 1, the data counts in subject no. 5 are dominated by the first two respiratory bins (because of their much longer time); thus, the motion blur from the rest of the respiratory bins is not exhibited as much in the final combined reconstruction. Moreover, the relative angle variations within the different respiratory bins of subject no. 1 are noted to be also higher than that in the two dominant bins in subject no. 5, which is the reason for the more evident limited-angled artifacts in Fig. 10.
It is noted in the results above in Sec. 3.D that there was a resolution loss in the LV wall in the MAP reconstruction. This can be attributed to the effect of L2 spatial smoothing in Eq. (8). Alternatively, one may consider using edge-preserving smoothing, e.g., L1 smoothing.17 However, we feel that such edge-preserving smoothing may not be effective for suppressing the limited angle effect, because the artifacts themselves could exhibit as false edges.
In this study, we have used a postreconstruction approach for motion correction among the different respiratory gates. Compared to the alternative approach of prereconstruction correction,4,5 it has the flexibility to allow for nonrigid respiratory motion compensation in the image domain. It would be interesting to investigate in future studies whether a nonrigid motion model could lead to further improvement in reconstruction over the translational motion correction used in this study.
4. CONCLUSION
In respiratory binned cardiac SPECT, the acquired data statistics could vary significantly both among different bins and among different projection angles within individual bins due to the nonconstant respiratory motion during acquisition. In this work, we investigated several strategies for reducing the artifacts in reconstruction associated with such variability, which exhibit as limited-angle effect. First, we considered a model based approach (corrected), in which the acquisition time factors at different angles were directly incorporated into the imaging model, so that the acquired data statistics were accurately described. Next, we considered an approximate approach (rescaled), in which the acquired data were rescaled according to the acquisition time at the different angles while without modifying the image model. We also investigated the use of a smoothing prior in reconstruction for reducing the limited-angle effect. We first evaluated the reconstruction accuracy by the different methods using simulated imaging data with NCAT and then demonstrated the different methods with clinical reconstructions from five subjects.
The quantitative results show that use of different correction strategies could effectively improve the overall accuracy of the reconstructed myocardium. Without spatial smoothing, the corrected method could reduce the MSE by as much as 40% compared to reconstruction without correction for the limited-angle effect (uncorrected); an improvement in MSE was also achieved by the rescaled method, though much smaller. When spatial smoothing was also used in reconstruction, the MSE of the myocardium could be further reduced in the different correction methods; the best MSE was achieved by corrected together with spatial smoothing. In the regional bias-variance analysis, corrected could yield the smallest bias compared to both rescaled and uncorrected at the same noise level; with the smoothing level small, the noise level could be reduced at the cost of little or no increase in the regional bias in all the correction methods. However, with increased smoothing, the reduction in noise level was outpaced by the increase in bias. Moreover, the uniformity of the reconstructed LV wall was also observed to be improved with increased spatial smoothing; the reconstructed intensity profiles of a cross section of the LV wall show that there was a slight resolution loss when spatial smoothing was used in all the reconstruction methods, with the least distortion achieved by corrected. The CHO lesion detection results show that reconstruction by corrected with spatial smoothing could also lead to improved detection accuracy when compared to both rescaled and uncorrected. Finally, the reconstructed images from clinical acquisitions also indicate consistent reduction in the imaging artifacts by the different correction methods, with the corrected reconstructions suffering the least limited-angle effect. Encouraged by these results, in the future, we plan to further evaluate the different correction strategies using a much larger set of clinical acquisitions.
ACKNOWLEDGMENT
This work was supported by the National Institutes of Health under Grant No. HL122484.
REFERENCES
- 1.DePuey E. G. and Garcia E. V., “Updated imaging guidelines for nuclear cardiology procedures Part I,” J. Nucl. Cardiol. 8, G5–G58 (2001). 10.1067/mnc.2001.112538 [DOI] [PubMed] [Google Scholar]
- 2.Cooper J. A., Neumann P. H., and McCandless B. K., “Effect of patient motion on tomographic myocardial perfusion imaging,” J. Nucl. Med. 33(8), 1566–1571 (1992). [PubMed] [Google Scholar]
- 3.Segars W. and Tsui B. M. W., “Study of the efficacy of respiratory gating in myocardial SPECT using the new 4D NCAT phantom,” in IEEE Nuclear Science Symposium Conference Record (IEEE, San Diego, CA, 2001), Vol. 3, pp. 1536–1539. 10.1109/NSSMIC.2001.1008630 [DOI] [Google Scholar]
- 4.Mitra D., Eiland D., Abdallah M., Bouthcko R., Gullberg G. T., and Schechtmann N., “SinoCor: Motion correction in SPECT,” Proc. SPIE 8314, 831452 (2012). 10.1117/12.911101 [DOI] [Google Scholar]
- 5.Ueda Y., Kudomi S., Koike M., Oishi Y., Iwanaga H., and Ueda K., “Correction of liver displacement due to irregular respiration for SPECT images obtained using a multiple short-time acquisition with breath-holding technique,” Radiol. Phys. Technol. 5(1), 71–77 (2012). 10.1007/s12194-011-0138-x [DOI] [PubMed] [Google Scholar]
- 6.Cho K., Kumiata S., and Kumazaki T., “Development of a respiratory gated myocardial SPECT system,” J. Nucl. Cardiol. 6, 20–28 (1999). 10.1016/S1071-3581(99)90061-2 [DOI] [PubMed] [Google Scholar]
- 7.Klein G., Reutter B., Ho M. H., Reed J., and Huesman R., “Real-time system for respiratory-cardiac gating in positron tomography,” IEEE Trans. Nucl. Sci. 45(4), 2139–2143 (1998). 10.1109/23.708323 [DOI] [Google Scholar]
- 8.Lu W., Parikh P. J., Hubenschmidt J. P., Bradley J. D., and Low D. A., “A comparison between amplitude and sorting and phase angle sorting use external respiratory measurement for 4D CT,” Med. Phys. 33(8), 2964–2974 (2006). 10.1118/1.2219772 [DOI] [PubMed] [Google Scholar]
- 9.Rit S., Sarrut D., and Desbat L., “Comparison of analytic and algebraic methods for motion-compensated cone-beam ct reconstruction of the thorax,” IEEE Trans. Med. Imaging 28(10), 1513–1525 (2009). 10.1109/TMI.2008.2008962 [DOI] [PubMed] [Google Scholar]
- 10.Lamare F., Carbayo M. J. L., Cresson T., Kontaxakis G., Santos A., Rest C. C. L., Reader A. J., and Visvikis D., “List-mode-based reconstruction for respiratory motion correction in PET using non-rigid body transformations,” Phys. Med. Biol. 52, 5187–5204 (2007). 10.1088/0031-9155/52/17/006 [DOI] [PubMed] [Google Scholar]
- 11.Nehrke K., Börnert P., Manke D., and Böck J. C., “Free-breathing cardiac MR imaging: Study of implications of respiratory motion–initial results,” Radiology 220(3), 810–815 (2001). 10.1148/radiol.2203010132 [DOI] [PubMed] [Google Scholar]
- 12.Jacobson M. and Fessier J., “Joint estimation of respiratory motion and activity in 4D PET using CT side information,” in IEEE 3rd International Symposium on Biomedical Imaging: Nano to Macro (IEEE, Arlington, VA, 2006), pp. 275–278. [Google Scholar]
- 13.Dey J., Segars W. P., Pretorius P. H., Walvick R. P., Bruyant P. P., Dahlberg S., and King M. A., “Estimation and correction of cardiac respiratory motion in SPECT in the presence of limited angle effects due to irregular respiration,” Med. Phys. 37(12), 6453–6465 (2010). 10.1118/1.3517836 [DOI] [PMC free article] [PubMed] [Google Scholar]
- 14.Qi W., Yang Y., Wernick M. N., Pretorius P., and King M. A., “Compensating for limited-angle effect in respiratory-gated cardiac SPECT,” in IEEE 11th International Symposium on Biomedical Imaging (ISBI) (IEEE, Beijing, China, 2014), pp. 1091–1094. [Google Scholar]
- 15.Niu X., Yang Y., Wernick M. N., Jin M., and King M. A., “Effects of motion attenuation and scatter corrections on gated cardiac SPECT reconstruction,” Med. Phys. 38(12), 6571–6585 (2011). 10.1118/1.3660328 [DOI] [PMC free article] [PubMed] [Google Scholar]
- 16.Jin M., Yang Y., Niu X., Martin T., Brankov J. G., Feng B., Pretorius P. H., King M. A., and Wernick M. N., “A quantitative evaluation study of four-dimensional gated cardiac SPECT reconstruction,” Phys. Med. Biol. 54, 5643–5659 (2009). 10.1088/0031-9155/54/18/019 [DOI] [PMC free article] [PubMed] [Google Scholar]
- 17.Qi W., Yang Y., and King M., “Effects of piecewise spatial smoothing in 4D SPECT reconstruction,” IEEE Trans. Nucl. Sci. 61(1), 182–191 (2014). 10.1109/TNS.2013.2291403 [DOI] [Google Scholar]
- 18.Qi W., Yang Y., Niu X., and King M. A., “A quantitative study of motion estimation methods on 4D cardiac gated SPECT reconstruction,” Med. Phys. 39(8), 5182–5194 (2012). 10.1118/1.4738377 [DOI] [PMC free article] [PubMed] [Google Scholar]
- 19.Qi W., Niu X., and Yang Y., “Effects of piecewise smoothing on cardiac SPECT reconstruction,” in IEEE International Conference on Image Processing (IEEE, Brussels, Belgium, 2011), pp. 457–460. [Google Scholar]
- 20.Ahn S. and Fessler J. A., “Globally convergent image reconstruction for emission tomography using relaxed ordered subsets algorithms,” IEEE Trans. Med. Imaging 22, 613–626 (2003). 10.1109/TMI.2003.812251 [DOI] [PubMed] [Google Scholar]
- 21.Parker J. G., Mair B. A., and Gilland D. R., “Respiratory motion correction in gated cardiac SPECT using quaernion-based, rigid-body registration,” Med. Phys. 36, 4742–4754 (2009). 10.1118/1.3215531 [DOI] [PMC free article] [PubMed] [Google Scholar]
- 22.Segars W. P., “Development of a new dynamic NURBS-based cardiac-torso (NCAT) phantom,” Ph.D. dissertation, The University of North Carolina, 2001. [Google Scholar]
- 23.Ljungberg M. and Srand S. V., “A Monte Carlo program simulating scintillation camera imaging,” Comput. Methods Programs Biomed. 29, 257–272 (1989). 10.1016/0169-2607(89)90111-9 [DOI] [PubMed] [Google Scholar]
- 24.King M. A., deVries D. J., Pan T.-S., Pretorius P. H., and Case J. A., “An investigation of the filtering of TEW scatter estimates used to compensate for scatter with ordered subset reconstruction,” IEEE Trans. Nucl. Sci. 44, 1140–1145 (1997). 10.1109/23.596978 [DOI] [Google Scholar]
- 25.Myers K. J. and Barett H. H., “Addition of a channel mechanism to the ideal-observer model,” J. Opt. Soc. Am. A 4(12), 2447–2457 (1987). 10.1364/JOSAA.4.002447 [DOI] [PubMed] [Google Scholar]


