

Abstract
Owing to their unique evolutionary history, modern mammalian X- and Y-chromosomes have highly divergent gene contents counterbalanced by regulatory features, which preferentially restrict expression of X- and Y-specific genes. These 2 characteristics make opposing predictions regarding the expected dissimilarity of X- vs. Y-chromosome influences on biological structure and function. Here, we quantify this dissimilarity using in vivo neuroimaging within a rare cohort of humans with diverse sex chromosome aneuploidies (SCAs). We show that X- and Y-chromosomes have opposing effects on overall brain size but exert highly convergent influences on local brain anatomy, which manifest across biologically distinct dimensions of the cerebral cortex. Large-scale online meta-analysis of functional neuroimaging data indicates that convergent sex chromosome dosage effects preferentially impact centers for social perception, communication, and decision-making. Thus, despite an almost complete lack of sequence homology, and opposing effects on overall brain size, X- and Y-chromosomes exert congruent effects on the proportional size of cortical systems involved in adaptive social functioning. These convergent X–Y effects (i) track the dosage of those few genes that are still shared by X- and Y-chromosomes, and (ii) may provide a biological substrate for the link between SCA and increased rates of psychopathology.
Keywords: aneuploidy, cortical thickness, pseudoautosomal, surface area
Introduction
The XX/XY genetic system for sex determination operates in all eutherian mammals: XY karyotype confers maleness and XX femaleness. X- and Y-chromosomes are thought to have differentiated through stepwise suppression of recombination between a once-homologous autosomal pair of “proto sex chromosomes,” subsequent to a gene on the proto Y-chromosome becoming determinant of male sex (Hughes and Rozen 2012). As part of this process, the sex-limited Y-chromosome has undergone significant degeneration and now differs drastically from the X chromosome in both size (Y vs. X ∼55 Mb vs. 155 Mb) and gene content (Y vs. X: <200 vs. >1000 genes) (Skaletsky et al. 2003; Ross et al. 2005). In humans, there remain only 2 short “pseudoautosomal” regions (PARs) of sequence identity between the X- and Y-chromosomes, which still pair to undergo recombination during meiosis, and together contain <30 genes (Ross et al. 2005). The otherwise gross X–Y sequence divergence predicts highly divergent sex chromosome influences on biological structure and function. However, sex chromosomes have also developed a number of specialized epigenetic features that would be predicted to mitigate against such divergence. Specifically, 1) most Y-specific genes are expressed only in male reproductive organs and are therefore restricted in their ability to exert direct genetic effects in other tissues (Hughes and Rozen 2012) and 2) expression levels of most X chromosome-specific genes are effectively decoupled from X-chromosome dosage by the process of “X-inactivation” (Lyon 1961): In cells with 2 or more X chromosomes, this epigenetic mechanism randomly spares 1 X chromosome while “silencing” approximately 85% of non-PAR X genes from all others (Carrel and Willard 2005).
Determining just how divergent X- and Y-chromosome influences are in humans requires direct comparison between modifications of X- versus Y-chromosome status. Here, we conduct such a test by studying a rare collection of in vivo neuroimaging data from 306 youths aged 5–25 years with diverse sex chromosome complements (80 XX, 89 XY, 28 XXX, 58 XXY, 26 XYY, 20 XXYY, and 5 XXXXY).
The brain provides an ideal organ for comparison of non-gonadal X- and Y-chromosome effects given its relative enrichment for X chromosome gene expression (Nguyen and Disteche 2006) and proven functional sensitivity to alterations of sex chromosome dosage (Lee et al. 2012). Notably, despite their genomic differences, X- and Y-chromosomes have recently been shown to exert partly overlapping effects on language and social functioning (Lee et al. 2012). We focus here on comparing X- and Y-chromosome effects on structural brain development using 2 phylogenetically (Rakic 1995) and ontologically (Raznahan et al. 2011) dissociable properties of the brain, which together determine overall cortical volume (CV), cortical surface area (SA), and thickness (CT). Because SA and CT have differing genetic (Panizzon et al. 2009) and environmental (Raznahan et al. 2012) determinants, their separate analysis tests the biological generalizability of X- and Y-chromosome effects on brain development and helps to more efficiently target which cellular and molecular pathways may underlie these effects. Anatomical metrics of interest were estimated for each scan using well-validated tools for automated segmentation and cortical surface extraction from brain magnetic resonance imaging data (Ad-Dab'bagh et al. 2006).
We begin by considering how total CV, total SA, and overall mean CT vary across karyotype groups. As SA and CT have been shown to have different relationships with total brain volume (TBV) in adulthood (Im et al. 2008), and prior studies indicate that sex chromosome aneuploidy (SCA) can significantly alter TBV (Giedd et al. 2007), we further test whether observed associations between sex chromosome count and cortical anatomy preserve or violate normative scaling relationships between cortical size and TBV. This test allows us to determine whether any observed alterations of global CV, SA, and CT in each group are commensurate with the observed alteration in overall brain size or whether there is evidence that any of these 3 metrics being disproportionately impacted by SCA. To this end, we construct normative scaling laws in youth using an entirely non-overlapping sample of 81 typically developing 11- to 13-year-old controls and use these to estimate what CV, total SA, and mean CT should be in each SCA group given their observed TBV.
Next, we assess X- and Y-chromosome dosage effects on regional cortical anatomy (at ∼80 000 points/vertices across the cortical sheet)—both in terms of absolute vertex SA and CT, and local SA and CT as a proportion of global SA and CT. The study of proportional local anatomy makes it possible to identify instances where a given cortical region shows anatomical effects that are unexpectedly small or large relative to the observed change in overall cortical size. For each measure of regional cortical anatomy, we quantify the observed spatial convergence between X- and Y-chromosome effects and compare this to overlap distributions generated by permutation analyses.
Finally, to identify those domains of cognitive and emotional processing that are most strongly linked to cortical regions showing anatomical sensitivity to sex chromosome dosage, we integrate our findings with a large-scale online platform for meta-analysis of >5000 functional neuroimaging reports (Yarkoni et al. 2011).
Materials and Methods
Participants
The core sample for this study included 306 youth, aged 5–25 years: 137 with SCA (28 XXX, 58 XXY, 26 XYY, 20 XXYY, and 5 XXXXY) and 169 karyotypically normal typically developing controls (80 XX and 89 XY). A non-overlapping sample of 81 typically developing individuals (35 female and 46 male) aged 12–13 years was also included to allow comparison of SCA findings against an independently constructed set of normative allometric scaling laws for the cortical sheet. Participant characteristics are detailed in Table 1.
Table 1.
Participant characteristics
| Characteristic | Core sample |
Sample for allometric analyses | ||||||
|---|---|---|---|---|---|---|---|---|
| XX | XY | XXX | XXY | XYY | XXYY | XXXXY | ||
| Sample size | 80 | 89 | 28 | 58 | 26 | 20 | 5 | 81 (35 female/46 male) |
| Age (years) | ||||||||
| Mean | 12.8 | 12.8 | 12.3 | 12.8 | 12.4 | 14.1 | 12.9 | 12.9 |
| SD | 5.07 | 4.61 | 5.68 | 4.93 | 4.91 | 5.45 | 4.82 | 0.6 |
| Range | 5.39–25.13 | 5.24–25.5 | 5.02–24.78 | 5.21–25.97 | 5.71–23.05 | 5.07–22.96 | 7.66–17.17 | 12.0–13.9 |
| Mean IQ | ||||||||
| Full scale* | 115 | 116 | 92 | 96 | 91 | 87 | 56 | 116 (12.2) |
| Verbal* | 115 | 113 | 93 | 94 | 89 | 81 | 61 | 114 (12.8) |
| Performance* | 111 | 114 | 94 | 99 | 95 | 95 | 56 | 114 (11.5) |
| SES | ||||||||
| Mean* | 47 | 48 | 41 | 55 | 59 | 46 | 69 | 34.2 |
| Race | ||||||||
| Caucasian | 67 | 78 | 23 | 53 | 25 | 18 | 4 | 65 |
| African | 4 | 4 | 0 | 2 | 0 | 0 | 0 | 10 |
| Asian | 2 | 0 | 1 | 1 | 0 | 0 | 0 | 3 |
| Hispanic | 4 | 2 | 3 | 1 | 1 | 1 | 1 | 2 |
| Other | 3 | 5 | 1 | 1 | 0 | 1 | 0 | 1 |
| Tanner stage | ||||||||
| 1 | 20 | 24 | 7 | 18 | 9 | 7 | 2 | 2 |
| 2 | 13 | 14 | 6 | 10 | 4 | 3 | 0 | 10 |
| 3 | 12 | 14 | 6 | 12 | 7 | 3 | 1 | 30 |
| 4 | 20 | 17 | 5 | 8 | 4 | 6 | 1 | 31 |
| 5 | 14 | 17 | 4 | 9 | 2 | 1 | 0 | 2 |
| Not known | 1 | 3 | 0 | 1 | 0 | 0 | 1 | 6 |
Note: SES, socioeconomic status.
*P < 0.01 for omnibus test of significant variation across groups in core sample.
The SCA group was recruited through advertisements via the NIH Web site and parent-support groups across North America (see [Giedd et al. 2007] for study description). To be included in the study, participants must have had an X-/Y-aneuploidy (confirmed by karyotype) and not to have ever had an acquired head injury or condition that would result in gross brain abnormalities. All participants with X-/Y-aneuploidy were non-mosaic. Typically developing participants were all singletons recruited from the United States of America and were enrolled in an ongoing longitudinal study of typical brain development (Raznahan et al. 2011). Inclusionary criteria for healthy participants included never having required special education services, taken psychiatric medications, received mental health treatment, or having had any medical condition impacting the nervous system.
Neuroimaging
The neuroimaging methods used in this study have been previously described (Lenroot et al. 2007; Shaw et al. 2008; Raznahan et al. 2011). Briefly, all scans were T-1-weighted images with contiguous 1.5-mm axial slices, obtained on the same 1.5-T General Electric Signa scanner using a 3D spoiled gradient recalled echo sequence with the following image acquisition parameters: echo time, 5 ms; repetition time, 24 ms; flip angle, 45; acquisition matrix, 256 × 192; number of excitations, 1; and field of view, 24 cm. Native sMRI scans were then submitted to the CIVET pipeline for automated morphometric analysis (Ad-Dab'bagh et al. 2006).
The CIVET pipeline estimates total gray matter volume, white matter volume , and cerebrospinal fluid volume using a validated neural net approach to voxel classification (Zijdenbos et al. 2002; Cocosco et al. 2003). This is an intensity-driven algorithm that requires only linear 9-parameter alignment with an MNI-ICBM152 spatial prior tissue probability map. Consequently, the technique is relatively robust to age- and disease-related morphological deviations from atlas in the study sample (Cocosco et al. 2003).
To generate models gray/white and pial cortical surfaces for each scan, CIVET begins with the tissue classification detailed earlier. Each image is then fitted with 2 deformable mesh models to extract the white/gray and pial surfaces. These surface representations are then used to calculate CT and SA at approximately 80 000 points (vertices) across the cortex (MacDonald et al. 2000) and aligned with each other using a 2D surface-based registration algorithm to allow comparison of measures at equivalent vertices across different scans (Lyttelton et al. 2007) (“vertex-based” analysis). Cortical surfaces are aligned to each other by maximizing correspondence of curvature measures, which capture sulcal features. This approach is predominantly driven by primary sulcal features, which are stable throughout the lifespan and least likely to be altered by disease processes. Cortical thickness and SA analyses were conducted after applying 30-mm and 40-mm bandwidth blurring kernels, respectively (Lerch and Evans 2005). The middle cortical surface, which lies at the geometric center between the inner and outer cortical surfaces, is used for the calculation of the SA as it provides a relatively unbiased representation of sulcal and gyral regions (Lyttelton et al. 2009). All scans included in analyses passed rigorous quality assessment and control of CIVET output for errors in skull removal and definition of cortical surfaces.
The following CIVET pipeline outputs were used to examine X- and Y-chromosome effects on brain anatomy. Global anatomy: total brain tissue (gray matter + white matter) volume (TBV), total CV, total cortical SA, total CT. Local (i.e., vertex-level) anatomy: raw and proportional (i.e., vertex normalized to global) vertex SA and CT.
Statistical Analyses
Descriptive statistics for global anatomy in each group were represented as 1) raw mean (±SD) values in each group and 2) effect-size deviations (±95% confidence intervals) relative to distributions in typically developing XY males. Deviation of SCA global brain anatomy from normative scaling laws was assessed using log-log regression methods to 1) test for interactions between brain size and group in predicting cortical anatomy and 2) compare observed SCV anatomy with predictions from TBV based on normative scaling laws in an independent sample (see Supplementary Text 1.1).
Effects of X- and Y-chromosome aneuploidic count (Xan and Yan, respectively) on each anatomical metric of interest were modeled across our entire sample as follows (using TBV as an example):
| (1) |
Running Equation (1) after first scaling TBV, CV, SA, and CT to a distribution with mean = 0 and SD = 1 provided a way of directly comparing X- and Y-chromosome dosage effects across different aspects of global brain anatomy.
Note that throughout this study, we modeled linear effects of age (rather than higher-order, e.g., quadratic effects) because differences in sample size between karyotype groups did not allow for valid between-group comparison for non-linear age effects. Large longitudinal samples are typically required to confidently detect curvilinear patterns of structural brain maturation (Giedd et al. 1999), which challenges analysis of age-related anatomical alterations in rare populations. We, therefore, restrict ourselves to analysis of group/chromosome dosage effects while co-varying out linear effects of age.
The ß2- and ß3-coefficients of model (1) were determined for vertex-wise SA and CT data—both in raw form and with vertex SA and CT expressed as proportions of total cortical SA and mean cortical CT, respectively. Before visualization on the cortical surface, test statistics associated with these coefficients were corrected for multiple comparisons using False Discovery Rate correction with q (the expected proportion of false positives) set at 0.05. Given that the range of karyotypes within our sample does not equally represent alterations of X- and Y-dose, conjunction between X- and Y-effects (Fig. 2 and Supplementary Fig. 1) was determined after applying a relaxed P = 0.05 (t = 2) threshold for ß2- and ß3-coefficients.
Figure 2.
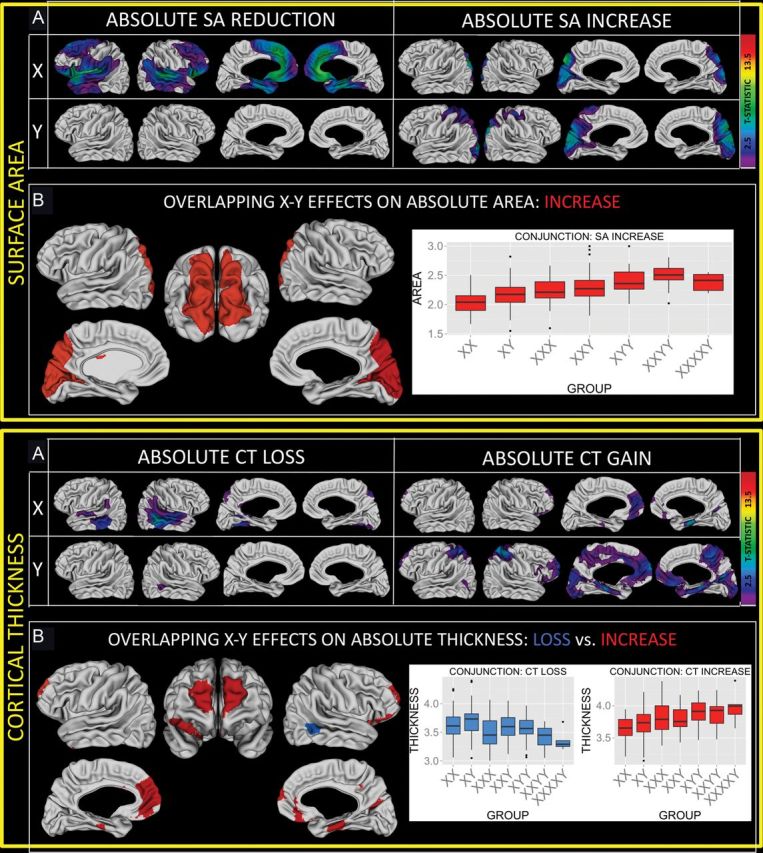
Sex chromosomes and absolute measures of local cortical anatomy. (A) Colored regions are where sex chromosome influences on absolute local SA survive FDR correction for multiple comparisons. Note the symmetric distribution of affected cortical areas within each cell. (B) Regions of convergent X- and Y-chromosome effect based on a nominal P = 0.05 threshold for each chromosomal effect. (C) Colored regions are where sex chromosome influences on absolute local CT survive FDR correction for multiple comparisons. Note the symmetric distribution of affected cortical areas within each cell. (D) Regions of convergent X- and Y-chromosome effect based on a nominal P = 0.05 threshold for each chromosomal effect.
For proportional SA and CT, we used permutation methods to quantify how much greater the observed spatial congruence between X- and Y-chromosome effects was, relative to an empirical null distribution. Yoked X- and Y-aneuploidic dose values were permuted 1000 times across all 306 participants in our study, and correlations between the ß2- and ß3-coefficients in Equation (3) were calculated across all 80 000 cortical vertices for each permutation. We then expressed the observed correlation between ß2- and ß3-coefficients as a centile on this empirical null distribution.
Supplementary analyses tested for and ruled out significant interactions between X-dose and sex (using the XX, XY, XXY, and XXX subset), or X-dose and Y-dose (using the XY, XXY, XYY, and XXYY subset) for variation in each anatomical metric (see Supplementary Text 1.2), and modification of our findings by co-varying for height.
Functional Meta-Analysis of Anatomical Results
Each cluster of convergent X–Y effect yielded a single vertex of peak combined sex chromosome effect, which was submitted to “Neurosynth” (Yarkoni et al. 2011), an online platform for functional neuroimaging meta-analysis. Neurosynth uses automated text parsing methods to extract reported activations/deactivations (henceforth “activations” from neuroimaging articles) and determine which of several thousand pre-specified psychological terms is over-represented in the text of each article (currently Neurosynth includes 5809 articles). The resultant database can be used to 1) carry out large-scale meta-analyses to define activation maps associated with any cognitive term of interest, 2) examine patterns of co-activation between different voxels, and 3) generate Bayesian posterior probabilities for the likelihood of a given cognitive term being over-represented, given activation at any voxel of interest. Importantly, these posterior probabilities, which are scaled across all brain voxels for each cognitive term, capture information about how specific the relationship between activation and over-representation of a cognitive term is. Therefore, we were able to identify those cognitive terms that show specific over-representation given activation at peak voxels of convergent X- and Y-chromosome effect on cortical anatomy. We gathered all terms with a scaled (across the brain) posterior probability score of >4 for at least 1 of 13 peak foci of convergent X- and Y-chromosome effect on proportional SA and CT. Posterior probability Z-scores were then extracted for all focus-term pairings, and this matrix was submitted to heatmap visualization and row/column clustering, to identify cognitive domains association with sets of anatomical foci.
All statistical analyses and data visualizations were carried out within the R language for statistical computing (R Core Team 2013; Whickham 2009).
Results
Sex Chromosome Effects on Global Cortical Anatomy
Mean values of each global anatomical metric for every karyotype group in our study are provided in Table 2. For easy comparison across SCAs, these values were also visualized as effect-size deviations from the distribution in typically developing XY males (Fig. 1A). X chromosome supernumerary is associated with a decrease in total CV, whereas addition of a supernumerary Y-chromosome to the typical male karyotype tends to increase CV. These opposing CV changes are commensurate with accompanying alterations in TBV (see Fig. 1A,B).
Table 2.
Indices of global brain anatomy in each group
| Characteristic | Group |
Omnibus test for group difference |
|||||||
|---|---|---|---|---|---|---|---|---|---|
| XX | XY | XXX | XXY | XYY | XXYY | XXXXY | F statistic | P-value | |
| TBV (cm3) | |||||||||
| Mean | 1262 | 1393 | 1174 | 1290 | 1411 | 1290 | 1132 | 21.20 | <2.2*10–16 |
| SEM | 13.0 | 17.9 | 25.6 | 20.0 | 26.3 | 29.8 | 53.5 | ||
| Total CV (cm3) | |||||||||
| Mean | 585 | 649 | 561 | 607 | 670 | 615 | 554 | 17.10 | <2.2*10–16 |
| SEM | 6.5 | 8.9 | 12.7 | 10.0 | 13.1 | 14.8 | 26.7 | ||
| Total cortical SA (cm2) | |||||||||
| Mean | 1842 | 1979 | 1766 | 1882 | 2007 | 1887 | 1728 | 16.40 | 2.5*10–16 |
| SEM | 14.8 | 20.4 | 29.2 | 22.9 | 30.0 | 34.0 | 61.2 | ||
| Mean CT (mm) | |||||||||
| Mean | 3.48 | 3.57 | 3.49 | 3.53 | 3.63 | 3.55 | 3.52 | 4.70 | 0.0001 |
| SEM | 0.02 | 0.02 | 0.03 | 0.03 | 0.04 | 0.04 | 0.07 | ||
Note: Group-mean values, estimates of error, and omnibus test statistics for each anatomical metric were determined using ß2 coefficients from the following the model: anatomy ∼ intercept + ß1(age-mean age) + ß2(group) + ß3[group × (age-mean age)].
Figure 1.

Sex chromosomes and global measures of brain anatomy. (A) Total brain volume (TBV), CV, total SA, and mean CT in each group expressed as mean (±95% CI) effect-size deviations according to observed distribution in healthy males. (B) Standardized effect-size estimates (±95% CI) for addition of 1 X- and Y-chromosome on each anatomical metric. (C) Global cortical anatomy in the core sample relative to an independent sample of typical controls. These scatterplots display observed distributions of CV, SA, and CT with mean TBV for all karyotype groups within our core sample of 306 participants (groups color-coded), relative to scaling relationships observed in an independent sample of typically developing controls (sex shape coded).
Simultaneously modeling the main effects of X- and Y-dose across our entire sample confirms that 1) increasing X dose significantly reduces TBV, CV, and SA (while leaving CT relatively unaltered), whereas 2) increasing Y dose significantly increases all global measures of cortical and brain anatomy examined in this study (Fig. 1B and Table 3). X-chromosome-induced CV reductions are predominantly driven by SA loss, whereas Y-chromosome-induced CV increases are driven by comparable gains in both SA and CT. This statement is based on knowledge that CV is the product of SA and CT, and visual comparison of the relative effect sizes (±SEM) for chromosome dosage effects on CV, SA, and CT alterations (Fig. 1B).
Table 3.
Standardized coefficients, test statistics, and associated P-values for the linear effects of increasing X- and Y-dose on indices of global brain anatomy
| Characteristic | Standardized effect size |
||
|---|---|---|---|
| Increasing X dose | Increasing Y dose | Increasing age | |
| TBV | −0.55147** | 0.4375* | −0.01244 |
| Total CV | −0.37155** | 0.54089* | −0.07122** |
| Total SA | −0.45287** | 0.45682* | −0.03893* |
| Mean CT | −0.08653 | 0.40055* | −0.09132** |
Note: Values for anatomical change associated with a 1-year increase in age are provided as a comparison.
*significant at P < 0.005; **significant at P < 5 × 10⁻⁵.
Linear regression models within the core sample of 306 participants and direct quantification of normal brain allometry using data from an entirely non-overlapping sample of healthy controls suggest that the apparent “sparing” of CT by alterations of X (but not Y) dose arises naturally given 1) opposing X- and Y-chromosome effects on overall brain size and 2) normative differences between CT and SA in their allometric scaling with TBV (see Fig. 1C and Supplementary Text 1.1).
Sex Chromosome Effects on Local Cortical Anatomy
In keeping with the opposing effects of X- and Y-chromosome dose on overall brain size, and the close relationship between SA and TBV (Fig. 1C), analysis of absolute local SA identifies regional decreases with greater X chromosome dose, and regional increases with greater Y-chromosome dose (Fig. 2A). Significant local SA reductions with greater X chromosome dose are detectable across almost all frontotemporal cortices bilaterally. However, alongside this predominant pattern of SA reduction with greater X chromosome dosage, mounting X aneuploidy is also associated with a bilateral occipitoparietal swath of significant SA expansion, which overlaps those regions where positive relationships between Y-chromosome dose and local SA are most prominent. For absolute CT (Fig. 2B), we find that greater X chromosome dose imparts bilateral temporal CT reductions, and rostromedial prefrontal CT increases. Focal CT increases with greater Y-chromosome dose lie within a more extensive rostromedial expanse that includes regions where CT is also significantly increased by greater X chromosome count. Thus, despite divergent X- and Y-chromosome effects on overall brain size, which are mirrored by predominantly divergent X- and Y-dose effects on local measures of cortical anatomy, X- and Y-chromosomes both exert similar influences on absolute occipitoparietal SA and absolute rostrofrontal CT.
Expressing absolute local SA and CT as a proportion of total SA and mean CT across the cortical sheet (respectively) makes it possible to quantify sex chromosome effects on cortical anatomy in a way that controls for divergent sex chromosome effects on overall cortical size. This approach reveals a striking degree of spatial convergence between X- and Y-chromosomes effects—both in terms of areal distribution and “direction” of effect (i.e., presence of relative anatomical reductions vs. relative increases). This convergence holds for both SA and CT (Fig 3) and unveils regions of conjunction where the X chromosome confers disproportionate anatomical reductions and the Y-chromosome fails to confer proportionate anatomical increases (SA: bilateral ventral and medial prefrontal, CT: bilateral temporal). Peak foci of convergent X- and Y-chromosome effect are listed in Table 4.
Figure 3.
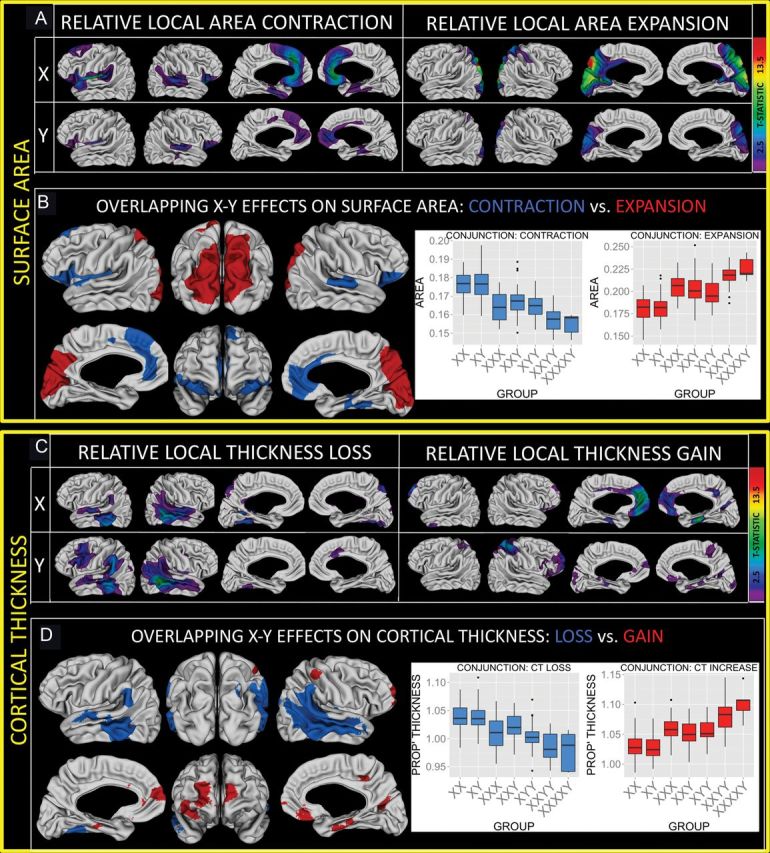
Sex chromosomes and proportional measures of local cortical anatomy. (A) Colored regions are where sex chromosome influences on local SA survive FDR correction for multiple comparisons. Note the symmetric distribution of affected cortical areas within each cell, and the similarity between X- and Y-effects. (B) Regions of convergent X- and Y-chromosome effect on SA based on a nominal P = 0.05 threshold for each chromosomal effect. Overlapping expansion and contraction are shown separately. Inset barplots show the distribution of cortical SA within regions of convergent X- and Y-influence for each group within our study. Note the stepwise relationship between SA and total sex chromosome count. (C,D) Comparable information for sex chromosome effects on proportional local CT. Again, note the symmetric distribution of affected cortical areas within each cell, the similarity between X- and Y-effects, and the stepwise relationship between local anatomy and sex chromosome count.
Table 4.
Foci of peal convergent X- and Y-chromosome effect on proportional SA and CT
| Measure | Effect | Anatomical region | MNI coordinates for peak X–Y convergence |
||
|---|---|---|---|---|---|
| X | Y | Z | |||
| SA | Down | Left posterior insula | −36 | −12 | 15 |
| SA | Down | Left Anterior cingulate | −7 | 38 | 26 |
| SA | Down | Left gyrus rectus | −17 | 26 | −25 |
| SA | Up | Left precuneus | −5 | −74 | 42 |
| SA | Up | Right precuneus | 5 | −76 | 48 |
| SA | Down | Right anterior cingulate | 3 | 38 | −7 |
| SA | Down | Right posterior orbital gyrus | 33 | 31 | −20 |
| CT | Up | Left medial prefrontal cortex | −5 | 63 | −1 |
| CT | Up | Left parahippocampal | −20 | −29 | −20 |
| CT | Down | Left STS/MTG | −64 | −47 | 2 |
| CT | Up | Right parahippocampal | 25 | −28 | −24 |
| CT | Up | Right OFC | 36 | 38 | −10 |
| CT | Down | Right STS/MTG | 62 | −51 | 7 |
To quantify how statistically surprising the degree of convergence between X- and Y-chromosome effects on proportional local cortical anatomy is, we permuted SCA count across participants 1000 times (keeping the same proportions of each unique X- and Y-dose combination) and calculated the observed spatial correlation between X-chromosome dose and Y-chromosome dose effects on anatomy for each permutation—once for local proportional SA, and once for local proportional CT. The spatial correlations in X- and Y-chromosome effect that underlie the conjunction maps shown in Figure 3 lie above the 95th percentiles of their respective permutated correlation distributions. Despite this overwhelming pattern of spatial consilience of X- and Y-effects on proportional local cortical anatomy, a notable disjunction is apparent in left dorsolateral prefrontal and right cingulate cortices (Y-specific CT decreases).
Functional Associations for Foci of Convergent X- and Y-Chromosome Effect
To better understand the potential functional implications of these effects, we submitted spatial locations for foci of peak convergence to a well-validated method for automated meta-analytic synthesis of brain activation patterns across >5000 functional neuroimaging publications [“Neurosynth” (Yarkoni et al. 2011)]. This independently complied repository of structure–function relationships within the human brain provides strong statistical evidence that foci of convergent X–Y effects on SA and CT are preferentially associated with biological motion perception, autobiographical memory, interoception, emotion and reward processing, and language (Fig. 4).
Figure 4.

2D heatmap relating anatomical peaks of convergent X- and Y-chromosome effect to enriched terms in Neurosynth functional neuroimaging meta-analysis. Rows represent Neurosynth terms that showed a significant (Z-score > 4) association with at least 1 of the 13 peak foci of convergent X- and Y-chromosome effect (columns). Heatmap colors encode the strength of association between each anatomical focus and each cognitive term. Row color-coding refers to designations of an optimal four-cluster scheme for Neurosynth terms based on associations with anatomical foci (thematic summary names in color key). Columns are color-coded to indicate anatomical phenotype, “direction” of convergent X- and Y-chromosome effect (i.e., anatomical reduction vs. increase), and cluster designation based on an optimal five-cluster scheme.
Discussion
By utilizing a rare neuroimaging cohort of youth with diverse SCA, we show that the human X- and Y-chromosomes exert diametrically opposed effects on overall brain size yet impact local proportions of the cortical sheet in an almost identical manner. We then use these anatomical findings to target data-mining analyses of a large-scale functional imaging resource, in order to help refine future studies into potential functional consequences of X- and Y-chromosome effects on postnatal brain anatomy.
Sex Chromosome Effects on Global Cortical Anatomy
We show that the X- and Y-chromosomes exert opposing influences on overall human brain size in youth, with attendant alterations to cortical dimensions, which follow normative scaling laws.
The positive relationship we detect between Y-chromosome count and brain size could either reflect the direct action of non-PAR Y genes that are brain-expressed (Skaletsky et al. 2003) or -combined effects of these genes and the male gonadal phenotype that necessarily accompanies a Y-chromosome. The presence of a negative relationship between X dose and brain size—regardless of gonadal sex—is consistent with direct regulation of human brain size by X-chromosome-specific (i.e., non-PAR) genes that escape X-inactivation (Carrel and Willard 2005) although could potentially also arise through mechanisms that are independent of X-chromosome gene content. For example, aneuploidy of gene-rich chromosomes appears to consistently evoke an “anti-proliferative” cellular response across diverse model systems—which presents itself as a plausible candidate mechanism linking increasing supernumerary X dose to decreasing cortical size (Sheltzer et al. 2012). However, interference with proliferation of early cortical progenitor cells is only 1 of several plausible mechanisms through which altered sex chromosome count could modify overall brain size. For example, X- and Y-chromosomes may exert opposing effects on axonal myelination (Moore et al. 2013) or synaptic development. An alternative, if less parsimonious model, would be that opposing X- and Y-chromosome effects on brain size arise through X- and Y-chromosome dosage each impacting a distinct set of processes.
Given normative sex differences in X- and Y-chromosome dosage, it is tempting to link opposing X- and Y-chromosome effects on overall brain size to the well-replicated finding of greater brain volume in typically developing males relative to females (Giedd et al. 2012), which is apparent before pubertal onset. However, even before puberty, normative sex differences in X- and Y-chromosome complement are fully confounded with perinatal sex differences in circulating gonadal steroids (Garagorri et al. 2008)—and dissociation of these effects is challenging in humans as well as animal models (McCarthy et al. 2012). An added layer of complexity comes from growing evidence that sexually differentiated chromosomal and gonadal influences may act in opposition to each other—to reduce phenotypic differences between typically developing males and females (De Vries 2005; Raznahan et al. 2013). Thus, the sex chromosome influences on global and local human brain development that we model across SCAs may be active in the contrast between males and females, without manifesting as measureable sex differences in brain anatomy.
Finally, as a byproduct of our efforts to examine X- and Y-chromosome effects on cortical anatomy in a way that considers their effects on overall brain size, our study establishes that 11- to 13-year-olds show similar non-linear scaling relationships between brain metrics to those who have to date only been reported in adults (Im et al. 2008). An important future step will be determining exactly how early in human development these scaling relationships emerge.
Sex Chromosome Effects on Local Cortical Anatomy
We detect overlapping X- and Y-chromosome effects on local cortical anatomy, which are most striking when local variations in anatomy are expressed as a proportion of X- and Y-effects on overall cortical size. The regional distribution of the local sex chromosome effects we report here converges with prior case–control studies of individual SCA groups (Bryant et al. 2011). However, the diversity of sex chromosome complements represented in our study allows us to draw more direct links between sex chromosome dosage per se and cortical anatomy than would be possible from the study of 1 SCA in isolation. This arises because our sample includes identical alterations in sex chromosome dosage in very different biological contexts (e.g., XXY-XY and XXX-XX contrasts both differ in X count; XYY-XY and XXYY-XY contrasts both differ in Y count), meaning that representation of multiple SCAs effectively decouples changes in chromosome dosage from the many confounds (e.g., endocrine alterations) that may accompany such a change in any single SCA case–control contrast.
By measuring SA and CT as distinct sub-components of cortical anatomy, our study demonstrates that convergent X- and Y-chromosome effects can be shown for biologically dissociable properties of the brain and helps to refine previously reported association between sex chromosome dosage and CV (Lentini et al. 2013) according to the pattern of underlying CT versus SA involvement. This distinction is of practical as well as theoretical importance because translational models for sex chromosome influences on CT and SA can be targeted at different developmental processes based on prior experimental studies of mammalian cortical development (Christodoulou et al. 2013). Indeed, our findings directly attest to the biological dissociability of CT and SA as we find almost no overlap between CT and SA foci of convergent X- and Y-effect.
Functional Associations for Foci of Convergent X- and Y-Chromosome Effect
Our findings provide an anatomical context for the study of cognitive and behavioral alterations across SCA syndromes. First, the spatial overlaps we report here between X- and Y-chromosome effects are consonant with the shared X- and Y-chromosome effects we have previously reported for language and social functioning (Lee et al. 2012)—psychological domains that have been directly linked to the anatomy of cortical regions we now show to be altered by sex chromosome dosage (Wallace et al. 2012; Lee et al. 2013). Second, submitting our anatomical finding to “Neurosynth”—which conducts an on-line meta-analysis of data from several thousand independent functional imaging studies—indicates that reports of altered activity within the cortical regions that show shared X- and Y-chromosome effects are significantly enriched among imaging studies concerned with socio-communicative and socio-emotional processing. This quantitative evidence converges with qualitative reviews, which consider the cortical regions highlighted in our study as being core components of the “social brain” (Lieberman 2007).
Potential Genetic Underpinning for Convergent X- and Y-Chromosome Effects
How might alterations in X- and Y-chromosome count exert convergent effects on local brain development despite the gross lack of sequence homology between X- and Y-chromosomes? These convergent effects could reflect alterations in chromosome count rather than indexing altered dosage of sex chromosome genes per se, although existing data suggest that autosomal aneuploidies do not share the neuroanatomical effects which we find to accompany alterations in X- and Y-chromosome count (Teipel et al. 2004). Alternatively, shared effects of altered X- and Y-chromosome count on local brain anatomy could be accounted for by action of genes which X- and Y-chromosomes still share in common. This notion parsimoniously accommodates 2 empirical observations. First, we find a very clear stepwise relationship between overall sex chromosome count and cortical anatomy in regions of overlapping X- and Y-chromosome effect (insets Fig. 2). Second, the alterations in occipitoparietal SA and temporal CT that we now show to accompany increasing sex chromosome count both overlap with and invert alterations in SA and CT, which have been previously reported in XO relative to XX females (Raznahan et al. 2010; Lepage et al. 2013). Because non-PAR X-Y homolog genes no longer undergo recombination and are known to have already developed highly divergent functional profiles (Wilson and Makova 2009), PAR genes represent the X–Y homologs most capable of accounting for overlapping X- and Y-chromosome phenotypic effects. Directly testing the hypothesis that PAR genes mediate convergent X- and Y-chromosome effects on brain development would require experimental model systems that allow chromosome-specific spatiotemporal control of brain gene expression.
Limitations
Our findings should be considered in light of certain study limitations. First, the relative rarity of the SCA groups studied, combined with the cross-sectional nature of our data, makes it difficult to adequately test for how our findings may change as a function of age. There is a need for longitudinal follow-up of our cross-sectional findings. Second, we did not have information about aneuploidic X chromosome parent of origin for our participants, and this property has been shown to modify associations between X chromosome haploinsufficieny and cortical anatomy (Lepage et al. 2013). However, we find similar rather than different X- and Y-chromosome effects (see insets Fig. 3) across SCA syndromes that are known to differ in the ratio of paternal versus maternal inheritance for the aneuploidic sex chromosome (Hall et al. 2006). Third, our study focuses on the cortical sheet, and analogous analyses of fine-scale variation in subcortical anatomy (Raznahan et al. 2014) will be an important future step.
Conclusions
Notwithstanding the above-mentioned limitations, our study establishes that despite having undergone an almost complete loss of sequence homology and exerting entirely opposing effects on overall brain size, modern human X- and Y-chromosomes have largely homologous effects on local cortical anatomy. This surprising homology in X- and Y-chromosome effects on local brain anatomy generalizes across 2 biologically dissociable components of the cortical sheet and appears to preferentially modify the development of brain systems that support adaptive socio-communicative and socio-emotional functioning. We propose that these homologous effects of changes in X- and Y-chromosome are most likely to reflect the action of PAR genes—last surviving remnants of a once widespread homology in gene sequence and function between sex chromosomes. The resulting inference—that PAR genes may be important regulators of social brain development—is in keeping with theoretical models predicting involvement of PAR genes in sexually selected traits (Otto et al. 2011) and provides testable hypotheses regarding the genetic bases for shared alterations of social functioning across diverse SCA syndromes (Lee et al. 2012).
Supplementary Material
Supplementary material can be found at: http://www.cercor.oxfordjournals.org/
Funding
This study was funded by the NIH Intramural Research Program.
Supplementary Material
Notes
The authors thank the participants and families who took part in this study. Conflict of Interest: None declared.
References
- Ad-Dab'bagh Y, Einarson D, Lyttelton O, Muehlboeck J-S, Mok K, Ivanov O, Vincent RD, Lepage C, Lerch J, Fombonne E, et al. 2006. The CIVET image-processing environment: a fully automated comprehensive pipeline for anatomical neuroimaging research. In: Corbetta M, editor. Proceedings of the 12th Annual Meeting of the Organization for Human Brain Mapping. Florence, Italy: NeuroImage. [Google Scholar]
- Bryant DM, Hoeft F, Lai S, Lackey J, Roeltgen D, Ross J, Reiss AL. 2011. Neuroanatomical phenotype of Klinefelter syndrome in childhood: a voxel-based morphometry study. J Neurosci. 31:6654–6660. [DOI] [PMC free article] [PubMed] [Google Scholar]
- Carrel L, Willard HF. 2005. X-inactivation profile reveals extensive variability in X-linked gene expression in females. Nature. 434:400–404. [DOI] [PubMed] [Google Scholar]
- Christodoulou S, Goula T, Ververidis A, Drosos G. 2013. Vitamin D and bone disease. BioMed Res Int. 2013:396541. [DOI] [PMC free article] [PubMed] [Google Scholar]
- Cocosco CA, Zijdenbos AP, Evans AC. 2003. A fully automatic and robust brain MRI tissue classification method. Med Image Anal. 7:513–527. [DOI] [PubMed] [Google Scholar]
- De Vries GJ. 2005. Sex steroids and sex chromosomes at odds? Endocrinology. 146:3277–3279. [DOI] [PMC free article] [PubMed] [Google Scholar]
- Garagorri JM, Rodriguez G, Lario-Elboj AJ, Olivares JL, Lario-Munoz A, Orden I. 2008. Reference levels for 17-hydroxyprogesterone, 11-desoxycortisol, cortisol, testosterone, dehydroepiandrosterone sulfate and androstenedione in infants from birth to six months of age. Eur J Pediatr. 167:647–653. [DOI] [PubMed] [Google Scholar]
- Giedd JN, Blumenthal J, Jeffries NO, Castellanos FX, Liu H, Zijdenbos A, Paus T, Evans AC, Rapoport JL. 1999. Brain development during childhood and adolescence: a longitudinal MRI study. Nat Neurosci. 2:861–863. [DOI] [PubMed] [Google Scholar]
- Giedd JN, Clasen LS, Wallace GL, Lenroot RK, Lerch JP, Wells EM, Blumenthal JD, Nelson JE, Tossell JW, Stayer C, et al. 2007. XXY (Klinefelter Syndrome): a pediatric quantitative brain magnetic resonance imaging case-control study. Pediatrics. 119:e232–e240. [DOI] [PubMed] [Google Scholar]
- Giedd JN, Raznahan A, Mills K, Lenroot RK. 2012. Review: magnetic resonance imaging of male/female differences in human adolescent brain anatomy. Biol Sex Differ. 3:19. [DOI] [PMC free article] [PubMed] [Google Scholar]
- Hall H, Hunt P, Hassold T. 2006. Meiosis and sex chromosome aneuploidy: how meiotic errors cause aneuploidy; how aneuploidy causes meiotic errors. Curr Opin Genet Dev. 16:323–329. [DOI] [PubMed] [Google Scholar]
- Hughes JF, Rozen S. 2012. Genomics and genetics of human and primate y chromosomes. Ann Rev Genom Hum Gen. 13:83–108. [DOI] [PubMed] [Google Scholar]
- Im K, Lee JM, Lyttelton O, Kim SH, Evans AC, Kim SI. 2008. Brain size and cortical structure in the adult human brain. Cereb Cortex. 18:2181–2191. [DOI] [PubMed] [Google Scholar]
- Lee NR, Raznahan A, Wallace GL, Alexander-Bloch A, Clasen LS, Lerch JP, Giedd JN. 2013. Anatomical coupling among distributed cortical regions in youth varies as a function of individual differences in vocabulary abilities. Hum Brain Mapp. 35(5):1885–1895. [DOI] [PMC free article] [PubMed] [Google Scholar]
- Lee NR, Wallace GL, Adeyemi EI, Lopez KC, Blumenthal JD, Clasen LS, Giedd JN. 2012. Dosage effects of X and Y chromosomes on language and social functioning in children with supernumerary sex chromosome aneuploidies: implications for idiopathic language impairment and autism spectrum disorders. J Child Psychol Psychiatry. 53:1072–1081. [DOI] [PMC free article] [PubMed] [Google Scholar]
- Lenroot RK, Gogtay N, Greenstein DK, Wells EM, Wallace GL, Clasen LS, Blumenthal JD, Lerch J, Zijdenbos AP, Evans AC, et al. 2007. Sexual dimorphism of brain developmental trajectories during childhood and adolescence. Neuroimage. 36:1065–1073. [DOI] [PMC free article] [PubMed] [Google Scholar]
- Lentini E, Kasahara M, Arver S, Savic I. 2013. Sex differences in the human brain and the impact of sex chromosomes and sex hormones. Cereb Cortex. 23:2322–2336. [DOI] [PubMed] [Google Scholar]
- Lepage JF, Hong DS, Mazaika PK, Raman M, Sheau K, Marzelli MJ, Hallmayer J, Reiss AL. 2013. Genomic imprinting effects of the X chromosome on brain morphology. J Neurosci. 33:8567–8574. [DOI] [PMC free article] [PubMed] [Google Scholar]
- Lerch JP, Evans AC. 2005. Cortical thickness analysis examined through power analysis and a population simulation. Neuroimage. 24:163–173. [DOI] [PubMed] [Google Scholar]
- Lieberman MD. 2007. Social cognitive neuroscience: a review of core processes. Ann Rev Psychol. 58:259–289. [DOI] [PubMed] [Google Scholar]
- Lyon MF. 1961. Gene action in the X-chromosome of the mouse (Mus musculus L.). Nature. 190:372–373. [DOI] [PubMed] [Google Scholar]
- Lyttelton O, Boucher M, Robbins S, Evans A. 2007. An unbiased iterative group registration template for cortical surface analysis. Neuroimage. 34:1535–1544. [DOI] [PubMed] [Google Scholar]
- Lyttelton OC, Karama S, Ad-Dab'bagh Y, Zatorre RJ, CArbonell F, Worsley K, Evans AC. 2009. Positional and surface area asymmetry of the human cerebral cortex. Neuroimage. 46(4):895–903. [DOI] [PubMed] [Google Scholar]
- MacDonald D, Kabani N, Avis D, Evans AC. 2000. Automated 3-D extraction of inner and outer surfaces of cerebral cortex from MRI. Neuroimage. 12:340–356. [DOI] [PubMed] [Google Scholar]
- McCarthy MM, Arnold AP, Ball GF, Blaustein JD, De Vries GJ. 2012. Sex differences in the brain: the not so inconvenient truth. J Neurosci. 32:2241–2247. [DOI] [PMC free article] [PubMed] [Google Scholar]
- Moore S, Patel R, Hannsun G, Yang J, Tiwari-Woodruff SK. 2013. Sex chromosome complement influences functional Callosal Myelination. Neuroscience. 245:166–178. [DOI] [PMC free article] [PubMed] [Google Scholar]
- Nguyen DK, Disteche CM. 2006. Dosage compensation of the active X chromosome in mammals. Nat Genet. 38:47–53. [DOI] [PubMed] [Google Scholar]
- Otto SP, Pannell JR, Peichel CL, Ashman TL, Charlesworth D, Chippindale AK, Delph LF, Guerrero RF, Scarpino SV, McAllister BF. 2011. About PAR: the distinct evolutionary dynamics of the pseudoautosomal region. Trends Genet. 27:358–367. [DOI] [PubMed] [Google Scholar]
- Panizzon MS, Fennema-Notestine C, Eyler LT, Jernigan TL, Prom-Wormley E, Neale M, Jacobson K, Lyons MJ, Grant MD, Franz CE, et al. 2009. Distinct genetic influences on cortical surface area and cortical thickness. Cereb Cortex. 19:2728–2735. [DOI] [PMC free article] [PubMed] [Google Scholar]
- Rakic P. 1995. A small step for the cell, a giant leap for mankind: a hypothesis of neocortical expansion during evolution. Trends Neurosci. 18:383–388. [DOI] [PubMed] [Google Scholar]
- Raznahan A, Cutter W, Lalonde F, Robertson D, Daly E, Conway GS, Skuse DH, Ross J, Lerch JP, Giedd JN, et al. 2010. Cortical anatomy in human X monosomy. Neuroimage. 49:2915–2923. [DOI] [PMC free article] [PubMed] [Google Scholar]
- Raznahan A, Greenstein D, Lee NR, Clasen LS, Giedd JN. 2012. Prenatal growth in humans and postnatal brain maturation into late adolescence. Proc Natl Acad Sci USA. 109:11366–11371. [DOI] [PMC free article] [PubMed] [Google Scholar]
- Raznahan A, Probst F, Palmert MR, Giedd JN, Lerch JP. 2013. High resolution whole brain imaging of anatomical variation in XO, XX, and XY mice. Neuroimage. 83:962–968. [DOI] [PMC free article] [PubMed] [Google Scholar]
- Raznahan A, Shaw P, Lalonde F, Stockman M, Wallace GL, Greenstein D, Clasen L, Gogtay N, Giedd JN. 2011. How does your cortex grow? J Neurosci. 31:7174–7177. [DOI] [PMC free article] [PubMed] [Google Scholar]
- Raznahan A, Shaw PW, Lerch JP, Clasen LS, Greenstein D, Berman R, Pipitone J, Chakravarty MM, Giedd JN. 2014. Longitudinal four-dimensional mapping of subcortical anatomy in human development. Proc Natl Acad Sci USA. 111(4):1592–1597. [DOI] [PMC free article] [PubMed] [Google Scholar]
- R Core Team (2013) R: A language and environment for statistical computing. Vienna: R Foundation for Statistical Computing.
- Ross MT, Grafham DV, Coffey AJ, Scherer S, McLay K, Muzny D, Platzer M, Howell GR, Burrows C, Bird CP, et al. 2005. The DNA sequence of the human X chromosome. Nature. 434:325–337. [DOI] [PMC free article] [PubMed] [Google Scholar]
- Shaw P, Kabani NJ, Lerch JP, Eckstrand K, Lenroot R, Gogtay N, Greenstein D, Clasen L, Evans A, Rapoport JL, et al. 2008. Neurodevelopmental trajectories of the human cerebral cortex. J Neurosci. 28:3586–3594. [DOI] [PMC free article] [PubMed] [Google Scholar]
- Sheltzer JM, Torres EM, Dunham MJ, Amon A. 2012. Transcriptional consequences of aneuploidy. Proc Natl Acad Sci USA. 109:12644–12649. [DOI] [PMC free article] [PubMed] [Google Scholar]
- Skaletsky H, Kuroda-Kawaguchi T, Minx PJ, Cordum HS, Hillier L, Brown LG, Repping S, Pyntikova T, Ali J, Bieri T, et al. 2003. The male-specific region of the human Y chromosome is a mosaic of discrete sequence classes. Nature. 423:825–837. [DOI] [PubMed] [Google Scholar]
- Teipel SJ, Alexander GE, Schapiro MB, Moller HJ, Rapoport SI, Hampel H. 2004. Age-related cortical grey matter reductions in non-demented Down's syndrome adults determined by MRI with voxel-based morphometry. Brain. 127:811–824. [DOI] [PubMed] [Google Scholar]
- Wallace GL, Shaw P, Lee NR, Clasen LS, Raznahan A, Lenroot RK, Martin A, Giedd JN. 2012. Distinct cortical correlates of autistic versus antisocial traits in a longitudinal sample of typically developing youth. J Neurosci. 32:4856–4860. [DOI] [PMC free article] [PubMed] [Google Scholar]
- Wickham H. (2009) ggplot2: elegant graphics for data analysis. New York: Springer. [Google Scholar]
- Wilson MA, Makova KD. 2009. Evolution and survival on eutherian sex chromosomes. PLoS Genet. 5:e1000568. [DOI] [PMC free article] [PubMed] [Google Scholar]
- Yarkoni T, Poldrack RA, Nichols TE, Van Essen DC, Wager TD. 2011. Large-scale automated synthesis of human functional neuroimaging data. Nature Methods. 8:665–670. [DOI] [PMC free article] [PubMed] [Google Scholar]
- Zijdenbos AP, Forghani R, Evans AC. 2002. Automatic "pipeline" analysis of 3-D MRI data for clinical trials: application to multiple sclerosis. IEEE Trans Med Imaging. 21:1280–1291. [DOI] [PubMed] [Google Scholar]
Associated Data
This section collects any data citations, data availability statements, or supplementary materials included in this article.