
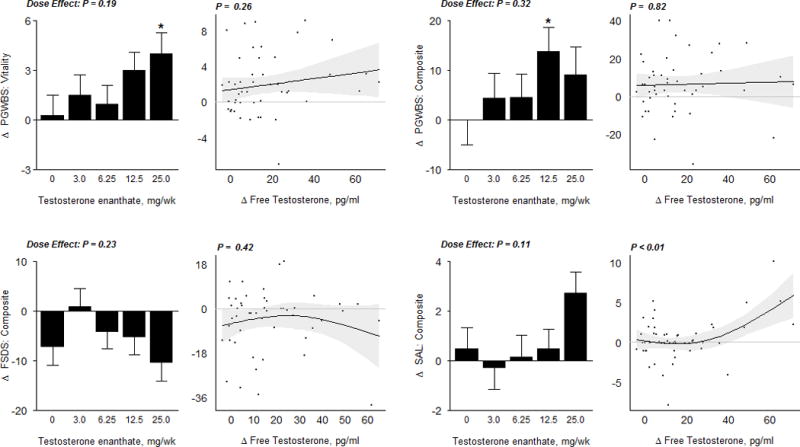
Figure 3B.
Sexual Function Outcome Measures
In the bar graphs on the left, data represent absolute mean changes (± SE) from baseline for each treatment group. The * represents a significant difference between mean on treatment change in dose group vs. placebo at a 0.05 level; the significance level for the overall dose effect (by likelihood ratio test) is also shown. Scatterplots on the right display estimates and 95% confidence regions for the Generalized Additive Model (GAM) of change in sexual function outcomes as a function of free testosterone levels. The p−values displayed here are from a significance test of no association. SAL, Sexual Activity Log; FSDS, Female Sexual Distress Scale; PGWBI, Psychological General Well-Being Index