

Abstract
Introduction
Reflection is a special type of reentry in which an electrical wave front travels in a forward direction through tissue that is then re-excited by a wave front that propagates backward. This type of reentry has been studied computationally in one-dimensional fibers and verified experimentally. Different hypotheses explaining reflected reentry have been proposed based on the structure and heterogeneity of the tissue properties, but the mechanism remains uncertain.
Methods and Results
We used the bidomain model to represent cardiac tissue and the Luo-Rudy model to describe the active membrane properties. We consider an ischemic region in a volume of ventricular myocardium. Our results show that a slow depolarization in the ischemic border zone caused by electrotonic coupling to depolarized tissue in the normal region creates a delay between proximal and distal regions that produces enough electrotonic current in the distal region to re-excite the proximal region.
Conclusion
Our simulation shows that an early after depolarization (EAD) is not the source of the reflection. It depends on the pacing interval and stimulus strength necessary to maintain enough time delay between proximal and distal regions.
Keywords: reentry, reflection, Luo-Rudy model, bidomain model, electrotonic current
Introduction
Reentry is a self-perpetuating circulating wave front that underlies dangerous arrhythmias such as ventricular tachycardia and ventricular fibrillation. Often reentry is conceptualized as occurring around an anatomical barrier, yet functional reentry does not require any barrier. For instance, spiral wave reentry occurs in tissue with no anatomical obstacles1.
Sometimes reentry initiates by a mechanism similar to a one-dimensional behavior known as reflection, a term coined by Wit et al.2. Reflections may be responsible for premature cardiac contractions3 and may initiate fatal cardiac arrhythmias4. Their mechanism, however, is not clear. Antzelevitch et al.5 performed an experiment using a Purkinje fiber having two excitable regions separated by an inexcitable gap. When the proximal end was stimulated a wave front propagated toward the center. Because the central region was inexcitable it could transmit only electrotonic currents. These slow currents brought the distal region to threshold and fired an action potential, which in turn generated electrotonic currents that propagated in the retrograde direction over the same inexcitable gap and re-exited the proximal region. Subsequent experiments analyzing reflection were performed in Purkinje fibers6-8, ventricular muscle9, and atrial muscle10.
Reflected reentry was first explored computationally by Cabo and Barr11. They coupled two excitable segments of a one-dimensional fiber by an external resistance. Neither early after depolarizations (EADs) nor diastolic depolarization (automaticity) was required for reflection. Instead, the delay between proximal and distal regions had to be long enough for the proximal region to recover from refractoriness, so the distal tissue could re-excite it.
In this paper, our goal is to analyze two-dimensional reentry at the border of normal and ischemic regions in cardiac tissue. The reentry we observe is not anatomical (there is no obstacle that determines where in the border zone it originates), but it is not a spiral wave either, at least initially. Its initiation can best be described as a reflection. Using numerical simulations, we examine the nature of this type of reentry, which may be responsible for the induction of deadly cardiac arrhythmias.
Methods
We use the bidomain model12 to represent the electrical properties of cardiac tissue. The bidomain model is the state-of-the-art mathematical description of cardiac tissue, which represents the intracellular space as one domain and the extracellular space as another. This model is a continuum; it represents an average over the complex cellular and subcellular architecture. The electrical conductivity of the tissue is anisotropic but homogeneous in each domain (Table 1).
Table 1.
Bidomain parameters used in the calculation.
| Parameter | Symbol | Roth (1988) |
|---|---|---|
| Intracellular conductivity parallel to the fibers (S/m) | giz | 0.1863 |
| Intracellular conductivity perpendicular to the fibers (S/m) | giρ | 0.0179 |
| Extracellular conductivity parallel to the fibers (S/m) | gez | 0.1863 |
| Extracellular conductivity perpendicular to the fibers (S/m) | geρ | 0.0894 |
| Cell membrane capacitance (μF/cm2) | Cm | 1 |
| Surface-to-volume ratio (1/μm) | β | 0.3 |
The current across in the cell membrane is governed by the dynamic Luo-Rudy (LRd) model13. This model describes the tissue excitability and refractoriness using several ion channels, including sodium, potassium, and calcium channels as well as the kinetics of intracellular stores of calcium. In our calculations, two factors can change the transmembrane potential: the membrane current through ion channels governed by the Luo-Rudy model, and electrotonic current caused by voltage gradients in the intracellular and extracellular spaces governed by the bidomain model14.
To investigate the effect of a localized heterogeneity, we consider an ischemic region in a volume of ventricular myocardium. The extracellular potassium concentration [K]e is raised on the right to 12 mM compared to the normal 4 mM on the left. Figure 1 depicts the spatial distribution of the resting transmembrane potential.
Figure 1.
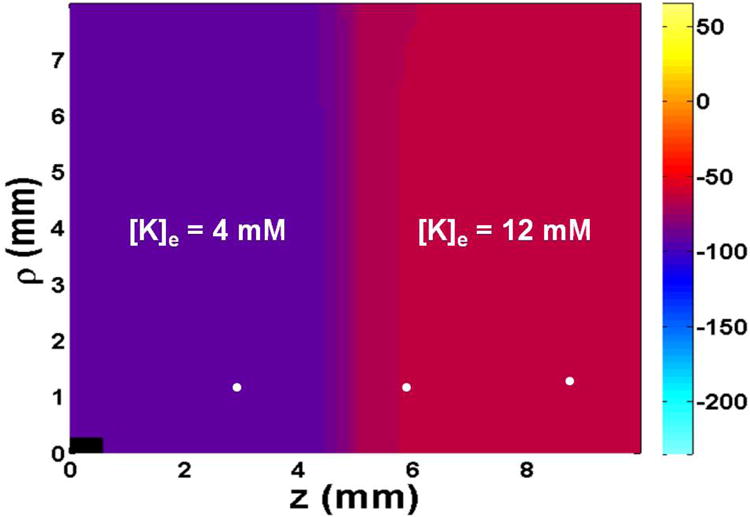
The spatial distribution of resting transmembrane potential. The tissue has [K]e=4 mM and a resting potential of -93 mV (normal) on the left, and [K]e=12 mM and resting potential -57 mV (ischemic) on the right. The white dots show the positions where transmembrane potential and different currents are calculated in Fig. 3. The black rectangle in the lower left represents the size and position of the stimulating electrode. Only one quadrant of the z-ρ plane is shown. The size of the tissue is 20 mm by 16 mm. Fibers are oriented parallel to the z axis.
The tissue is stimulated through a 1 mm long, 0.4 mm diameter cylindrical electrode, placed in the center of a 20 mm long and 16 mm diameter cylinder of cardiac tissue. Because of the symmetry, our calculations involve only a quarter of the tissue (z > 0 and ρ > 0). Our implementation of the bidomain model is the same as we described in our earlier study14. The time step is 5 or 10 μs depending upon the calculation, and the space steps along z and ρ axes are 0.1 and 0.04 mm, respectively. The number of grid points used in z and ρ directions are 101 and 201, respectively.
We apply stimuli at different pacing intervals, gradually decreasing from 210 to 150 ms. Each stimulus has a duration of 4 ms and its strength is adjusted to be three to four times the diastolic threshold of excitation.
Results
The resting potential is depolarized to about -57 mV in the ischemic area (on the right in Fig. 1) as a consequence of [K]e being set to 12 mM. Before applying the first stimulus we run the simulation for 100 ms to ensure the tissue is in steady state. The resting potential varies over a border zone several length constants (about 1 mm) thick.
The electrode in the lower left corner of the tissue is first stimulated with a cathodal stimulus of strength 0.25 mA at time 100 ms. This stimulus excites an action potential that propagates outward from the electrode. A second stimulus is applied at 310 ms and has a strength of 0.6 mA. The third stimulus (S3), the last before reentry begins, is applied at 460 ms with a strength of 0.6 mA. Figure 2 displays the evolution of reentry during and following the last stimulus. Each panel in the figure shows the spatial distribution of transmembrane potential representing the electrical state of the tissue at selected times, labeled in the upper right hand corner of each panel. (To observe this simulation in more detail, see the video included in the Supplementary information.) As soon as the third stimulus ends the wave front propagates along the z-axis in the normal region (cathode break excitation15), and is then blocked by refractory tissue in the border zone but continues to propagate rapidly perpendicular to the border zone (in the ρ direction). At 520 ms, a bulge appears in the border zone a distance behind the quickly propagating normal wave front, which triggers an action potential that propagates through the ischemic area. The lower end of this wave front forms a spiral wave that reenters the normal tissue around the stimulus electrode (600 ms), and makes one full rotation before being extinguished when the spiral wave tip collides with the upper boundary (680 ms).
Figure 2.
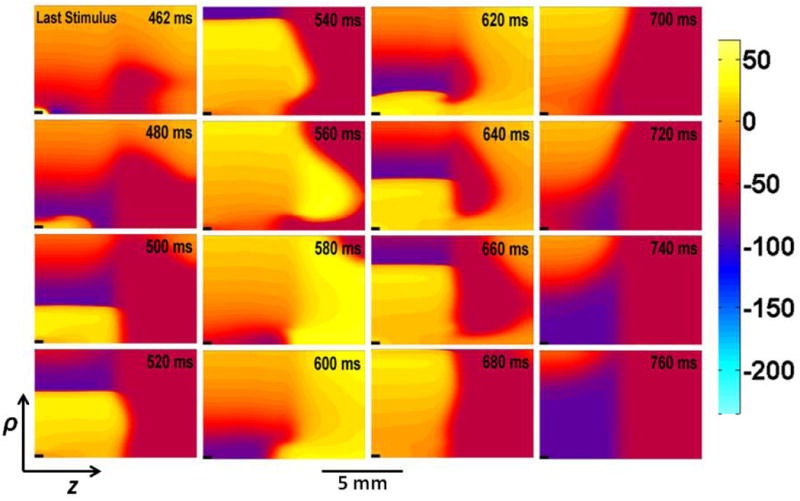
The evolution of reentry during and following three cathodal stimuli. The third stimulus (S3) is applied starting at 460 ms. The transmembrane potential is plotted versus ρ (vertical) and z (horizontal). The time (in ms) is labeled in the upper right corner of each frame.
Figure 3 illustrates the mechanism of reentry shown in Fig. 2. Figure 3a compares the transmembrane potential at different values of ρ at z = 6 mm. The delayed depolarization starts at z = 6 mm, ρ = 2 mm (the red curve in Fig. 3a). The rise time of this depolarization is extremely slow (40 ms) and is caused by electrotonic coupling to the excited normal tissue. This delay in the depolarization upstroke and propagation allows surrounding tissue to recover excitability, ultimately initiating a more rapid wave front (blue curve in Fig. 3a) that propagates in the retrograde direction. To find the cause of the delayed depolarization at z= 6 mm and ρ=1 mm, we measure the sodium current (INa; red curve), electrotonic current (Ielec; green curve), and calcium current (Ilca; purple curve) in the normal (3 mm, 1 mm), border zone (6 mm, 1 mm), and ischemic (9 mm, 1 mm) regions. These positions are denoted by the white dots in Fig. 1. On comparing these three curves it is clear that the electrotonic current is responsible for the generation of delayed depolarization; during the critical few milliseconds before the action potential begins (500-550 ms in Fig. 3c), the green electrotonic current is the only current causing depolarization; the sodium and calcium currents are zero.
Figure 3.
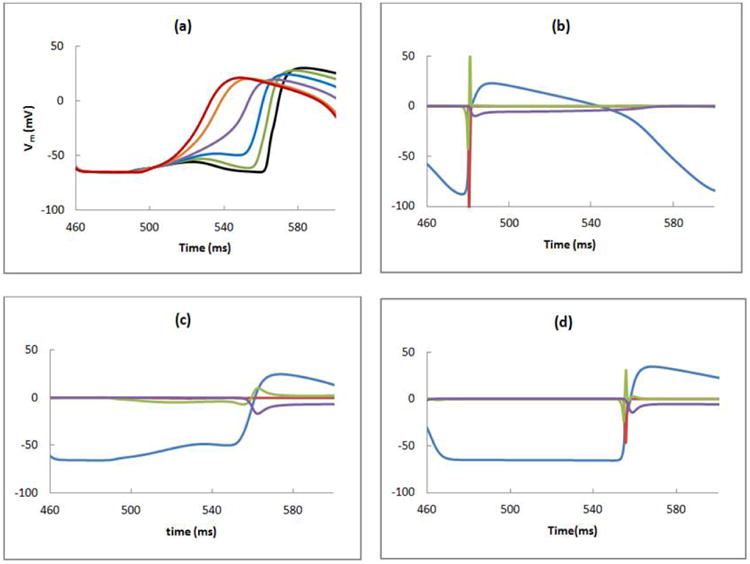
a) The transmembrane potential as a function of time calculated at ρ = 0.4 (black), 0.8 (green), 1 (blue), 1.2 (purple), 1.6 (orange), and 2 (red) mm and z = 6 mm. The transmembrane potential (Vm (mV), blue), and the sodium (INa (A/m2), red), electrotonic (Ielec (A/m2), green), and calcium (Ilca (A/m2), purple) currents are calculated in the b) normal (z = 3 mm), c) border zone (z = 6 mm), and d) ischemic (z = 9 mm) regions, at the locations shown by white dots in Fig. 1 (ρ = 1 mm).
The location where reentry begins depends on the tissue refractoriness, which is determined in part by the h-gate of the sodium channel13. Figure 4 shows a plot of the h-gate distribution at several times following the final stimulus. In refractory tissue h is nearly zero (cyan), but a region of excitable tissue exists in the ischemic area (dark blue) just as the reentry begins (t = 520 ms). This gradient of refractoriness in the high-potassium region is not obvious from the plots of transmembrane potential in Fig. 2. The variation in h at t = 520 ms is an example of post-repolarization refractoriness.
Figure 4.
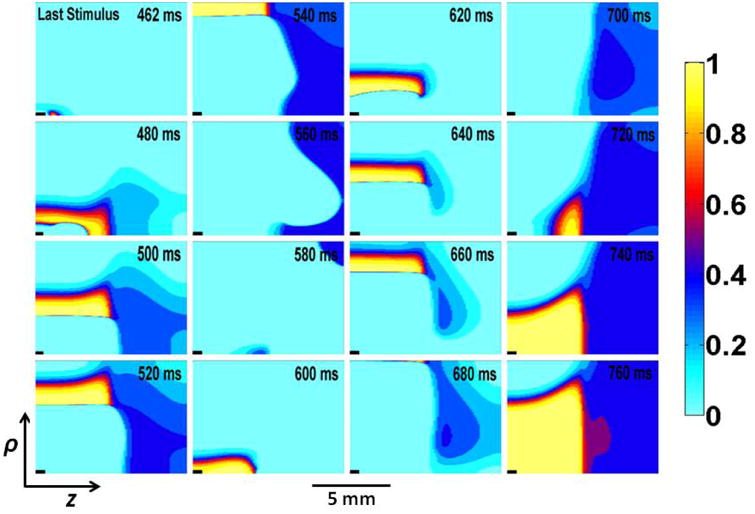
Plots showing the h-gate distribution during and following third (last) stimulus. h gate is plotted versus ρ and z in vertical and horizontal direction, respectively. The time (in ms) is labeled in the upper right corner of each frame.
Figure 5 shows the activation map following the last stimulus. The slow propagation in the rightward direction and the region of block located in the distal segment (denoted by the star) provides more time for tissue in the proximal region to recover excitability and to finally re-excite a wave front that propagates in the clockwise direction.
Figure 5.
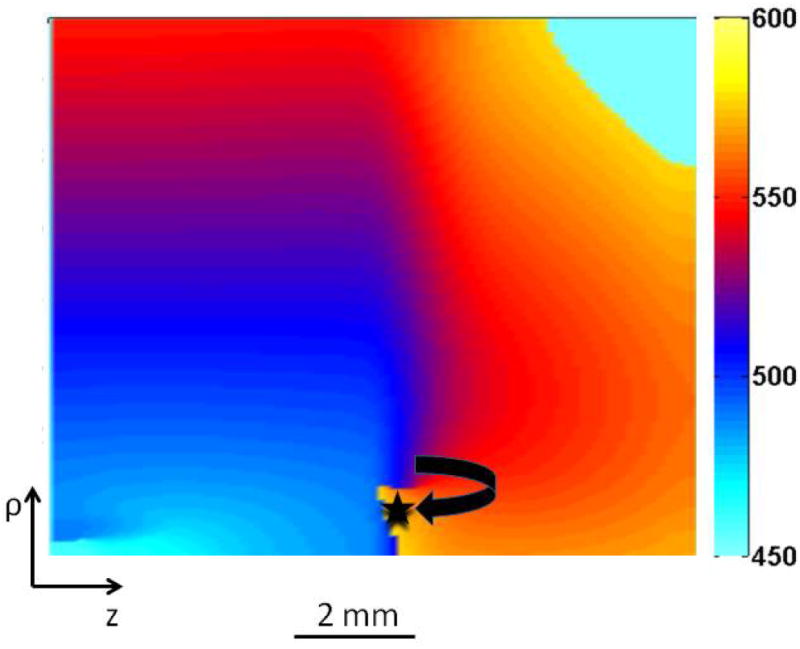
The activation map during reentry. The wave front that could not propagate initially from the small zone of the distal region (represented by black star) is re-excited in the clockwise direction. The color bar represents different times after the last stimulus.
Cabo and Barr11 simulated a one-dimensional fiber of length 4 mm attached to another fiber of the same length by a resistor of various magnitudes. For a particular resistor, they found the wave front first propagated in the forward direction and was then reflected. Similar to their calculation, we calculated the transmembrane potential at different positions close to the border at ρ=1 mm. This is the point where we found delayed depolarization at 1 mm away from the border in the ischemic region (Fig. 3a). In all simulations, we applied the same magnitude of last stimulus S3 (0.6 mA) at different pacing intervals.
If S3 is applied late (470 ms) the surrounding tissue is at rest (left column of Fig. 6), the wave front propagates rapidly, and enters directly into the ischemic region. The short PD delay (time taken to reach distal region from the proximal region) is not enough to allow the proximal segment to recover excitability. No reflection occurs.
Figure 6.
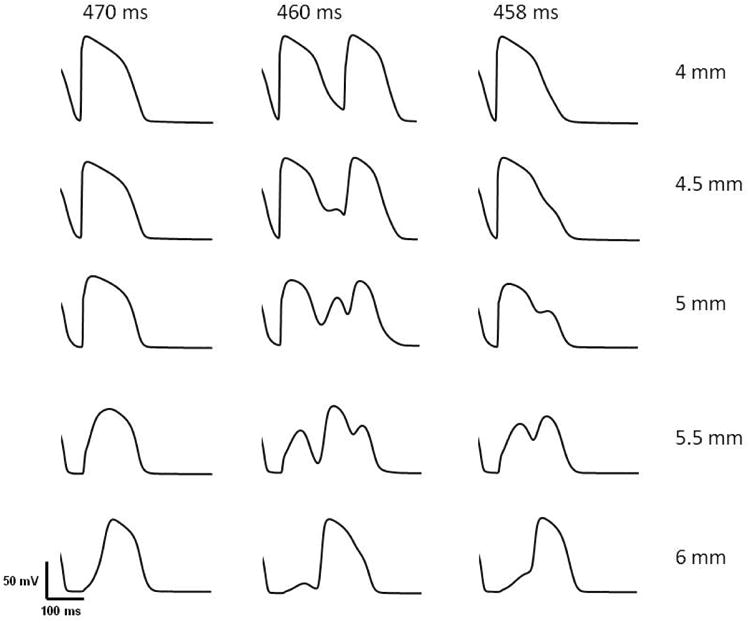
Results corresponding to Fig. 1 of Cabo & Barr11. This figure shows the transmembrane potential in a 3-D cardiac tissue at z = 4, 4.5, 5.0, 5.5, and 6.0 mm at ρ = 1 mm when the last stimulus of strength 0.6 mA was applied at 470 ms (left column), 460 ms (middle column), and 458 ms (right column).
If S3 is applied early (458 ms), the surrounding tissue is more refractory (right column of Fig. 6), and the wave front propagates slowly and decrementally as it enters the ischemic region. As in Fig. 2, a delayed depolarization occurs in the border zone that triggers an action potential in the ischemic region, resulting in a long PD delay that allows more time for tissue in the proximal region to recover excitability. The PD delay, however, is not long enough to cause reentry because the proximal tissue is still refractory. If S3 was even earlier (e.g., 450 ms) the wave front in normal tissue would not penetrate the border zone because it is refractory, and no action potential would excite in the ischemic region.
If S3 is applied at the intermediate time of 460 ms, we have the case shown in Fig. 2 (middle column of Fig. 6). A small region of the tissue at the border (represented by the black star in Fig. 5) is refractory and the initial wave front fails to penetrate the ischemic region. However, electrotonic current causes a slowly rising depolarization, which then generates a full blown action potential in the distal region that propagates to the left. After a delay, it depolarizes the proximal region and re-excites it. This behavior is mechanistically similar to the reflection observed by Cabo and Barr11.
To determine if this type of reentry occurs only for a small range of stimulus parameters, we reduced the stimulus duration from 4 to 1 ms and increased the stimulus strength, and found the same behavior (see the video in the supplementary material). The behavior appears to be sensitive to the timing of the stimulus, but not to its duration.
Discussion
Our observation of a reflection reentry is similar to that observed in calculations using a one-dimensional cable model. Cabo and Barr11 divided a fiber into proximal and distal segments connected by a resistor and applied a stimulus to the left end of proximal segment. For one particular resistance, a wave front that propagated in the forward direction was reflected. We see analogous results in our calculation, and our Fig. 6 is similar to Cabo and Barr's Fig. 1. Some significant differences between their simulation and ours are: 1) we consider a three dimensional volume of cardiac tissue rather than a simple one-dimensional fiber, 2) we create a transition between normal and ischemic regions by increasing the extracellular potassium ion concentration from 4 mM (normal) to 12 mM (ischemic) to obtain reflection, whereas they placed a high resistance between two normal segments of the fiber, and 3) we represent active properties of the cell membrane using the Luo-Rudy model13 rather than the DiFrancesco-Noble model16.
Auerbach et al.17 found that the structural heterogeneity created by connecting two wide regions by a narrow isthmus is a necessary condition for premature re-excitation and reflection. Tung18 called this behavior “expansion type reflection.” In expansion type reentry, the convex outward pattern of the wave front originating from the junction of the isthmus and the distal region helps in the formation of an early after depolarization (EAD), which provides delayed retrograde propagation along the same path. We see a convex outward pattern of wave front propagation (Fig. 2, 560 ms) similar to that observed by Auerbach et al.17. They obtained expansion type reentry when a wave front propagated through different structural heterogeneous regions in the absence of impaired conduction. In our case, we created two regions having different concentrations of [K]e and found that the initiation of reentrant activity in the heart requires a zone of slowly conducting tissue and a region of unidirectional block.
In contrast to the observation by Aubarach et al.17, an early afterdepolarization never occurs in the distal region of our simulation, so it never acts as the source of the reflection. In our case, the delayed depolarization in the distal region provides enough time to generate an action potential in the proximal region, and hence acts as the source of reflection. Himel et al.19 suggested that electrotonic interaction between myocytes in the neonatal rat ventricular monolayer suppressed EAD formation. They also conducted two-cell simulations and confirmed the suppression of EAD.
The incidence of reflection depends upon the pacing interval and occurs only in a narrow window of intervals. This may explain why this type of reentry has not been observed previously.
We investigated the mechanism of reentry in Fig. 3 and found that the electrotonic current is responsible for the generation of reentry. Janse et al. 20 studied the patterns of excitation during early ventricular arrhythmias in acute regional myocardial ischemia. They found that the flow of injury current (electrotonic current in our context) between normal and ischemic myocardial tissue induced ectopic activity. Our result is consistent with their experimental findings.
In the bidomain model, the different electrical anisotropy in the intracellular and extracellular spaces (unequal anisotropy ratios, Table 1) influences how tissue responds to electrical stimulation. In this calculation, unequal anisotropy ratios does not play a direct role in the initiation of the reentrant wave front. However, to obtain this type of reentry the tissue must be driven at such a fast rate that break excitation15 is required. Break excitation from a unipolar electrode results from unequal anisotropy ratios. Therefore, unequal anisotropy ratios does have an indirect role in producing this type of reentry.
We refer to the type of reentry shown in Fig. 2 as a reflection. When reentry occurs in two or three dimensions, distinguishing a reflection from spiral wave reentry can be difficult. In our case, the wave front does not begin as a spiral wave, but quickly becomes one. Our results in Fig. 6 bear a striking resemblance to Cabo and Barr's Fig. 1. However, our Fig. 2 indicates that the wave front propagating in the retrograde direction in our case is eventually part of a spiral wave (600 ms) that rotates clockwise at a slightly smaller value of radial distance ρ than did the antegrade propagation (560 ms). One of the surprising features of Fig. 2 is that the bulge and subsequent action potential in the ischemic region (540 ms) does not appear to be caused by reentry; the initial wave front in the normal region does not form a spiral wave that rotates into the ischemic tissue. Rather, the wave front in the normal region propagates quickly, and then in its wake a delayed depolarization caused by electrotonic current initiates an action potential in the ischemic region. This excitation after a delay, resulting in sufficient time for the proximal region to become reexcitable and leading to reentry, is the primary reason why we call this excitation a reflection rather than merely an example of spiral wave reentry.
Our model has several limitations. We consider an abrupt transition between the two extracellular potassium ion concentrations in the normal and ischemic regions. During myocardial ischemia, there is a gradual transition from normal to ischemic regions. Myocardial ischemia is often due to occlusion of a coronary artery resulting in insufficient blood supply to the heart cells. As a result these cells could not meet the metabolic demands of the tissue. Hence, to represent the ischemic tissue more accurately, we should consider metabolic and electrophysiologic changes in addition to extracellular potassium accumulation. This includes changes in ATP concentration, a decline in oxygen level, and a decrease in pH values. For a complete model, the ATP-activated K+ current (IK,ATP), transient outward current (Ito), acidosis and hypoxic current should be incorporated into the model21,22,23.
Conclusion
We create a sharp transition between normal and ischemic regions by increasing the extracellular potassium ion concentration from 4 mM (normal) to 12 mM (ischemic) to obtain reflection. Our simulations show that the sub-threshold depolarization originated from the normal side of the ischemic border and creates the delay between proximal and distal region, producing enough electrotonic current in the distal region to re-excite the proximal region. Hence, electrotonic current is responsible for the generation of reentry. An EAD is never formed at the distal region of our simulation and it never acts as the source of the reflection.
Supplementary Material
Acknowledgments
This research was supported by NIH grant R01HL118392.
References
- 1.Gray RA. Theory of rotors and arrhythmias Chapter 34. In: Zipes DP, Jalife J, editors. Cardiac Electrophysiology: From Cell to Bedside. 6th. Saunders; pp. 341–350. [Google Scholar]
- 2.Wit AL, Hoffman BF, Cranefield PF. Slow conduction and reentry in the ventricular conducting system. I Return extrasystole in canine Purkinje fibers. Circ Res. 1972;30:1–10. doi: 10.1161/01.res.30.1.1. [DOI] [PubMed] [Google Scholar]
- 3.Rosenthal JE. Reflected reentry in depolarized foci with variable conduction impairment in 1 day old infarcted canine cardiac tissue. J Am Coll Cardiol. 1988;12:404–411. doi: 10.1016/0735-1097(88)90413-5. [DOI] [PubMed] [Google Scholar]
- 4.van Hemel NM, Swenne CA, de Bakker JMT, Defauw JJAM, Guiraudon GM. Epicardial reflection as a cause of incessant ventricular bigeminy. PACE. 1988;11:1036–1044. doi: 10.1111/j.1540-8159.1988.tb03949.x. [DOI] [PubMed] [Google Scholar]
- 5.Antzelevitch C, Jalife J, Moe GK. Characteristics of reflection as a mechanism of reentrant arrhythmias and its relationship to parasystole. Circulation. 1980;61:182–191. doi: 10.1161/01.cir.61.1.182. [DOI] [PubMed] [Google Scholar]
- 6.Antzelevitch C, Moe GK. Electrotonically mediated delayed conduction and reentry in relation to slow responses in mammalian ventricular conducting tissue. Circ Res. 1981;49:1129–1139. doi: 10.1161/01.res.49.5.1129. [DOI] [PubMed] [Google Scholar]
- 7.Jalife J, Moe GK. Excitation, conduction, and reflection of impulses in isolated bovine and canine Purkinje fibers. Circ Res. 1981;49:233–247. doi: 10.1161/01.res.49.1.233. [DOI] [PubMed] [Google Scholar]
- 8.Antzelevitch C, Bernstein MJ, Feldman HN, Moe GK. Parasystole, reentry, and tachycardia: A canine preparation of cardiac arrhythmias occurring across inexcitable segments of tissue. Circulation. 1983;68:1101–1115. doi: 10.1161/01.cir.68.5.1101. [DOI] [PubMed] [Google Scholar]
- 9.Rozanski GJ, Jalife J, Moe GK. Reflected reentry in nonhomogeneous ventricular muscle as a mechanism of cardiac arrhythmias. Circulation. 1984;69:163–173. doi: 10.1161/01.cir.69.1.163. [DOI] [PubMed] [Google Scholar]
- 10.Lukas A, Antzelevitch C. Reflected reentry, delayed conduction, and electrotonic inhibition in segmentally depressed atrial tissue. Can J Physiol Pharmacol. 1989;67:757–764. doi: 10.1139/y89-121. [DOI] [PubMed] [Google Scholar]
- 11.Cabo C, Barr RC. Propagation model using the DiFrancesco-Noble equations. Comparison to reported experimental results. Med Biol Eng Comput. 1992;30:292–302. doi: 10.1007/BF02446967. [DOI] [PubMed] [Google Scholar]
- 12.Henriquez CS. Simulating the electrical behavior of cardiac tissue using the bidomain model. Critical Reviews of Biomedical Engineering. 1993;21:1–77. [PubMed] [Google Scholar]
- 13.Luo CH, Rudy Y. A dynamic model of the cardiac ventricular action potential. I Simulations of ionic currents and concentration changes. Circ Res. 1994;74:1071–96. doi: 10.1161/01.res.74.6.1071. [DOI] [PubMed] [Google Scholar]
- 14.Kandel SM, Roth BJ. Intracellular calcium and the mechanism of the dip in the anodal strength-interval curve in cardiac tissue. Circ J. 2014;78:1127–35. doi: 10.1253/circj.cj-13-1261. [DOI] [PMC free article] [PubMed] [Google Scholar]
- 15.Roth BJ. A mathematical model of make and break electrical stimulation of cardiac tissue by a unipolar anode or cathode. IEEE Trans Biomed Eng. 1995;42:1174–1184. doi: 10.1109/10.476124. [DOI] [PubMed] [Google Scholar]
- 16.DiFrancesco D, Noble D. A model of cardiac electrical activity incorporating ionic pumps and concentration changes. Philos Trans R Soc [Biol] 1985;307:353–398. doi: 10.1098/rstb.1985.0001. [DOI] [PubMed] [Google Scholar]
- 17.Auerbach DS, Grzeda KR, Furspan PB, Sato PY, Mironov S, Jalife J. Structural heterogeneity promotes triggered activity, reflection and arrhythmogenesis in cardiomyocyte monolayers. J Physiol. 2011;589:2363–2381. doi: 10.1113/jphysiol.2010.200576. [DOI] [PMC free article] [PubMed] [Google Scholar]
- 18.Tung L. Expanding on forty years of reflection. J Physiol. 2011;589.9:2107–2108. doi: 10.1113/jphysiol.2011.209239. [DOI] [PMC free article] [PubMed] [Google Scholar]
- 19.Himel HD, Garny A, Noble PJ, Wodgaonkar R, Savarese J, et al. Electrotonic suppression of early afterdepolarizations in the neonatal rat ventricular myocyte monolayer. J Physiol. 2013;591.21:5357–5364. doi: 10.1113/jphysiol.2013.262923. [DOI] [PMC free article] [PubMed] [Google Scholar]
- 20.Janse MJ, van Capelle FJ, Morsink H, Kleber AG, Wilms-Schopman F, et al. Flow of “injury” current and patterns of excitation during early ventricular arrhythmias in acute regional myocardial ischemia in isolated porcine and canine hearts. Evidence for two different arrhythmogenic mechanisms. Circ Res. 1980;47:151–165. doi: 10.1161/01.res.47.2.151. [DOI] [PubMed] [Google Scholar]
- 21.Shaw RM, Rudy Y. Electrophysiologic effects of acute myocardial ischemia: a theoretical study of altered cell excitability and action potential duration. Cardiovasc Res. 1997;35:256–272. doi: 10.1016/s0008-6363(97)00093-x. [DOI] [PubMed] [Google Scholar]
- 22.Rodriguez B, Ferrero JM, Jr, Trenor B. Mechanistic investigation of extracellular K+ accumulation during acute myocardial ischemia: a simulation study. Am J Physiol Heart Circ Physiol. 2002;283:H490–500. doi: 10.1152/ajpheart.00625.2001. [DOI] [PubMed] [Google Scholar]
- 23.Terkildsen JR, Crampin EJ, Smith NP. The balance between inactivation and activation of the Na+-K+ pump underlies the triphasic accumulation of extracellular K+ during myocardial ischemia. Am J of Physiol - Heart and Circ Physiol. 2007;293(5):H3036–H3045. doi: 10.1152/ajpheart.00771.2007. [DOI] [PubMed] [Google Scholar]
Associated Data
This section collects any data citations, data availability statements, or supplementary materials included in this article.