

Abstract
Mice carrying a targeted disruption of the prostaglandin E2 (PGE2) E-prostanoid receptor 3 (EP3) gene, Ptger3, were fed a high-fat diet (HFD), or a micronutrient matched control diet, to investigate the effects of disrupted PGE2-EP3 signaling on diabetes in a setting of diet-induced obesity. Although no differences in body weight were seen in mice fed the control diet, when fed a HFD, EP3−/− mice gained more weight relative to EP3+/+ mice. Overall, EP3−/− mice had increased epididymal fat mass and adipocyte size; paradoxically, a relative decrease in both epididymal fat pad mass and adipocyte size was observed in the heaviest EP3−/− mice. The EP3−/− mice had increased macrophage infiltration, TNF-α, monocyte chemoattractant protein-1, IL-6 expression, and necrosis in their epididymal fat pads as compared with EP3+/+ animals. Adipocytes isolated from EP3+/+ or EP3−/− mice were assayed for the effect of PGE2-evoked inhibition of lipolysis. Adipocytes isolated from EP3−/− mice lacked PGE2-evoked inhibition of isoproterenol stimulated lipolysis compared with EP3+/+. EP3−/− mice fed HFD had exaggerated ectopic lipid accumulation in skeletal muscle and liver, with evidence of hepatic steatosis. Both blood glucose and plasma insulin levels were similar between genotypes on a control diet, but when fed HFD, EP3−/− mice became hyperglycemic and hyperinsulinemic when compared with EP3+/+ fed HFD, demonstrating a more severe insulin resistance phenotype in EP3−/−. These results demonstrate that when fed a HFD, EP3−/− mice have abnormal lipid distribution, developing excessive ectopic lipid accumulation and associated insulin resistance.
Obesity and ectopic lipid accumulation are associated with insulin resistance and contribute to the pathology of a number of diseases, notably type 2 diabetes. Obesity has been recognized as a disease of low-grade chronic inflammation, and circulating inflammatory cytokines increase in obesity and type 2 diabetes (reviewed in Refs. 1, 2). Antidiabetic drugs such as thiazolidinediones reduce systemic inflammation and improve insulin resistance (3), whereas inflammatory cytokines such as IL-1β have deleterious effects on pancreatic islet β-cell function and proliferation (4, 5). It is now appreciated that inflammatory mediators negatively affect both insulin secretion as well as insulin action.
Prostaglandins (PGs) are important mediators of inflammation (6–9). These oxidative metabolites of arachidonic acid, are produced by cyclooxygenases (COXs) (COX-1 and COX-2), and act locally in an autocrine or paracrine manner (reviewed in Ref. 10). PGE2 is a major COX metabolite, which mediates its effects by activation of 4 G protein-coupled receptors, designated E-prostanoid (EP)1 through EP4 (10). Analysis of G protein-coupled receptor expression across a panel of mouse tissues revealed that the EP receptor 3 (EP3) receptor was most highly expressed in the pancreas, kidney, and white adipose tissue, an expression pattern consistent with regulation of metabolic homeostasis (11).
PGs and other inflammatory mediators play an important role in adipose tissue physiology (12–14). EP3 has the highest expression of the 4 EP receptors in mouse epididymal fat pads (15). Pharmacological studies suggest that PGE2 inhibits lipolysis and reduces intracellular cAMP in adipocytes via the EP3 receptor (16, 17). cAMP-protein kinase A signaling is a central regulator of lipolysis, being important for activating both hormone-sensitive lipase and adipose triglyceride lipase (18–21). Loss of PG production in adipose tissue by deletion of adipocyte phospholipase (AdPLA) increases lipolysis causing lipids to be stored in ectopic tissues (17). These AdPLA−/− mice are resistant to obesity but are insulin resistant due to the ectopic triglyceride storage (17). Taken together, these data suggest that the EP3 receptor plays a role in facilitating adipose tissue lipid accumulation by inhibiting lipolysis. Thus, a loss of EP3 signaling may limit adipose tissue lipid deposition and facilitate ectopic lipid distribution, which could exacerbate diet-induced insulin resistance.
Contrary to what would be expected in a model of increased adipocyte lipolysis, mice with a global gene disruption of the EP3 receptor have increased body weight and fat pad mass when fed breeder chow (22). This report contrasts with a previous report that EP3−/− mice have normal growth rates (23). We hypothesize that the caloric content of the different diets used to maintain the mice in each of these studies might account for this variation in phenotype. To more completely characterize the interaction of the EP3 receptor with diet and its role in metabolism, EP3−/− mice were challenged with a high-fat diet (HFD). We show that EP3−/− mice have no difference in body weight on a control or chow diet. However, when fed a HFD, EP3−/− mice gained more weight than did EP3+/+ fed the same diet, similar to what was previously found when the EP3−/− mice were fed breeder chow (22). As with EP3−/− mice fed breeder chow, we noted insulin resistance and elevated blood glucose in EP3−/− mice fed HFD. We found that the insulin resistance in EP3−/− mice fed a HFD is accompanied by lipid redistribution from the adipose tissue to ectopic, insulin sensitive tissues such as liver and skeletal muscle. Fat pads in EP3−/− HFD-fed mice were relatively smaller, had increased necrosis, increased inflammatory cytokine expression, and failed to suppress lipolysis in response to PGE2. Although EP3−/− mice were not hyperphagic, they were less active, became obese, had increased ectopic lipid accumulation, and were insulin resistant.
Materials and Methods
Animal procedures
Mice used for these experiments were generated from homozygous breeding of EP3+/+ or EP3−/− mice on a C57BL/6 background. The strategy for the generation of these EP3−/− mice is outlined in Supplemental Figure 1. Mice were maintained ad libitum on chow, Laboratory Rodent Diet 5001 (LabDiet), unless otherwise stated. Male mice were used for all studies. Summaries of the age at diet introduction and termination as well as the measured endpoints for each group of mice are listed in Supplemental Table 1. Mice were maintained on a 12-hour light, 12-hour dark cycle and housed with 3–5 animals per cage on corncob bedding except during fasting when placed on Pure-o'Cel bedding (The Andersons). All procedures were approved by the Institutional Animal Care and Use Committee at Vanderbilt University.
HFD feeding
Beginning at age 4–5 weeks, male EP3+/+ or EP3−/− mice were fed a control diet (10% calories from fat and 4.3% fat by weight, D12450Bi; Research Diets) or HFD (45% calories from fat and 24% fat by weight, D12451i; Research Diets) for about 16 weeks. Throughout the course of the study, body composition of live mice was measured by pulsed NMR with Minispec Model mq7.5 (Bruker Instruments). Mice were euthanized by isoflurane overdose at the end of the study, approximately 20 weeks of age, for collection of tissues.
Intraperitoneal glucose tolerance tests (IP-GTTs)
At 20 weeks of age, 9 EP3+/+ control-, 10 EP3−/− control-, 7 EP3+/+ HFD-, and 9 EP3−/− HFD-fed C57BL/6 male mice were fasted overnight for 16 hours, and fasting blood glucose was measured from a drop of tail vein blood with an Accu-Check Aviva glucometer and glucose test strips (Roche Diagnostics). Fasting insulin was measured from plasma collected by saphenous vein blood draw. Animals received an ip injection of filter-sterilized glucose in PBS (2-mg dextrose/g body weight) and blood glucose was measured at 15, 30, 60, 90, and 120 minutes, whereas plasma for insulin analysis was collected at 15 and 30 minutes after injection. Statistical analyses for differences in glucose handling were performed on the difference from baseline of the area under the curve. Insulin content was analyzed in duplicate by RIA by Vanderbilt University Hormone Assay and Analytical Services Core.
Histology
At the end of the control and HFD feeding study, 20 weeks of age, livers from 3 individual mice per group and epididymal fat pads from 9 EP3+/+ control-, 10 EP3−/− control-, 7 EP3+/+ HFD-, and 9 EP3−/− HFD-fed mice were fixed in 10% formaldehyde overnight and subsequently stored in 70% ethanol then processed routinely, embedded, and sectioned at 4 μm and stained with hematoxylin and eosin (H&E). Liver samples from 3 individual mice per group were fixed by freezing in Tissue-Tek OCT medium for Oil Red O (ORO) staining. All slides were imaged at ×20 with a Leica SCN400 Slide Scanner by the Vanderbilt Digital Histology Shared Resource. Adipocyte cell sizes were measured from 10 images per mouse with ImageJ using Adipocytes Tools (24). Epididymal fat pads were examined by an experienced veterinary pathologist (K.L.B.). Fat pad necrosis and inflammation (steatitis) were scored on a scale of 0–4, with 0 being no steatitis or necrosis, 1 being minimal steatitis and necrosis not present, 2 being mild steatitis with necrosis of individual adipocytes, 3 being moderate steatitis with extensive areas of adipocyte necrosis, and 4 being severe steatitis with diffuse necrosis of the fat pad.
Plasma chemistry
At the end of the control and HFD feeding study, 20 weeks of age, plasma was collected from blood obtained by terminal cardiac puncture postmortally from 3 to 4 ad libitum-fed mice per group. Leptin and adiponectin were measured with a Luminex 100 system (Luminex Corp) by the Vanderbilt University Hormone Assay and Analytical Services Core.
Tissue fatty acid composition
Lipids were extracted from approximately 100-mg flash-frozen liver or combined gastrocnemius and soleus skeletal muscle tissue from 9 EP3+/+ control-, 10 EP3−/− control-, 7 EP3+/+ HFD-, and 9 EP3−/− HFD-fed male mice as described (25). The extracts were filtered and lipids recovered in the chloroform phase. Individual lipid classes were separated by thin layer chromatography using Silica Gel 60 A plates developed in petroleum ether, ethyl ether, acetic acid (80:20:1) and visualized by rhodamine 6G. Phospholipids, diglycerides, triglycerides, and cholesteryl esters were scraped from the plates and methylated using BF3/methanol (26). The methylated fatty acids were extracted and analyzed by gas chromatography. Gas chromatographic analyses were carried out on an Agilent 7890A gas chromatograph equipped with flame ionization detectors, a capillary column (SP2380; Supelco). Helium was used as a carrier gas. Fatty acid methyl esters were identified by comparing the retention times with those of known standards. Triglycerides were quantified by the Mouse Metabolic Phenotyping Center Lipid Lab.
Quantitative real-time RT-PCR (qPCR)
Total RNA was isolated from approximately 50–100 mg of frozen liver or 100–250 mg of frozen epididymal fat pad using TRIzol Reagent (Invitrogen) from 8 EP3+/+ control-, 10 EP3−/− control-, 7 EP3+/+ HFD-, and 9 EP3−/− HFD-fed male mice. RNA was purified with RNeasy Mini kit (QIAGEN). One microgram of RNA per mouse was reverse transcribed using High Capacity cDNA Reverse Transcription kit (Applied Biosystems). qPCR was performed using TaqMan Gene Expression Assays (Applied Biosystems) for Adipoq(Mm00456425_m1), Ccl2 (Mm00441242_m1), carnitine palmitoyltransferase 1A (liver) (Cpt1a) (Mm01231183_m1), epidermal growth factor-like module-containing mucin-like hormone receptor-like 1 (Emr1) (Mm00802529_m1), fatty acid synthase (Fasn) (Mm00662319_m1), Il6 (Mm00446190_m1), Lep (Mm00434759_m1), microsomal triglyceride transfer protein (Mttp) (Mm00435015_m1), platelet endothelial cell adhesion molecule-1 (Pecam1) (Mm01242584_m1), Ptger3 (Mm01316856_m1), Ptgs2 (Mm00478374_m1), Rn18s (Mm03928990_g1), Tnf (Mm00443258_m1), and Vegfa (Mm01281449_m1). All assays were run on a 7900HT Fast Real-Time PCR System (Applied Biosystems) at the Vanderbilt Technologies for Advanced Genomics. Gene expression data were collected from 3 replicates of each sample and 4 replicates of each standard curve point. Replicate samples were averaged and analyzed using the Pfaffl method (27). Gene expression was normalized to 18S RNA (Rn18s) and the individual with the lowest relative gene expression was considered to have a fold change of 1.0. Levels of 18S RNA were similar between all groups.
Mouse adipocyte lipolysis assay
Adipocytes were isolated from epididymal fat pads of a separate cohort of 10-week-old male EP3+/+ and EP3−/− mice that were maintained on a standard chow diet. Three to 4 mice per genotype were used. Lipolysis was assessed as described (28). Each assay was performed in duplicate for each mouse. Briefly, fat pads were placed in adipocyte incubation solution (Krebs-Ringer bicarbonate buffer with 30mM HEPES and 3% [wt/vol] fatty acid free bovine albumin fraction V; MP Biomedical). Minced fat pads were collagenase digested in adipocyte incubation solution for 1 hour at 37°C while shaking, filtered through 250-μm Tissue Strainers (Thermo Scientific), and washed 3 times. Lipolysis assays were performed on 6000–9000 adipocytes. Lipolysis was stimulated with 1nM isoproterenol (ISO) (I6504; Sigma), in the presence or absence PGE2 (Cayman Chemical). Inhibition of lipolysis with 1nM human recombinant insulin (I9288; Sigma) was used as a positive control. Lipolysis was assessed 60 minutes after the addition of ISO. Glycerol released during lipolysis was measured with a Glycerol Assay kit (MAK117-1KT; Sigma).
Energy balance
For energy balance studies 2 age-matched cohorts were used, 8 weeks of age (EP3+/+ n = 6 and EP3−/− n = 5) and 17 weeks of age (n = 3 for each group). Mice were fed HFD for 11 weeks. Energy balance studies were performed in a Promethion system (Sable Systems International) for 5 days by the Vanderbilt Mouse Metabolic Phenotyping Center at the end of the 11-week HFD period.
Mouse islet perifusion
Pancreatic islets were isolated from male C57BL/6 mice and perifusion assays were performed on fresh islets at the Vanderbilt Islet Procurement and Analysis Core as previously described (29). Islets were isolated from 4 EP3+/+ and 4 EP3−/− 8-week-old mice that had been fed a standard chow diet (Laboratory Rodent Diet 5001) since birth or 4 EP3+/+ and 4 EP3−/− 29- to 39-week-old mice that had been fed HFD for 21 weeks. Islet preparations were equilibrated and stable baseline response established at 5.6 mmol/L glucose, and insulin secretion was stimulated with 16.7 mmol/L glucose.
Statistical analysis and calculations
Data are mean ± SEM, using GraphPad Prism version 6.0e for Mac OS X (GraphPad Software) except ANCOVA analyses of energy balance studies that were performed using the National Mouse Metabolic Phenotyping Center Energy Expenditure Analysis Page (www.mmpc.org/shared/regression.aspx). Analyses were performed with a two-way ANOVA comparing EP3 genotype and dietary treatment unless otherwise stated. Multiple comparison tests were performed with the Bonferroni correction for EP3 genotype only and are indicated on figures by asterisks corresponding to *, P < .05; **, P < .01; ***, P < .001. For analyses of plasma insulin, fat mass, and muscle mass over time, two-way ANOVA with repeated measures was performed comparing the factors EP3 genotype and time, keeping the dietary treatment consistent. Homeostatic model assessment of insulin resistance (HOMA-IR) was calculated as the fasting insulin level (μU/mL) × blood glucose level (mg/dL)/405. For all studies, P < .05 was considered statistically significant.
Results
EP3−/− mice are obese when fed a HFD
We generated EP3−/− mice to study the role of this receptor in whole-animal physiology (Supplemental Figure 1). EP3+/+ or EP3−/− male mice were fed either HFD (45% calories from fat) or a micronutrient matched control diet (10% calories from fat). Body weight increased in each of the 4 groups over the course of the study (Figure 1A). Body weight in both EP3+/+ and EP3−/− HFD-fed mice increased at a greater rate than in animals fed control diet, with a divergence in body weight becoming apparent after 8 weeks of age. Moreover, by 14 weeks of age the EP3−/− mice fed HFD were heavier than HFD-fed EP3+/+ animals. EP3−/− mice continued to gain weight throughout the remainder of the study leading to a greater difference in body weight at 20 weeks of age (P < .0001). Similar to defined control diet-fed animals, EP3+/+ and EP3−/− mice fed normal chow diet (13.5% calories from fat) showed no effect of genotype on body weight throughout the study to 38 weeks of age (Supplemental Figure 2A).
Figure 1.

EP3−/− mice are obese and have decreased movement when fed a HFD. A, Male EP3+/+ and EP3−/− mice fed control diet or HFD were weighed between 4 and 20 weeks of age. No difference in body weight was observed between genotypes in the control diet-fed animals. EP3−/− mice fed HFD were significantly heavier than EP3+/+ animals beginning around 14 weeks of age (P = .0041) and continuing until the end of the experiment at 20 weeks of age (P < .0001), n = 9 EP3+/+ control, n = 10 EP3−/− control, n = 7 EP3+/+ HFD, and n = 9 EP3−/− HFD. B, Total food intake was measured in male mice that had been fed HFD for 10.5 weeks. Mice consumed more food during the dark cycle (P < .0001), but no significant differences between EP3 genotypes were observed. C, Total movement measured in EP3−/− mice was found to be significantly less than EP3+/+ mice during the dark cycle (P = .0048). D, EP3−/− mice spend a greater proportion of their time inactive (P = .0005). For B–D, n = 9 EP3+/+ HFD and n = 7 EP3−/− HFD. All values are expressed as mean ± SEM.
Energy balance studies of 18- to 28-week-old HFD-fed mice showed that EP3−/− mice did not have a significant difference in food consumption during either the light (P = .57) or dark cycles (P > .99) (Figure 1B). EP3−/− mice did have a significant decrease in movement during the dark cycle of the day, which was reflected as more time spent being inactive (Figure 1, C and D). Average energy expenditure, oxygen consumption, and respiratory quotient were not significantly affected by EP3 genotype (Supplemental Table 2).
EP3−/− mice are insulin resistant when fed a HFD
At 20 weeks of age, EP3+/+ or EP3−/− mice had no differences in basal glucose, insulin levels, or insulin resistance when fed a control diet (Figure 2). Consistent with these findings, EP3+/+ and EP3−/− mice fed chow had no difference in glucose tolerance at 20 weeks of age (Supplemental Figure 2B). When fed a HFD, EP3−/− mice were hyperglycemic and hyperinsulinemic; EP3−/− mice had higher fasting insulin levels and unlike EP3+/+ mice, plasma insulin levels increased in proportion with body weight (Figure 2, A and B). Calculation of the HOMA-IR indicated that when fed a HFD, EP3−/− mice are more insulin resistant than EP3+/+ mice (Figure 2C). Insulin tolerance tests on these mice are consistent with the assessment of reduced insulin sensitivity (Supplemental Figure 3).
Figure 2.
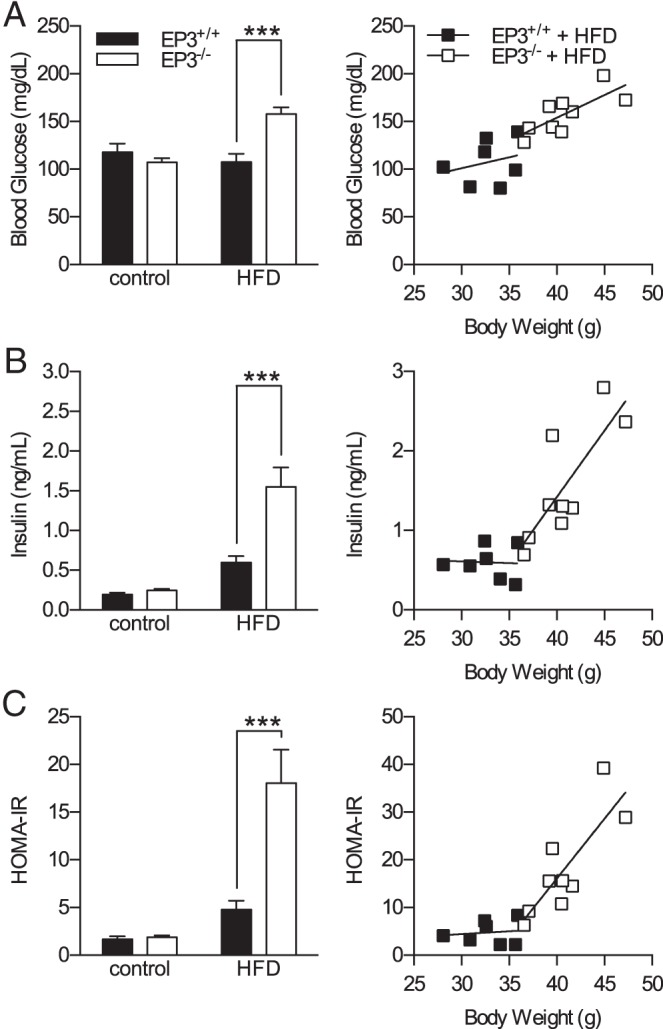
EP3−/− mice are hyperglycemic, hyperinsulinemic, and insulin resistant when fed a HFD. The effects of HFD and EP3 genotype on insulin resistance were assessed in 20-week-old mice. A, HFD feeding increased fasting blood glucose in EP3−/− mice but not EP3+/+ mice (P = .0002). The slope of body weight vs blood glucose was not different between genotypes of mice fed HFD (P = .497). B, HFD feeding increased fasting plasma insulin in EP3−/− mice (P = .0016). The slope of body weight vs plasma insulin was significantly different between genotypes fed HFD (P = .0296). C, HFD feeding significantly increased the HOMA-IR in EP3−/− mice (P = .0014). The slope of HOMA-IR to body weight was steeper in EP3−/− mice than EP3+/+ (P = .0464). For all figures, n = 9 EP3+/+ control, n = 10 EP3−/− control, n = 7 EP3+/+ HFD, and n = 9 EP3−/− HFD. Values are expressed as mean ± SEM.
EP3−/− mice are not glucose intolerant
An IP-GTT was used to assess glucose handling and in vivo insulin secretion in 20-week-old EP3+/+ and EP3−/− mice fed a control or HFD (Figure 3, A and B). HFD impaired glucose handling. Despite the reduction in insulin sensitivity, glucose tolerance was not altered by EP3 genotype. All groups of mice exhibited glucose-stimulated insulin secretion (GSIS) in response to glucose challenge during the IP-GTT (Figure 3C). When fed HFD, EP3−/− mice had elevated insulin levels compared with EP3+/+. In contrast, when fed a control diet, plasma insulin levels were unaffected by genotype. For mice fed HFD, the average peak insulin levels were found at 15 minutes after glucose injection and were significantly higher for the EP3−/− (0.96 ± 0.29 ng/mL, EP3+/+ vs 2.61 ± 0.34 ng/mL, EP3−/−). The change of plasma insulin levels from baseline was not significantly different between any groups. Although β-cell mass was not increased at this time point, β-cell proliferation was increased in EP3−/− mice fed HFD (Supplemental Figure 4).
Figure 3.

EP3−/− HFD-fed mice secrete insulin in response to glucose challenge. A, Glucose tolerance was assessed by an IP-GTT in male EP3+/+ and EP3−/− mice, fed either HFD or control diet at 20 weeks of age. B, Area under the curve (AUC) of IP-GTT data shown in A. HFD feeding worsened glucose homeostasis (P = .0112), but the effect of EP3 genotype was not significant (P = .0778). C, Insulin secretion during the IP-GTT revealed that EP3−/− HFD-fed mice have elevated plasma insulin (P = .0002) and demonstrate GSIS. The EP3 genotype had no detectable effect on plasma insulin levels in mice fed control diets (P = .9912). Data from A and C at time 0 are the same data that are shown in Figure 2, A and B, respectively. For all figures, n = 9 EP3+/+ control, n = 10 EP3−/− control, n = 7 EP3+/+ HFD, and n = 9 EP3−/− HFD. Values are expressed as mean ± SEM.
Pancreatic islets isolated from EP3+/+ and EP3−/− mice fed either chow or HFD were assessed for alterations in GSIS by islet perifusion. EP3 genotype did not affect GSIS in islets isolated from either 8-week-old chow-fed or 30- to 40-week-old HFD-fed mice (Figure 4). Furthermore, neither first nor second phase insulin secretion was altered by disruption of EP3 for either cohort. Moreover, treatment of islets with the EP3 antagonist DG-041 had no effect on GSIS in either mouse or human islets (Supplemental Figure 5).
Figure 4.

EP3 gene knockout does not affect GSIS. Perifusion of islets from (A) chow-fed and (B) HFD-fed EP3+/+ and EP3−/− mice showed no effect of EP3 genotype on GSIS. For each genotype, n = 4 in both graphs. Values are expressed as mean ± SEM.
EP3−/− mice have increased adiposity but a proportional decrease in epididymal fat pad mass
Body composition analyses over the course of the study revealed that HFD-fed EP3−/− mice had increased fat mass as compared with HFD-fed EP3+/+ (Figure 5A). A small but statistically significant increase in body fat was also observed at 20 weeks of age in EP3−/− mice vs EP3+/+ fed control diet. Postmortem analysis of epididymal fat pads confirmed that, when fed a HFD, fat pads from EP3−/− mice were heavier than those from EP3+/+ (Figure 5B).
Figure 5.
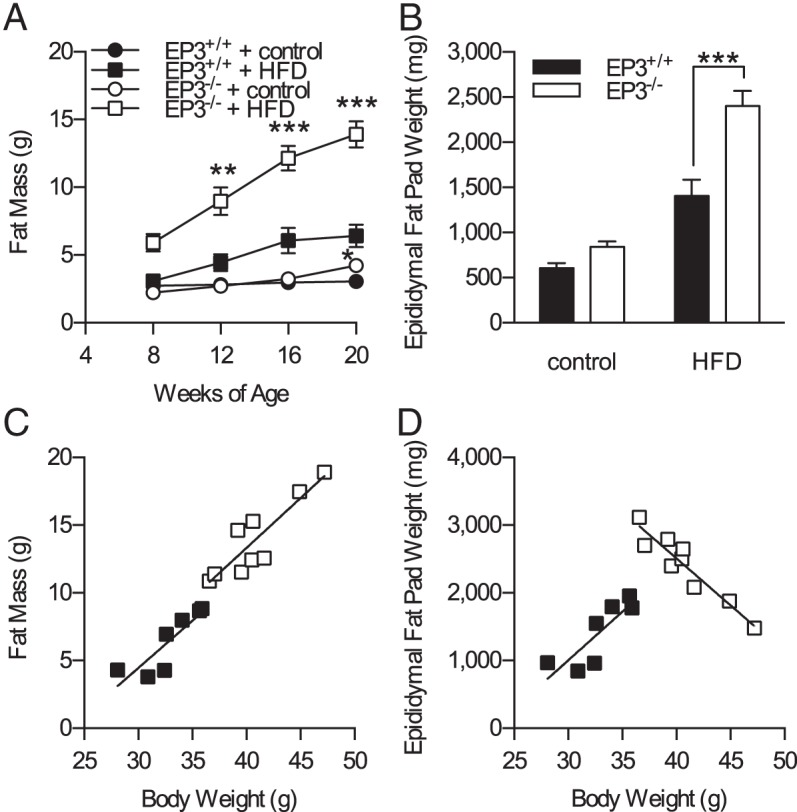
EP3−/− mice proportionately increase adiposity but not epididymal fat pad mass. A, Body composition was assessed at 4-week intervals by pulsed NMR. EP3−/− mice had increased fat mass when fed HFD (P = .0004). B, Epididymal fat pads were weighed postmortem at the conclusion of the study. Epididymal fat pads mice were heavier from EP3−/− HFD-fed mice (P = .0038). C, Mice fed HFD showed no difference in the total body fat to body weight ratio between genotypes (P = .8753). D, The relationship between epididymal fat pad weight and body weight differ between EP3−/− and EP3+/+ mice (P < .0001). For all figures, n = 9 EP3+/+ control, n = 10 EP3−/− control, n = 7 EP3+/+ HFD, and n = 9 EP3−/− HFD. Values are expressed as mean ± SEM.
When fat mass determined from whole body composition analysis at 20 weeks of age was plotted as a function of body weight for HFD-fed animals, the expected linear relationship was observed; and although EP3−/− mice fed HFD were heavier, they had the same overall linear relationship of fat mass to body weight (Figure 5C). In both genotypes, heavier mice had more fat mass than did the lighter mice, as determined by the body composition scanner. However, when epididymal fat pad weight was plotted as a function of body weight, a striking difference was observed between genotypes (Figure 5D). The heaviest EP3−/− HFD-fed mice had smaller epididymal fat pads than did the lightest EP3−/− HFD-fed mice. In control diet-fed animals, genotype did not affect the relationship between body weight and either fat mass or epididymal fat pad weight (Supplemental Figure 6).
EP3−/− mice have adipocyte hypertrophy but do not proportionally increase adipocyte size with increasing body weight
Both HFD feeding and EP3−/− genotype were associated with an increase in average adipocyte cell size in adipose tissue from 20-week-old mice (Figure 6A). When adipocyte cell size was plotted as a function of body weight, cell size to body weight ratios for EP3−/− HFD-fed mice were significantly different than those observed for EP3+/+ HFD-fed mice (Figure 6B). The size distribution showed that EP3−/− mice have a greater number of large adipocytes regardless of which diet they were fed (Supplemental Figure 7). These data suggest that the altered correlation between epididymal fat pad mass and body weight observed in EP3−/− HFD-fed animals is due to either alterations in adipocyte physiology or the inflammatory response in heavier EP3−/− animals or both.
Figure 6.

Epididymal fat pads from EP3−/− HFD-fed mice have increased cell size, necrosis, and inflammation. A, Average epididymal fat pad adipocyte cell sizes were calculated from measurements of adipocytes made using ImageJ software. EP3−/− mice were found to have larger adipocytes (P = .0002). B, Average adipocyte cell size from HFD-fed mice was plotted as a function of body weight. The relationship between adipocyte cell size and body weight is significantly different in EP3−/− mice (P = .0055). For A and B, n = 8 EP3+/+ control, n = 7 EP3−/− control, n = 7 EP3+/+ HFD, and n = 9 EP3−/− HFD. C, Representative H&E-stained sections of epididymal fat pads showing increased necrosis in the EP3−/− tissue. Arrow indicates a crown-like structure. D, For mice fed a HFD, epididymal fat pads from EP3−/− mice had more necrosis than EP3+/+ (P < .0001). No necrosis was observed in epididymal fat pads from control diet fed mice. E, The necrosis score of HFD-fed mice was plotted as a function of body weight. A similar correlation between body weight and necrosis score was observed between the EP3+/+ and EP3−/− genotypes (P = .1359). For C–E, n = 9 EP3+/+ control, n = 10 EP3−/− control, n = 7 EP3+/+ HFD, and n = 9 EP3−/− HFD. F, Gene expression of the macrophage marker, F4/80 (Emr1), was assessed by qPCR. HFD feeding increased F4/80 expression (P = .0002). F4/80 gene expression was increased in EP3−/− mice (P = .0010). An interaction between dietary fat and EP3 genotype increased F4/80 gene expression (P = .0016). G, F4/80 gene expression was plotted as a function of body weight. The relationship between F4/80 gene expression and body weight is significantly different in EP3−/− mice (P = .003). For F and G, n = 8 EP3+/+ control, n = 10 EP3−/− control, n = 7 EP3+/+ HFD, and n = 9 EP3−/− HFD. Values are expressed as mean ± SEM.
Epididymal fat pads from EP3−/− HFD-fed mice have increased necrosis and macrophage infiltration
H&E-stained epididymal fat pads from 20-week-old, HFD-fed EP3+/+ and EP3−/− mice were scored for necrosis on a scale of 0 to 4. EP3−/− HFD-fed mice showed areas of increased necrosis in the epididymal fat pads (Figure 6, C and D). Necrosis increased with increasing body weight in both genotypes (Figure 6E). Thus, in the EP3−/− HFD cohort, the heaviest mice have the smallest epididymal fat pads (Figure 5D) and these were the most necrotic. Signaling through EP3 is known to promote the production of vascular endothelial growth factor and angiogenesis (30–32). To test whether decreased vascularization lead to ischemia and necrosis in the epididymal fat pads, expression of Vegfa and Pecam1, markers of angiogenesis, were measured by qPCR. Expression of Vegfa was decreased by HFD feeding (Supplemental Figure 8A). However, Pecam1 was not altered by either EP3 genotype or dietary fat, suggesting that inadequate vascularization does not cause the observed necrosis (Supplemental Figure 8B).
Necrosis is associated with macrophage accumulation (33). Macrophage infiltration of epididymal fat pads was assessed by qPCR for F4/80 gene expression (Emr1). F4/80 gene expression demonstrated increased expression in the adipose tissue of EP3−/− mice when fed HFD (Figure 6F). In parallel with necrosis, macrophage infiltration of epididymal fat pads increased with increasing body weight (Figure 6G). The slope of F4/80 gene expression vs body weight was increased in EP3−/− HFD-fed mice compared with HFD-fed EP3+/+ mice and the smallest epididymal fat pads from the heaviest EP3−/− HFD-fed mice had the greatest amount of both necrosis and F4/80 gene expression. In the obese state, secretion of adipokines is disrupted with increased secretion of proinflammatory, insulin resistance promoting cytokines and decreased secretion of antiinflammatory, insulin-sensitizing cytokines (34). Increased expression of inflammation-associated adipokine genes was found in these epididymal fat pads; expression of TNF-α and monocyte chemoattractant protein-1 increased in EP3−/− mice when fed HFD (Figure 7, A and B). Increased expression of IL-6 was observed in EP3−/− mice but the effect of diet did not achieve statistical significance (Figure 7C). Gene expression of leptin, which is normally increased during obesity, was also increased in epididymal fat pads from EP3−/− mice (Figure 7D). The higher gene expression combined with increased fat mass, were associated with elevated plasma leptin in EP3−/− HFD-fed mice (Figure 7E). Gene expression of adiponectin, which is an insulin-sensitizing cytokine, was not altered in HFD-fed EP3+/+ mice (Figure 7F), consistent with what is seen in HFD-fed C57BL/6 mice (35–37). In HFD-fed EP3−/− mice, which have increased adiposity and inflammation in adipose tissue, gene expression of adiponectin was blunted (Figure 7F). EP3−/− HFD-fed mice have greater amounts of adipose tissue (Figure 5, B and D), which in conjunction with the decreased adiponectin gene expression was manifest by similar plasma levels of adiponectin in the HFD-fed EP3+/+ and EP3−/− mice.
Figure 7.

EP3−/− HFD-fed mice have increased expression of inflammation-associated adipokines. Epididymal fat pad gene expression from 20-week-old EP3+/+ and EP3−/− mice fed control or HFD was measured by qPCR. A, TNF-α gene (Tnf) expression was increased by an interaction between dietary fat and EP3 genotype (P = .0016). B, Expression of the monocyte chemoattractant protein-1 (MCP-1) gene (Ccl2) was increased by an interaction between dietary fat and EP3 genotype (P = .0069). C, IL-6 gene (Il6) expression was increased in EP3−/− mice (P = .0303). Il6 expression was not significantly affected by HFD feeding (P = .2091) or an interaction between HFD feeding and EP3 genotype (P = .6447). D, Leptin gene (Lep) expression was increased in EP3−/− mice (P = .0440) and by HFD feeding (P < .0001). Dietary fat and EP3 genotype did not interact synergistically to affect Lep expression (P = .9283). E, Plasma leptin concentration was increased by an interaction between dietary fat and EP3 genotype (P = .0269). F, Adiponectin gene (Adipoq) expression was not significantly affected by EP3 genotype (P = .2078) or by HFD feeding (P = .2049). However, an interaction between dietary fat and EP3 genotype decreased Adipoq expression (P = .0258). G, HFD feeding increased plasma adiponectin concentration (P = .0028). Plasma adiponectin levels were not significantly affected by EP3 genotype (P = .7423). For gene expression data (A–D and F), n = 8 EP3+/+ control, n = 10 EP3−/− control, n = 7 EP3+/+ HFD, and n = 8–9 EP3−/− HFD. For plasma leptin (E), n = 3 each group; and plasma adiponectin (G), n = 4 each group. Values are expressed as mean ± SEM.
EP3−/− adipocytes have increased lipolysis
PGs play an important role in lipolysis (14, 18, 38), which may also affect adipocyte cell size and epididymal fat pad mass. Adipocytes were isolated from 10-week-old EP3+/+ and EP3−/− mice and ISO stimulated lipolysis was assessed (Figure 8A). ISO stimulated lipolysis regardless of genotype. PGE2 inhibited lipolysis in adipocytes isolated from EP3+/+ mice but failed to inhibit lipolysis in adipocytes isolated from EP3−/− mice. Insulin inhibited lipolysis in both EP3+/+ and EP3−/− adipocytes indicating that adipocytes from both genotypes are susceptible to insulin regulation of lipolysis (data not shown). We also quantified the PGs in the adipose tissue. We found no significant effect of EP3 genotype or dietary fat on the levels of any of the PGs examined, suggesting that changes in EP3 ligand concentration were not responsible for the observed phenotype (Supplemental Table 3). Consistent with these data, the expression of the inducible COX-2 gene, Ptgs2, was also unaffected by dietary fat or EP3 genotype (data not shown). EP3 receptor expression was also unchanged as the expression of Ptger3 in epididymal fat pads was not affected by HFD feeding (Supplemental Figure 1G). Taken together, these data are consistent with defects in lipolysis regulation by PGE2 and lipid storage in EP3−/− adipocytes by loss of the receptor despite the presence of the cognate ligand.
Figure 8.

Increased lipolysis from EP3−/− adipocytes contributes to ectopic lipid deposition. A, isoproterenol (ISO) stimulated lipolysis in EP3+/+ and EP3−/− adipocytes. PGE2 inhibited lipolysis in EP3+/+ adipocytes but had no effect in EP3−/− adipocytes. Differences were assessed by Bonferroni post hoc analysis after a two-way ANOVA with repeated measures. †, P < .05 from EP3−/− no ISO no PGE2; ‡, P < .01 from EP3+/+ no ISO no PGE2; other significant post hoc comparisons are indicated on the figure. For each group, n = 3–4 mice. B, EP3−/− mice on HFD had increased liver weight (P = .0056). C, Liver weight to body weight ratio was higher in EP3−/− mice than EP3+/+ (P = .0257). D, EP3−/− mice on HFD had a higher triglyceride to hepatic tissue ratio, which resulted in increased hepatic triglycerides (P < .0001). E, EP3−/− mice on HFD had a higher triglyceride to skeletal muscle tissue ratio, which resulted in increased muscle triglycerides (P = .0035). F, The relationship between hepatic triglycerides and epididymal fat pad weight differ between EP3+/+ and EP3−/− mice (P < .0059). G, Mice fed HFD showed no difference in the skeletal muscle to epididymal fat pad weight ratio between genotypes (P = .6115). For B–G, n = 9 EP3+/+ control, n = 10 EP3−/− control, n = 7 EP3+/+ HFD, and n = 9 EP3−/− HFD. H, H&E staining of livers showed that EP3−/− mice fed HFD had increased steatosis. I, ORO staining showed increased lipid staining in livers of EP3−/− mice fed HFD. For H and I, all panels have the same magnification as upper left panel. Images are a representative sample from 3 mice per genotype × diet. Images are a representative sample from 3 mice per genotype × diet group, 2 sections per mouse. Values are expressed as mean ± SEM.
Because a defect in lipolysis regulation would be expected to alter circulating lipid levels, plasma lipids were measured. HFD feeding increased plasma triglycerides of both genotypes when measured during an ad libitum-fed state (Supplemental Figure 9A). EP3−/− mice fed HFD displayed a trend toward increased plasma triglycerides and free fatty acids (FFAs) when compared with EP3+/+ mice fed HFD, although neither achieved statistical significance (Supplemental Figure 9).
EP3−/− mice have increased ectopic lipid accumulation
Liver weight was increased in 20-week-old EP3−/− mice when fed HFD but not control diet (Figure 8B). An increased slope of liver weight vs body weight was observed for EP3−/− mice as compared with EP3+/+ mice (Figure 8C). Modest increases in Cpt1a and Mttp were observed in EP3−/− mice, whereas no changes were observed in Fasn due to EP3 genotype (Supplemental Figure 10, A–C). We hypothesized that alterations in fat pad storage in EP3−/− mice fed HFD resulted in the ectopic lipid storage, hepatosteotosis, and increased liver weight. Hepatic triglyceride levels were increased in EP3−/− mice fed HFD as compared with EP3+/+ mice fed HFD, although no differences between genotypes were observed for mice fed control diet (Figure 8D). Similarly, an increased accumulation of triglycerides was observed in skeletal muscle from EP3−/− mice fed HFD compared with EP3+/+ mice with no difference observed between genotypes fed control diet (Figure 8E). EP3−/− fat pad mass was inversely correlated with hepatic triglycerides but not skeletal muscle triglycerides (Figure 8, F and G). Dietary lipid and EP3 genotype caused modest changes in fatty acid composition of hepatic and muscle triglycerides (Supplemental Tables 4 and 5, respectively).
We assessed whether lipid redistribution to the liver and subsequent hepatic lipidosis would cause liver damage. We examined the livers histologically using H&E (Figure 8H), and ORO staining (Figure 8I). Livers from EP3−/− mice fed HFD showed markedly increased levels of steatosis and ORO staining. Steatosis in EP3+/+ mice fed HFD was present but not as pronounced as in the EP3−/− counterparts. When fed control diet, neither genotype displayed hepatic steatosis. Macrophage infiltration of livers was assessed by qPCR for F4/80 gene expression. No statistically significant difference in hepatic F4/80 gene expression was observed (P = .053) (Supplemental Figure 10D). Both genotypes showed elevated plasma alanine aminotransferase (data not shown), an enzymatic biomarker of hepatocyte membrane damage, indicating that HFD caused hepatocyte membrane damage. We did not observe fibrosis in the H&E-stained sections in either genotype.
Discussion
In the present studies, we found that EP3−/− mice, when faced with a nutritional challenge, are prone to obesity and dysregulation of adipocyte function. These findings show a novel interaction between EP3 genotype and dietary fat content. The effects of EP3 gene deletion are pleiotropic with changes observed in activity, body mass, inflammation and adipocyte function. We demonstrate here that the obesity phenotype is not penetrant when EP3−/− mice are maintained on either normal chow diet (Laboratory Rodent Diet 5001, 13.5% fat) or on control diet (D12450Bi, 10% fat); however, EP3−/− mice fed HFD (D12451i, 45% fat) become more obese. These findings are consistent with previous studies that EP3−/− mice are obese, hyperleptimemic, insulin resistant, and have impaired glucose homeostasis when fed breeder chow (22). In studies presented here, EP3−/− mice were not hyperphagic but did show a significant reduction in activity, which may contribute to the increased body mass of these mice. This is significantly different from previous studies, which showed a very modest increase in food intake and an increase in activity (22). Moreover those studies showed an increase in activity in the light cycle, whereas we observed no changes in activity in the light cycle, but a decrease in activity in the dark cycle. These observed differences may be due to differences in experimental conditions such as the diet (breeder chow vs HFD) or the methodology used to collect the activity data (surgical radiotelemetry implantation vs noninvasive “beambreak”). In any event, we do not observe an increase in food consumption to account for the obesity, and we do observe decreases in activity consistent with the obesity phenotype observed.
The EP3−/− mice demonstrate ectopic lipid accumulation and insulin resistance similar to the phenotype of AdPLA−/− mice, which lack PGE2-EP3 signaling in adipose tissue (17). Importantly, the phenotype of EP3−/− mice differs from that of AdPLA−/− mice in that EP3−/− mice are obese and have more adipose tissue whereas AdPLA−/− mice are lean. This suggests that the increased obesity and overall adiposity in EP3−/− HFD-fed mice are due to a lack of EP3 signaling in nonadipose sites of action (eg, central nervous system), in contrast to AdPLA−/− mice, which presumably have reduced EP3 signaling only in adipose tissue. It is our hypothesis that deletion of the EP3 receptor in a number of tissues contributes to the overall increased obesity, fat mass, and adipocyte size; changes in the adipose tissue of EP3−/− mice, including increased inflammation, cell death, and lipolysis, contribute to the proportional decrease of epididymal fat pad mass and adipocyte size and the increased ectopic lipid accumulation. PGs have been shown to play an important role in adipocyte function (14). Norepinephrine signaling in adipose tissue increases intracellular cAMP and thereby activates protein kinase A, which phosphorylates and activates hormone-sensitive lipase, the rate-limiting step in lipolysis (18–21). PGE2 inhibits norepinephrine-stimulated lipolysis (39–45). Adipocytes from EP3−/− mice had a loss of PGE2-evoked inhibition of lipolysis similar to that observed in AdPLA−/− mice. Insulin is also a potent suppressor of lipolysis in adipose tissue. We did not observe a statistically significant difference in either plasma triglyceride or FFA levels, even though HFD-fed EP3−/− mice had elevated plasma insulin. The failure of the elevated insulin to suppress FFA levels indicates that the adipose tissue from in HFD-fed EP3−/− mice is insulin resistant. In addition, significant accumulation of triglycerides in liver and skeletal muscle were observed in these mice and are further indications of persistent, chronic dyslipidemia and adipocyte dysfunction. It is of interest that although we observed an increase in macrophage infiltration and inflammatory cytokine levels in adipose tissue of the EP3−/− mice, these changes were not observed in the fat pads of AdPLA−/− mice (17), suggesting that unrestrained lipolysis alone is sufficient to contribute to ectopic lipid accumulation.
Increased necrosis was observed in parallel with increased macrophage infiltration in epididymal fat pads of EP3−/− HFD-fed mice. Adipocyte cell death and macrophage infiltration may also result in the release of lipids from adipocytes and may exacerbate ectopic triglyceride accumulation (46–48). Previous studies demonstrated that when wild-type C57BL/6 mice are fed a 60% HFD adipocyte death in epididymal fat pads results in decreased adipocyte size, lighter epididymal fat pads, increased macrophage infiltration, increased liver mass and steatosis, and insulin resistance (47). This study noted a similar correlation to what we have observed; epididymal fat pad weight negatively correlated with body weight in the heaviest mice in the group. In addition, they found that the mice with the lightest epididymal fat pads had increased liver weight, suggesting lipid redistribution from the epididymal fat pads to ectopic tissues, which likely contributed to insulin resistance (47). Data presented here are consistent with this phenotype and suggest that the deletion of the EP3 receptor may exacerbate or accelerate this adipose tissue remodeling and resultant ectopic lipid accumulation. Thus, increased lipolysis coupled with increased adipocyte cell death in the heaviest mice, as evidenced by the disproportionately increased macrophage infiltration, accounts for the reduced epididymal fat pad mass and the severe increase in hepatic triglycerides in the heaviest EP3−/− mice.
Although we saw an increase in circulating insulin levels in the obese, insulin resistant EP3−/− mice, we did not observe a corresponding increase in GSIS in isolated pancreatic islets. This difference may be partly attributed to normalization of the GSIS to insulin content in perifusion studies, implying loss of EP3 did not alter intrinsic islet function. Because basal insulin and glucose levels were increased in obese EP3−/− mice the hyperglycemia combined with other factors such as increased β-cell mass and/or altered autonomic tone to the islet may have sustained insulin secretion. We were unable to detect significant changes in β-cell mass in the current study. However, obese EP3−/− mice were not glucose intolerant. Thus, the underlying hyperinsulinemia was critical in maintaining normal glucose tolerance despite concomitant insulin resistance.
It has long been appreciated that PGE2 modulates GSIS and has been suggested that blockade of the EP3 receptor would improve insulin secretion (49). Studies have indicated that pharmacological blockade of the EP3 receptor in pancreatic islets improves GSIS (50, 51). In our studies using both genetic and pharmacological tools we found no evidence suggesting improved GSIS in either chow-fed or HFD-fed animals, nor did we see any change in GSIS in human islet samples. Islets isolated from EP3−/− mice phenocopied islets treated with the antagonist DG-041 providing strong evidence that there is no effect of EP3 on GSIS under the conditions that we tested. It should be noted that previous studies showing GSIS differences in human islets only observed differences in EP3 mediated GSIS in islets isolated from diabetic individuals; no differences in GSIS were observed upon antagonist treatment of islets from nondiabetic individuals (50).
In summary, the EP3−/− mice are sensitive to caloric overload and display increased obesity, lipolysis, and adipocyte cell death, which is accompanied by reallocation of lipid storage from fat to ectopic tissues, leading to hepatic lipidosis and insulin resistance. These phenotypes are not penetrant when mice are fed control or chow diets, which contain less dietary fat. These studies demonstrate that EP3 is an important player in adipose tissue physiology.
Acknowledgments
Present address for D.L.: Department of Life Sciences, College of Natural Sciences, Ewha Womans University, Seoul 120-720, South Korea.
Present address for D.W.T.: Department of Molecular and Cellular Medicine, Texas A&M University, College Station, TX 77843.
This work was supported by National Institutes of Health Grants DK46205 (to R.M.B.) and DK37097 (to R.M.B.) and by National Institutes of Health (NIH) Grants DK72473, DK89572, DK104211, DK097829, and DK69603 (to A.C.P.) The Mouse Metabolic Phenotyping Center is supported in part by the NIH Grant DK059637. The Islet Procurement and Analysis Core is supported by the Vanderbilt Diabetes Research and Training Center Grant P30 DK020593. The Vanderbilt University Hormone Assay and Analytical Services Core was supported by NIH Grants DK020593 and DK059637. Merit Awards from the Department of Veterans Affairs to A.C.P. (1BX000666), M.G. (1BX000990-01), and R.M.B. (1BX000616) also supported this work. A.C.P. and M.G. have awards from the Juvenile Diabetes Research Foundation (17-2012-26, 17-2013-321, and 17-2013-324). R.P.C. was supported in part by a Graduate Award for Integrative Research in Pharmacology from The American Society for Pharmacology and Experimental Therapeutics and by funding provided by the Vanderbilt Center for Kidney Disease. B.A.C. is supported by the Stem Cell and Regenerative Developmental Biology Training Grant T32-HD05702. This work was also supported in part by Clinical and Translational Science Award UL1TR000445 from the National Center for Advancing Translational Sciences. Its contents are solely the responsibility of the authors and do not necessarily represent official views of the National Center for Advancing Translational Sciences, the National Institutes of Health, or the United States Department of Veterans Affairs or the United States Government.
Disclosure Summary: The authors have nothing to disclose.
Footnotes
- AdPLA
- adipocyte phospholipase
- COX
- cyclooxygenase
- Emr1
- EGF-like module-containing mucin-like hormone receptor-like 1
- EP
- E-prostanoid
- EP3
- EP receptor 3
- GSIS
- glucose-stimulated insulin secretion
- H&E
- hematoxylin and eosin
- HFD
- high-fat diet
- HOMA-IR
- homeostatic model assessment of insulin resistance
- IP-GTT
- ip glucose tolerance test
- ISO
- isoproterenol
- ORO
- Oil Red O
- Pecam1
- platelet endothelial cell adhesion molecule-1
- PG
- prostaglandin
- qPCR
- quantitative real-time RT-PCR.
References
- 1. Schenk S, Saberi M, Olefsky JM. Insulin sensitivity: modulation by nutrients and inflammation. J Clin Invest. 2008;118(9):2992–3002. [DOI] [PMC free article] [PubMed] [Google Scholar]
- 2. Sjöholm A, Nyström T. Inflammation and the etiology of type 2 diabetes. Diabetes Metab Res Rev. 2006;22(1):4–10. [DOI] [PubMed] [Google Scholar]
- 3. Sears DD, Hsiao G, Hsiao A, et al. Mechanisms of human insulin resistance and thiazolidinedione-mediated insulin sensitization. Proc Natl Acad Sci USA. 2009;106(44):18745–18750. [DOI] [PMC free article] [PubMed] [Google Scholar]
- 4. Parazzoli S, Harmon JS, Vallerie SN, Zhang T, Zhou H, Robertson RP. Cyclooxygenase-2, not microsomal prostaglandin E synthase-1, is the mechanism for interleukin-1β-induced prostaglandin E2 production and inhibition of insulin secretion in pancreatic islets. J Biol Chem. 2012;287(38):32246–32253. [DOI] [PMC free article] [PubMed] [Google Scholar]
- 5. Tran PO, Gleason CE, Poitout V, Robertson RP. Prostaglandin E2 mediates inhibition of insulin secretion by interleukin-1β. J Biol Chem. 1999;274(44):31245–31248. [DOI] [PubMed] [Google Scholar]
- 6. Kawahara K, Hohjoh H, Inazumi T, Tsuchiya S, Sugimoto Y. Prostaglandin E2-induced inflammation: relevance of prostaglandin E receptors. Biochim Biophys Acta. 2015;1851(4):414–421. [DOI] [PubMed] [Google Scholar]
- 7. Liang X, Wang Q, Shi J, et al. The prostaglandin E2 EP2 receptor accelerates disease progression and inflammation in a model of amyotrophic lateral sclerosis. Ann Neurol. 2008;64(3):304–314. [DOI] [PMC free article] [PubMed] [Google Scholar]
- 8. Murata T, Ushikubi F, Matsuoka T, et al. Altered pain perception and inflammatory response in mice lacking prostacyclin receptor. Nature. 1997;388(6643):678–682. [DOI] [PubMed] [Google Scholar]
- 9. Samuelsson B, Morgenstern R, Jakobsson PJ. Membrane prostaglandin E synthase-1: a novel therapeutic target. Pharmacol Rev. 2007;59(3):207–224. [DOI] [PubMed] [Google Scholar]
- 10. Hata AN, Breyer RM. Pharmacology and signaling of prostaglandin receptors: multiple roles in inflammation and immune modulation. Pharmacol Ther. 2004;103(2):147–166. [DOI] [PubMed] [Google Scholar]
- 11. Regard JB, Sato IT, Coughlin SR. Anatomical profiling of G protein-coupled receptor expression. Cell. 2008;135(3):561–571. [DOI] [PMC free article] [PubMed] [Google Scholar]
- 12. Iyer A, Fairlie DP, Prins JB, Hammock BD, Brown L. Inflammatory lipid mediators in adipocyte function and obesity. Nat Rev Endocrinol. 2010;6(2):71–82. [DOI] [PubMed] [Google Scholar]
- 13. Masoodi M, Kuda O, Rossmeisl M, Flachs P, Kopecky J. Lipid signaling in adipose tissue: connecting inflammation & metabolism. Biochim Biophys Acta. 2015;1851(4):503–518. [DOI] [PubMed] [Google Scholar]
- 14. Richelsen B. Release and effects of prostaglandins in adipose tissue. Prostaglandins Leukot Essent Fatty Acids. 1992;47(3):171–182. [DOI] [PubMed] [Google Scholar]
- 15. Tang EH, Cai Y, Wong CK, et al. Activation of prostaglandin E2-EP4 signaling reduces chemokine production in adipose tissue. J Lipid Res. 2015;56(2):358–368. [DOI] [PMC free article] [PubMed] [Google Scholar]
- 16. Iyer A, Lim J, Poudyal H, et al. An inhibitor of phospholipase A2 group IIA modulates adipocyte signaling and protects against diet-induced metabolic syndrome in rats. Diabetes. 2012;61(9):2320–2329. [DOI] [PMC free article] [PubMed] [Google Scholar]
- 17. Jaworski K, Ahmadian M, Duncan RE, et al. AdPLA ablation increases lipolysis and prevents obesity induced by high-fat feeding or leptin deficiency. Nat Med. 2009;15(2):159–168. [DOI] [PMC free article] [PubMed] [Google Scholar]
- 18. Chaves VE, Frasson D, Kawashita NH. Several agents and pathways regulate lipolysis in adipocytes. Biochimie. 2011;93(10):1631–1640. [DOI] [PubMed] [Google Scholar]
- 19. Granneman JG, Moore HP. Location, location: protein trafficking and lipolysis in adipocytes. Trends Endocrinol Metab. 2008;19(1):3–9. [DOI] [PubMed] [Google Scholar]
- 20. Holm C, Osterlund T, Laurell H, Contreras JA. Molecular mechanisms regulating hormone-sensitive lipase and lipolysis. Annu Rev Nutr. 2000;20:365–393. [DOI] [PubMed] [Google Scholar]
- 21. Lampidonis AD, Rogdakis E, Voutsinas GE, Stravopodis DJ. The resurgence of hormone-sensitive lipase (HSL) in mammalian lipolysis. Gene. 2011;477(1–2):1–11. [DOI] [PubMed] [Google Scholar]
- 22. Sanchez-Alavez M, Klein I, Brownell SE, et al. Night eating and obesity in the EP3R-deficient mouse. Proc Natl Acad Sci USA. 2007;104(8):3009–3014. [DOI] [PMC free article] [PubMed] [Google Scholar]
- 23. Ushikubi F, Segi E, Sugimoto Y, et al. Impaired febrile response in mice lacking the prostaglandin E receptor subtype EP3. Nature. 1998;395(6699):281–284. [DOI] [PubMed] [Google Scholar]
- 24. Baecker V. ImageJ macro tool sets for biological image analysis. Presented at the ImageJ User and Developer Conference 2012, Luxembourg, 2012. [Google Scholar]
- 25. Folch J, Lees M, Sloane Stanley GH. A simple method for the isolation and purification of total lipides from animal tissues. J Biol Chem. 1957;226(1):497–509. [PubMed] [Google Scholar]
- 26. Morrison WR, Smith LM. Preparation of fatty acid methyl esters and dimethylacetals from lipids with boron fluoride–methanol. J Lipid Res. 1964;5:600–608. [PubMed] [Google Scholar]
- 27. Pfaffl MW. A new mathematical model for relative quantification in real-time RT-PCR. Nucleic Acids Res. 2001;29(9):e45. [DOI] [PMC free article] [PubMed] [Google Scholar]
- 28. Viswanadha S, Londos C. Optimized conditions for measuring lipolysis in murine primary adipocytes. J Lipid Res. 2006;47(8):1859–1864. [DOI] [PubMed] [Google Scholar]
- 29. Dai C, Brissova M, Hang Y, et al. Islet-enriched gene expression and glucose-induced insulin secretion in human and mouse islets. Diabetologia. 2012;55(3):707–718. [DOI] [PMC free article] [PubMed] [Google Scholar]
- 30. Amano H, Hayashi I, Endo H, et al. Host prostaglandin E2-EP3 signaling regulates tumor-associated angiogenesis and tumor growth. J Exp Med. 2003;197(2):221–232. [DOI] [PMC free article] [PubMed] [Google Scholar]
- 31. Oba K, Hosono K, Amano H, et al. Downregulation of the proangiogenic prostaglandin E receptor EP3 and reduced angiogenesis in a mouse model of diabetes mellitus. Biomed Pharmacother. 2014;68(8):1125–1133. [DOI] [PubMed] [Google Scholar]
- 32. Taniguchi T, Fujino H, Israel DD, Regan JW, Murayama T. Human EP3(I) prostanoid receptor induces VEGF and VEGF receptor-1 mRNA expression. Biochem Biophys Res Commun. 2008;377(4):1173–1178. [DOI] [PubMed] [Google Scholar]
- 33. Cinti S, Mitchell G, Barbatelli G, et al. Adipocyte death defines macrophage localization and function in adipose tissue of obese mice and humans. J Lipid Res. 2005;46(11):2347–2355. [DOI] [PubMed] [Google Scholar]
- 34. Jung UJ, Choi MS. Obesity and its metabolic complications: the role of adipokines and the relationship between obesity, inflammation, insulin resistance, dyslipidemia and nonalcoholic fatty liver disease. Int J Mol Sci. 2014;15(4):6184–6223. [DOI] [PMC free article] [PubMed] [Google Scholar]
- 35. Anderson NJ, King MR, Delbruck L, Jolivalt CG. Role of insulin signaling impairment, adiponectin and dyslipidemia in peripheral and central neuropathy in mice. Dis Model Mech. 2014;7(6):625–633. [DOI] [PMC free article] [PubMed] [Google Scholar]
- 36. Barnea M, Shamay A, Stark AH, Madar Z. A high-fat diet has a tissue-specific effect on adiponectin and related enzyme expression. Obesity (Silver Spring). 2006;14(12):2145–2153. [DOI] [PubMed] [Google Scholar]
- 37. Sumiyoshi M, Sakanaka M, Kimura Y. Chronic intake of high-fat and high-sucrose diets differentially affects glucose intolerance in mice. J Nutr. 2006;136(3):582–587. [DOI] [PubMed] [Google Scholar]
- 38. Ahmadian M, Wang Y, Sul HS. Lipolysis in adipocytes. Int J Biochem Cell Biol. 2010;42(5):555–559. [DOI] [PMC free article] [PubMed] [Google Scholar]
- 39. Bergström S, Carlson LA. Inhibitory action of prostaglandin E1 on the mobilization of free fatty acids and glycerol from human adipose tissue in vitro prostaglandin and related factors. Acta Physiol Scand. 1965;63(1–2):195–196. [DOI] [PubMed] [Google Scholar]
- 40. Dalton C, Hope H, Martikes L. Prostaglandin inhibition of cyclic-AMP accumulation and rate of lipolysis in fat cells. Prostaglandins. 1974;7(4):319–326. [DOI] [PubMed] [Google Scholar]
- 41. Efendić S. Influence of prostaglandin E1 on lipolysis induced by noradrenaline, isopropylnoradrenaline, theophylline, and dibutyryl cAMP in human omental adipose tissue in vitro. Acta Med Scand. 1970;187(6):503–507. [DOI] [PubMed] [Google Scholar]
- 42. Moskowitz J, Fain JN. Hormonal regulation of lipolysis and phosphorylase activity in human fat cells. J Clin Invest. 1969;48(10):1802–1808. [DOI] [PMC free article] [PubMed] [Google Scholar]
- 43. Mühlbachova E, Sólyom A, Puglisi L. Investigations on the mechanism of the prostaglandin E1 antagonism to norepinephrine and theophylline-induced lipolysis. Eur J Pharmacol. 1967;1(4):321–325. [Google Scholar]
- 44. Steinberg D, Vaughan M, Nestel PJ, Strand O, Bergström S. Effects of the prostaglandins on hormone-induced mobilization of free fatty acids. J Clin Invest. 1964;43:1533–1540. [DOI] [PMC free article] [PubMed] [Google Scholar]
- 45. Stock K, Prilop M. Dissociation of catecholamine-induced formation of adenosine 3′5′-monophosphate and release of glycerol in fat cells by prostaglandin E1, E2 and N6-phenylisopropyladenosine. Naunyn Schmiedebergs Arch Pharmacol. 1974;282(1):15–31. [DOI] [PubMed] [Google Scholar]
- 46. Alkhouri N, Gornicka A, Berk MP, et al. Adipocyte apoptosis, a link between obesity, insulin resistance, and hepatic steatosis. J Biol Chem. 2010;285(5):3428–3438. [DOI] [PMC free article] [PubMed] [Google Scholar]
- 47. Strissel KJ, Stancheva Z, Miyoshi H, et al. Adipocyte death, adipose tissue remodeling, and obesity complications. Diabetes. 2007;56(12):2910–2918. [DOI] [PubMed] [Google Scholar]
- 48. Wueest S, Rapold RA, Schumann DM, et al. Deletion of Fas in adipocytes relieves adipose tissue inflammation and hepatic manifestations of obesity in mice. J Clin Invest. 2010;120(1):191–202. [DOI] [PMC free article] [PubMed] [Google Scholar]
- 49. Tran PO, Gleason CE, Robertson RP. Inhibition of interleukin-1β-induced COX-2 and EP3 gene expression by sodium salicylate enhances pancreatic islet β-cell function. Diabetes. 2002;51(6):1772–1778. [DOI] [PubMed] [Google Scholar]
- 50. Kimple ME, Keller MP, Rabaglia MR, et al. Prostaglandin E2 receptor, EP3, is induced in diabetic islets and negatively regulates glucose- and hormone-stimulated insulin secretion. Diabetes. 2013;62(6):1904–1912. [DOI] [PMC free article] [PubMed] [Google Scholar]
- 51. Shridas P, Zahoor L, Forrest KJ, Layne JD, Webb NR. Group X secretory phospholipase A2 regulates insulin secretion through a cyclooxygenase-2-dependent mechanism. J Biol Chem. 2014;289(40):27410–27417. [DOI] [PMC free article] [PubMed] [Google Scholar]