

Abstract
Increasing evidence implicates abnormal Ras signaling as a major contributor in neurodevelopmental disorders, yet how such signaling causes cortical pathogenesis is unknown. We examined the consequences of aberrant Ras signaling in the developing mouse brain and uncovered several critical phenotypes, including increased production of cortical neurons and morphological deficits. To determine whether these phenotypes are recapitulated in humans, we generated induced pluripotent stem (iPS) cell lines from patients with Costello syndrome (CS), a developmental disorder caused by abnormal Ras signaling and characterized by neurodevelopmental abnormalities, such as cognitive impairment and autism. Directed differentiation toward a neuroectodermal fate revealed an extended progenitor phase and subsequent increased production of cortical neurons. Morphological analysis of mature neurons revealed significantly altered neurite length and soma size in CS patients. This study demonstrates the synergy between mouse and human models and validates the use of iPS cells as a platform to study the underlying cellular pathologies resulting from signaling deficits.
SIGNIFICANCE STATEMENT Increasing evidence implicates Ras signaling dysfunction as a major contributor in psychiatric and neurodevelopmental disorders, such as cognitive impairment and autism, but the underlying cortical cellular pathogenesis remains unclear. This study is the first to reveal human neuronal pathogenesis resulting from abnormal Ras signaling and provides insights into how these phenotypic abnormalities likely contribute to neurodevelopmental disorders. We also demonstrate the synergy between mouse and human models, thereby validating the use of iPS cells as a platform to study underlying cellular pathologies resulting from signaling deficits. Recapitulating human cellular pathologies in vitro facilitates the future high throughput screening of potential therapeutic agents that may reverse phenotypic and behavioral deficits.
Keywords: cortical development, Costello syndrome, iPS cells, Ras, stem cells
Introduction
Ras proteins comprise a critical signaling hub within the cell. Ras is activated transiently and in a stimulus-dependent fashion by growth factor binding to receptor tyrosine kinases, nonreceptor tyrosine kinases-associated receptors, G protein-coupled receptors, and integrins (Shields et al., 2000). Activated Ras regulates the phosphorylation of several downstream kinases that trigger cascade mechanisms resulting in the regulation of cell cycle progression, transcription, survival, proliferation, morphology, and differentiation (Downward, 2003). Increasing evidence implicates Ras signaling dysfunction as a major contributor in psychiatric and neurodevelopmental disorders, such as cognitive impairment and autism (Comings et al., 1996; Stornetta and Zhu, 2011; Yang et al., 2011; Chow et al., 2012; Adviento et al., 2014; Alfieri et al., 2014; Network and Pathway Analysis Subgroup of Psychiatric Genomics, 2015), but the underlying cortical cellular pathogenesis remains unclear.
The advent of induced pluripotent stem cell (iPS cell) technology has provided a new paradigm for the study of cellular pathogenesis in human disease-specific populations. While limitations exist in modeling whole-brain disorders ex vivo, basic phenotypes at the cellular and/or network levels can likely be uncovered. To date, iPS cells have been successfully used to identify functional cellular and biochemical phenotypes linked to disease pathology in spinal muscular atrophy (Ebert et al., 2009), familial dysautonomia (Lee et al., 2009), Rett syndrome (Marchetto et al., 2010), schizophrenia (Brennand et al., 2011), and retinitis pigmentosa (Jin et al., 2011). Furthermore, iPS cell platforms have been successfully used to model cerebral cortex development, thereby enabling ex vivo disease modeling at the cortical level (Shi et al., 2012). However, to date, this technology has never been applied to examine the neurodevelopmental consequences of disrupted Ras/MAPK signaling, nor has there been a direct comparison of human in vitro phenotypes with a mouse model.
We sought to address this gap in our understanding of how Ras signaling impacts neuronal development by identifying a patient population with known Ras signaling dysfunction and neurodevelopmental abnormalities. Costello syndrome (CS) is a severe developmental mendelian disorder caused by gain-of-function mutation in the gene HRAS, resulting in increased and sustained Ras activity (Aoki et al., 2005; Rauen, 2007). Clinical neurological features of the disorder include significant mental retardation, cerebellar abnormalities, electrophysiological abnormalities (Delrue et al., 2003), and a predisposition to autism phenotypes (Adviento et al., 2014). To determine the cellular consequences of the HRAS mutation causing CS, we compared a HrasG12V mouse model of CS to a human model generated by somatic cell reprogramming from individuals with a HRASG12S point mutation, which underlies pathogenesis in 80% of patients with CS (Gripp et al., 2008).
Materials and Methods
Patient lines.
All human research was performed in accordance with Institutional Review Board and Committee on Human Research codes of practice. Human dermal fibroblasts were isolated from punch biopsies as described previously (Villegas and McPhaul, 2005). Patients were selected based on the presence of a HRAS G12S point mutation: 09097C (female, 26 years old), 110150C (female, 1 year old), 110131C (female, 1 year old), and C11011 (male, 1 year old). Control lines from healthy patients included fibroblast lines 09097B (male, 63 years old), 110119B (male, 44 years old), 0162D (female, 15 years old), 0165D (female, 12 years old), and those obtained from ATCC Global Bioresource Center GM00498 (male, 3 years old). iPS cell control lines were also obtained from Dr. Shinya Yamanaka's laboratory: WTB (female, 47 years old), BJ (male, neonatal), 1323 (female, unknown age), and YH (male, 30 years old).
Cell culture.
Human fibroblasts were cultured in DMEM (Invitrogen) supplemented with 10% FBS (Hyclone). Established iPS cells were initially maintained on mitomycin-C-treated mouse embryonic fibroblasts (Millipore) in knock-out DMEM plus serum replacement (Invitrogen), supplemented with 10 ng/ml bFGF (Millipore). After the sixth passage, cells were expanded on a Matrigel substrate (BD Biosciences) in mTeSR media (Stem Cell Technologies).
Generation of iPS cells with episomal vectors.
iPS cell lines were generated from fibroblast lines using episomal plasmid vectors as previously described (Okita et al., 2011). Briefly, 3 μg of expression plasmid mixture (pCXLE-hOct3/4-shp53-F, pCXLE-hSK, pCXLE-hUL; Addgene plasmids 27077, 27078, and 27080, respectively) was electroporated into 3.6 × 10⁵ fibroblasts with a Neon transfection device (Invitrogen) using a 100 μl kit according to the manufacturer's instructions. Conditions used for electroporation were 1650 V, 10 ms width, and 3 pulses. The cell suspension was then directly pipetted into gelatin-coated 6 well plates containing fibroblast medium. The cells were trypsinized 7 d after transduction, and 1 × 10⁵ cells were replated onto mouse embryonic fibroblast-covered 100 mm dishes. The culture media was replaced the next day with embryonic stem cell media containing bFGF. Colonies were selected for further expansion 20–30 d after transduction.
Proliferation assays.
Fibroblasts and iPS cells were plated at 5000 and 30,000 cells/cm2, respectively, and were counted 4 d later on a hemocytometer using trypan blue exclusion. Doubling time was calculated based on original plating density and density at time of harvest.
Fibroblasts and iPS cells were also attached on coverslips for 48 h and treated with 0.2 μm BrdU for 1.5 h. Cells were fixed with methanol for 10 min, followed by incubation with 2 N HCl for 20 min. Immunostaining with the BrdU antibody was performed as described below.
Ras pulldown assays.
Activation of Ras was analyzed by a Ras-GTP pull-down assay essentially according to the manufacturer's instructions (Millipore). Briefly, cells were rested with PBS with Ca/Mg in 6-well plates at 37°C for 2 h. Cells were then lysed with ice-cold 1× MLB for pull downs (Millipore) and scraped. Twenty percent of the lysate was used for whole-cell lysate, and 80% was used for pull down. MLB lysates were tumbled in the cold room with RAF-1 RBD agarose for 50 min, washed 3 times in ice-cold 1% NP40 buffer, after which the agarose was resuspended in sample buffer, boiled. Lysates were loaded on precast Bis-Tris gel 4%–12% (Invitrogen) and transfer on PVDF membrane for blocking. Membranes were incubated with primary antibody and specific signals have been visualized with enhanced chemoluminescence and imaging on a Fuji LAS 4000 image station (GE Healthcare). The protein bands in Western blots were quantified with Multi Gauge software, and densitometry (pixel intensity) was determined within the linear range of the exposure. Amounts of the proteins of interest were typically presented as a ratio of a loading control. Results represent three independent extractions and experiments.
Western blot.
Total protein was harvested from cell preparations using a cell lysis buffer (Cell Signaling Technology) supplemented with complete protease/phosphatase inhibitors (Sigma-Aldrich); 60 μg of protein per well was loaded into a 10% Bis-Tris SDS-PAGE gel (Invitrogen) under denaturing conditions. Proteins were transferred to PVDF membranes (Millipore), blocked in TBS-T, and blotted against HRAS (1:200, Santa Cruz Biotechnology) or α-tubulin (1:2000, Sigma-Aldrich) overnight at 4°C.
Directed neural differentiation of iPS cells.
iPS cells were differentiated into neuroepithelia as previously described (Zhang et al., 2001). Briefly, iPS cell lines cultured on a Matrigel substrate in mTeSR media were treated with 3 U/ml dispase (Invitrogen), scraped and transferred to uncoated T-25 flasks in mTeSR media containing 10 μm ROCK inhibitor (Calbiochem). At 24–48 h after suspension in mTeSR media, embryoid bodies were transferred to neural media [DMEM/F12/1% N2 supplement/1% nonessential amino acids (Invitrogen)/2 μg/ml heparin/0.5% penicillin/streptomycin (Sigma-Aldrich)] supplemented with the small molecules 5 μm SB431542 and 0.25 μm LDN-193189 (Stemgent), which inhibit TGF-β1 activin receptor-like kinases and SMAD, respectively. After 3 d, embryoid bodies were transferred to Matrigel-coated 6 well plates for rosette formation and fed with neural media (without the addition of SB and LDN). The rosettes were mechanically isolated, expanded as neurospheres, and plated for differentiation into neurons. Eight different patient lines (four healthy control and four patients with HRASG12S mutation) were differentiated at least twice for all experiments.
Morphological analysis of in vitro neuronal populations.
At day 28 of neuronal differentiation, neurospheres were dissociated into single cells using Accutase (Stem Cell Technologies) and were electroporated (as described above) at a concentration of 1 μg of pCXLE-eGFP plasmid (Addgene plasmid 27082) in 600,000 cells. Conditions used for electroporation were 1500 V, 10 ms width, and 3 pulses. The cell suspension was then directly pipetted into Matrigel-coated 12 plates at 50,000 cells/cm2 and fed with neural media supplemented with B27. Cells were fixed 9 d after electroporation with 4% PFA and imaged using a Zeiss (Imager.M1) fluorescent microscope. ImageJ Fiji software was used to measure soma size and neurite length. Sholl analyses were conducted on GFP-expressing neurons using a customized Simple Neurite Tracer plugin for Fiji. GFP-labeled neuritic intersections were counted at a radius step size of 1.6 μm from the cell soma.
Cell cycle exit analysis.
A single dose of BrDU (Sigma, 15 ng/ml) was added to neuronal precursor cells (NPCs) (day 28) for 4 h before neural differentiation (see above) and fixed after 48 h. Neural cultures were processed for immunostaining with anti-BrdU (mouse anti-BrdU, 1:100, BD Biosciences) and anti-Ki67 antibodies (rabbit anti-Ki67; 1:400, Abcam). Cell cycle exit was established by counting all BrdU+ but Ki67− cells over the total number of BrdU+ cells per coverslip. The percentage of BrdU+/KI67− cells was reported.
Immunocytochemistry, imaging, and quantification.
Cultures were fixed with 4% PFA in PBS or in ice-cold methanol and processed for immunofluorescent staining and fluorescence microscopy. Secondary antibodies used for primary antibody detection were species-specific Alexa dye conjugates (Invitrogen). For primary antibodies, we used antibodies to BrdU (Abcam: ab6326); Caspase 3 (Abcam: ab2302); Cux-1 (Santa Cruz Biotechnology: SC13024); Ctip-2 (Abcam: ab28448); Ki-67 (Abcam: ab15580); MAP-2 (Millipore Bioscience Research Reagents: MAB3418); Oct-4 (Cell Signaling Technology: 2750); SatB2 (Santa Cruz Biotechnology: SC81376); Synapsin1 (Synaptic Systems: 106103); Tbr-1 (Abcam: ab31940); TRA-1-81 (Stemgent: 09-0069); and Tuj-1 (Covance: MMS-435P).
For quantifying numbers of cells expressing specific neuronal markers, neurospheres were dissociated into single cells using Accutase and plated at a density of 20,000–40,000 cells per cm2 onto poly-L-ornithine/laminin-coated (Sigma-Aldrich) 12 mm glass coverslips (Bellco Glass).
qRT-PCR.
Neuronal cultures were washed with D-PBS, and total RNA was extracted using Trizol reagent (Invitrogen), according to the manufacturer's instructions. To evaluate gene expression, 100 ng of total RNA was used to generate cDNA using Bio-Rad iScript supermix (Bio-Rad) on a C1000 Thermal Cycler (Bio-Rad). qPCR was performed on 1 ng cDNA/per reaction using a Bio-Rad CFX96 machine and SsoAdvanced SYBR Green supermix (Bio-Rad). GAPDH was used as an internal control, and DNA oligonucleotides were purchased from QIAGEN, GeneGlobe, or Integrated DNA Technologies. For sequences, see Table 1. Relative quantifications were calculated using the 2−ΔΔCT method.
Table 1.
Human primer sequences
| Gene | Forward primer | Reverse primer | Entrez gene ID |
|---|---|---|---|
| Bassoon | CCCCACATCACCCTACTCC | GACGTGAGGTCCGAAGTCT | 8927 |
| CTIP2 | CAGAGCAGCAAGCTCACG | GGTGCTGTAGACGCTGAAGG | 64919 |
| CUX1 | TGCAAAGGCCGACGAGATT | GGTCTCCGCCTCTCTCTGAG | 1523 |
| GAPDH | QIAGEN, GeneGlobe catalog #QT01192646 | 2597 | |
| HRAS | CAGATCAAACGGGTGAAGGAC | GCCTGCCGAGATTCCACAG | 3265 |
| MAP2 | QIAGEN, GeneGlobe catalog #QT00057358 | 4133 | |
| MKI67 | QIAGEN, GeneGlobe catalog #QT00014203 | 4288 | |
| NLGN3 | ACAGTGGTGCTAAACCCGTC | ATTGCCATAACTGGCGAGGAT | 54413 |
| NLGN4 | GGTTTACCGCCAATTTGGATACT | CCGTGGGCACGTAGATGTT | 57502 |
| NXN1 | TAAGTGGCCTCCTAATGACCG | TCGCACCAATACGGCTTCTTT | 9378 |
| PAX6 | QIAGEN, GeneGlobe catalog #QT00071169 | 5080 | |
| RB | QIAGEN, GeneGlobe catalog #QT00066899 | 4772 | |
| SHANK2 | CTTTGGATTCGTGCTTCGAGG | GACTCCAGGTACTGTAGGGC | 22941 |
| SHANK3 | GTCCTGCTCTTCCGTGGAG | TGGGTCTTGATAACCTCTGCAA | 85358 |
| TBR1 | ACAATTTTCCTGACTCCAAGGAC | ACTGTGACGAAGCTCAGAGAC | 10716 |
| TBR2 | GTGCCCACGTCTACCTGTG | CCTGCCCTGTTTCGTAATGAT | 8320 |
| TUJ1 | QIAGEN, GeneGlobe catalog #QT00083713 | 10381 | |
Mice.
All experiments involving mice were conducted in accordance with protocols approved by the University of California, San Francisco Institutional Animal Care and Use Committee. FR-HRASG12V mice were generated by James Fagin's laboratory (Chen et al., 2009) and were bred and genotyped as previously described. Briefly, they used a “flox and replace” gene targeting system to obtain a Cre recombinase-dependent switch of expression of WT Hras by an HrasG12V allele under the regulatory control of its own gene promoter. The targeted locus consists of two tandemly arrayed Hras genes, with the upstream WT copy flanked by loxP sites, so that the mutant allele is not expressed unless the WT copy is excised. FR-HRASG12V mice were crossed with Caggs-Cre mice to obtain widespread activation of the oncogene. More than 80% of CC/FR-HRASG12V pups die within 14 d after birth (Chen et al., 2009). The cause of death could not be determined at necropsy, and there were no abnormalities in the gross or microscopic appearance of the heart muscle, valves, or lungs, or evidence of bleeding. The biggest issue with mutant mice appears to result from cannibalization by the doe. This transgenic mouse is a robust model for the CS phenotype and genetically mimics the human condition, with one activating allele. Although the common mutation affecting ∼80% of CS patients is the G12S mutation, there are patients with CS that have the G12V mutation, but this occurs more rarely.
Anatomy, immunohistochemistry, and cellular analysis.
E14.5, E18.5, and P7 brains were fixed in 4% PFA in 1× PBS at 4°C overnight and cryoprotected in 30% sucrose solution in 1× PBS. Brains were frozen in 2:1 solution of 30% sucrose in OCT; 10 μm cryostat sections were taken and rehydrated in PBS. Antigen retrieval was performed using antigen unmasking solution (Vector Laboratories) for 10 min at 95°C. Sections were then blocked with 10% goat serum for 1 h at room temperature with 0.1% Triton X-100 in PBS. Slides were incubated with primary antibodies overnight at 4°C overnight, washed, and incubated with appropriate secondary antibodies for 1–2 h at room temperature. DNA was stained with DAPI for 5 min (Invitrogen).
The FD Rapid Golgi stain Kit (FD Neurotechnologies) was used for staining neurons in P7/P8 unfixed brains using the Golgi method; 100 μm cryostat sections were taken and placed on gelatin-coated slides.
All images were acquired blind to condition and geneotype and with the same acquisition parameters using a Zeiss (Imager.M1) fluorescent microscope, and measurements were taken in the frontal cortex corresponding with bregma 1.94 mm based on anatomical landmarks. N = 5 animals were counted in WT and FR-HRASG12V groups, each N representing the average count in three anatomically appropriate sections of an animal. Laminar cell density, neurite length, soma size, cortical thickness, and corpus callosum thickness were all measured using ImageJ software and ImageJ Fiji Software (National Institutes of Health).
Electrophysiology.
Whole-cell patch-clamp electrophysiological recordings were performed using a MultiClamp 700A amplifier (Molecular Devices) on 40- to 60-day old neurons grown on glass coverslips coated with polyornithine/laminin. Coverslips were rinsed once in PBS and then transferred to a submerged bath recording chamber with recording buffer containing the following (in mm): 135 NaCl, 2.5 KCl, 2 CaCl2, 2 MgSO4, 10 glucose, and 10 HEPES, pH adjusted to 7.37. Whole-cell voltage-clamp recordings were made at −70 mV using glass capillaries pulled to a resistance of 2.5–3.5 mΩ, when loaded with internal solution containing the following (in mm): 130 Cs-Gluconate, 8 CsCl, 10 HEPES, 4 EGTA, 4 Na2+-ATP, and 0.3 Na+-GTP, pH 7.2, osmolarity adjusted to 290 mOsm with sucrose. Whole-cell capacitances of neurons were measured by calculating the integral of the current response to a 3 mV voltage step. EPSCs were pharmacologically isolated by bath application of the GABA-A receptor antagonist bicuculline methiodide (10 μm, Tocris Bioscience). Data were acquired at 10 kHz using pClamp 10.2 (Molecular Devices) and filtered at 2 kHz. Synaptic events were identified and analyzed offline using Mini Analysis (Synaptosoft).
Results
Mouse model of Ras hyperactivation reveals elevated density of neurons in specific cortical layers
To assess the consequences of abnormal Ras signaling on the developing brain, we examined cortical lamination and neuronal morphology in a HrasG12V mouse model of elevated Ras signaling. HrasG12V is a weak hypermorph (compared with Nras or Hras alleles with codon 12 variations) and thus is an appropriate model for comparison to the HRASG12S human cell lines used in our studies below. We examined the number of neurons per cortical area in the E14.5 mouse brain (mid-neurogenesis), but we found no differences between WT and HrasG12V mice at this point in development (data not shown). We next assessed the E18.5 brain, directly after the end of mouse neurogenesis. Immunohistochemical analysis of layer-specific markers in coronal sections of E18.5 WT and HrasG12V mice revealed a significant increase in the number of CUX1+ (layers II-III), SATB2+ (layers II-V), and TBR1+ (layers V/VI) neurons per cortical area, whereas CTIP2+ (layer V) expression remained unchanged (Fig. 1a–e). Immunohistochemical analysis of PAX6+ progenitors surrounding the lateral ventricles was also quantified, revealing a trend toward elevated progenitor numbers in the E18.5 HrasG12V mouse brain (Fig. 1f,g). Further characterization of the E18.5 brain (including brain weight, cortical thickness, and corpus callosum thickness) revealed no significant differences between WT and HrasG12V mice (data not shown).
Figure 1.
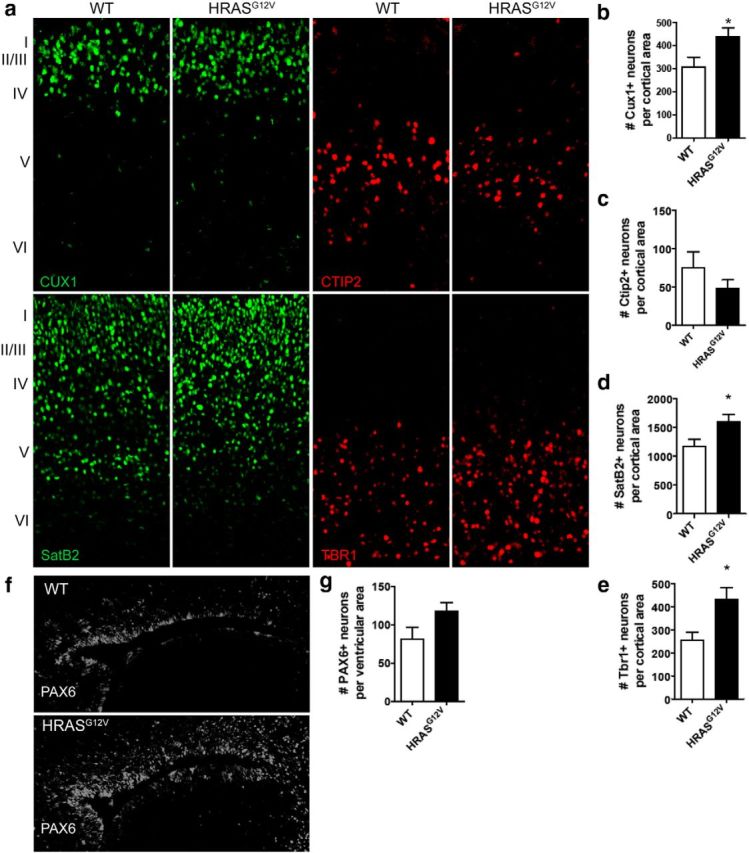
E18.5 mouse model of Ras hyperactivation reveals aberrant cortical lamination. a–e, Immunohistochemical analysis of coronal brain sections of WT and HRASG12V E18.5 mice. Immunohistochemical analysis of layer-specific markers used to quantify neuronal cells per cortical area: Cux1, layers II-III (green) (a, b); Ctip2, layer V motor neurons (red) (a, c); SatB2, layers II-V callosal projection neurons (green) (a, d); and Tbr1, layers V/VI (red) (a, e). f, g, Immunohistochemical analysis of PAX6 expression around the lateral ventricles in WT and HRASG12V E18.5 mouse. a–g, WT, n = 5; HRASG12V, n = 4. Data are mean ± SEM. *p < 0.05 (nonparametric Kruskal–Wallis test).
To assess whether these laminar changes persist into the postnatal mouse, we examined the HrasG12V cortex at P7. Immunohistochemical analysis revealed a significant increase in the number of SATB2+ (layers II-V), CTIP2+ (layer V), and TBR1+ (layers V/VI) neurons per cortical area (Fig. 2a–d). Golgi staining at P7 enabled morphological analysis of pyramidal neurons in WT and HrasG12V mouse brains (Fig. 2e). Measurement of total neurite length/neuron revealed significantly reduced neurite extension in HrasG12V mice, consistent with human in vitro data (see Fig. 4 g). In addition, soma size was significantly increased in HrasG12V mouse brains (Fig. 2g). Further characterization of the P7 brain revealed no significant differences in brain weight or cortical thickness between WT and HrasG12V mice, with a significant reduction in corpus callosum thickness observed (data not shown). By examining the developing HrasG12V mouse brain, we uncovered several cortical phenotypes, including an extended progenitor phase and altered neuronal morphology.
Figure 2.

P7 mouse model of Ras hyperactivation reveals aberrant cortical lamination and cortical neuronal morphology. a–d, Immunohistochemical analysis of coronal brain sections of WT and HRASG12V P7 mice. Immunohistochemical analysis of layer-specific markers used to quantify neuronal cells per cortical area: SatB2, layers II-V callosal projection neurons (green) (a, b); Ctip2, layer V motor neurons (red) (a, c); and Tbr1, layers V/VI (red) (a, d). a–d, WT, n = 5; HRASG12V, n = 5. Data are mean ± SEM. *p < 0.05 (nonparametric Kruskal–Wallis test). e–g, Morphological analysis of WT and HRASG12V P7 cortical mouse neurons. Golgi staining of cortical pyramidal neurons in coronal brain sections of WT and HRASG12V P7 mice (e). ImageJ analysis of total neurite length per neuron in WT and HRASG12V P7 neurons (f). ImageJ analysis of soma size in WT and HRASG12V P7 neurons (g). f, g, WT, n = 36 neurons; HRASG12V, n = 20 neurons. Data are mean ± SEM. *p < 0.05 (nonparametric Kruskal–Wallis test).
Figure 4.

CS-derived neurons exhibit morphological alterations. a–d, Morphological analysis of embryoid body and rosette formation. Embryoid body (a, b) and rosette (c, d) formation in control and CS populations. e–i, Morphological analysis of control- and CS-derived neurons. Fluorescent microscopy analysis of GFP-labeled control-derived (e) and CS-derived (f) neurons. ImageJ analysis of total neurite length per neuron in control- and CS-derived neurons (g). Sholl analysis of the number of intersecting neurites relative to the cell soma in control- and CS-derived neurons (h). ImageJ analysis of soma size in control- and CS-derived neurons (i). Data are mean ± SEM. n = 40 neurons per patient group (at 4 patients per group). *p < 0.05 (t test). j, Cell density as calculated from DAPI immunostaining in control- and CS-derived neurons. k, Fold changes in HRAS mRNA levels in CS cells relative to control cells at each developmental stage. Data are mean ± SEM. *p < 0.05 (t test). n = 4 patients per group for all analyses.
CS-derived fibroblasts and iPS cells exhibit characteristics consistent with aberrant Ras signaling
We next modeled aberrant Ras signaling in humans using an iPS cell platform. Ras signaling was assessed in skin fibroblasts derived from CS patients compared with healthy controls (Fig. 3a,b). Because elevated proliferation is a functional consequence of elevated Ras signaling (Hinek et al., 2000, 2004; Tatano et al., 2006; Sen et al., 2011), we investigated the growth rate of CS-derived cells compared with control-derived cells. BrdU pulse (Fig. 3c–e) and doubling time (Fig. 3f) assays revealed significantly elevated rates of proliferation in CS fibroblasts. There are a number of downstream targets of Ras signaling, including MKI67 and RB, which can, in turn, regulate cellular proliferation (Lee et al., 1999; Sen et al., 2011). qRT-PCR analysis of these downstream targets demonstrated significant elevation of both MKI67 and RB mRNA levels (Fig. 3g). Western blot analysis of GTP-bound HRAS confirmed 2.6-fold increased expression levels of the activated protein in CS-derived fibroblasts compared with control and normalized to α-tubulin (Fig. 3h).
Figure 3.
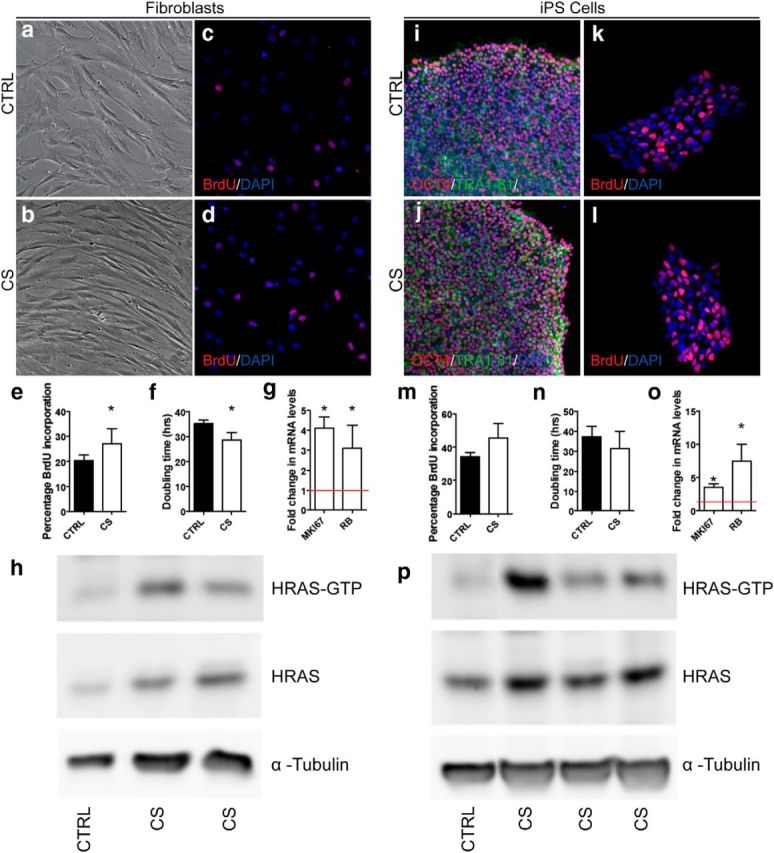
CS-derived fibroblasts and iPS cells exhibit aberrant Ras signaling. a–f, Proliferation rates in control and CS fibroblasts. Control (a, c) and CS (b, d) fibroblasts were assayed for BrdU inclusion (c–e) and doubling time (f). Data are mean ± SEM. *p < 0.05 (t test). g, Fold changes in mki67 and RB mRNA levels in CS fibroblasts relative to control fibroblasts (red line). Data are mean ± SEM. *p < 0.05 (t test). h, Total baseline HRAS-GTP levels in serum-starved fibroblasts reveals elevated levels in CS cells. Levels are normalized to HRAS in control lines. i, j Immunostaining of pluripotent markers OCT4 and TRA-1–81 in control (i) and CS (j) iPS cells. k–n, Proliferation rates in control and CS iPS cells. Control (k) and CS (l) iPS cells were assayed for BrdU inclusion (k, l, m) and doubling time (n). Data are mean ± SEM. o, Fold changes in mki67 and RB mRNA levels in CS iPS cells relative to control iPS cells (red line). Data are mean ± SEM. *p < 0.05 (t test). n = 4 patients per group for all analyses. p, Total baseline HRAS-GTP levels in iPS cells reveals elevated levels in CS cells. Levels are normalized to HRAS in control lines.
Upon reprogramming, iPS cells expressed the pluripotent markers OCT4 and TRA-1-81 (Fig. 3i,j), induced teratoma formation when injected into SCID mice, and were karyotypically normal (data not shown). BrdU pulse (Fig. 3k–m) and doubling time (Fig. 3n) assays only showed a trend toward elevation in CS lines. This is likely due to the iPS cell culture conditions, which requires the presence of basic fibroblast growth factor (a known stimulator of the Ras signaling pathway) to prevent spontaneous differentiation. However, examination of MKI67 and RB mRNA levels by qRT-PCR still showed significant elevation of these Ras downstream targets in CS lines (Fig. 3o). Western blot analysis of GTP-bound HRAS confirmed 1.6-fold increased expression levels of the activated protein in CS-derived iPS cells compared with control and normalized to α-tubulin (Fig. 3p).
CS-derived neurons exhibit morphological alterations
We differentiated the iPS cell lines into neuronal precursor cells (NPCs) and neurons using well-validated conditions that favor the generation of excitatory cortical neurons (Zhang et al., 2001). This differentiation process involves the early formation of embryoid bodies (Fig. 4a,b), followed by the signature “neural tube-like” rosette structure (Fig. 4c,d), both of which appeared morphologically normal in CS compared with control lines. CS NPCs demonstrated a trend toward an increased rate of proliferation, with a doubling time of 32.53 ± 4.49 h compared with 52.12 ± 10.13 h of CTRL-derived NPCs (p = 0.2). eGFP-expressing neurons derived from control and CS iPS cells were fixed 9 d after electroporation for morphological analysis of neurite outgrowth and soma size (Fig. 4e,f). Measurement of total neurite length/neuron revealed significantly reduced neurite extension in CS populations (Fig. 4g). Sholl analysis showed that this difference in neurite extension was more pronounced further away from the cell soma, indicating reduced axonal extension in CS populations (Fig. 4h). Furthermore, soma size was significantly increased in CS-derived neurons (Fig. 4i). Differences in cell plating density were ruled out as a contributing factor (Fig. 4j). Because elevated Ras levels have previously been associated with increased neurite outgrowth in neurons (Arendt et al., 2004; Gärtner et al., 2004a,b), we asked whether HRAS was still expressed in CS-derived lines as one progressed from a fibroblast cell, to an iPS cell, to a neuroepithelial cell, to a neuron. We demonstrated a significant upregulation of HRAS mRNA levels by qRT-PCR in CS-derived NE and neurons compared with control NE and neurons, respectively (Fig. 4k). This is likely the result of elevated numbers of progenitor cells produced in CS populations (see below), which are still proliferating and expressing HRAS.
CS-derived cultures contain elevated numbers of layer-specific neurons coupled with an extended progenitor phase
We next sought to determine the cortical layer identity of the neurons produced from these iPS cell lines, by examining the expression of layer-specific markers using immunocytochemistry (ICC) and qRT-PCR analysis of neuronal populations at day 32 of differentiation. ICC analysis revealed that CS cells consistently produced higher numbers of TBR1+ (layer VI) and CTIP2+ (layer V) cells compared with control populations (Fig. 5a–d,g). This was consistent with qRT-PCR analyses of mRNA levels of each of these layer-specific markers with a 10-, 11-, and 5-fold increase in TBR1, CTIP2, and CUX1 in CS-derived populations, respectively (Fig. 5i). Interestingly, ICC analysis showed continued expression of PAX6+ cells (a neural progenitor marker) in CS-derived populations (Fig. 5e,f,h). PAX6 expression was localized to MAP2-negative cells, suggesting a prolonged progenitor phase in some CS cells, rather than an inability of CS cells to turn off PAX6 expression when terminally differentiating. While we have not observed astrocytes at these early differentiation time points at ∼4 weeks (Krencik et al., 2015), it is possible that some of these remaining precursors could become prematurely gliogenic as we recently reported (Krencik et al., 2015). ICC analysis of Ki67 also revealed a consistent increase in the percentage of CS cells expressing this proliferative marker (CTRL = 5.66 ± 0.32%; CS = 12.66 ± 0.62%; p ≤ 0. 01). To evaluate the number of cells exiting the cell cycle after inducing neural differentiation of NPCs, we performed BrdU incorporation followed by Ki67 double staining. We found that the number of BrdU-positive cells that did not express Ki67 was significantly lower in the CS populations compared with the CTRL population, confirming a lower number of cells exiting the cell cycle in the CS populations and thereby an extended progenitor phase (CTRL = 44.86 ± 3.07%; CS = 23.10 ± 7.32%; p ≤ 0. 03). qRT-PCR analyses of mRNA levels revealed that PAX6 and TBR2 levels were significantly increased 8- to 10-fold in CS populations, with continued upregulation of MKI67 and RB (Fig. 5i).
Figure 5.

CS-derived neuronal populations express elevated levels of laminar specific markers and persistent expression of PAX6 progenitors. a–h, Immunostaining of TBR1, CTIP2, and PAX6 expression in TUJ1+ and MAP2+ neurons at day 32 of differentiation. g, Fraction of neurons (TUJ1+) expressing lower layer markers TBR1 (layer V) and CTIP2 (layer V). h, Fraction of cells expressing PAX6. i, Fold changes in TBR1, CTIP2, CUX1, PAX6, TBR2, mki67, and RB mRNA levels in CS-derived relative to control-derived (red line) neuronal cultures. Data are mean ± SEM. *p < 0.05 (t test). j, k, Immunostaining of Synapsin1+ puncta on TUJ1+ control- and CS-derived neurons at day 67 of differentiation. l, Quantification of Synapsin1+ puncta per 50 μm neurite length in control- and CS-derived neurons. Data are mean ± SEM. *p < 0.05 (t test). n = 4 patients per group for all analyses. m, Fold changes in NXN1, SHANK2, SHANK3, NLGN3, and NLGN4 mRNA levels in CS-derived relative to control-derived (red line) neuronal cultures. Data are mean ± SEM. *p < 0.05 (t test).
To examine the functional characteristics of CS-derived neurons, cells were matured a further 3–4 weeks after differentiating. ICC analysis of the presynaptic marker Synapsin1 revealed increased number of puncta per 50 μm neurite length in CS populations (Fig. 5j–l). qRT-PCR analysis of these neuronal populations revealed significantly increased mRNA expression of synaptic markers NXN1, SHANK2, SHANK3, NLGN3, and NLGN4, consistent with the observed increase in Synapsin1 puncta (Fig. 5m).
To assess whether any of these differences resulted from increased apoptosis, populations were stained for activated Caspase-3, the expression of which was not significantly different between both populations (CTRL = 5.29 ± 1.45%; CS = 6.58 ± 2.13%; p ≤ 0.30).
For electrophysiological studies, cells were matured a further 40–60 d after differentiating. We measured spontaneous EPSCs between day 40–60 neurons. Capacitance was significantly increased in CS-derived neurons compared with control-derived neurons (CTRL = 23.66 ± 1.39 pF, n = 7 cells; CS = 35.18 ± 3.39 pF, n = 6 cells; p ≤ 0.01). Increased capacitance in CS-derived neurons may be explained by the larger soma size exhibited in CS-derived populations. Despite observing an increase in Synapsin1+ puncta by ICC analysis, we observed no significant increase in the number of events measured in CS-derived versus control-derived neurons. However, at the early time points recorded, we observed a small fraction of cells showing synaptic events (CTRL = 14.29 ± 14.29%, n = 7 cells; CS = 33.33 ± 26.97%, n = 6 cells; p = 0.3, Fig. 6). This observation, along with our previous finding of a significant increase in mIPSC amplitude in the Blbp-Cre;FR-HRASG12V cortex (Krencik et al., 2015), suggests that, in the absence of a high density of astrocytes, human neurons require longer periods to reach synaptic maturity in in vitro culture conditions, consistent with other observations (Niu et al., 2013).
Figure 6.

Electrophysiological properties of Costello iPS cell-derived neurons. A, Representative 3 s recording trace of spontaneous EPSCs recorded from iPS cell-derived human neuron. Calibration: 20 pA, 200 ms. Currents were completely blocked by the AMPA receptor antagonist DNQX mean EPSC event, averaged from >50 isolated. B–E, Summary graphs of EPSC parameters from control (N = 6) and HRAS (N = 9) cells. Each circle represents the mean response from individual neurons. The event amplitude (pA) (B), activation kinetics (time from 10% to 90% of peak, ms) (C), decay (event half-width, ms) (D), and event frequency (Hz) (E) were not statistically different between control and mutant neurons.
Discussion
By examining the neurodevelopmental consequences of aberrant Ras signaling in the developing mouse brain, we uncovered several critical phenotypes, including increased production of cortical neurons and morphological deficits. To determine whether these phenotypes are recapitulated in humans, we modeled cortical development using an iPS cell platform. Using neuronal differentiation of pluripotent stem cells (Zhang et al., 2001), we uncovered consistent cellular and developmental pathologies resulting from Ras signaling dysregulation in humans. By generating and analyzing human neurons carrying HRASG12S point mutations, we showed that cells derived from CS patients have an extended progenitor phase and subsequent increased production of cortical neurons. Morphological analysis of CS-derived neurons revealed increased soma size and reduced neurite outgrowth. Analyses of functional markers of matured CS-derived neurons revealed increased numbers of Synapsin1+ puncta per unit area and elevated mRNA expression of genes associated with synaptogenesis, pointing toward altered excitability of these populations.
Human neurons derived from CS patients were developmentally impaired, exhibiting an extended progenitor phase and elevated production of layer-specific neurons compared with healthy control donors. Interestingly, macrocephaly is a characteristic feature of CS (Waldburg et al., 2004; Smith et al., 2009; Gripp et al., 2010), and a predisposition to neoplasia, including neuroblastomas, exists in CS patients (Gripp, 2005). Consistent with our findings, enhanced signaling through ERK, a downstream target of Ras, leads to increased numbers of cortical neurons due to stimulation of neural progenitor proliferation (Thomson et al., 2007; Phoenix and Temple, 2010). Conversely, expression of HrasG12V and HrasG12S mutations in cortical progenitors in culture and in vivo by in utero electroporation promote astrogenesis at the expense of neurogenesis (Paquin et al., 2009). These conflicting findings may reflect developmental variance resulting from expression of the mutant alleles in committed progenitor cells or during mid-neurogenesis (E13/E14). Our in vitro findings were consistent with our mouse model of elevated Ras signaling, where elevated numbers of layer-specific cells were observed in the E18.5 cortex, just after neurogenesis ends, and P7 cortex.
Morphological analysis of our in vivo HrasG12V-derived mouse and in vitro CS-derived human neurons revealed a significant increase in soma size, a finding consistent with previous observations of cells overexpressing activated Ras (Heumann et al., 2000; Yang and Mattingly, 2006). While it is well accepted that cells enlarge if metabolic or transcriptional demands are increased, the functional consequences of neuronal hypertrophy remain unclear. Neurons may enlarge if they have undergone abnormal early stage migration or differentiation (Barth, 1987; McConnell, 1989; Vinters et al., 1993). Because a relative constancy in synaptic density appears to be maintained across the growing surface of most neurons (Smit et al., 2001), neocortical cells that increase their perikaryal surface area could also increase synaptic inputs during development, thereby rendering CS-derived neurons more excitable. Indeed, elevated expression of synaptic and activity-dependent functional markers in CS-derived neurons supports this hypothesis, pointing toward the potential for altered excitability of the fully differentiated population.
Our studies also revealed aberrant neurite outgrowth in both the mouse and human models of elevated Ras signaling, with a significant decrease in neurite length observed. This is contrary to previous studies that demonstrate increased dendritic size and complexity in postmitotic neurons overexpressing Ras (Arendt et al., 2004; Gärtner et al., 2004a; Kumar et al., 2005). The disparity between our findings and those reported may reflect differential effects of elevated Ras during development. It also suggests that timing is important to understand the mechanistic role of Ras in neurodevelopment. Whereas our studies use cells that constitutively express the HRAS mutant gene throughout the differentiation process, those cells analyzed by other researchers only expressed the transgenic V12-Ha-Ras postnatally or postmitotically. Furthermore, the decrease in neurite length that we observe in our cultures appears to result from decreased axonal extension rather than dendritic extension (as implied by Sholl analyses). It is also worth noting that our cultures of CS-derived neurons also contain glial cells and progenitors, reflecting a mixed environment that is more physiologically relevant to development of the cells in vivo.
Our recent publication examined the impact of hyperactivated HRAS on human iPS cell-derived and mouse-derived astrocyte populations. We demonstrated that CS-derived astrocyte progenitor cells proliferate more rapidly, whereas the terminally differentiated CS-derived astrocytes exhibit morphological hypertrophy and increased branching (Krencik et al., 2015). Hyperactivated HRAS was also shown to accelerate astrocyte maturation, as well as accelerating the maturation of cortical interneurons in vivo. This early Ras-specific maturation resulted in a significant increase in miniature IPSC amplitude in the somatosensory HrasG12V cortex, a finding that is consistent with the elevated expression of synaptogenesis markers observed in our CS-derived neuronal cultures.
Because increasing evidence implicates Ras signaling dysfunction as a major contributor in the development of neurodevelopmental and psychiatric disorders, such as autism and schizophrenia (Levitt and Campbell, 2009; Pinto et al., 2010; Stornetta and Zhu, 2011; Adviento et al., 2014; Network and Pathway Analysis Subgroup of Psychiatric Genomics, 2015), it may become a very important clinical target for the treatment of patient subpopulations shown to overexpress this critical protein. A number of therapeutic agents targeting Ras have already been identified, such as farnesyltransferase inhibitors (Sebti and Hamilton, 2000), antisense oligonucleotides (Crooke, 2000), and kinase inhibitors (Sawyers, 2002). However, there remains a need for the identification of brain-penetrant molecules that can be used at efficacious doses while avoiding neurologic and ocular toxicities, which can occur in cancer patients (Rauen et al., 2011). Based on our rodent neurodevelopmental studies, it is clear that therapies aimed at crossing the placenta in the embryonic stages of development may be necessary to attenuate the downstream consequences of Ras mutations in the brain.
This study is among the first to reveal human neuronal pathogenesis resulting from abnormal Ras signaling and provides insights into how these phenotypic abnormalities likely contribute to neurodevelopmental disorders. We also demonstrate the synergy between mouse and human models, thereby validating the use of iPS cells as a platform to study underlying cellular pathologies resulting from signaling deficits. Recapitulating human cellular pathologies in vitro facilitates the future high throughput screening of potential therapeutic agents that may reverse phenotypic and behavioral deficits.
Footnotes
This work was supported by the Allen Distinguished Investigator Award, National Institutes of Health New Innovator Award 1DP2OD006507-01, National Institutes of Health MH 5R01MH099595, Research to Prevent Blindness Unrestricted Grant, National Institutes of Health NEI EY002162, Core Grant for Vision Research, and in part by National Institutes of Health/National Institute of Arthritis and Musculoskeletal and Skin Diseases 5RO1AR062165 to K.A.R., DP2 OD007449 to L.A.W., and SFARI Award 345471 to L.A.W. and E.M.U. We thank all of the participants in our study, their families, and the Costello Kids Network; Leila Mashouf for excellent technical assistance with some of the in vivo staining and data analysis; Dr. William Tidyman for expertise on the mouse models of Costello syndrome; Dr. Shinya Yamanaka and Dr. Yohei Hayashi for kindly sharing their control iPS cell lines; and Aditi Narayan for cryosectioning mouse cortex.
The authors declare no competing financial interests.
References
- Adviento B, Corbin IL, Widjaja F, Desachy G, Enrique N, Rosser T, Risi S, Marco EJ, Hendren RL, Bearden CE, Rauen KA, Weiss LA. Autism traits in the RASopathies. J Med Genet. 2014;51:10–20. doi: 10.1136/jmedgenet-2013-101951. [DOI] [PMC free article] [PubMed] [Google Scholar]
- Alfieri P, Piccini G, Caciolo C, Perrino F, Gambardella ML, Mallardi M, Cesarini L, Leoni C, Leone D, Fossati C, Selicorni A, Digilio MC, Tartaglia M, Mercuri E, Zampino G, Vicari S. Behavioral profile in RASopathies. Am J Med Genet A. 2014;164:934–942. doi: 10.1002/ajmg.a.36374. [DOI] [PubMed] [Google Scholar]
- Aoki Y, Niihori T, Kawame H, Kurosawa K, Ohashi H, Tanaka Y, Filocamo M, Kato K, Suzuki Y, Kure S, Matsubara Y. Germline mutations in HRAS proto-oncogene cause Costello syndrome. Nat Genet. 2005;37:1038–1040. doi: 10.1038/ng1641. [DOI] [PubMed] [Google Scholar]
- Arendt T, Gärtner U, Seeger G, Barmashenko G, Palm K, Mittmann T, Yan L, Hümmeke M, Behrbohm J, Brückner MK, Holzer M, Wahle P, Heumann R. Neuronal activation of Ras regulates synaptic connectivity. Eur J Neurosci. 2004;19:2953–2966. doi: 10.1111/j.0953-816X.2004.03409.x. [DOI] [PubMed] [Google Scholar]
- Barth PG. Disorders of neuronal migration. Can J Neurol Sci. 1987;14:1–16. doi: 10.1017/s031716710002610x. [DOI] [PubMed] [Google Scholar]
- Brennand KJ, Simone A, Jou J, Gelboin-Burkhart C, Tran N, Sangar S, Li Y, Mu Y, Chen G, Yu D, McCarthy S, Sebat J, Gage FH. Modelling schizophrenia using human induced pluripotent stem cells. Nature. 2011;473:221–225. doi: 10.1038/nature09915. [DOI] [PMC free article] [PubMed] [Google Scholar]
- Chen X, Mitsutake N, LaPerle K, Akeno N, Zanzonico P, Longo VA, Mitsutake S, Kimura ET, Geiger H, Santos E, Wendel HG, Franco A, Knauf JA, Fagin JA. Endogenous expression of Hras(G12V) induces developmental defects and neoplasms with copy number imbalances of the oncogene. Proc Natl Acad Sci U S A. 2009;106:7979–7984. doi: 10.1073/pnas.0900343106. [DOI] [PMC free article] [PubMed] [Google Scholar]
- Chow ML, Pramparo T, Winn ME, Barnes CC, Li HR, Weiss L, Fan JB, Murray S, April C, Belinson H, Fu XD, Wynshaw-Boris A, Schork NJ, Courchesne E. Age-dependent brain gene expression and copy number anomalies in autism suggest distinct pathological processes at young versus mature ages. PLoS Genet. 2012;8:e1002592. doi: 10.1371/journal.pgen.1002592. [DOI] [PMC free article] [PubMed] [Google Scholar]
- Comings DE, Wu S, Chiu C, Muhleman D, Sverd J. Studies of the c-Harvey-Ras gene in psychiatric disorders. Psychiatry Res. 1996;63:25–32. doi: 10.1016/0165-1781(96)02829-6. [DOI] [PubMed] [Google Scholar]
- Crooke ST. Potential roles of antisense technology in cancer chemotherapy. Oncogene. 2000;19:6651–6659. doi: 10.1038/sj.onc.1204093. [DOI] [PubMed] [Google Scholar]
- Delrue MA, Chateil JF, Arveiler B, Lacombe D. Costello syndrome and neurological abnormalities. Am J Med Genet A. 2003;123A:301–305. doi: 10.1002/ajmg.a.20330. [DOI] [PubMed] [Google Scholar]
- Downward J. Targeting RAS signalling pathways in cancer therapy. Nat Rev Cancer. 2003;3:11–22. doi: 10.1038/nrc969. [DOI] [PubMed] [Google Scholar]
- Ebert AD, Yu J, Rose FF, Jr, Mattis VB, Lorson CL, Thomson JA, Svendsen CN. Induced pluripotent stem cells from a spinal muscular atrophy patient. Nature. 2009;457:277–280. doi: 10.1038/nature07677. [DOI] [PMC free article] [PubMed] [Google Scholar]
- Gärtner U, Alpár A, Seeger G, Heumann R, Arendt T. Enhanced Ras activity in pyramidal neurons induces cellular hypertrophy and changes in afferent and intrinsic connectivity in synRas mice. Int J Dev Neurosci. 2004a;22:165–173. doi: 10.1016/j.ijdevneu.2004.02.001. [DOI] [PubMed] [Google Scholar]
- Gärtner U, Alpár A, Reimann F, Seeger G, Heumann R, Arendt T. Constitutive Ras activity induces hippocampal hypertrophy and remodeling of pyramidal neurons in synRas mice. J Neurosci Res. 2004b;77:630–641. doi: 10.1002/jnr.20194. [DOI] [PubMed] [Google Scholar]
- Gripp KW. Tumor predisposition in Costello syndrome. Am J Med Genet C Semin Med Genet. 2005;137C:72–77. doi: 10.1002/ajmg.c.30065. [DOI] [PubMed] [Google Scholar]
- Gripp KW, Innes AM, Axelrad ME, Gillan TL, Parboosingh JS, Davies C, Leonard NJ, Lapointe M, Doyle D, Catalano S, Nicholson L, Stabley DL, Sol-Church K. Costello syndrome associated with novel germline HRAS mutations: an attenuated phenotype? Am J Med Genet A. 2008;146A:683–690. doi: 10.1002/ajmg.a.32227. [DOI] [PubMed] [Google Scholar]
- Gripp KW, Hopkins E, Doyle D, Dobyns WB. High incidence of progressive postnatal cerebellar enlargement in Costello syndrome: brain overgrowth associated with HRAS mutations as the likely cause of structural brain and spinal cord abnormalities. Am J Med Genet A. 2010;152A:1161–1168. doi: 10.1002/ajmg.a.33391. [DOI] [PMC free article] [PubMed] [Google Scholar]
- Heumann R, Goemans C, Bartsch D, Lingenhöhl K, Waldmeier PC, Hengerer B, Allegrini PR, Schellander K, Wagner EF, Arendt T, Kamdem RH, Obst-Pernberg K, Narz F, Wahle P, Berns H. Transgenic activation of Ras in neurons promotes hypertrophy and protects from lesion-induced degeneration. J Cell Biol. 2000;151:1537–1548. doi: 10.1083/jcb.151.7.1537. [DOI] [PMC free article] [PubMed] [Google Scholar]
- Hinek A, Smith AC, Cutiongco EM, Callahan JW, Gripp KW, Weksberg R. Decreased elastin deposition and high proliferation of fibroblasts from Costello syndrome are related to functional deficiency in the 67-kD elastin-binding protein. Am J Hum Genet. 2000;66:859–872. doi: 10.1086/302829. [DOI] [PMC free article] [PubMed] [Google Scholar]
- Hinek A, Braun KR, Liu K, Wang Y, Wight TN. Retrovirally mediated overexpression of versican v3 reverses impaired elastogenesis and heightened proliferation exhibited by fibroblasts from Costello syndrome and Hurler disease patients. Am J Pathol. 2004;164:119–131. doi: 10.1016/S0002-9440(10)63103-3. [DOI] [PMC free article] [PubMed] [Google Scholar]
- Jin ZB, Okamoto S, Osakada F, Homma K, Assawachananont J, Hirami Y, Iwata T, Takahashi M. Modeling retinal degeneration using patient-specific induced pluripotent stem cells. PLoS One. 2011;6:e17084. doi: 10.1371/journal.pone.0017084. [DOI] [PMC free article] [PubMed] [Google Scholar]
- Krencik R, Hokanson KC, Narayan AR, Dvornik J, Rooney GE, Rauen KA, Weiss LA, Rowitch DH, Ullian EM. Dysregulation of astrocyte extracellular signaling in Costello syndrome. Science Transl Med. 2015;7:286ra266. doi: 10.1126/scitranslmed.aaa5645. [DOI] [PMC free article] [PubMed] [Google Scholar]
- Kumar V, Zhang MX, Swank MW, Kunz J, Wu GY. Regulation of dendritic morphogenesis by Ras-PI3K-Akt-mTOR and Ras-MAPK signaling pathways. J Neurosci. 2005;25:11288–11299. doi: 10.1523/JNEUROSCI.2284-05.2005. [DOI] [PMC free article] [PubMed] [Google Scholar]
- Lee G, Papapetrou EP, Kim H, Chambers SM, Tomishima MJ, Fasano CA, Ganat YM, Menon J, Shimizu F, Viale A, Tabar V, Sadelain M, Studer L. Modelling pathogenesis and treatment of familial dysautonomia using patient-specific iPSCs. Nature. 2009;461:402–406. doi: 10.1038/nature08320. [DOI] [PMC free article] [PubMed] [Google Scholar]
- Lee KY, Ladha MH, McMahon C, Ewen ME. The retinoblastoma protein is linked to the activation of Ras. Mol Cell Biol. 1999;19:7724–7732. doi: 10.1128/MCB.19.11.7724. [DOI] [PMC free article] [PubMed] [Google Scholar]
- Levitt P, Campbell DB. The genetic and neurobiologic compass points toward common signaling dysfunctions in autism spectrum disorders. J Clin Invest. 2009;119:747–754. doi: 10.1172/JCI37934. [DOI] [PMC free article] [PubMed] [Google Scholar]
- Marchetto MC, Carromeu C, Acab A, Yu D, Yeo GW, Mu Y, Chen G, Gage FH, Muotri AR. A model for neural development and treatment of Rett syndrome using human induced pluripotent stem cells. Cell. 2010;143:527–539. doi: 10.1016/j.cell.2010.10.016. [DOI] [PMC free article] [PubMed] [Google Scholar]
- McConnell SK. The determination of neuronal fate in the cerebral cortex. Trends Neurosci. 1989;12:342–349. doi: 10.1016/0166-2236(89)90041-6. [DOI] [PubMed] [Google Scholar]
- Network and Pathway Analysis Subgroup of Psychiatric Genomics. Psychiatric genome-wide association study analyses implicate neuronal, immune and histone pathways. Nat Neurosci. 2015;18:199–209. doi: 10.1038/nn.3922. [DOI] [PMC free article] [PubMed] [Google Scholar]
- Niu W, Zang T, Zou Y, Fang S, Smith DK, Bachoo R, Zhang CL. In vivo reprogramming of astrocytes to neuroblasts in the adult brain. Nat Cell Biol. 2013;15:1164–1175. doi: 10.1038/ncb2843. [DOI] [PMC free article] [PubMed] [Google Scholar]
- Okita K, Matsumura Y, Sato Y, Okada A, Morizane A, Okamoto S, Hong H, Nakagawa M, Tanabe K, Tezuka K, Shibata T, Kunisada T, Takahashi M, Takahashi J, Saji H, Yamanaka S. A more efficient method to generate integration-free human iPS cells. Nat Methods. 2011;8:409–412. doi: 10.1038/nmeth.1591. [DOI] [PubMed] [Google Scholar]
- Paquin A, Hordo C, Kaplan DR, Miller FD. Costello syndrome H-Ras alleles regulate cortical development. Dev Biol. 2009;330:440–451. doi: 10.1016/j.ydbio.2009.04.010. [DOI] [PubMed] [Google Scholar]
- Phoenix TN, Temple S. Spred1, a negative regulator of Ras-MAPK-ERK, is enriched in CNS germinal zones, dampens NSC proliferation, and maintains ventricular zone structure. Genes Dev. 2010;24:45–56. doi: 10.1101/gad.1839510. [DOI] [PMC free article] [PubMed] [Google Scholar]
- Pinto D, Pagnamenta AT, Klei L, Anney R, Merico D, Regan R, Conroy J, Magalhaes TR, Correia C, Abrahams BS, Almeida J, Bacchelli E, Bader GD, Bailey AJ, Baird G, Battaglia A, Berney T, Bolshakova N, Bölte S, Bolton PF, et al. Functional impact of global rare copy number variation in autism spectrum disorders. Nature. 2010;466:368–372. doi: 10.1038/nature09146. [DOI] [PMC free article] [PubMed] [Google Scholar]
- Rauen KA. HRAS and the Costello syndrome. Clin Genet. 2007;71:101–108. doi: 10.1111/j.1399-0004.2007.00743.x. [DOI] [PubMed] [Google Scholar]
- Rauen KA, Banerjee A, Bishop WR, Lauchle JO, McCormick F, McMahon M, Melese T, Munster PN, Nadaf S, Packer RJ, Sebolt-Leopold J, Viskochil DH. Costello and cardio-facio-cutaneous syndromes: moving toward clinical trials in RASopathies. Am J Med Genet C Semin Med Genet. 2011;157:136–146. doi: 10.1002/ajmg.c.30294. [DOI] [PMC free article] [PubMed] [Google Scholar]
- Sawyers CL. Rational therapeutic intervention in cancer: kinases as drug targets. Curr Opin Genet Dev. 2002;12:111–115. doi: 10.1016/S0959-437X(01)00273-8. [DOI] [PubMed] [Google Scholar]
- Sebti SM, Hamilton AD. Farnesyltransferase and geranylgeranyltransferase I inhibitors and cancer therapy: lessons from mechanism and bench-to-bedside translational studies. Oncogene. 2000;19:6584–6593. doi: 10.1038/sj.onc.1204146. [DOI] [PubMed] [Google Scholar]
- Sen S, Bunda S, Shi J, Wang A, Mitts TF, Hinek A. Retinoblastoma protein modulates the inverse relationship between cellular proliferation and elastogenesis. J Biol Chem. 2011;286:36580–36591. doi: 10.1074/jbc.M111.269944. [DOI] [PMC free article] [PubMed] [Google Scholar]
- Shi Y, Kirwan P, Smith J, Robinson HP, Livesey FJ. Human cerebral cortex development from pluripotent stem cells to functional excitatory synapses. Nat Neurosci. 2012;15:477–486. doi: 10.1038/nn.3041. [DOI] [PMC free article] [PubMed] [Google Scholar]
- Shields JM, Pruitt K, McFall A, Shaub A, Der CJ. Understanding Ras: ‘it ain't over ‘til it's over.’. Trends Cell Biol. 2000;10:147–154. doi: 10.1016/S0962-8924(00)01740-2. [DOI] [PubMed] [Google Scholar]
- Smit WA, Velzing EH, Diegenbach PC, Roberts BL. Changing synaptic connections on cell bodies of growing identified spinal motoneurons of the eel, Anguilla. Anat Embryol (Berl) 2001;203:129–136. doi: 10.1007/s004290000149. [DOI] [PubMed] [Google Scholar]
- Smith LP, Podraza J, Proud VK. Polyhydramnios, fetal overgrowth, and macrocephaly: prenatal ultrasound findings of Costello syndrome. Am J Med Genet A. 2009;149A:779–784. doi: 10.1002/ajmg.a.32778. [DOI] [PubMed] [Google Scholar]
- Stornetta RL, Zhu JJ. Ras and Rap signaling in synaptic plasticity and mental disorders. Neuroscientist. 2011;17:54–78. doi: 10.1177/1073858410365562. [DOI] [PMC free article] [PubMed] [Google Scholar]
- Tatano Y, Takahashi T, Tsuji D, Takeuchi N, Tsuta K, Takada G, Ohsawa M, Sakuraba H, Itoh K. Significant decrease in tropoelastin gene expression in fibroblasts from a Japanese Costello syndrome patient with impaired elastogenesis and enhanced proliferation. J Biochem. 2006;140:193–200. doi: 10.1093/jb/mvj146. [DOI] [PubMed] [Google Scholar]
- Thomson RE, Pellicano F, Iwata T. Fibroblast growth factor receptor 3 kinase domain mutation increases cortical progenitor proliferation via mitogen-activated protein kinase activation. J Neurochem. 2007;100:1565–1578. doi: 10.1111/j.1471-4159.2006.04285.x. [DOI] [PubMed] [Google Scholar]
- Villegas J, McPhaul M. Establishment and culture of human skin fibroblasts. Curr Protoc Mol Biol Chapter. 2005;28 doi: 10.1002/0471142727.mb2803s71. Unit 28.3. [DOI] [PubMed] [Google Scholar]
- Vinters HV, De Rosa MJ, Farrell MA. Neuropathologic study of resected cerebral tissue from patients with infantile spasms. Epilepsia. 1993;34:772–779. doi: 10.1111/j.1528-1157.1993.tb00460.x. [DOI] [PubMed] [Google Scholar]
- Waldburg N, Buehling F, Evert M, Burkhardt O, Welte T. Pulmonary infiltrates in Costello Syndrome. Eur Respir J. 2004;23:783–785. doi: 10.1183/09031936.04.00073704. [DOI] [PubMed] [Google Scholar]
- Yang H, Mattingly RR. The Ras-GRF1 exchange factor coordinates activation of H-Ras and Rac1 to control neuronal morphology. Mol Biol Cell. 2006;17:2177–2189. doi: 10.1091/mbc.E05-10-0913. [DOI] [PMC free article] [PubMed] [Google Scholar]
- Yang K, Sheikh AM, Malik M, Wen G, Zou H, Brown WT, Li X. Upregulation of Ras/Raf/ERK1/2 signaling and ERK5 in the brain of autistic subjects. Genes Brain Behav. 2011;10:834–843. doi: 10.1111/j.1601-183X.2011.00723.x. [DOI] [PubMed] [Google Scholar]
- Zhang SC, Wernig M, Duncan ID, Brüstle O, Thomson JA. In vitro differentiation of transplantable neural precursors from human embryonic stem cells. Nat Biotechnol. 2001;19:1129–1133. doi: 10.1038/nbt1201-1129. [DOI] [PubMed] [Google Scholar]