Abstract
Methylmercury (MeHg) disrupts cerebellar function, especially during development. Cerebellar granule cells (CGC), which are particularly susceptible to MeHg by unknown mechanisms, migrate during this process. Transient changes in intracellular Ca2+ (Ca2+i) are crucial to proper migration, and MeHg is well known to disrupt CGC Ca2+i regulation. Acutely prepared slices of neonatal rat cerebellum in conjunction with confocal microscopy and fluo4 epifluorescence were used to track changes induced by MeHg in CGC Ca2+i regulation in the external (EGL) and internal granule cell layers (IGL) as well as the molecular layer (ML). MeHg caused no cytotoxicity but did cause a time-dependent increase in fluo4 fluorescence that depended on the stage of CGC development. CGCs in the EGL were most susceptible to MeHg-induced increases in fluo4 fluorescence. MeHg increased fluorescence in CGC processes but only diffusely; Purkinje cells rarely fluoresced in these slices. Neither muscimol nor bicuculline alone altered baseline fluo4 fluorescence in any CGC layer, but each delayed the onset and reduced the magnitude of effect of MeHg on fluo4 fluorescence in the EGL and ML. In the IGL, both muscimol and bicuculline delayed the onset of MeHg-induced increases in fluo4 fluorescence but did not affect fluorescence magnitude. Thus, acute exposure to MeHg causes developmental stage-dependent increases in Ca2+i in CGCs. Effects are most prominent in CGCs during development or early stages of migration. GABAA receptors participate in an as yet unclear manner to MeHg-induced Ca2+i dysregulation of CGCs.
Introduction
Methylmercury (MeHg) is a widespread environmental neurotoxicant known to affect the cerebellum (Hunter and Russell, 1954; Takeuchi et al., 1962; Bakir et al., 1973). MeHg is especially toxic to cerebellar granule cells (CGCs), the smallest and most numerous neurons in the brain. CGCs die after both chronic and acute MeHg poisoning, whereas a higher percentage of neighboring Purkinje cells (PCs) survive, despite accumulating more MeHg than do CGCs (Hunter and Russell, 1954; Sakamoto et al., 1998; Edwards et al., 2005; Yuan and Atchison, 2007).
The developing cerebellum is especially sensitive to neurotoxicity induced by MeHg. Dysmorphogenesis, with loss of the characteristic “layering” of the cerebellar cortex, occurs after in utero exposure of humans to MeHg (Philbert et al., 2000, for review). Cerebellar architecture is critically dependent upon migration of CGCs and synaptogenesis. CGCs undergo a highly regimented and organized migration pattern in which their precursors divide and migrate from the external granule cell layer (EGL) along the processes of Bergmann glia, through the maturing PC dendrites in the molecular layer (ML) and mature in the internal granule layer (IGL) (Komuro and Rakic, 1998). They undergo distinct patterns of migration through the layers. Initially migration is tangential to the EGL, then radial through the ML and finally into the IGL (Komuro and Rakic, 1998). Human fetuses exposed to MeHg during CGC migration show the greatest susceptibility to toxicity (Amin-Zaki et al., 1974). Rats and mice are also susceptible to MeHg during a postnatal period of CGC migration, suggesting it is not the time before or after birth that determines susceptibility, but rather some mechanism involved in neuronal migration and survival (Rice and Barone, 2000; Sakamoto et al., 2004).
CGC migration has been studied extensively in isolated acutely prepared slices (Komuro and Rakic, 1995), as well as organotypic slice culture (Komuro and Rakic, 1995; Kunimoto and Suzuki, 1997; Mancini and Atchison, 2007). CGC migration depends on transient increases in intracellular calcium concentration ([Ca2+]i) (Komuro and Rakic, 1998; Komuro and Kumada, 2005), which, in turn, are modulated by N-type (Cav2.2) voltage-gated Ca2+ channels (VGCCs) (Komuro and Rakic, 1992), N-methyl-d-aspartate (NMDA) receptors (Komuro and Rakic, 1993), and intracellular signaling pathways (Komuro and Rakic, 1995; Komuro et al., 2015). When those transient changes in [Ca2+]i are disrupted, migration ceases (Kumada and Komuro, 2004). Thus, interrupting the frequency or timing of these [Ca2+]i pulses would be expected to interrupt CGC migration, thereby impairing the ultimate development of cerebellar cortex layering.
One recurring observation of effects of MeHg on CGCs is that it disrupts regulation of [Ca2+]i (Marty and Atchison, 1997, 1998; Limke and Atchison, 2002; Limke et al., 2003, 2004; Yuan and Atchison, 2007). In cerebellar slices from mature rats, acute exposure to MeHg increases fluo4 fluorescence and simultaneously stimulates then inhibits release of both glutamate and GABA (Yuan and Atchison, 2007). In addition to its ability to interact with GABA A-type receptors (GABAAR), MeHg also interacts with several types of VGCC, including Cav2.2 (Shafer and Atchison, 1991; Sirois and Atchison, 2000; Peng et al., 2002; Hajela et al., 2003). The lasting effects of MeHg on CGC [Ca2+]i result from complex interactions with both intracellular Ca2+ pools in the smooth endoplasmic reticulum and mitochondria as well as with these voltage-gated Ca2+ channels. Each of these sources of [Ca2+]i is vital to CGC migration. Thus, disruption of their normal function could have dire consequences for establishing and sustaining the pulses of [Ca2+]i shown to be essential for proper migration of CGCs. Continuous MeHg treatment delays CGC migration in all layers, suggesting that disruption of Ca2+ oscillations occurs (Mancini et al., 2009).
Among the pathways that control activation of Cav2.2 channels in developing CGCs, the GABAAR plays an underappreciated role. Whereas in mature CGCs, GABAARs are inhibitory, their activation in immature CGCs leads to Cl− efflux and thus inward current (Owens et al.,1996), thereby depolarizing the CGC membrane (Takayama and Inoue, 2004a,b). This occurs due to the altered expression of the cation transporters KCC1 and NKCC1, which are abundantly expressed in immature neurons, whereas KCC2 is not (Mikawa et al., 2002; Yamada et al., 2004; Takayama and Inoue, 2006). The resulting shift in Cl− gradient results in a GABAAR-mediated depolarization that could rapidly activate proximal, voltage-gated channels.
The pattern of GABAAR subunit expression also differs markedly between migrating and postmigratory CGCs (Takayama and Inoue, 2004a,b). This is especially true for the α subunit, which contains the ligand-binding sites and markedly influences both the GABA sensitivity as well as the kinetic properties of the receptor. Mature CGCs express a myriad of GABAAR subunits, including the α1, α6, several β subunits, both long- and short-splice variants of γ3, and most uniquely, the δ subunit (Laurie et al., 1992). Conversely, in the migrating and premigratory state CGCs express the α2 subunit (Takayama and Inoue, 2004a,b).
MeHg has complex interactions with CGC GABAARs. In mature CGCs in slices, it initially increases GABAAR current before ultimately blocking current flow (Yuan and Atchison, 2007). In neonatal granule cells in culture, MeHg at low concentrations causes a time-dependent block of GABA-mediated current (Herden et al., 2008). However the effects of MeHg on GABAARs in migrating, immature neurons have yet to be described.
We tested the hypothesis that CGCs at different stages of development react differentially to MeHg by investigating the acute actions of MeHg on developing CGCs. Slices of brain maintained in oxygenated artificial cerebrospinal fluid (ACSF) permit rapid and controlled treatment of cells with toxicant, while retaining much of their structure and function. Because CGCs at different stages of development appear to have differential sensitivities to MeHg, we sought to determine whether there is a difference in response of [Ca2+]i to acutely applied MeHg. We used the fluorescent indicator fluo4, which labels free divalent cations, to indicate relative changes in [Ca2+]i. In addition, we tested for the contribution of GABAARs using the nonspecific GABAAR agonist and antagonist muscimol and bicuculline, respectively.
Materials and Methods
Chemicals and Solutions.
Methylmercuric (II) chloride was obtained from Aldrich Chemical (Milwaukee, WI). Fluo4 (no wash), ethidium homodimer-1 (ethD-1), and probenecid were obtained from Invitrogen/Molecular Probes (Eugene, OR). Muscimol hydrobromide and bicuculline methobromide were obtained from Sigma-Aldrich (St. Louis, MO).
Tissue dissections were performed in a solution containing (in mM): 222.5 sucrose, 2.5 KCl, 4 MgCl2, 1.25 KH2PO4, 26 NaHCO3, 1 CaCl2, and 25 d-glucose (pH 7.3–7.5 when oxygenated) at a room temperature of 23–25°C. These low [Na+], low [Ca2+], high [Mg2+] slicing solutions were used to reduce cellular damage during slicing. Slices were kept in this solution for no longer than 15 minutes. Further incubations were performed in ACSF containing (in mM): 125 NaCl, 2.5 KCl, 1 MgCl2, 1.25 KH2PO4, 26 NaHCO3, 2 CaCl2, and 20 d-glucose (pH 7.3–7.5 when oxygenated). The ACSF was supplemented with MeHg from a 10 mM stock solution in double-distilled water for treatments. All working solutions were prepared within 48 hours of use and oxygenated with 95/5% O2/CO2 at room temperature during treatments. We prepared 2X stock of fluo4 according to the supplier’s instructions and diluted to a final concentration of 4 μM in ACSF supplemented with 2.5 μM probenecid to facilitate fluorophore loading (Mehlin et al., 2003). Stock solutions of 100 mM muscimol and 10 mM bicuculline were prepared in double-distilled water and stored at −20°C until use. Choice of concentrations of bicuculline and muscimol was based on previous electrophysiologic experiments involving bath application of 100 μM or 10 μM bicuculline in hippocampal or cerebellar slices (Yuan and Atchison 1997, 2003), and optimizations showing a temporary increase in [Ca2+]i from bath application of 100 μM muscimol in slices (results not shown).
Acute Slice Preparation.
All animal procedures are in accordance with National Institutes of Health guidelines for experimental animal use and were approved by the Michigan State University Institutional Animal Care and Use Committee. Timed-pregnant, female Sprague-Dawley rats were obtained from Charles River Laboratories (Cambridge, MA). Pregnant and nursing dams were fed high-fat diets (Purina 7024; Land O’Lakes/Purina, Richmond, IN) to improve litter size. All rats were given doubly distilled water to drink ad libitum.
Male and female rat pups (M = 24, F = 14, postnatal days 8–12) were euthanized by rapid decapitation. Their brains were rapidly removed. Cerebella were maintained in ice-cold, oxygenated solution during slicing. Sagittal slices 250 μm thick were cut using a Leica VT100S Vibratome (Leica Microsystems, Bannockburn, IL). After slicing, slices were incubated in oxygenated ACSF at room temperature for 1 hour.
Incubations in ACSF alone were followed by incubations in fluorophores in ACSF for either cytotoxicity assays or time course studies. A live/dead assay consisting of fluo4/ethD-1 was used to determine whether the concentrations of MeHg used in time course studies were lethal to cells in slices during the imaging period. Slices were incubated in ACSF with 1X fluo4 and 4 μM ethD-1 for 2 hours (postincubation control), for 3 hours (+1 hour ACSF), or for 3 hours supplemented with 20 μM MeHg during the final hour (+1 hour MeHg). Due to time constraints in imaging, these were not matched to the 40-minute MeHg treatments of the time courses but were kept to 60-minute treatment and the highest concentration used in time course assays, 20 μM MeHg, to represent the maximal treatment tested. All other treatments incubated slices in ACSF with 1X fluo4 from 2–8 hours as needed. In some cases, multiple slices from the same animal were used on a treatment day, but no slices from individual animals or animals in the same litter were given the same treatment.
Confocal Microscopy.
For each treatment, a cerebellar slice was removed from fluorophore incubation and anchored in a microscope perfusion chamber with gravity-fed oxygenated ACSF flowing at 2–3 ml/min at room temperature, 23–25°C. Slices were visualized under 10× and 40× water immersion objectives (numerical aperture 0.3 and 0.8, respectively) fitted to an upright Leica TSL confocal scanning microscope (Leica Microsystems). Magnified regions of the slices were examined using an argon laser at 488 nm excitation. To reduce the incidence of photobleaching, laser power was set at less than 30% of maximum. To maximize the number of cells available for analysis, 40× magnified regions were chosen that contained fluorescent cells in all cerebellar layers, based on initial visualization at 10× magnification.
Slices incubated for the cytotoxicity assays were sequentially scanned for fluo4 and ethD-1. Imaging was performed at 488 and 543 nm laser excitation with emission filters for fluo4 (500–535 nm) and ethD-1 (556–700 nm). For single-label experiments, a wider fluo4 emission could be sampled, so an emission filter of 500–700 nm was used. Imaging parameters for both fluorophores were scaled manually to the maximum and minimum saturation limits for pixel values before taking scans. Images were taken at a 512 × 512 pixel resolution representing a (300 μm)2 field of view. The full thickness of each postincubation slice, typically 100–160 μm, was scanned as a Z-series of images representing an image stack. Between-image depth was set at 3–5 μm to decrease imaging time and minimize photobleaching while still taking multiple images of each cell. Imaging of cytotoxicity assays included two regions of each slice, taken at 10× and 40× magnification. For time course experiments, one region of the slice was selected. To maintain visualization of the same cells through the experiment, framing of the image was manually reset between time points.
Several concentrations of MeHg were tested for effects on [Ca2+]i. In these time course treatments, two pretreatment time points (−10 and −5 minutes) established a baseline fluo4 signal, followed by 40 minutes of continuous perfusion with a single concentration of either 1, 5, 10, or 20 μM MeHg starting at 0 minutes. These concentrations are higher than those used for isolated cells in culture (Herden et al., 2008) due to greater extent of nonspecific binding of MeHg in tissue. They fall between 1 μM MeHg concentrations shown to allow cell survival and migration in rat cerebellar slice culture for several days (Mancini et al., 2009) and blood concentrations calculated in acute human exposures in Iraq, up to 19.5 μM (Bakir et al., 1973). Untreated control slices were used to monitor photobleaching with no MeHg treatment over the same time period. For all treatments, image stacks were collected every 5 minutes.
GABAAR function and divalent cation regulation were compared in the presence and absence of MeHg using muscimol and bicuculline, a nonspecific GABAAR agonist and antagonist, respectively. As in treatments with MeHg alone, images were collected at two pretreatment points, −10 and −5 minutes, and images were collected every 5 minutes thereafter for 40 minutes. For combination treatments, continuous perfusion with 20 μM MeHg started at t = 0 minutes, and slices were treated with four 60-second pulses of either 100 μM muscimol or 10 μM bicuculline in ACSF. These treatments repeated addition of the same agent 30 seconds before the 10, 20, 30, and 40 minutes time points to allow the perfusate to reach the slice in time for imaging. Bicuculline and muscimol controls were performed in which these agents were pulsed in the absence of MeHg. The 20 μM concentration of MeHg was used in combination treatments to allow for treatment comparison with an increase in [Ca2+]i in all layers.
Image Analysis and Statistics.
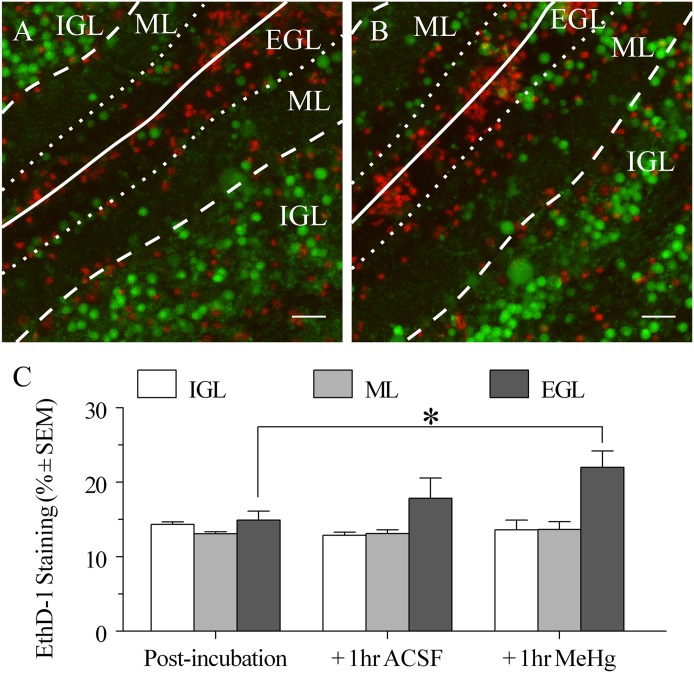
Cytotoxicity assay images were processed using Leica Confocal Software Lite (ver. 2.61, Leica Microsystems, Heidelberg, Germany). Histologic layers were visualized and categorized into EGL, ML, or IGL based on fluo4 staining of CGCs (Fig. 1A). CGCs were identified as spherical cells up to 10 μm in diameter. The EGL, 10 to 30 μm thick, extended from the pial edges of the slice to the origin of dendritic processes (Figs. 1 and 2). The ML, 60 to 80 μm thick, contained diffuse fluo4-stained PC dendrites and linear glial processes. CGCs located along the EGL/ML margin were considered EGL cells. A single layer of PCs divides the ML and IGL, but because PCs in this treatment do not typically appear to fluoresce with fluo4 treatment, the ML/IGL boundary was defined as the end of dendrite staining and the start of densely packed fluorescent cells. Cells falling on the ML/IGL boundary were excluded from analysis because PC processes and other fluorescent processes frequently overlapped with CGCs there. The IGL extended 60 to 80 μm from this line before an observable drop in fluo4 staining occurred, consistent with the edge of cerebellar white matter.
Fig. 1.
(A) Representative pseudocolor fluorescent image of an acutely isolated cerebellar slice from PND9 rat showing modified fluo4/ethD-1 live/dead cytotoxicity assay, postincubation control. Images are from internal folds of the developing cerebellum. Images show maximum fluo4 and ethD-1 fluorescence values by pixel. The approximate pial surface of an inner fold is indicated by a white line, and other boundaries are indicated by dashed lines. EthD-1 (red), an indicator of dead cells, and Fluo4 AM (green), an indicator of relative intracellular calcium concentration, do not colocalize. Scale bar represents 30 μm. (B) Representative image from separate slice from the same cerebellum after 1 additional hour in ACSF supplemented with 20 μM MeHg. (C) EthD-1 mean pixel staining (% pixels ± S.E.M.) comparison of layers postincubation in fluo4 and ethD-1 (n = 5), with an additional 1 hour of incubation in ACSF (n = 3) or with an additional 1 hour of incubation in 20 μM MeHg ACSF (n = 3).
Fig. 2.
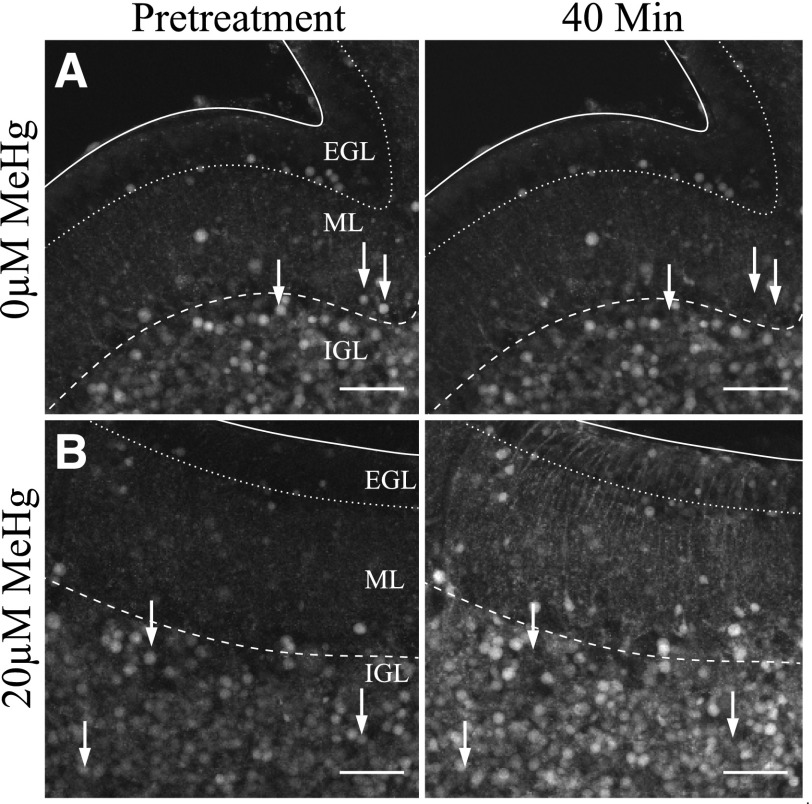
Grayscale 40× magnification examples of cerebellar slices before (−10) and after (40 minutes) treatment with MeHg. Images show projection of maximum fluo4 fluorescence by pixel. (A) Fluorescence does not change over the course of imaging in control slices. (B) MeHg increased fluorescence in all layers, with the signal from many cells saturating the detector. Scale bars are 60 μm in all images. Surfaces and boundaries are indicated as with Fig. 1. White arrows indicate examples of cells with extinguished fluorescence by the end of treatment.
For cytotoxicity assays, regions of interest were delineated around each visible layer in 40× magnification image stacks, divided by the visible boundaries denoted earlier (Fig. 1). Histograms were taken for each layer region of interest, with the threshold for positive staining set at 10% of maximum pixel intensity. From each histogram, the sum of all pixels positive for ethD-1 was divided by the layer’s total pixel area to produce ethD-1 pixel intensities, expressed as a percentage. Each layer’s pixel intensities from two 40× image stacks per slice were averaged to produce the mean pixel intensities per animal and then averaged per treatment. With only one confocal platform to image slices, the +1 hour MeHg-treated slices and the +1 hour ACSF-treated slices had to come from different animals, so an n of 1 represents all treatments from the same litter.
For time courses, image stacks were processed using ImageJ (http://imagej.nih.gov/ij/). Background was subtracted from each image using the Subtract Background Tool with a 50-pixel rolling-ball radius. Resulting images were divided into time points and projected to two dimensional images by summing the pixels in the z-dimension. These summed image series were aligned over time using the StackReg plugin (Thévenaz et al., 1998) and cropped to eliminate unused space, typically removing 10–12 pixels in each dimension. CGCs were chosen from all three layers, using the elliptical brush tool to select approximately 10-μm circles around distinguishable CGCs. Mean pixel intensities (Ft) from these CGCs as circular regions of interest were collected using the Multi-Measure plugin (OptiNav, Bellevue, WA).
Cells were classified into two categories: non-extinguished and extinguished. Cells that visibly lysed, visibly detached from the tissue, or lost fluo4 fluorescence between time points and did not recover were tallied as extinguished, as they either lost cell membrane integrity or detached from the tissue between time points. Significant fluorescence loss typical for extinguishing events was determined by finding negative change in fluorescence between time points (ΔF) significantly greater than the mean change of the cells in the same layer (P < 0.05). Typical extinguishing events displayed >10% fluorescence loss and were checked visually in the original images before discarding. All nonextinguishing mean pixel intensities were tracked for the time course. Pixel intensities were normalized to the average of two pretreatment intensities (F/F0). Cell density [cells/(100 μm)2] was determined from total cell counts, live and extinguished, corrected for layer areas using additional polygonal regions of interest in ImageJ. Tallies for extinguished cells were compared with total cells counted in each layer.
For cytotoxicity assays, cell densities, and extinguished cell counts, paired mean comparisons were made in GraphPad Prism (v4.03; GraphPad Software, La Jolla, CA). For Ca2+ time course experiments, the overall effects and interactions were determined using IBM SPSS Statistics (SPSS/IBM, Somers, NY). Assays were analyzed using repeated measures analysis of variance (ANOVA) with layers and time as within-subjects factors (Steel and Torrie, 1960). Because of the different number of replicates in various groups (n = 3 to 6), adjusted mean was used for statistical comparisons. No treatment group included sufficient separate replicates of males and females to compare the two groups. Additionally, each treatment group was assessed separately for significant changes in F/F0 over time and between layers. Post hoc comparisons were made in SPSS for time and layer comparisons and GraphPad Prism for treatment comparisons. Bonferroni corrections were used for multiple treatment comparisons. P < 0.05 was considered statistically significant for all effects, interactions, and comparisons.
Results
Visualization of Layers and Cytotoxicity.
Fluo4 labeled mainly small (5–10 μm diameter) round somata matching the size and shape of CGCs (Figs. 1 and 2). Larger cells were not typically labeled visibly with fluo4, similar to what was seen in other reports (Yuan and Atchison, 2007). Some processes were visible and were used to delineate boundaries of the ML (Fig. 1A). These processes included linear structures consistent with Bergmann glia and branching structures consistent with PC dendrites. Occasionally, cells visible at the boundary between the IGL and ML reacted fluorescently during treatment, usually around the addition of MeHg. These cells may be Bergmann glia or other interneurons present in this region that can be loaded with application of fluo4 (Hoogland et al., 2011). They were sufficiently different in shape and size so as not to be confused with CGCs. Fluo4-labeled CGCs were located in all three layers of the cerebellum. In the EGL, CGCs were concentrated at the pial surface and inner folds of lobes, but additional CGCs were located at the boundary between the EGL and ML. Most fluo4-labeled CGCs were situated in the IGL, evenly distributed throughout the slice thickness (Fig. 1). Comparatively few fluo4-labeled CGCs were located in the ML.
EthD-1 did not stain any fluo4-labeled cells, indicating that only viable cells accumulated the Ca2+ indicator fluo4 (Fig. 1A). In the absence of MeHg, EthD-1 intensity was 15.8% in the IGL, 13.8% in the ML, and 16.1% in the EGL at the postincubation time point matching the start of time course imaging, so ethidium staining was similar in all three layers (Fig. 1B). This presumably reflects cell damage due to slicing and the incubation process.
Slices imaged after 1 additional hour of untreated incubation, corresponding to the end of a time course treatment, were not different in ethD-1 mean pixel intensity, indicating that there is not a significant change in slice viability within the time frame used. In slices incubated for 3 hours in fluorophore plus 20 μM MeHg for 1 hour, roughly corresponding to slices incubated in MeHg for a time course series, there was an increase in ethD-1 staining in the EGL when compared with untreated slices after 3 hours of incubation, but it was not different from ethD-1 staining with 1 additional hour of fluorophore incubation. Thus, MeHg appears to exacerbate cell death induced by slicing in the EGL but does not increase the incidence of cell death over slicing alone for the short incubation times used in these experiments.
Acute MeHg Slice Treatment.
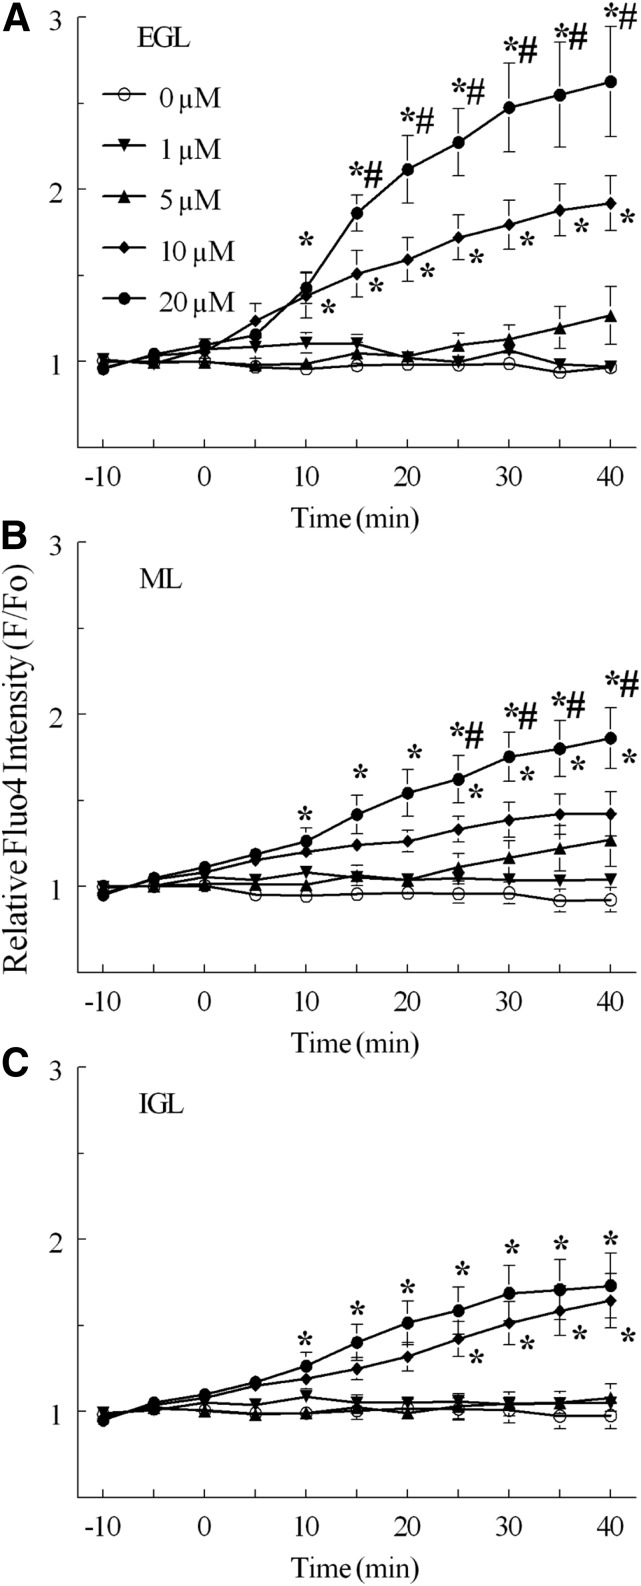
Relative pixel fluo4 fluorescence intensity (F/F0), a measure of changes to [Ca2+]i, was unaltered over 40 minutes in slices in the absence of MeHg treatment. Changes in mean F/F0 in cells did not exceed 5% between any two consecutive time points. Thus, none of the observed effects were due to photobleaching of fluo4 during confocal imaging (Figs. 2 and 3).
Fig. 3.
Relative fluo4 fluorescence intensity (F/F0) in CGCs by histologic layer in slices from neonatal rat cerebellum exposed to concentrations of MeHg continuously for 30 minutes. Continuous perfusion of ACSF with 0 μM (°, n = 5), 1 μM (▾, n = 3), 5 μM (▴, n = 5), 10 μM (♦, n = 6), or 20 M MeHg (●, n = 4) were compared in (A) the EGL, (B) the ML, and (C) the IGL. Significant differences are indicated from untreated control (*) and between 20 μM and 10 μM treatments (#) at the same time point. Intensity values are expressed in arbitrary units (mean ± S.E.M.).
Effects of MeHg on [Ca2+]i in CGCs were dependent upon concentration and differed by histologic layer. In all treatments with MeHg, the greatest effect on fluorescence occurred in the EGL, and it decreased in magnitude in the deeper layers (Fig. 4). In slices treated with MeHg, all regions appeared to increase in fluorescence over the treatment period, including the processes distributed through the ML (Fig. 2).
Fig. 4.
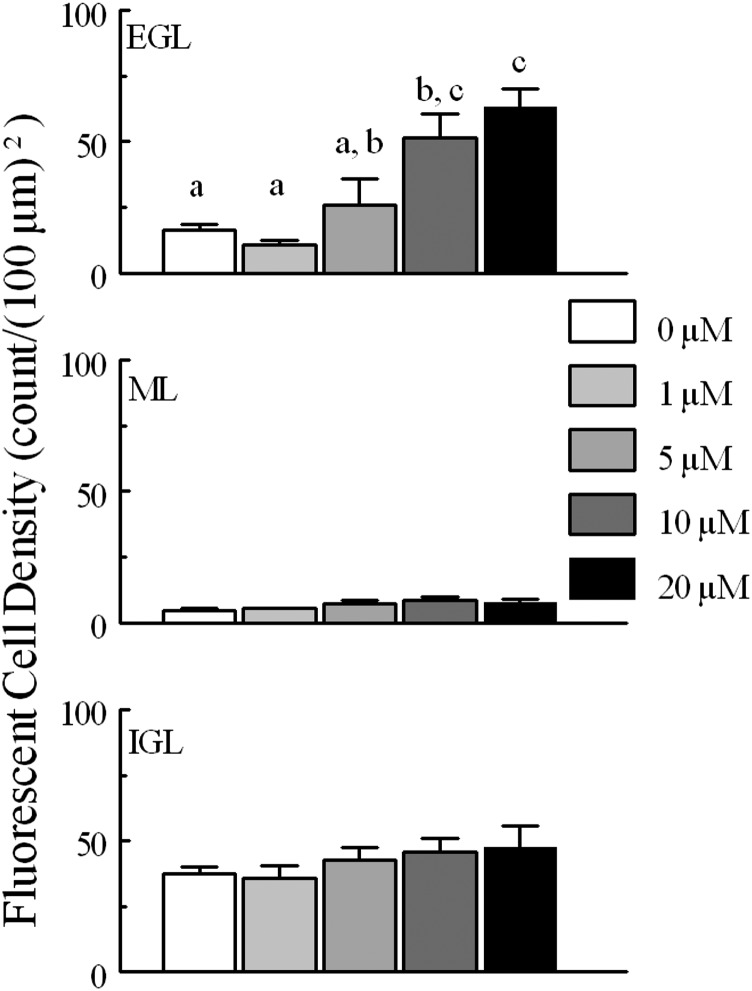
Cell density per (100 μm)2 for CGCs monitored for fluo4 fluorescence intensity in each layer (EGL, ML, and IGL) for tissue treated with different concentrations of MeHg. Fluorescent CGCs were more dense in the EGL and IGL layers than in the ML. At higher MeHg concentrations, fluorescent CGCs in the EGL were more dense than in IGL; at lower concentrations, density was higher in the IGL. Within the EGL, fluorescent cell density increased significantly with greater concentrations of continuous MeHg treatment; nonoverlapping letters are statistically significant different comparisons (P < 0.05). Paired comparisons were made between each concentration of MeHg by layer. Significantly different pairs within each layer are indicated by different letters (P < 0.05). N for each treatment is the same as in Fig. 3.
After a 40-minute exposure to 20 μM MeHg, fluo4 F/F0 was significantly increased in CGCs in all three layers, with a significantly larger effect in the EGL compared with deeper laminae (Figs. 2 and 3). This MeHg concentration increased mean F/F0 up to 263% of baseline in the EGL, 186% in the ML, and 173% in the IGL. At 10 μM MeHg, CGC F/F0 increased to 192% baseline in the EGL, 142% in the ML, and 164% in the IGL. In the EGL and ML, 20 μM MeHg increased F/F0 significantly more than 10 μM MeHg. Perfusion with 1 or 5 μM MeHg produced no increases in F/F0 compared with untreated control in any layer over this interval of recording. The largest changes in fluorescence occurred before the 20-minute time point. They included a 43% increase in fluorescence relative to F0 in the EGL between 10- and 15-minute time points when treated with 20 μM MeHg.
Calculating fluorescent changes relies heavily on the number of cells being tracked, and it appeared that MeHg treatment increased the number of cells that were visible during treatment. This was reflected in the density of cells that could be counted in layers. In untreated slices, 37 ± 2 CGCs per (100 μm)2 were visualized in the IGL over the full course of treatment, 5 ± 1 in the ML, and 16 ± 2 in the EGL (Fig. 4). Regardless of treatment, cells in the IGL were more densely distributed than in the other two histologic layers. There was an increase in the density of CGCs visible in slices treated with 10 or 20 μM MeHg, most notably in the EGL where visible CGCs increased to a density of 63 ± 7 per (100 μm)2 (Fig. 4). Many of the cells tracked in these MeHg treatments were not initially visible at pretreatment time points but could be tracked due to the registration of images. Although increased cell count in MeHg treatments meant comparative difficulty tracking of CGCs in low- and no-MeHg treatments with low baseline fluorescence, with the careful setup of the slices there were always enough visible CGCs for tracking in all slices and layers.
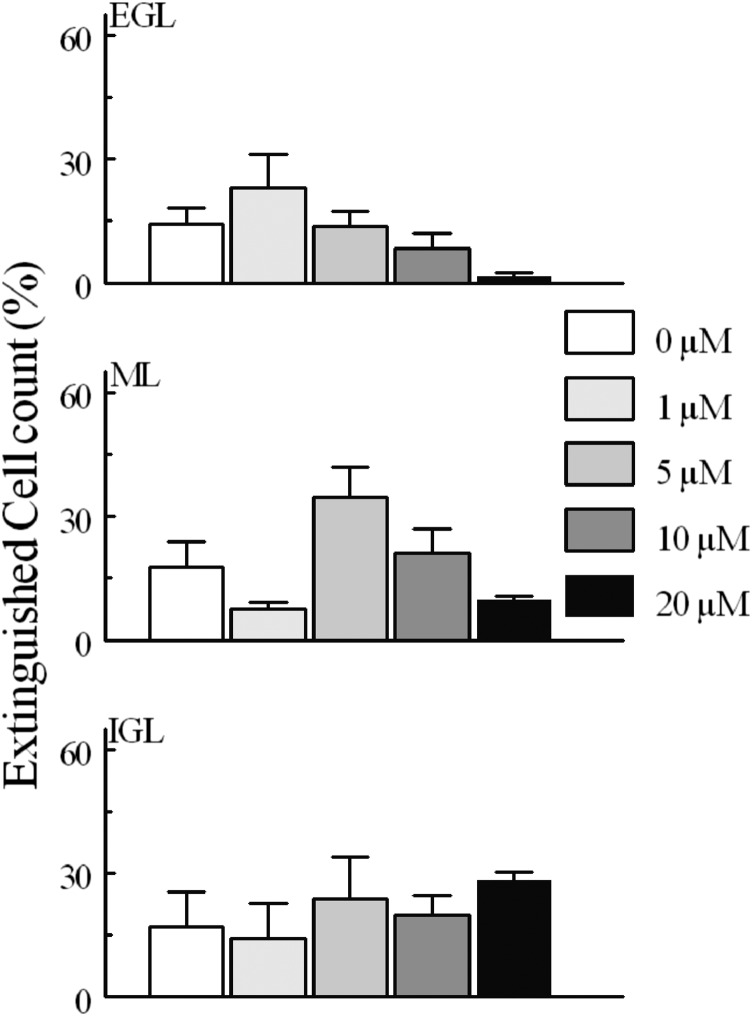
Some CGCs appeared to extinguish fluorescence during 50 minutes of imaging. Considerable effort was made to track and exclude these CGCs from the remaining population trend lines, as a drop in fluorescence in enough cells could diminish the measured effect of increasing fluorescence. These CGCs lost fluorescence suddenly as compared with other cells in their layer, and such outliers were thus excluded from fluorescence intensity measurements. These outliers made up 17.7% of total CGCs (Fig. 5), indicating a substantial number of extinguishing cells. These extinguished cells were occasionally accompanied by visible lysis or detachment from surrounding tissue, but evidence of these mechanisms is lost between imaging time points for most of the extinguished cells. This number matches well with the percentages of dead cells from the previous cytotoxicity assay, so this percent of cell loss indicates a baseline rate of cell loss during experiments due to imaging and perfusion of buffer over the slices.
Fig. 5.
Fluorescent cell loss “extinguished” counts from slices during treatment with several concentrations of MeHg over 30 minutes. Cells extinguished when they lost significant fluo4 fluorescence between time points. Fluo4 fluorescence loss was occasionally associated with visible lysis of cells, so presumably all fluorescence loss is associated with cell death. In comparisons between each concentration of MeHg and the untreated control, no comparisons were significantly different (P > 0.05).
Muscimol and Bicuculline Treatment with MeHg.
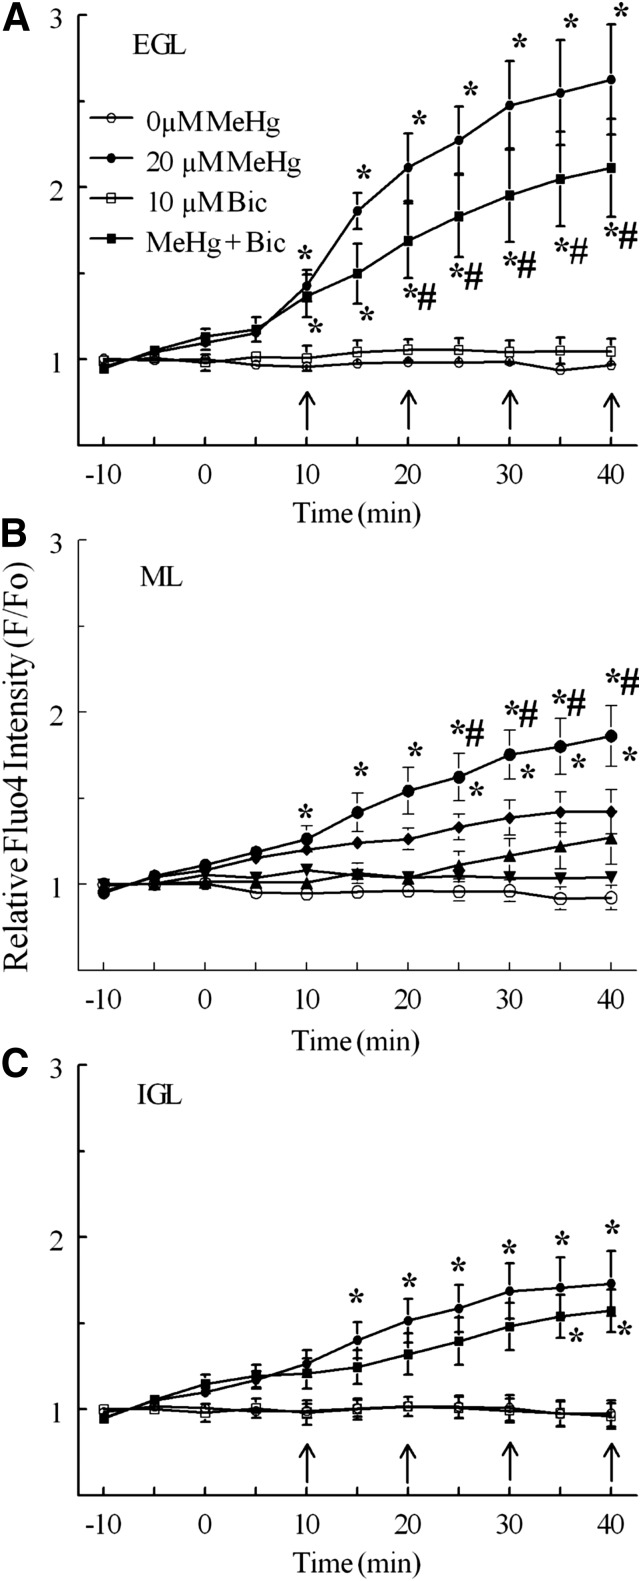
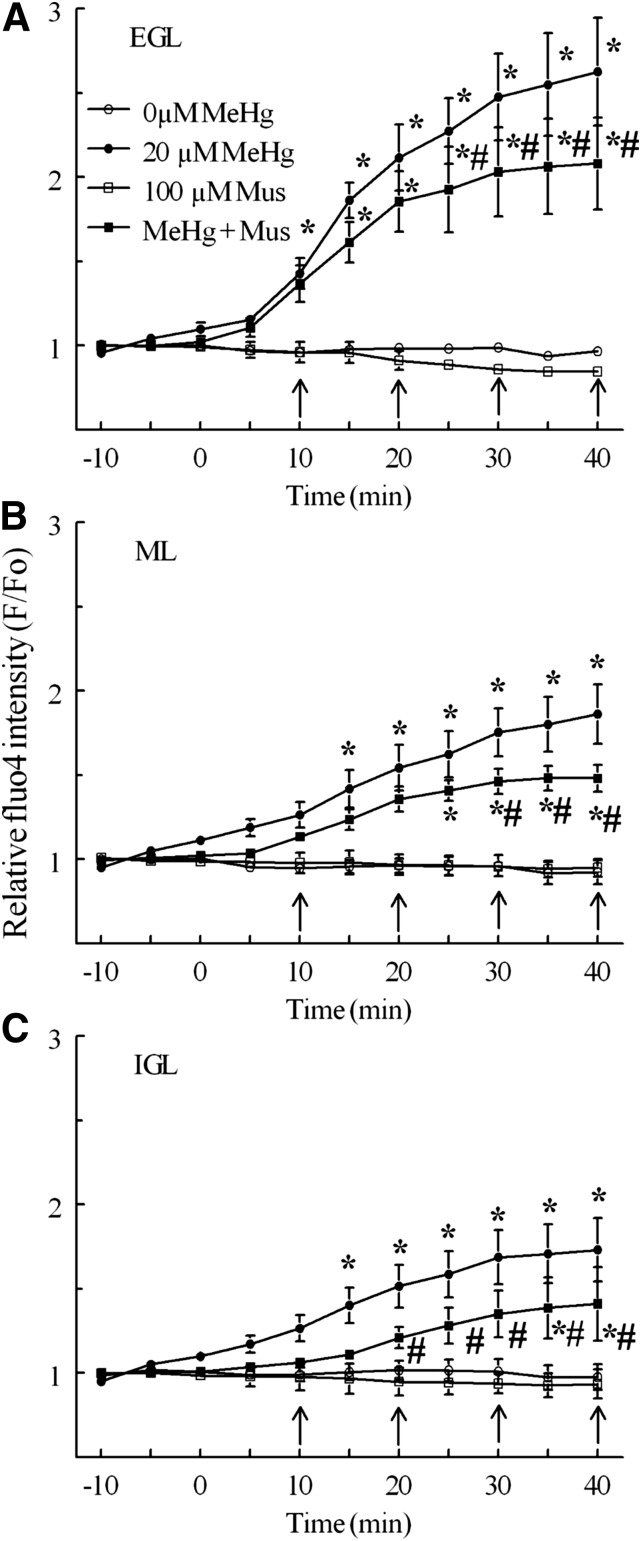
Both the muscimol (100 μM) and bicuculline (10 μM) delayed the onset and partially reduced the magnitude of effect of MeHg on fluo4 fluorescence in CGCs over time (Figs. 6 and 7). However neither agent prevented the increases caused by MeHg. Moreover, the effects of GABAAR modulation were developmental layer dependent. For example, in the presence of muscimol, MeHg treatment increased F/F0 up to 208% of baseline in the EGL, 148% of baseline in the ML, and 141% of baseline in the IGL. The magnitudes of these increases were significantly (P < 0.05) less than those produced by MeHg alone in each layer by the end of treatment (Fig. 6). Similarly, bicuculline pulses combined with MeHg resulted in increases of F/F0 to 211% of baseline in the EGL, 149% of baseline in the ML, and 157% of baseline in the IGL; for the EGL and ML, these increases in fluorescence were significantly less than those caused by MeHg alone (Fig. 6). In the IGL, where MeHg alone was less effective in stimulating fluo4 fluorescence, bicuculline did not significantly reduce the increase in F/F0 caused by MeHg, but it did delay its onset from 15 to 35 minutes of MeHg treatment, similar to its effect in other layers. Neither muscimol nor bicuculline alone altered fluo4 fluorescence over the duration of treatments (P > 0.05).
Fig. 6.
Effect of bicuculline and MeHg on relative fluo4 fluorescence intensity (F/F0) of CGCs by histologic layer. Untreated controls (°, n = 5) and 20 M MeHg alone (●, n = 5) are the same as in Fig. 3. Bicuculline pulses (arrows, 10 μM) with 20 μM MeHg (▪, n = 4) were compared with bicuculline alone (□, n = 3) and MeHg alone. Significant differences are indicated from bicuculline control (*) and from MeHg alone (#) at that time point (P < 0.05). Intensity values are expressed in arbitrary units (mean ± S.E.M.).
Fig. 7.
Effect of muscimol and MeHg on relative fluo4 fluorescence intensity (F/F0) of CGCs by histologic layer. Untreated controls (°, n = 5) and 20 μM MeHg alone (●, n = 5) are the same as in Fig. 3. Muscimol pulses (arrows, 100 μM) with 20 μM MeHg (▪, n = 4) were compared with muscimol alone (□, n = 3) and MeHg alone. Significant differences are indicated from muscimol control (*) and from MeHg alone (#) at that time point, P < 0.05. Intensity values are expressed in arbitrary units.
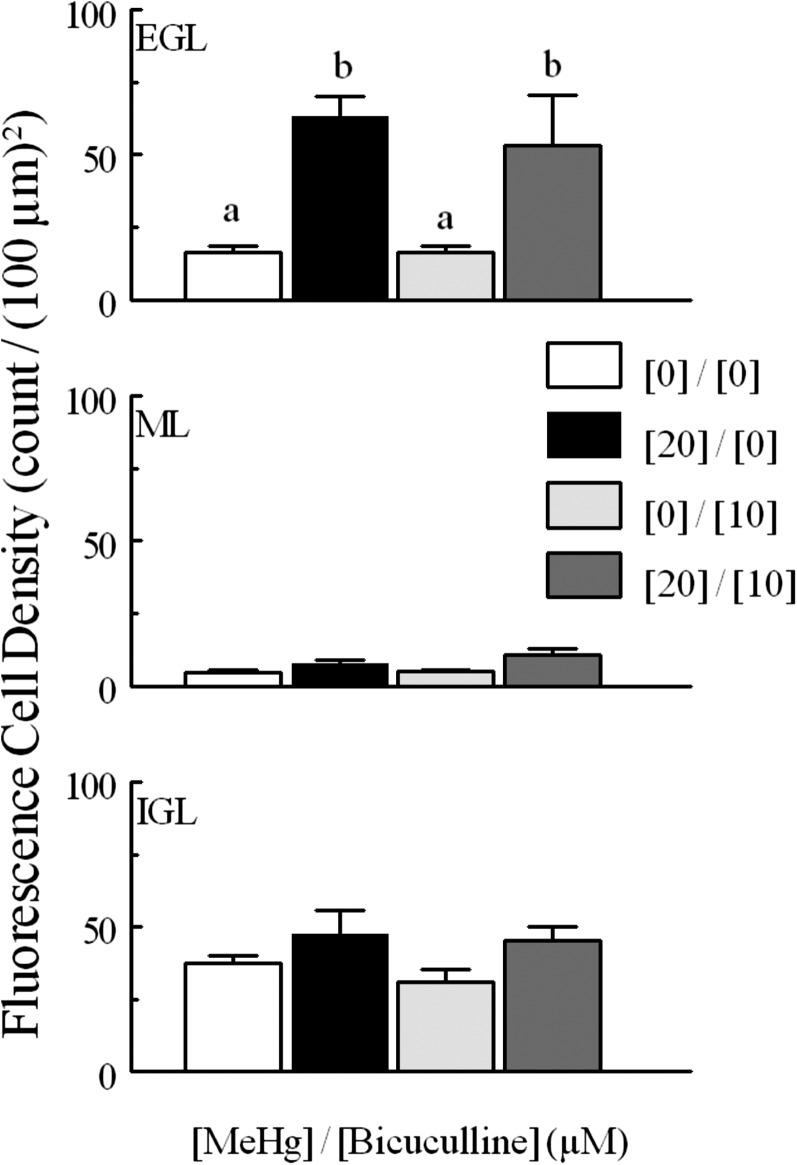
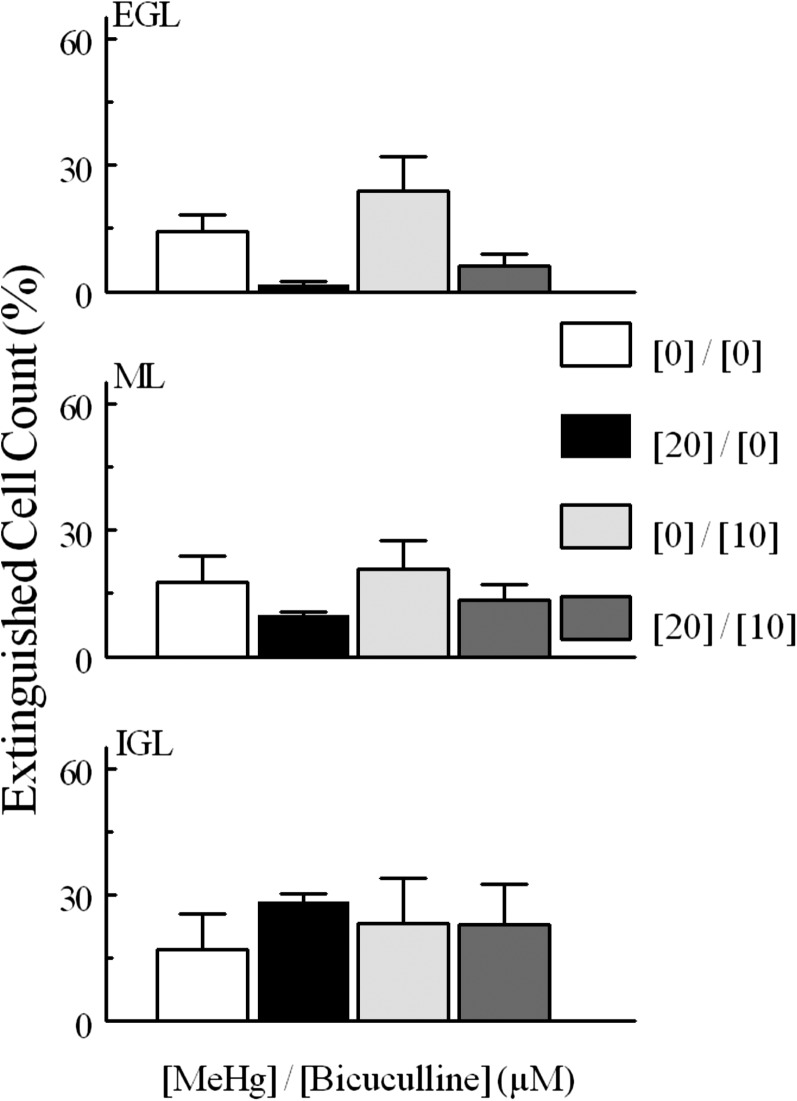
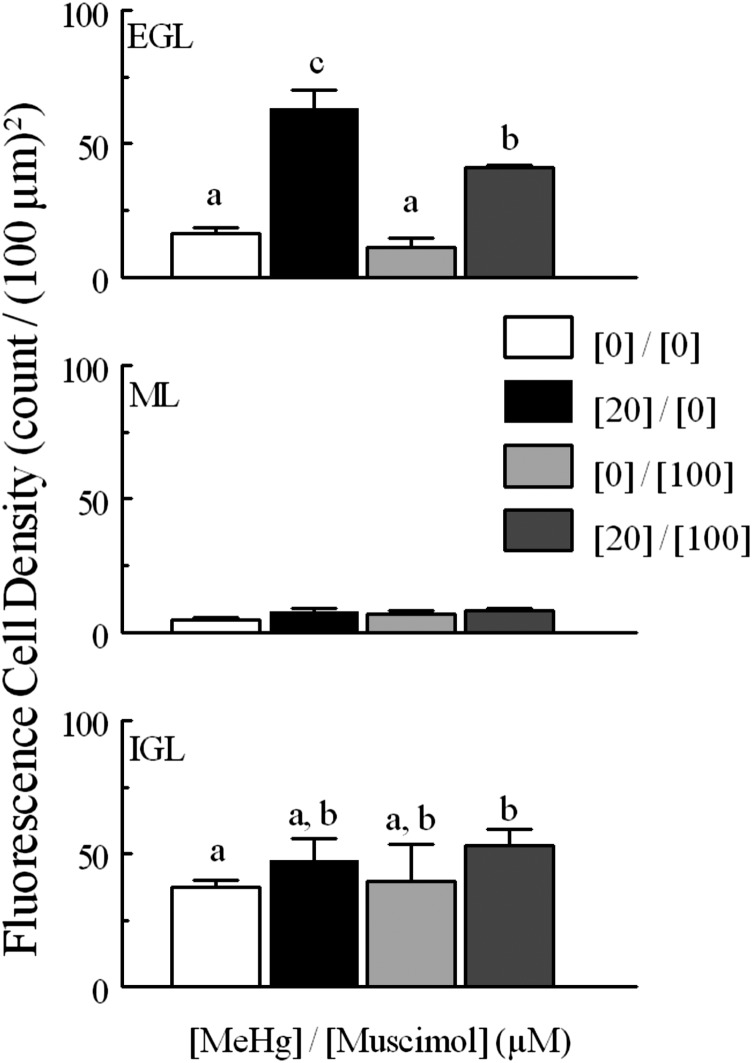
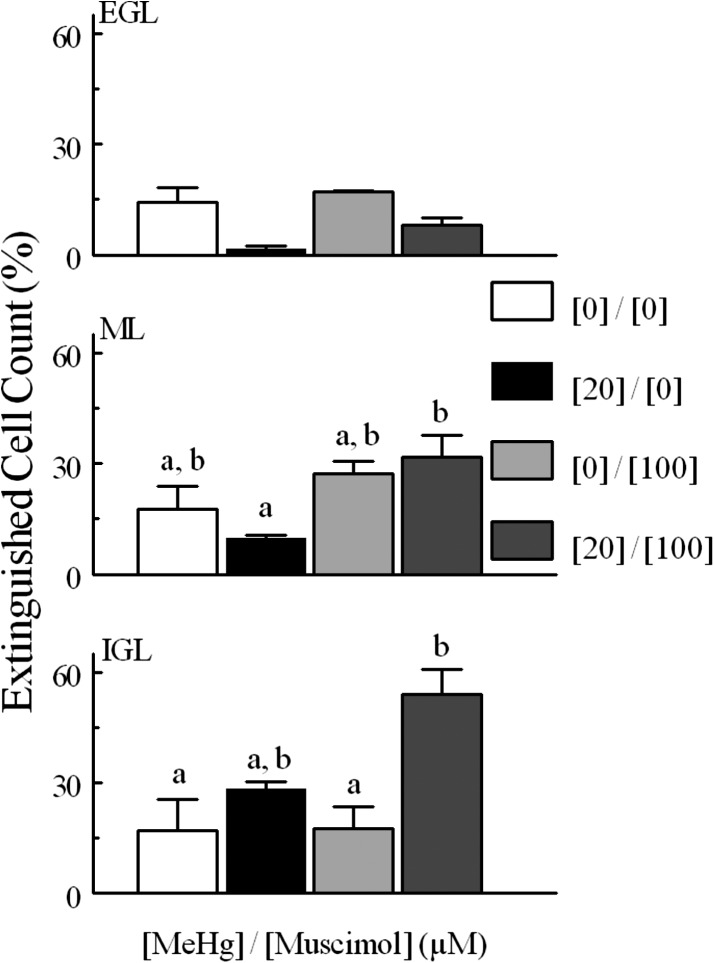
When examining the effects of GABAAR modulation on fluorescence cell density, a somewhat different pattern was seen. Again, neither agent alone altered the number of cells that experienced spontaneous fluorescence; however, whereas the agonist reduced the fluorescence cell density in response to MeHg, bicuculline was ineffective (Figs. 8 and 9). Bicuculline did not change extinguished cell counts from controls (Fig. 10). Furthermore, the effects of muscimol on levels of extinguished cell counts were again layer dependent, but in this case muscimol was only effective in quenching the effects of MeHg in the ML and IGL (Fig. 11).
Fig. 8.
Cell density [per (100 μm)2] for CGCs monitored for fluo4 fluorescence intensity in each layer (EGL, ML, and IGL) and density for the total tissue for tissue treated with or without MeHg (20 μM) and with or without bicuculline (10 μM). CGCs were more densely distributed in the EGL and IGL layers than in the ML. Paired comparisons were made between MeHg-treated and untreated for each layer. Significantly different pairs within each layer are indicated by different letters (P < 0.05). Values are mean ± S.E.M. for the same n as described in Fig. 6.
Fig. 9.
Cell density (per 100 μm2) for CGCs monitored for fluo4 fluorescence intensity in each layer (EGL, ML and IGL) and density for the total tissue for tissue treated with 20 μM MeHg or untreated and with muscimol (100 μM) or without. CGCs were more densely distributed in the EGL and IGL layers than in the ML. Paired comparisons were made between each concentration of MeHg by layer. Significantly different pairs within each layer are indicated by different letters (P < 0.05). Values are mean ± S.E.M. with n the same as described in Fig. 7.
Fig. 10.
Percentage of “extinguished” cells in experiments comparing MeHg and bicuculline treatment. Comparisons were made between 20 and 0 μM MeHg treatments, between bicuculline alone and 0 μM MeHg, between bicuculline alone and bicuculline combined with 20 μM MeHg, and between bicuculline combined with MeHg or MeHg alone. Values are mean ± S.E.M., for the same n as described in Fig. 6.
Fig. 11.
Percentage of “extinguished” cells in experiments comparing MeHg and muscimol treatment. Comparisons were made between 20 and 0 μM MeHg treatments, between muscimol alone and 0 μM MeHg, between muscimol alone and muscimol combined with 20 μM MeHg, and between muscimol combined with MeHg and 20 μM alone. Significantly different pairs within each layer are indicated by nonoverlapping letters (P < 0.05). Values are mean ± S.E.M. with n the same as described in Fig. 7.
Discussion
The present study was designed to begin to examine the relationship between the developmental stage of CGCs and susceptibility to MeHg-induced dysregulation of intracellular divalent cation regulation. Moreover, because GABAAR exhibits both high sensitivity to MeHg (Yuan et al., 2005; Herden et al., 2008), and developmental stage dependence (Takayama and Inoue, 2004a), we examined the prospective role these crucial receptors might play in the response to MeHg. The results show that: 1) MeHg application triggers rapid and sustained increases in CGC [Ca2+]i during development; 2) these changes are variable based on the developmental stage of the CGCs in slices; and 3) the disruption of [Ca2+]i is regulated in part by activity of GABAAR. The concentrations of MeHg used did not decrease cell viability during the time of exposure compared with slicing alone, as indicated by the cytotoxicity assay, though the large increases in [Ca2+]i could affect viability at later time points. These MeHg concentrations are consistent with those that increase release of both excitatory and inhibitory transmitters in mature rodent cerebellar slices (Yuan and Atchison, 2003, 2007).
Slice culture allowed for conditions similar to cell culture and a basic concentration–response assessment for this tissue and treatment. Both 10 and 20 μM MeHg caused intense increases in fluorescence while 5 and 1 μM did not in the time course studied. Importantly, we showed differences in response between CGCs at different developmental stages of migration. The basic disruption of [Ca2+]i shown here is consistent with previous measurements showing these increases are an initial mechanism of MeHg toxicity in CGCs (Marty and Atchison, 1998; Limke et al., 2003; Edwards et al., 2005). We further showed that modulators of GABAAR are capable of altering increases in [Ca2+]i rapidly as well, effectively decreasing and delaying the MeHg-induced increases.
Increases in [Ca2+]i are a consistent effect of MeHg, being seen in single neurons in culture (Hare et al., 1993; Marty and Atchison, 1997; Bemis and Seegal, 2000; Limke and Atchison, 2002; Edwards et al., 2005), acutely exposed cerebellar slices (Yuan and Atchison, 2007), synaptosomes (Denny et al., 1993; Dreiem and Seegal, 2007), and even in mice treated chronically with MeHg (Johnson et al., 2011). Moreover, this effect occurs early in exposure, requiring neither extended exposure nor high MeHg concentrations, as pharmacokinetic barriers to MeHg absorption and distribution are negated in vitro. In these in vitro systems, the kinetic profile of this Ca2+ response has been studied in considerable detail (Hare et al., 1993; Hare and Atchison, 1995a,b; Marty and Atchison, 1997; Limke and Atchison, 2002; Limke et al., 2003, 2004; Edwards et al., 2005). It comprises a multiphasic response with temporally distinct phases that reflect the initial release of Ca2+i from internal stores in mitochondria and endoplasmic reticulum (Hare et al., 1993; Hare and Atchison, 1995a; Marty and Atchison, 1997; Limke and Atchison, 2002; Limke et al., 2003, 2004) and subsequent entry of Ca2+ through pathways controlled by VGCCs (Hare and Atchison, 1995b; Marty and Atchison, 1997), glutamate receptors (Ramanathan and Atchison, 2011; Johnson et al., 2011), and cholinergic nicotinic (unpublished observations) and muscarinic (Limke et al., 2004) receptors. We now extend that observation most importantly to GABAA receptors.
Effects of MeHg on CGCs during migration can clearly be attenuated by GABAAR modulation, indicating that the receptor can be affected in any stage of development, and supporting a role for GABAARs in immediate mechanisms of MeHg toxicity. GABAAR modulation by either agent does not abolish the effects of MeHg, indicating there are likely other mechanisms occurring simultaneously. This is not surprising as other effects, such as those on VGCCs and muscarinic receptors, are also likely to occur rapidly (Sirois and Atchison, 2000; Limke et al., 2004; Roda et al., 2008). Moreover, muscimol appears to be acting similarly to bicuculline over the longer time courses in that both reduce the effect of MeHg on [Ca2+]i.
Multiple mechanisms could be responsible for a similar action of muscimol and bicuculline. If both are acting as competitive antagonists to MeHg, then both would appear to decrease the effect of MeHg, but the two agents act at slightly different sites, and the muscimol site activates even if MeHg is bound (Fonfría et al., 2001). Those binding studies assumed an incubation with the agents first. In this study, MeHg is applied first, so competition might be different. The reduction in effect by both an agonist and an antagonist could also be due to the nature of most agonists, in that the initial pulse increases conductance transiently but is followed by lingering desensitization, so we only observe the effects of overall antagonism.
Whatever the mechanism, there are a few subtle differences in this study between bicuculline and muscimol. First, the combination of bicuculline and MeHg was indistinguishable from MeHg alone in causing changes in visible density of fluorescent cells, whereas the combination with muscimol decreased this density in the EGL but increased it in the IGL. Second, the combination of MeHg and muscimol pulses increased cytotoxicity as measured by extinguished cells in this study whereas bicuculline did not. If muscimol transiently increases [Ca2+]i that is not detectable by these imaging parameters, it is possible that it contributes to MeHg cytotoxicity despite lowering the observed overall [Ca2+]i in most cells.
The differences in effectiveness of muscimol and bicuculline as a function of developmental layer were not sufficiently large as compared with MeHg to suggest that one type of agent is more effective in one layer than another. As the surface expression of receptor subunits such as α6, α2, γ, and δ changes over development (Beattie and Siegel, 1993; Zheng et al., 1993), the agents either function similarly regardless of the expression profiles of the CGCs, or specific reactions are lost in the variability of the populations. It would be possible to treat slices with more specific GABAAR modulators, such as those targeting the α6 or δ subunit, but the variability of the receptors (Nusser et al., 1998) and the population of CGCs would complicate interpretation of these results.
A tightly regulated amount of free [Ca2+]i is critical to driving migration and maturation of CGCs (Komuro and Rakic, 1992; Kumada and Komuro, 2004). As with all neurons, a sustained increase or inability to buffer [Ca2+]i can lead to activation of cell death pathways, including caspases, cytoskeletal breakdown, and opening of the mitochondrial transition pore (Fonfría et al., 2002; Limke and Atchison, 2002; Limke et al., 2003; Roda et al., 2008). Critical cycling of increased [Ca2+]i in CGC migration is another potential susceptibility to MeHg. Continuous increases in [Ca2+]i from the addition of caffeine or thimerosal, another mercury-based compound, disrupt migration of CGCs (Kumada and Komuro 2004; Komuro and Kumada 2005). Normal physiologic changes in [Ca2+]i as would be seen using electrophysiologic current recordings are small, transient, and occur too rapidly to be captured by this confocal microscopy setup. Even a temporary increase in [Ca2+]i could have profound effects on cell survival.
In these MeHg treatments, the [Ca2+]i levels in CGCs increased dramatically, but [Ca2+]i in PCs and other cells present in the slices did not label to any significant degree. This difference in cell body labeling reflects cell susceptibility and underscores the importance of [Ca2+]i in studying MeHg toxicity. Because the largest [Ca2+]i changes in CGCs for many treatments were at the end of recording, the concentration may continue to rise and may eventually fall before cell death, as has been seen in previous studies (Yuan and Atchison, 2007). This may occur even for those levels of MeHg that did not reach significance in these experiments. Extending the treatment and monitoring might allow such increases to be seen but could be complicated by the slow export of fluo4 or the continued extinguishing of fluorescence by dead or dying cells.
Clinical manifestations of MeHg poisoning and the susceptibility of human fetuses point strongly to the migration of CGCs in the cerebellum as being a particularly sensitive target for MeHg toxicity. We categorized CGCs into those that were still dividing, those that were migrating, and those that had reached their destination based on their location within the cerebellum. In MeHg treatments, fluorescence changes were distinct in the different layers; the more mature CGCs in the ML and IGL reacted less to MeHg than did migrating CGCs, as indicated by changes in their F/F0. Regardless of the mechanisms, this indicates that immature CGCs experience a larger sustained increase in [Ca2+]i as an early exposure event than more mature cells.
Even if early free Ca2+ is sequestered, lasting disruption of cell signaling is possible. Precise signaling is particularly important for the migration of CGCs; fewer CGCs reaching their target layer and maturing means fewer circuits made. The CGC and PC circuit is the major internal cerebellar neuronal circuit; because many CGCs normally synapse on PCs, their signal can be integrated over a population of the cells. If the population of CGCs is reduced, there is both a larger load placed on any individual CGC as well as a poorer integration of signal. This can have lasting consequences long after the initial exposure, including motor coordination and motor memory deficits related to the overall function of the cerebellum. Because MeHg is persistent in brain tissue, if it is present in the brain during development it may continue to be toxic beyond the most susceptible developmental period.
Although some exploration of the mechanisms of acute MeHg toxicity focuses on various VGCCs or reactive oxygen species production, the results presented here indicate additional acute effects via GABAAR on [Ca2+]i. An identical pattern of action of bicuculline and muscimol on migration and Ca2+ regulation has been described for the neocortex (Heck et al., 2007). Thus, the effects seen with the agonist and antagonist in combination with MeHg are not unique.
GABA is the major inhibitory neurotransmitter in the central nervous system and has several roles in cerebellar circuitry, so evidence of the involvement of GABAAR in the toxicity of MeHg must be taken into account in the study of the toxicant. The results presented here support the initial electrophysiologic findings (Yuan and Atchison, 2003, 2007), binding studies (Corda, et al., 1981; Fonfría, et al., 2001), and other toxicologic studies (Basu, et al., 2010) in indicating a role here for GABAAR and might explain the known cellular and developmental susceptibilities to MeHg. Though our work focused on only acute effects over less than 1 hour of MeHg treatment, the GABAAR responds to stressors with changes in surface expression (Mhatre et al., 1993; Saliba et al., 2009; Inoue et al., 2013), indicating that acute effects could trigger longer-term effects as well. Whether the effects of MeHg on GABAARs are acute or chronic, the sensitive migration and maturation of CGCs is affected, potentially contributing to the susceptibility of these cells at a crucial point in development.
Acknowledgments
The authors thank Drs. Stephen Schneider, Cheryl Sisk, and Ravindra Hajela for help with writing and editing the manuscript, Dr. Dirk Colbry for training in image processing and analysis, and Jessica Gevers for assistance with illustrations and word processing.
Abbreviations
- ACSF
artificial cerebrospinal fluid
- [Ca2+]i
intracellular Ca2+
- CGC
cerebellar granule cell
- EGL
external granule cell layer
- ethD-1
ethidium homodimer-1
- GABAAR
GABA A-type receptor
- IGL
internal granule cell layer
- MeHg
methylmercury
- ML
molecular layer
- NMDA
N-methyl-d-aspartate
- PC
Purkinje cell
- VGCC
voltage-gated Ca2+ channel
Authorship Contributions
Participated in research design: Bradford, Mancini, Atchison.
Conducted experiments: Bradford, Mancini.
Contributed new reagents or analytic tools: Bradford.
Performed data analysis: Bradford, Mancini, Atchison.
Wrote or contributed to the writing of the manuscript: Bradford, Mancini, Atchison.
Footnotes
This work was supported by the National Institutes of Health National Institute of Environmental Health Sciences Research Grant [R01-ES003299-23], Institutional Training Grant [T32ES007255-27]; the Johns Hopkins University Center for Alternatives to Animal Testing; and funds from the Michigan State University College of Osteopathic Medicine to support the D.O./Ph.D. training of J.D.M.
This work was submitted by A.B.B. in partial fulfillment of the requirements of the Ph.D. in Biochemistry and Molecular Biology and Environmental Toxicology at Michigan State University.
References
- Amin-Zaki L, Elhassani S, Majeed MA, Clarkson TW, Doherty RA, Greenwood M. (1974) Intra-uterine methylmercury poisoning in Iraq. Pediatrics 54:587–595. [PubMed] [Google Scholar]
- Bakir F, Damluji SF, Amin-Zaki L, Murtadha M, Khalidi A, al-Rawi NY, Tikriti S, Dahahir HI, Clarkson TW, Smith JC, et al. (1973) Methylmercury poisoning in Iraq. Science 181:230–241. [DOI] [PubMed] [Google Scholar]
- Basu N, Scheuhammer AM, Rouvinen-Watt K, Evans RD, Trudeau VL, Chan LH. (2010) In vitro and whole animal evidence that methylmercury disrupts GABAergic systems in discrete brain regions in captive mink. Comp Biochem Physiol C Toxicol Pharmacol 151:379–385. [DOI] [PubMed] [Google Scholar]
- Beattie CE, Siegel RE. (1993) Developmental cues modulate GABAA receptor subunit mRNA expression in cultured cerebellar granule neurons. J Neurosci 13:1784–1792. [DOI] [PMC free article] [PubMed] [Google Scholar]
- Bemis JC, Seegal RF. (2000) Polychlorinated biphenyls and methylmercury alter intracellular calcium concentrations in rat cerebellar granule cells. Neurotoxicology 21:1123–1134. [PubMed] [Google Scholar]
- Corda MG, Concas A, Rossetti Z, Guarneri P, Corongiu FP, Biggio G. (1981) Methyl mercury enhances [3H]diazepam binding in different areas of the rat brain. Brain Res 229:264–269. [DOI] [PubMed] [Google Scholar]
- Denny MF, Hare MF, Atchison WD. (1993) Methylmercury alters intrasynaptosomal concentrations of endogenous polyvalent cations. Toxicol Appl Pharmacol 122:222–232. [DOI] [PubMed] [Google Scholar]
- Dreiem A, Seegal RF. (2007) Methylmercury-induced changes in mitochondrial function in striatal synaptosomes are calcium-dependent and ROS-independent. Neurotoxicology 28:720–726. [DOI] [PMC free article] [PubMed] [Google Scholar]
- Edwards JR, Marty MS, Atchison WD. (2005) Comparative sensitivity of rat cerebellar neurons to dysregulation of divalent cation homeostasis and cytotoxicity caused by methylmercury. Toxicol Appl Pharmacol 208:222–232. [DOI] [PubMed] [Google Scholar]
- Fonfría E, Daré E, Benelli M, Suñol C, Ceccatelli S. (2002) Translocation of apoptosis-inducing factor in cerebellar granule cells exposed to neurotoxic agents inducing oxidative stress. Eur J Neurosci 16:2013–2016. [DOI] [PubMed] [Google Scholar]
- Fonfría E, Rodríguez-Farré E, Suñol C. (2001) Mercury interaction with the GABA(A) receptor modulates the benzodiazepine binding site in primary cultures of mouse cerebellar granule cells. Neuropharmacology 41:819–833. [DOI] [PubMed] [Google Scholar]
- Hajela RK, Peng SQ, Atchison WD. (2003) Comparative effects of methylmercury and Hg(2+) on human neuronal N- and R-type high-voltage activated calcium channels transiently expressed in human embryonic kidney 293 cells. J Pharmacol Exp Ther 306:1129–1136. [DOI] [PubMed] [Google Scholar]
- Hare MF, Atchison WD. (1995a) Methylmercury mobilizes Ca++ from intracellular stores sensitive to inositol 1,4,5-trisphosphate in NG108-15 cells. J Pharmacol Exp Ther 272:1016–1023. [PubMed] [Google Scholar]
- Hare MF, Atchison WD. (1995b) Nifedipine and tetrodotoxin delay the onset of methylmercury-induced increase in [Ca2+]i in NG108-15 cells. Toxicol Appl Pharmacol 135:299–307. [DOI] [PubMed] [Google Scholar]
- Hare MF, McGinnis KM, Atchison WD. (1993) Methylmercury increases intracellular concentrations of Ca++ and heavy metals in NG108-15 cells. J Pharmacol Exp Ther 266:1626–1635. [PubMed] [Google Scholar]
- Heck N, Kilb W, Reiprich P, Kubota H, Furukawa T, Fukuda A, Luhmann HJ. (2007) GABA-A receptors regulate neocortical neuronal migration in vitro and in vivo. Cereb Cortex 17:138–148. [DOI] [PubMed] [Google Scholar]
- Herden CJ, Pardo NE, Hajela RK, Yuan Y, Atchison WD. (2008) Differential effects of methylmercury on γ-aminobutyric acid type A receptor currents in rat cerebellar granule and cerebral cortical neurons in culture. J Pharmacol Exp Ther 324:517–528. [DOI] [PubMed] [Google Scholar]
- Hoogland TM, Kuhn B, Wang SS. (2011) Preferential loading of Bergmann glia with synthetic acetoxymethyl calcium dyes. Cold Spring Harb Protoc 2011:1228–1231. [DOI] [PubMed] [Google Scholar]
- Hunter D, Russell DS. (1954) Focal cerebellar and cerebellar atrophy in a human subject due to organic mercury compounds. J Neurol Neurosurg Psychiatry 17:235–241. [DOI] [PMC free article] [PubMed] [Google Scholar]
- Inoue M, Harada K, Nakamura J, Matsuoka H. (2013) Regulation of α3-containing GABAA receptors in guinea-pig adrenal medullary cells by adrenal steroids. Neuroscience 253:245–255. [DOI] [PubMed] [Google Scholar]
- Johnson FO, Yuan Y, Hajela RK, Chitrakar A, Parsell DM, Atchison WD. (2011) Exposure to an environmental neurotoxicant hastens the onset of amyotrophic lateral sclerosis-like phenotype in human Cu2+/Zn2+ superoxide dismutase 1 G93A mice: glutamate-mediated excitotoxicity. J Pharmacol Exp Ther 338:518–527. [DOI] [PMC free article] [PubMed] [Google Scholar]
- Komuro H, Kumada T. (2005) Ca2+ transients control CNS neuronal migration. Cell Calcium 37:387–393. [DOI] [PubMed] [Google Scholar]
- Komuro H, Rakic P. (1992) Selective role of N-type calcium channels in neuronal migration. Science 257:806–809. [DOI] [PubMed] [Google Scholar]
- Komuro H, Rakic P. (1993) Modulation of neuronal migration by NMDA receptors. Science 260:95–97. [DOI] [PubMed] [Google Scholar]
- Komuro H, Rakic P. (1995) Dynamics of granule cell migration: a confocal microscopic study in acute cerebellar slice preparations. J Neurosci 15:1110–1120. [DOI] [PMC free article] [PubMed] [Google Scholar]
- Komuro H, Rakic P. (1998) Distinct modes of neuronal migration in different domains of developing cerebellar cortex. J Neurosci 18:1478–1490. [DOI] [PMC free article] [PubMed] [Google Scholar]
- Komuro Y, Galas L, Lebon A, Raoult E, Fahrion JK, Tilot A, Kumada T, Ohno N, Vaudry D, Komuro H. (2015) The role of calcium and cyclic nucleotide signaling in cerebellar granule cell migration under normal and pathological conditions. Dev Neurobiol 75:369–387. [DOI] [PubMed] [Google Scholar]
- Kumada T, Komuro H. (2004) Completion of neuronal migration regulated by loss of Ca(2+) transients. Proc Natl Acad Sci USA 101:8479–8484. [DOI] [PMC free article] [PubMed] [Google Scholar]
- Kunimoto M, Suzuki T. (1997) Migration of granule neurons in cerebellar organotypic cultures is impaired by methylmercury. Neurosci Lett 226:183–186. [DOI] [PubMed] [Google Scholar]
- Laurie DJ, Seeburg PH, Wisden W. (1992) The distribution of 13 GABAA receptor subunit mRNAs in the rat brain. II. Olfactory bulb and cerebellum. J Neurosci 12:1063–1076. [DOI] [PMC free article] [PubMed] [Google Scholar]
- Limke TL, Atchison WD. (2002) Acute exposure to methylmercury opens the mitochondrial permeability transition pore in rat cerebellar granule cells. Toxicol Appl Pharmacol 178:52–61. [DOI] [PubMed] [Google Scholar]
- Limke TL, Bearss JJ, Atchison WD. (2004) Acute exposure to methylmercury causes Ca2+ dysregulation and neuronal death in rat cerebellar granule cells through an M3 muscarinic receptor-linked pathway. Toxicol Sci 80:60–68. [DOI] [PubMed] [Google Scholar]
- Limke TL, Otero-Montañez JK, Atchison WD. (2003) Evidence for interactions between intracellular calcium stores during methylmercury-induced intracellular calcium dysregulation in rat cerebellar granule neurons. J Pharmacol Exp Ther 304:949–958. [DOI] [PubMed] [Google Scholar]
- Mancini JD, Atchison WD. (2007) The NR2B subunit in NMDA receptors is functionally important during cerebellar granule cell migration. Neurosci Lett 429:87–90. [DOI] [PubMed] [Google Scholar]
- Mancini JD, Autio DM, Atchison WD. (2009) Continuous exposure to low concentrations of methylmercury impairs cerebellar granule cell migration in organotypic slice culture. Neurotoxicology 30:203–208. [DOI] [PubMed] [Google Scholar]
- Marty MS, Atchison WD. (1997) Pathways mediating Ca2+ entry in rat cerebellar granule cells following in vitro exposure to methyl mercury. Toxicol Appl Pharmacol 147:319–330. [DOI] [PubMed] [Google Scholar]
- Marty MS, Atchison WD. (1998) Elevations of intracellular Ca2+ as a probable contributor to decreased viability in cerebellar granule cells following acute exposure to methylmercury. Toxicol Appl Pharmacol 150:98–105. [DOI] [PubMed] [Google Scholar]
- Mehlin C, Crittenden C, Andreyka J. (2003) No-wash dyes for calcium flux measurement. Biotechniques 34:164–166. [DOI] [PubMed] [Google Scholar]
- Mhatre MC, Pena G, Sieghart W, Ticku MK. (1993) Antibodies specific for GABAA receptor α subunits reveal that chronic alcohol treatment down-regulates α-subunit expression in rat brain regions. J Neurochem 61:1620–1625. [DOI] [PubMed] [Google Scholar]
- Mikawa S, Wang C, Shu F, Wang T, Fukuda A, Sato K. (2002) Developmental changes in KCC1, KCC2 and NKCC1 mRNAs in the rat cerebellum. Brain Res Dev Brain Res 136:93–100. [DOI] [PubMed] [Google Scholar]
- Nusser Z, Sieghart W, Somogyi P. (1998) Segregation of different GABAA receptors to synaptic and extrasynaptic membranes of cerebellar granule cells. J Neurosci 18:1693–1703. [DOI] [PMC free article] [PubMed] [Google Scholar]
- Owens DF, Boyce LH, Davis MBE, Kriegstein AR. (1996) Excitatory GABA responses in embryonic and neonatal cortical slices demonstrated by gramicidin perforated-patch recordings and calcium imaging. J Neurosci 16:6414–6423. [DOI] [PMC free article] [PubMed] [Google Scholar]
- Peng S, Hajela RK, Atchison WD. (2002) Effects of methylmercury on human neuronal L-type calcium channels transiently expressed in human embryonic kidney cells (HEK-293). J Pharmacol Exp Ther 302:424–432. [DOI] [PubMed] [Google Scholar]
- Philbert MA, Billingsley ML, Reuhl KR. (2000) Mechanisms of injury in the central nervous system. Toxicol Pathol 28:43–53. [DOI] [PubMed] [Google Scholar]
- Ramanathan G, Atchison WD. (2011) Ca2+ entry pathways in mouse spinal motor neurons in culture following in vitro exposure to methylmercury. Neurotoxicology 32:742–750. [DOI] [PMC free article] [PubMed] [Google Scholar]
- Rice D, Barone S., Jr (2000) Critical periods of vulnerability for the developing nervous system: evidence from humans and animal models. Environ Health Perspect 108 (Suppl 3):511–533. [DOI] [PMC free article] [PubMed] [Google Scholar]
- Roda E, Coccini T, Acerbi D, Castoldi A, Bernocchi G, Manzo L. (2008) Cerebellum cholinergic muscarinic receptor (subtype-2 and -3) and cytoarchitecture after developmental exposure to methylmercury: an immunohistochemical study in rat. J Chem Neuroanat 35:285–294. [DOI] [PubMed] [Google Scholar]
- Sakamoto M, Kakita A, de Oliveira RB, Sheng Pan H, Takahashi H. (2004) Dosedependent effects of methylmercury administered during neonatal brain spurt in rats. Brain Res Dev Brain Res 152:171–176. [DOI] [PubMed] [Google Scholar]
- Sakamoto M, Wakabayashi K, Kakita A, Hitoshi Takahashi, Adachi T, Nakano A. (1998) Widespread neuronal degeneration in rats following oral administration of methylmercury during the postnatal developing phase: a model of fetal-type Minamata disease. Brain Res 784:351–354. [DOI] [PubMed] [Google Scholar]
- Saliba RS, Gu Z, Yan Z, Moss SJ. (2009) Blocking L-type voltage-gated Ca2+ channels with dihydropyridines reduces gamma-aminobutyric acid type A receptor expression and synaptic inhibition. J Biol Chem 284:32544–32550. [DOI] [PMC free article] [PubMed] [Google Scholar]
- Shafer TJ, Atchison WD. (1991) Methylmercury blocks N- and L-type Ca++ channels in nerve growth factor-differentiated pheochromocytoma (PC12) cells. J Pharmacol Exp Ther 258:149–157. [PubMed] [Google Scholar]
- Sirois JE, Atchison WD. (2000) Methylmercury affects multiple subtypes of calcium channels in rat cerebellar granule cells. Toxicol Appl Pharmacol 167:1–11. [DOI] [PubMed] [Google Scholar]
- Steel RGD, Torrie JH. (1960) Principles and procedures of statistics, McGraw, New York. [Google Scholar]
- Takayama C, Inoue Y. (2004a) Transient expression of GABAA receptor α2 and α3 subunits in differentiating cerebellar neurons. Brain Res Dev Brain Res 148:169–177. [DOI] [PubMed] [Google Scholar]
- Takayama C, Inoue Y. (2004b) Morphological development and maturation of the GABAergic synapses in the mouse cerebellar granular layer. Brain Res Dev Brain Res 150:177–190. [DOI] [PubMed] [Google Scholar]
- Takayama C, Inoue Y. (2006) Developmental localization of potassium chloride co-transporter 2 in granule cells of the early postnatal mouse cerebellum with special reference to the synapse formation. Neuroscience 143:757–767. [DOI] [PubMed] [Google Scholar]
- Takeuchi T, Morikawa N, Matsumoto H, Shiraishi Y. (1962) A pathological study of Minamata disease in Japan. Acta Neuropathol 2:40–57 DOI: 10.1007/BF00685743. [Google Scholar]
- Thévenaz P, Ruttimann UE, Unser M. (1998) A pyramid approach to subpixel registration based on intensity. IEEE Trans Image Process 7:27–41. [DOI] [PubMed] [Google Scholar]
- Yamada J, Okabe A, Toyoda H, Kilb W, Luhmann HJ, Fukuda A. (2004) Cl- uptake promoting depolarizing GABA actions in immature rat neocortical neurones is mediated by NKCC1. J Physiol 557:829–841. [DOI] [PMC free article] [PubMed] [Google Scholar]
- Yuan Y, Atchison WD. (1997) Action of methylmercury on GABA(A) receptor-mediated inhibitory synaptic transmission is primarily responsible for its early stimulatory effects on hippocampal CA1 excitatory synaptic transmission. J Pharmacol Exp Ther 282:64–73. [PubMed] [Google Scholar]
- Yuan Y, Atchison WD. (2003) Methylmercury differentially affects GABA(A) receptor-mediated spontaneous IPSCs in Purkinje and granule cells of rat cerebellar slices. J Physiol 550:191–204. [DOI] [PMC free article] [PubMed] [Google Scholar]
- Yuan Y, Atchison WD. (2007) Methylmercury-induced increase of intracellular Ca2+ increases spontaneous synaptic current frequency in rat cerebellar slices. Mol Pharmacol 71:1109–1121. [DOI] [PubMed] [Google Scholar]
- Yuan Y, Otero-Montañez JK, Yao A, Herden CJ, Sirois JE, Atchison WD. (2005) Inwardly rectifying and voltage-gated outward potassium channels exhibit low sensitivity to methylmercury. Neurotoxicology 26:439–454. [DOI] [PubMed] [Google Scholar]
- Zheng T, Santi MR, Bovolin P, Marlier LNJ, Grayson DR. (1993) Developmental expression of the α 6 GABAA receptor subunit mRNA occurs only after cerebellar granule cell migration. Brain Res Dev Brain Res 75:91–103. [DOI] [PubMed] [Google Scholar]


