Abstract
Segmentation of an ultrasound image into functional tissues is of great importance to clinical diagnosis of breast cancer. However, many studies are found to segment only the mass of interest and not all major tissues. Differences and inconsistencies in ultrasound interpretation call for an automated segmentation method to make results operator-independent. Furthermore, manual segmentation of entire three-dimensional (3D) ultrasound volumes is time-consuming, resource-intensive, and clinically impractical. Here, we propose an automated algorithm to segment 3D ultrasound volumes into three major tissue types: cyst/mass, fatty tissue, and fibro-glandular tissue. To test its efficacy and consistency, the proposed automated method was employed on a database of 21 cases of whole breast ultrasound. Experimental results show that our proposed method not only distinguishes fat and non-fat tissues correctly, but performs well in classifying cyst/mass. Comparison of density assessment between the automated method and manual segmentation demonstrates good consistency with an accuracy of 85.7%. Quantitative comparison of corresponding tissue volumes, which uses overlap ratio, gives an average similarity of 74.54%, consistent with values seen in MRI brain segmentations. Thus, our proposed method exhibits great potential as an automated approach to segment 3D whole breast ultrasound volumes into functionally distinct tissues that may help to correct ultrasound speed of sound aberrations and assist in density based prognosis of breast cancer.
Keywords: breast ultrasound, 3D image segmentation, assisted diagnosis, medical imaging
1. Introduction
Breast cancer is one of the most commonly diagnosed cancers in women worldwide and is one of the leading causes for cancer mortality among women [1]. Currently, X-ray mammography is the most effective and widely deployed method for detecting and diagnosing breast cancer [2]. Initially an adjunct to mammography, breast ultrasound imaging has been playing a progressively more important role in image-guided interventions and therapy [3] due to its low cost, lack of ionizing radiation, and real-time interactive visualization of underlying anatomy [4].
Occasionally, limitations of conventional two-dimensional (2D) ultrasound imaging, such as suboptimal projection angle, make it difficult to discern a suspicious finding from an imaging artifact. Compared to 2D ultrasound imaging, 3D ultrasound imaging allows the clinician to examine, visualize, and interpret the patient's 3D anatomy immediately [5].
Image segmentation is of great importance to computer assisted breast cancer diagnosis and for treatment [6]. Due to the increasing use of 3D breast ultrasound imaging for disease diagnosis, computer assistance if even more effective in helping clinicians evaluate the images [7]. However, manually segmenting whole 3D ultrasound volumes is an exhausting process and clinically impractical [8]. Even with experienced radiologists, inter- or intra-observer differences are commonly found in breast ultrasound segmentations. Differences and inconsistencies in ultrasound interpretation call for an operator-independent method to assist diagnosis [9].
Many image segmentation methods have been developed for mass segmentation. As reported in an extensive review by Noble [10], some methods treat segmentation as a general image processing problem while others use a priori information of ultrasound.
Basic 2D mass segmentation methods include thresholding [11-15], neural network [16-23], mode-based methods such as expectation-maximization [24, 25], and deformable active contour [11, 26-30]. These methods are often utilized together with image feature information to distinguish malignant and benign masses. Feature information can include mass shape, posterior acoustic behavior, radial gradient or margin, variance or autocorrelation contrast, and distribution distortion in the wavelet coefficients [31]. In contrast, literature on 3D image segmentation is comparatively sporadic. Among them, statistical shape models (SSM) have been established as one of the most successful methods for image analysis [32]. Zhan and Shen et al. (2006) [33] use statistical shape model method to segment 3D ultrasound prostate images. Besides the correspondence issue and local appearance model, the employed search algorithm is also a major component in an SSM-based segmentation framework. A potential pitfall with local search algorithms is that they always detect a local minimum of the cost function, not the global optimum.
Interestingly, no significant work has looked at screening cases, i.e., most research assume the presence of a single, suspicious mass. In addition, mass segmentation is often performed inside an area called region of interest (ROI), selected manually by the user. For the purposes of improving breast ultrasound imaging, segmentation of all tissues is important since different tissue properties affect the propagation of ultrasound and electromagnetic waves. Hooi et al. (2014) [34] and Zhang et al. (2014) [35] both applied image correction on the reconstruction of phantom ultrasound volumes by inclusion of a priori information. These limited-angle or -aperture reconstructions require a priori information such as boundaries of major tissues, which can be obtained by all-tissue segmentation.
Furthermore, all-tissue segmentation is a potential method to obtain breast density. Breast density is a measure of the relative amount of fibroglandular tissue in the breast, both stromal and epithelial, which can be affected by various genetic, hormonal, and environmental factors [36-41]. Mammographically-determined dense breasts [42] have been correlated with a breast cancer risk 1.8 to 6.0 times that of women with lower densities [43-45]. Moon et al. (2011) has shown that ultrasound and MRI exhibit high correlation in their quantification of breast density and volume [46]. Both modalities could provide physicians with useful information on breast density.
In this study, we propose an automated 3D segmentation method to demarcate all major tissue types in 3D breast ultrasound volumes to assist correction of the images for breast cancer interpretation and diagnosis in pulse echo and speed of sound imaging. Our 3D segmentation method helps localized aberrating tissues and streamline the workflow of image segmentation of the breast, thus accelerating and promoting the use of 3D ultrasound images diagnoses. Furthermore, the proposed segmentation method has the potential to provide Breast Imaging-Reporting and Data System (BI-RADS)-critical information, including breast density; mass size, shape, and margin; echo pattern; and post-mass ultrasound features.
2. Materials and Methods
2.1 Materials
The 3D ultrasound data of human breasts was acquired using a dual-sided automated breast ultrasound system named the Breast Light and Ultrasound Combined Imaging (BLUCI) system [47] at the Department of Radiology, University of Michigan, USA.
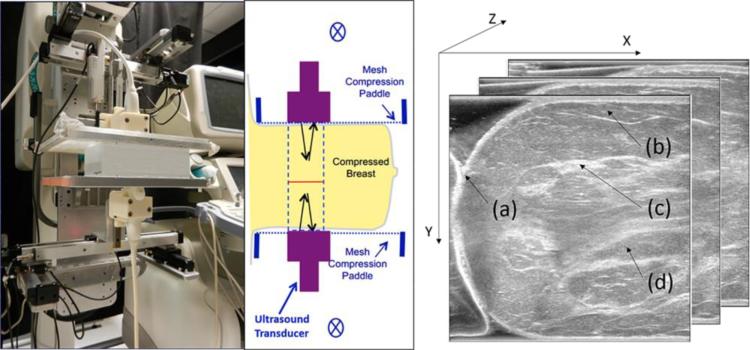
BLUCI is an ultrasound breast imaging system that allows for the acquisition of 3D ultrasound and photoacoustic volumetric imaging in the classic, mammographic geometry. As shown in Fig.1, high-frequency transducers positioned above and below the breast allow for pulse-echo acquisition of high contrast and resolution image volumes. Polyester chiffon meshes stretched over the paddle frames provide great windows for ultrasound penetration and better patient comfort than with regular mammographic compression, at the slight expense of compression on the central mammary tissues. Lithoclear ultrasound gel (NEXT Medical Products Company, North Branch, NJ) and containment apparatuses acoustically couple two GE M12L transducers (GE Health Systems, Milwaukee, WI) to the breast skin. Containment apparatuses, which consist of a gel-holding cylindrical roll of polyester mesh [48] and rubber walls [49] or a thermos-elastomer phantom material molded to a breast, help to hold the ultrasound gel in place and minimize trapping of bubbles. With the breast in compression, the transducers are swept across the paddles using a precision 6K Motion Controller system (Parker Hannifin, Cleveland, OH). The controller coordinates transducer positioning and firing sequences, given scan parameters from a control computer. The system typically acquires 250 slices with 800 μm separation over 120 seconds. Larger breasts take two, and occasionally three, sweeps for a full coverage of the breast past the nipple. The acquired volumes are spliced into a single 3D volume for interpretation of the entire breast in comparison to digital breast tomography (DBT) or mammography [50]. Overlapping areas of the sweep volumes are filtered through an arctangent function to provide smooth transitions. Top and bottom volumes are also visualized separately to aid detection and interpretation of shadow and posterior enhancement artifacts. All major tissue components of breast, such as the skin, subcutaneous fat, glandular tissue and retromammary fat are observed in the acquired view.
Fig. 1.
Left, BLUCI system with an ultrasound phantom between two mesh compression paddles and transducers in the vertical, craniocaudal (CC) view. Middle, schematic of the breast imaging geometry with ultrasound transducers scanning in and out of the plane of the figure. One to two sweeps of the 38.4 mm-long arrays are typically required to cover the whole breast. Right, acquired view of the data with the coordinate system. (a) Skin, (b) subcutaneous fat, (c) glandular tissue and (d) retromammary fat.
This study involving 21 human imaging exams was IRB approved for asymptomatic volunteers and patients with masses prior to biopsy at our health center. The dataset cases’ image size ranges from 333×456 to 579×628. Each case typically contains 250 slices. The voxel size is 0.1153mm×0.1153mm×0.8mm in X, Y, and Z directions, respectively.
2.2 Principles of the Segmentation Methodology
Our proposed segmentation approach consists of three main stages: (1) morphological reconstruction, (2) image segmentation, and (3) region classification.
2.2.1 Morphological Reconstruction
Ultrasound images are characterized by speckle noise, which degrades the image by concealing fine structures and reducing the signal-to-noise ratio (SNR) [51]. Speckle noise is the main drawback leading to over-segmentation when performing watershed segmentation. Pre-processing the images using morphological reconstruction minimizes the effect of speckle noise on segmentation performance.
Morphological reconstruction is a type of powerful morphological transformation involving one structuring element. The proposed morphological reconstruction can be defined as [52]
| (1) |
where se denotes structuring element, OR denotes opening-by-reconstruction and CR denotes closing-by-reconstruction with respect to the mask f. A 3D ellipsoid-shaped structuring element is used during morphological reconstruction to accommodate the non-isotropic voxel size. Since tissues inside the breast are continuous, neighboring slices are similar to each other while speckle noise is randomly multiplicative. Ultrasound signal and noise are statistically independent of each other, and thus, filtering in the Z direction can incorporate 3D information into the image and reduce speckle noise.
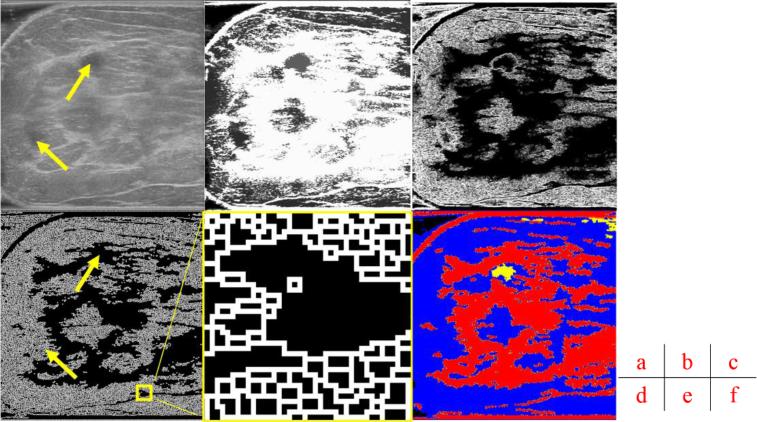
Traditional pre-processing uses smoothing filters such as a Gaussian filter to eliminate noise, which may result in smoothing out pertinent features, blurring contours, or creating an artificial offset in the contour position and area [53-56]. Compared to traditional pre-processing, morphology reconstruction can maintain the shape of the image, preventing any false contours caused by filtering operations [57]. This is accomplished by several steps of dilation and erosion operations with grayscale reconstruction. As shown in Fig. 2 (a) and (b), morphological reconstruction enhances useful information in the images by limiting peaks and minimizing speckle noise. This pre-processing step homogenizes pixels inside cysts, as shown in Fig. 2 (b), and enhances our ability to extract edge information for watershed segmentation.
Fig. 2.
Main stages of the proposed method. (a) A grayscale image slice. Top yellow arrow shows the position of a cyst. Bottom yellow arrow indicates a shadow artifact. Following operations are performed in 3D and these images are but one slice of the whole image stack. (b) Morphological reconstruction in 3D space. (c) Application of 3D Sobel operator on the images. (d) Watershed segmentation in 2D image space. The two arrows are in the same positions as (a), showing that artifact is distinguished from the cyst during pre-processing. (e) Magnified view of watershed boundaries. White pixels are the boundaries of individual watershed regions. (f) Tissue-specific region classification result.
2.2.2 Image Segmentation
Edge information extraction uses Sobel operators to obtain a gradient magnitude image for the watershed transform [58] as shown in Fig. 2 (c). 3D Sobel operators are used in order to achieve better segmentation than that obtained from 2D gradient operators, which are more sensitive to noise. The operator uses two 3×3×3 kernels which are convolved with the original image to calculate approximations of the derivatives: one for horizontal changes and one for vertical. If we define Ai as the slice i of the source image, and GXi and GYi are two images, which at each point contain the horizontal and vertical derivative approximations, and Gi gives the gradient magnitude, the computations are as follows [59]:
| (2) |
| (3) |
| (4) |
After 3D pre-processing, watershed is performed on the planes of 2D image slices instead of using time-consuming 3D segmentation. Thus Sobel operators are applied on image planes, X and Y axes shown in Fig. 1.
An example slice of image segmentation results is shown in Fig. 2 (d). White pixels are boundaries of different regions. Gray regions, such as the one denoted by the bottom yellow arrow, consist of many smaller regions as shown in Fig. 2 (e). Black regions, such as the one indicated by the top yellow arrow, represent relatively homogenous regions of low echogenicity.
2.2.3 Region Classification
After these regions with various tissue compositions are acquired using the watershed transform, region classification is performed as the final stage of the segmentation process. Normally, ultrasound images are mainly divided into two regions, big and small. The big region covers the skin, fibrous connective and glandular tissue, and cysts. The small region, covering fat and areas of no signal, still contain over-segmentation problems and are assigned to be merged. In addition, the big regions must be classified into two functionally different tissues: cyst and fibroglandular. Quantitative features were extracted from the regions in order to distinguish different tissues. In addition to the region size, we use mean intensity of regions as another criteria for classification.
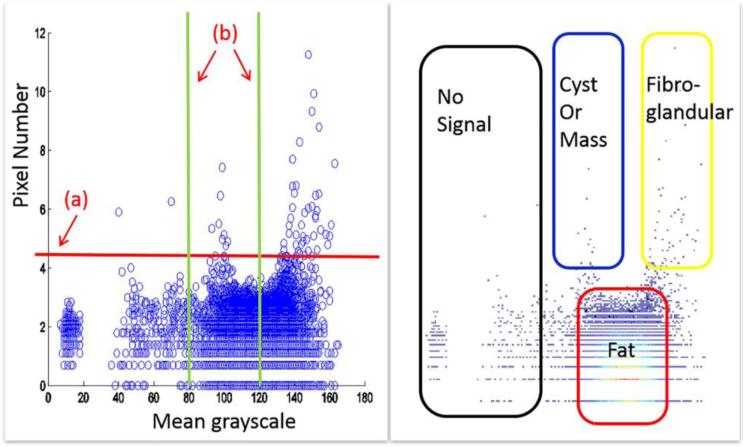
Fig. 3 shows the quantitative analysis of the sample slice. Fatty tissue regions are over-segmented and have similar characteristics. We use a single threshold value on region size to distinguish big or small regions, which correlate to fatty and non-fatty tissues. Using another threshold value of mean intensity for fibroglandular and cyst/mass differentiation, all regions are divided into four categories: no signal, fat, fibroglandular, and cyst/mass. We have empirically found that 100 pixels per region to be the best threshold value to distinguish big or small regions. With 8-bit grayscale ultrasound images, 80 and 120 are two threshold values suitable for fibroglandular and cyst/mass classification, respectively. These values were determined based on experimentation. Final result of region classification is shown in Fig. 2 (f), where each segmented region was classified into one of four categories.
Fig.3.
Region classification based on mean intensity and number of pixels per region. Left plot is a scatter plot of all watershed regions. Each circle indicates one region, showing the mean grayscale and pixel number of the region. (a) Threshold value for classification of big and small regions. (b) Threshold for mean grayscale values, or brightness. Plot on the right is an intensity map of the left plot, with the higher intensities indicating a great number of regions with the same characteristics. Four categories can be delineated: regions of no-signal, cyst/mass, fatty tissue, and fibroglandular tissue.
3. Experimental Results
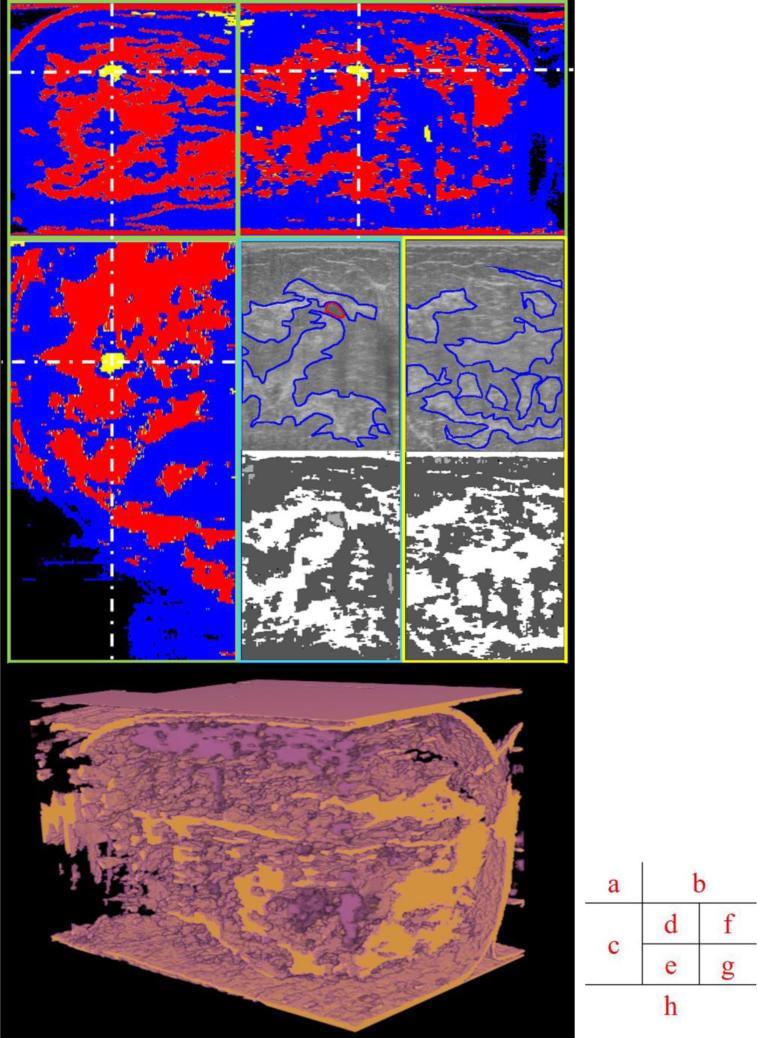
Here are several images reformatted in coronal planes that have some greater lateral variation in dense tissues. The different speeds of sound and acoustic impedances in fat and denser tissues can defocus and misdirect the ultrasound beams. If we can identify these different tissues, approximate corrections can be made in the images. As shown in Fig. 4 (d), (f), (e) and (g), segmented results show good consistency with the manual segmentation by radiologists in CC view. Fig. 4 (h) represents segmented volumes in real 3D view.
Fig.4.
Different views of original and segmented images. (a), (b) and (c) are orthogonal views of the segmented volume; (d) and (f) are original ultrasound data in the acquired CC view, with manually delineated boundaries of a cyst and major fibroglandular tissues in red and blue, respectively. (e) and (g) are segmented results of (d) and (f) in the acquired CC view. (d) and (e) are cropped regions of (b) in the same orientation. (f) and (g) are from a different slice in the same image stack. (h) is segmented volume in real 3D view. The dark purple is cyst/mass like tissue. The tan is fibroglandular tissue.
4. Quality Assessment
In order to evaluate the results of our proposed segmentation method, density assessment and overlap ratio between manual and automated segmentations were computed. The semi-manual segmentation process was aided by active contouring with seeds picked manually by an experienced breast imaging radiologist. Since the manual segmentation was performed only on fibroglandular and other internal connective tissues, the automated segmentation was processed for those tissues before the overlap ratio calculation.
One radiologist read the mammographic data of all cases and reported breast density according to the BI-RADS annotation. This dataset included two cases of almost entirely fatty breasts (B-I), ten cases with scattered areas of fibroglandular density (B-II), seven cases with heterogeneously dense breasts (B-III), and two cases with extremely dense breasts (B-IV), that comprised the ground standard for breast density by automated segmentation.
Chen's method [60] was used to calculate density from segmented breast ultrasound images as:
| (5) |
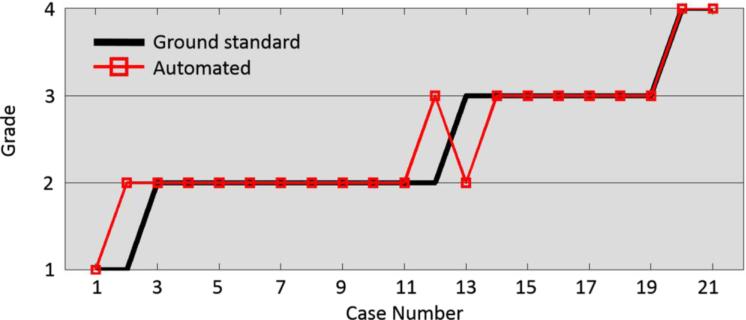
Threshold values, defined through training on all cases, yielded density classification results. They were used to classify all cases into the same four categories. Results of breast densities derived from automated segmentation and manual segmentation are shown in Fig. 5. In three cases, the proposed method disagrees by one grade with the reference observer, for an accuracy of 86%.
Fig. 5.
Density grading results of automated and ground standard (radiologist's) assessments.
A quantitative overlap measure of manual and automated segmentation is given on eight images, taken approximately every ten slices in each image stack. Similar agreements were visually observed in other cases when testing the manual segmentation software. Results of two segmentation efficacy measures are shown in Table 1. The segmentation error (SE) expresses the ratio between misclassified pixels and the breast area in percentage. The Jaccard similarity index (JSI) calculates the set intersection of manually versus automated segmentations, divided by the set union of the two segmentations:
| (6) |
| (7) |
The comparison gives an average similarity value of 75%, consistent with those seen in published MRI brain segmentations [61].
Table 1.
Quantitative comparison of manual segmentation and automated segmentation using segmentation error-SE and Jaccard similarity index-JSI
| Test image | 1 | 2 | 3 | 4 | 5 | 6 | 7 | 8 | Average |
|---|---|---|---|---|---|---|---|---|---|
| SE (%) | 6.3 | 10.2 | 10.0 | 8.0 | 7.6 | 8.6 | 5.1 | 9.3 | 8.1 |
| JSI (%) | 79.7 | 70.3 | 71.4 | 72.0 | 76.3 | 71.6 | 80.6 | 70.3 | 74.5 |
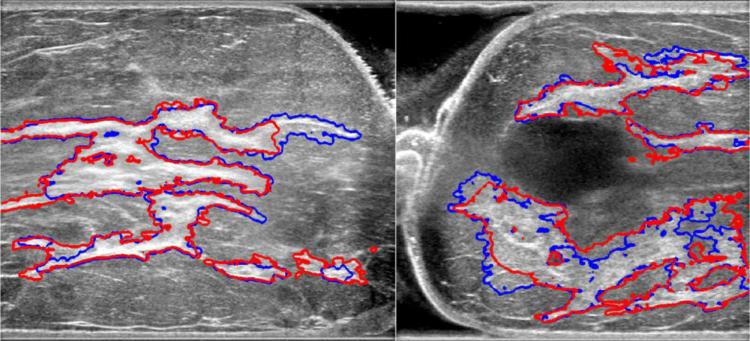
As shown in Fig. 6, automated segmentation shows good congruence with manual segmentation, while conserving detailed structures, such as small cysts inside glandular tissues. This segmentation performance can be achieved in less than five minutes. Visual analysis of figures shows that our proposed method is capable of segmenting input US images into meaningful regions compared to manual segmentation.
Fig. 6.
Comparison of manual and automated segmentation of fibroglandular tissues. Red contours are from manual segmentation, blue contours from automated segmentation.
5. Discussion
As a consequence of dual-sided imaging, shadow artifacts in this study had a minimal impact on image quality compared to regular single-sided imaging. However, since clinical ultrasound exams are acquired single-sided, these artifacts deserve more special, morphological criteria than we have provided here, as evidenced by our earlier work [62]. Within our classification system, selecting for large pixel numbers in a narrow band of grayscale values that indicates most cysts and hypoechoic lesions could also work on a certain fraction of shadow artifacts. Separating shadows from lesions is more difficult and also relies on 3D shape, orientation of upstream echogenic tissues, and its own shape parallel to the ultrasound beam axis. Until algorithms can take these advanced structural features into account, some manual correction of automated segmentation may be required to obtain the best 3D results.
Our proposed automated method was employed on a set of 21 human cases. Density assessment comparison between our method and the manual segmentation demonstrated good consistency, with an overlap ratio of 85.7%. This compares to 84.4% achieved with a proportion-based method and 87.5% for a threshold-based method in [63]. The threshold method works better on BI-RADS B-III cases, but only has an overlap ratio of 50% on B-IV cases, compared to 100% for the proposed method (Table 2). The proposed method is stable and works better on a larger range of cases.
Table 2.
Comparison between two density assessment methods
| Overlap Ratio | B-II | B-III | B-IV |
|---|---|---|---|
| Threshold method | 88.9% | 100% | 50% |
| Proposed method | 90% | 85.7% | 100% |
Quantitative comparison, which uses overlap ratio, gives an average similarity result of 74.54%. This is consistent with values seen in MRI brain segmentations. Experimental data shows that our proposed automated segmentation can find echogenic tissues and give similar segmentation results as a radiologist. Our proposed method is a stable algorithmic approach to segmenting 3D ultrasound images into functional tissues.
This automated segmentation method can separate connective and glandular tissues from fatty areas with reasonably high precision in 3D image volumes. As these tissues have different speeds of sound, our automated segmentation method holds great potential for ultrasound image corrections for major aberrations. For our group's efforts in speed of sound correction in limited angle ultrasound tomography, the proposed method can provide a priori information to the speed of sound reconstruction algorithm in the form of a covariance matrix that delineates tissues for reconstruction's initial speed of sound estimates [34]. Ultrasound aberration correction in pulse echo imaging relies on increasing signal amplitude and phase coherence of echoes. If there are phase shifts beyond π such that the wave cycle number is unknown, a speed of sound map can help resolve this ambiguity by ray tracing methods, e.g. eikonal equation [64]. Large phase shifts can occur when part of a focused beam partially passes through cancer and fat, making acceptable segmentation of posterior tumor borders less likely.
6. Conclusion
We present an efficient method for automatically segmenting 3D breast ultrasound images for the purpose of assisting detection and diagnosis of breast cancer. Segmented results on human cases indicate that our proposed method can be used to automatically distinguish fatty and non-fatty tissue. Breast density measurement using automated and manual segmentation demonstrate good agreement. Quantitative analysis results are also comparable to those in MRI segmentation. This proposed automated segmentation method has the potential to help correct aberrations in pulse echo ultrasound imaging and may easily be applicable to other modalities, such as microwave and photo-acoustic imaging such as that performed on our combined imaging system.
All major tissues segmentation: Segmentation an ultrasound image into functional tissues is of great importance for clinical breast cancer diagnosis. Many studies are found to segment masses only while few are found to segment all major tissues. The proposed method segment ultrasound images into major tissue components, which include fatty tissues, fibro-glandular tissues, cyst or tumor.
Automated segmentation on 3D ultrasound images: Manually segmenting 3D ultrasound images in their entirety is very time-consuming and impractical. The proposed fully automated segmentation method helps to eliminate differences and inconsistencies in ultrasound interpretation. No human intervention makes segmentation results operator-independent.
Good consistency with manual segmentation: The proposed automated method was deployed on a database of 21 human cases. Density assessment and overlap ratio comparison between the automated method and manual segmentation demonstrated good consistency.
Acknowledgments
This work was supported in by the National Institute of Health under grant number RO1 CA91713, the National Natural Science Foundation of China under grant number 61201425, the Natural Science Foundation of Jiangsu Province under grant number BK20131280, and the Priority Academic Program Development of Jiangsu Higher Education Institutions. Other academic contributors to the work included Eric Larson, who did some comparative segmentations, Chris Lashbrook, RT, who performed the human studies, and Dr. Brian Fowlkes, Ph.D. and Dr. Oliver Kripfgans, Ph.D., who helped design and build the dual-sided scanning system.
Footnotes
Publisher's Disclaimer: This is a PDF file of an unedited manuscript that has been accepted for publication. As a service to our customers we are providing this early version of the manuscript. The manuscript will undergo copyediting, typesetting, and review of the resulting proof before it is published in its final citable form. Please note that during the production process errors may be discovered which could affect the content, and all legal disclaimers that apply to the journal pertain.
References
- 1.Weir HK, et al. Annual report to the nation on the status of cancer, 1975–2000, featuring the uses of surveillance data for cancer prevention and control. Journal of the National Cancer Institute. 2003;95.17:1276–1299. doi: 10.1093/jnci/djg040. [DOI] [PubMed] [Google Scholar]
- 2.Parris T, Wakefield D, Frimmer H. Real world performance of screening breast ultrasound following enactment of Connecticut Bill 458. The Breast Journal. 2013;19.1:64–70. doi: 10.1111/tbj.12053. [DOI] [PubMed] [Google Scholar]
- 3.Cheng HD, et al. Automated Breast Cancer Detection And Classification Using Ultrasound Images: A Survey. Pattern Recognition. 2010;43.1:299–317. [Google Scholar]
- 4.Nelson TR, Bailey MJ. Solid object visualization of 3D ultrasound data. Medical Imaging, International Society for Optics and Photonics. 2000:26–34. [Google Scholar]
- 5.Giger ML, Karssemeijer N, Schnabel JA. Breast image analysis for risk assessment, detection, diagnosis, and treatment of cancer. Annual Review of Biomedical Engineering. 2013;15.1:327–357. doi: 10.1146/annurev-bioeng-071812-152416. [DOI] [PubMed] [Google Scholar]
- 6.Shi J. The Research Progress of Breast Ultrasound CAD with Breast Imaging and Reporting Data System. Journal of Biomedical Engineering. 2010;27.5:1169–1172. [PubMed] [Google Scholar]
- 7.Lo C, et al. Computer-aided multiview tumor detection for automated whole breast ultrasound. Ultrasonic Imaging. 2014;36.1:3–17. doi: 10.1177/0161734613507240. [DOI] [PubMed] [Google Scholar]
- 8.Chen W, et al. Technical Progress and Application of 3D Ultrasound in Breast Imaging. Chinese Journal of Medical Instrumentation. 2013;37.4:277–280. [PubMed] [Google Scholar]
- 9.Candelaria RP, et al. Breast ultrasound: current concepts. Seminars in Ultrasound, CT and MRI. 2013;34.3:213–225. doi: 10.1053/j.sult.2012.11.013. [DOI] [PubMed] [Google Scholar]
- 10.Noble JA, Boukerroui D. Ultrasound image segmentation: a survey. Medical Imaging, IEEE Transactions. 2006;25.8:987–1010. doi: 10.1109/tmi.2006.877092. [DOI] [PubMed] [Google Scholar]
- 11.Horsch K, et al. Automatic segmentation of breast lesions on ultrasound. Medical Physics. 2001;28.8:1652–1659. doi: 10.1118/1.1386426. [DOI] [PubMed] [Google Scholar]
- 12.Horsch K, et al. Computerized diagnosis of breast lesions on ultrasound. Medical Physics. 2002;29.2:157–164. doi: 10.1118/1.1429239. [DOI] [PubMed] [Google Scholar]
- 13.Horsch K, et al. Performance of computer-aided diagnosis in the interpretation of lesions on breast sonography. Academic Radiology. 2004;11.3:272–80. doi: 10.1016/s1076-6332(03)00719-0. [DOI] [PubMed] [Google Scholar]
- 14.Drukker K, et al. Computerized lesion detection on breast ultrasound. Medical Physics. 2002;29.7:1438–1446. doi: 10.1118/1.1485995. [DOI] [PubMed] [Google Scholar]
- 15.Drukker K, et al. Computerized detection and classification of cancer on breast ultrasound. Academic Radiology. 2004;11.5:526–535. doi: 10.1016/S1076-6332(03)00723-2. [DOI] [PubMed] [Google Scholar]
- 16.Shan J, Cheng HD, Wang Y. Completely Automated Segmentation Approach for Breast Ultrasound Images Using Multiple-Domain Features. Ultrasound in Medicine and Biology. 2012;38.2:262–275. doi: 10.1016/j.ultrasmedbio.2011.10.022. [DOI] [PubMed] [Google Scholar]
- 17.Jiang P, et al. Learning-based automatic breast tumor detection and segmentation in ultrasound images. Biomedical Imaging (ISBI), 2012 9th IEEE International Symposium. 2012:1587–1590. [Google Scholar]
- 18.Jesneck JL, Lo JY, Baker JA. Breast mass lesions: Computer-aided diagnosis models with mammographic and sonographic descriptors. Radiology. 2007;244.2:390–398. doi: 10.1148/radiol.2442060712. [DOI] [PubMed] [Google Scholar]
- 19.Chen CM, et al. Breast lesions on sonograms: computer-aided diagnosis with nearly setting-independent features and artificial neural networks, Radiology 226. Radiological Society of North America. 2003;226.2:504–514. doi: 10.1148/radiol.2262011843. [DOI] [PubMed] [Google Scholar]
- 20.Song JH, et al. Artificial neural network to aid differentiation of malignant and benign breast masses by ultrasound imaging. Medical Imaging, International Society for Optics and Photonics. 2005:148–152. [Google Scholar]
- 21.Joo S, et al. Computer-aided diagnosis of solid breast nodules: use of an artificial neural network based on multiple sonographic features. Medical Imaging, IEEE Transactions. 2004;23.10:1292–1300. doi: 10.1109/TMI.2004.834617. [DOI] [PubMed] [Google Scholar]
- 22.Huang YL, Wang KL, Chen DR. Diagnosis of breast tumors with ultrasonic texture analysis using support vector machines. Neural Computing and Applications. 2006;15.2:164–169. [Google Scholar]
- 23.Huang YL, Chen DR. Watershed segmentation for breast tumor in 2-D sonography. Ultrasound in Medicine and Biology. 2004;30.5:625–632. doi: 10.1016/j.ultrasmedbio.2003.12.001. [DOI] [PubMed] [Google Scholar]
- 24.Xiao GF, et al. Segmentation of ultrasound B-mode images with intensity inhomogeneity correction. Medicine Imaging, IEEE Transactions. 2002;21.1:48–57. doi: 10.1109/42.981233. [DOI] [PubMed] [Google Scholar]
- 25.Boukerroui D, et al. Segmentation of ultrasound images--multiresolution 2D and 3D algorithm based on global and local statistics. Pattern Recognition Letters. 2003;24.45:779–790. [Google Scholar]
- 26.Madabhushi A, Metaxas DN. Combining low-, high-level and empirical domain knowledge for automated segmentation of ultrasonic breast lesions. Medical Imaging IEEE Transactions. 2003;22.2:155–169. doi: 10.1109/TMI.2002.808364. [DOI] [PubMed] [Google Scholar]
- 27.Chen DR, et al. 3-D breast ultrasound segmentation using active contour model. Ultrasound in Medicine and Biology. 2003;29.7:1017–1026. doi: 10.1016/s0301-5629(03)00059-0. [DOI] [PubMed] [Google Scholar]
- 28.Chang RF, et al. Segmentation of breast tumor in three-dimensional ultrasound images using three-dimensional discrete active contour model. Ultrasound in Medicine and Biology. 2003;29.11:1571–1581. doi: 10.1016/s0301-5629(03)00992-x. [DOI] [PubMed] [Google Scholar]
- 29.Chang RF, et al. 3-D snake for ultrasound in margin evaluation for malignant breast tumor excision using mammotome. Information Technology in Biomedicine, IEEE Transactions. 2003;7.3:197–201. doi: 10.1109/titb.2003.816560. [DOI] [PubMed] [Google Scholar]
- 30.Sahiner B, et al. Computerized characterization of breast masses on three-dimensional ultrasound volumes. Medical Physics. 2004;31.4:744–754. doi: 10.1118/1.1649531. [DOI] [PubMed] [Google Scholar]
- 31.Chen DR, et al. Diagnosis of breast tumors with sonographic texture analysis using wavelet transform and neural networks. Ultrasound in Medicine and Biology. 2002;28.10:1301–1310. doi: 10.1016/s0301-5629(02)00620-8. [DOI] [PubMed] [Google Scholar]
- 32.Heimann T, Meinzer HP. Statistical shape models for 3D medical image segmentation: a review. Medical Image Analysis. 2009;13.4:543–563. doi: 10.1016/j.media.2009.05.004. [DOI] [PubMed] [Google Scholar]
- 33.Zhan YQ, Shen DG. Deformable segmentation of 3D ultrasound prostate images using statistical texture matching method. Medical Imaging, IEEE Transactions. 2006;25.3:256–272. doi: 10.1109/TMI.2005.862744. [DOI] [PubMed] [Google Scholar]
- 34.Hooi FM, Carson PL. First-arrival traveltime sound speed inversion with a priori information. Medical Physics. 2014;41.8:082902. doi: 10.1118/1.4885955. [DOI] [PMC free article] [PubMed] [Google Scholar]
- 35.Zhang X, et al. Improved digital breast tomosynthesis images using automated ultrasound. Medical Physics. 2014;41.6:061911. doi: 10.1118/1.4875980. [DOI] [PMC free article] [PubMed] [Google Scholar]
- 36.Johansson H, et al. Relationships between circulating hormone levels, mammographic percent density and breast cancer risk factors in postmenopausal women. Breast Cancer Research and Treatment. 2008;108.1:57–67. doi: 10.1007/s10549-007-9577-9. [DOI] [PubMed] [Google Scholar]
- 37.Boyd NF, et al. Heritability of mammographic density, a risk factor for breast cancer. New England Journal of Medicine. 2002;347.12:886–894. doi: 10.1056/NEJMoa013390. [DOI] [PubMed] [Google Scholar]
- 38.Ziv E, et al. Mammographic breast density and family history of breast cancer. Journal of the National Cancer Institute. 2003;95.7:556–558. doi: 10.1093/jnci/95.7.556. [DOI] [PubMed] [Google Scholar]
- 39.Stone J, et al. The heritability of mammographically dense and nondense breast tissue. Cancer Epidemiology Biomarkers and Prevention. 2006;15.4:612–617. doi: 10.1158/1055-9965.EPI-05-0127. [DOI] [PubMed] [Google Scholar]
- 40.Irwin ML, et al. Physical activity, body mass index, and mammographic density in postmenopausal breast cancer survivors. Journal of Clinical Oncology. 2007;25.9:1061–1066. doi: 10.1200/JCO.2006.07.3965. [DOI] [PMC free article] [PubMed] [Google Scholar]
- 41.Brisson J, et al. Synchronized seasonal variations of mammographic breast density and plasma 25-hydroxyvitamin d. Cancer Epidemiology Biomarkers and Prevention. 2007;16.5:929–933. doi: 10.1158/1055-9965.EPI-06-0746. [DOI] [PubMed] [Google Scholar]
- 42.Boyd NF, et al. Mammographic breast density as an intermediate phenotype for breast cancer. Lancet Oncology. 2005;6:798–808. doi: 10.1016/S1470-2045(05)70390-9. [DOI] [PubMed] [Google Scholar]
- 43.Boyd NF, et al. Mammographic density and the risk and detection of breast cancer. New England Journal of Medicine. 2007;356.3:227–36. doi: 10.1056/NEJMoa062790. [DOI] [PubMed] [Google Scholar]
- 44.McCormack VA, Silva IDS. Breast density and parenchymal patterns as markers of breast cancer risk: a meta-analysis. Cancer Epidemiology Biomarkers and Prevention. 2006;15.6:1159–1169. doi: 10.1158/1055-9965.EPI-06-0034. [DOI] [PubMed] [Google Scholar]
- 45.Vachon CM, et al. Longitudinal trends in mammographic percent density and breast cancer risk. Cancer Epidemiology Biomarkers and Prevention. 2007;16.5:921–928. doi: 10.1158/1055-9965.EPI-06-1047. [DOI] [PubMed] [Google Scholar]
- 46.Moon WK, et al. Comparative Study of Density Analysis Using Automated Whole Breast Ultrasound and MRI. Medical Physics. 2011;38.1:382–389. doi: 10.1118/1.3523617. [DOI] [PMC free article] [PubMed] [Google Scholar]
- 47.Carson Paul L. TU-E-220-02: Combined Pulse Echo, X-Ray Tomosynthetic, Photoacoustic and Speed of Sound Imaging in the Mammographic Geometry. Medical Physics. 2011;38.6:3775–3775. [Google Scholar]
- 48.Padilla F, et al. Breast Mass Characterization Using 3-Dimensional Automated Ultrasound as an Adjunct to Digital Breast Tomosynthesis A Pilot Study. Journal of Ultrasound in Medicine. 2013;32.1:93–104. doi: 10.7863/jum.2013.32.1.93. [DOI] [PMC free article] [PubMed] [Google Scholar]
- 49.Li J, et al. Effect of a gel retainment dam on automated ultrasound coverage in a dual-modality breast imaging system. Journal of Ultrasound in Medicine. 2010;29.7:1075–1081. doi: 10.7863/jum.2010.29.7.1075. [DOI] [PMC free article] [PubMed] [Google Scholar]
- 50.Carson PL, et al. Dual sided automated ultrasound system in the mammographic geometry. Ultrasonics Symposium (IUS) 2011 IEEE International. 2011:2134–2137. [Google Scholar]
- 51.Yu YJ, Acton ST. Speckle reducing anisotropic diffusion. Image Processing, IEEE Transactions. 2002;11.11:1260–1270. doi: 10.1109/TIP.2002.804276. [DOI] [PubMed] [Google Scholar]
- 52.Gonzalez RC, Woods RE. Digital image processing. Pearson Education India. 1992:484–486. [Google Scholar]
- 53.Jung CR. Combining wavelets and watersheds for robust multiscale image segmentation. Image and Vision Computing. 2007;25.1:24–33. [Google Scholar]
- 54.Jung CR, Scharcanski J. Robust watershed segmentation using wavelets. Image and Vision Computing. 2005;23.7:661–669. [Google Scholar]
- 55.Kim JB, Kim HJ. Multiresolution-based watersheds for efficient image segmentation. Pattern Recognition Letters. 2003;24.1:473–488. [Google Scholar]
- 56.Patino L. Fuzzy relations applied to minimize over segmentation in watershed algorithms. Pattern Recognition Letters. 2005;26.6:819–828. [Google Scholar]
- 57.Ji QH, Shi RG. A novel method of image segmentation using watershed transformation.. Computer Science and Network Technology (ICCSNT), 2011 International Conference.2011. pp. 1590–1594. [Google Scholar]
- 58.Meyer F. Topographic distance and watershed lines. Signal Processing. 1994;38.1:113–125. [Google Scholar]
- 59.Sukmarg O, Rao KR. Fast object detection and segmentation in MPEG compressed domain. TENCON 2000, Proceedings, IEEE. 2000;3:364–368. [Google Scholar]
- 60.Chen JH, et al. Breast density analysis for whole breast ultrasound images. Medical Physics. 2009;36.11:4933–4943. doi: 10.1118/1.3233682. [DOI] [PubMed] [Google Scholar]
- 61.Rivera M, Ocegueda O, Marroquin JL. Entropy-controlled quadratic Markov measure field models for efficient image segmentation. Image Processing, IEEE Transactions. 2007;16.12:3047–3057. doi: 10.1109/tip.2007.909384. [DOI] [PubMed] [Google Scholar]
- 62.Sinha S, et al. Ultrasonics Symposium (IUS) IEEE; 2010. Machine learning for noise removal on breast ultrasound images. pp. 2020–2023. [Google Scholar]
- 63.Chang RF, et al. Breast Density Analysis in 3-D Whole Breast Ultrasound Images. Engineering in Medicine and Biology Society (EMBS) Annual International Conference. 2006;1:2795–2798. doi: 10.1109/IEMBS.2006.260217. [DOI] [PubMed] [Google Scholar]
- 64.Tarantola A. Inverse problem theory and methods for model parameter estimation. Siam. 2005 [Google Scholar]


