

Abstract

This article contributes a highly accurate model for predicting the melting points (MPs) of medicinal chemistry compounds. The model was developed using the largest published data set, comprising more than 47k compounds. The distributions of MPs in drug-like and drug lead sets showed that >90% of molecules melt within [50,250]°C. The final model calculated an RMSE of less than 33 °C for molecules from this temperature interval, which is the most important for medicinal chemistry users. This performance was achieved using a consensus model that performed calculations to a significantly higher accuracy than the individual models. We found that compounds with reactive and unstable groups were overrepresented among outlying compounds. These compounds could decompose during storage or measurement, thus introducing experimental errors. While filtering the data by removing outliers generally increased the accuracy of individual models, it did not significantly affect the results of the consensus models. Three analyzed distance to models did not allow us to flag molecules, which had MP values fell outside the applicability domain of the model. We believe that this negative result and the public availability of data from this article will encourage future studies to develop better approaches to define the applicability domain of models. The final model, MP data, and identified reactive groups are available online at http://ochem.eu/article/55638.
Introduction
Predicting melting points (MPs) is very important for medicinal and environmental chemistry, as the MP is frequently used as one of the parameters to estimate the solubility of chemical compounds by means of Yalkowsky general solubility equation (GSE)1 or/and similar approaches.2,3 The recent increase in interest in MP prediction is connected with the development of green chemistry and ionic liquids.4 The MP is also an important parameter in multimedia models used to assess the hazardousness of chemical compounds in REACH. There are several comprehensive reviews describing multiple areas of application of MP as well as computational methods to predict it.5−7 The general conclusion of these reviews is that predicting MP remains very challenging. The MP is determined by crystal packing and the 3D structure of molecules in a crystal, which is still very difficult to model.8 The complex interactions, which include electrostatic, van der Waals, hydrogen bond formation (both internal and between molecules), and aromatic stacking as well as the flexibility and symmetry of molecules are all important for the computational prediction of MPs of molecules.
While explicit modeling of MPs considering all these types of interactions is beyond the current state of the art (and, probably, will remain so for a while), machine-learning methods that exploit statistical properties of data are used as a pragmatic approach to model it. The numerous publications using this approach have reported state-of-the art methods, achieving a prediction of MP in the range of 30–50 °C.4,9−14 The accuracy of the models varied depending on the sets (e.g., ionic liquids, drug-like compounds, etc.) and validation methods (e.g., leave-one-out, test set performance, etc.) used; they thus cannot be easily compared across publications. Not only the quality and diversity of the data but also, importantly, the availability of computational descriptors to characterize this property were cited as main reasons for difficulties with prediction.15 Thus, using more diverse descriptors could possibly produce better results in computational modeling of MPs. This idea motivated us to model MPs using different sets of descriptors available to us as part of the Online Chemical Modeling Environment (OCHEM).16
Despite MP being relatively easy to measure and, until recently, an obligatory parameter for quality assurance and publication of new chemical structures, there are surprisingly limited data for this property. To our knowledge, the largest data sets used hitherto include about 5k compounds10−12 and are mainly based on the data set compiled by Karthikeyan et al.13 This is probably related to the difficulty of modeling this complex property: the poor performance of the developed models may have discouraged modelers from collecting experimental data on it. The lack of availability of MP data and the negative impact of this absence for the development of models to predict MP and water solubility was realized by the Open Notebook Science (ONS) community (http://onswebservices.wikispaces.com/meltingpoint), in particular by Prof. J. V. Bradley, who started the tedious work of collecting MP values. Recently, ONS has contributed a large highly curated set,17 which was double-validated to contain only reliable data that have multiple reported measurements within 5 °C. ONS also published several models on their Web site, which refer to different time points of collection and curation of data. However, no active use of these data has been reported so far outside the ONS community. For example, the “ONS Melting Point Collection” with an excellent, highly curated data set of 2,706 compounds published in Nature Precedings18 has gained only one citation on Google Scholar since 2011. Thus, one of the goals of this article was to promote the excellent data collected by ONS to a wider scientific community.
In previous studies, only the average performance of MP models was provided, without indication of their profiles across the temperature range. The basis of such reporting is an implicit assumption that the reported average accuracy will remain about the same for new predictions (or at least for predictions that are within the applicability domain19,20 of the model). However, from the final user’s perspective not all predictions are equally important, only those that are relevant to his or her studies. For example, a specialist working with ionic liquids might be mainly interested in accurate prediction of compounds that could melt at room temperature; a medicinal chemist needs a model for a wider interval of MP but perhaps does need one for compounds that melt above 500 °C. However, until now there has been no comprehensive study on which temperature interval is covered by drug-like compounds and whether the expected model accuracy is the same across the range. This question provided a further motivation for this study.
In addition to the reasons already mentioned, the main goal of this article was to develop a high quality model to predict MPs for drug-like compounds, using the largest available set of compounds with MP data, and to analyze the model’s performance with respect to data coverage and quality.
Data
Four data sets were used. The first two were employed as “gold standards” to test the algorithms developed using the two other sets.
The “Bergström set” included 277 drug-like compounds compiled by Bergström et al.14 This set was used to test the prediction performance of MP models in several earlier studies.
The “Bradley set” of 3,041 compounds was the second “gold standard” set.17 This set comprised compounds with two or more measurements reported in the literature; they were manually curated by the authors. Since 155 compounds from this data set were also included in the Bergström set, we excluded them to maintain nonoverlapping compilations.
The OCHEM data set was compiled using data available at the Online Chemical Modeling Environment (OCHEM).16 Four major sources of experimental data were used: the ChemExper database,21 the Estimation Program Interface (EPI),22 the Molecular Diversity Preservation International Database (MDPI),23 and the ONSMP challenge data set.24 Additional data were drawn from about 40 individual articles uploaded to the OCHEM database by users as well as data collected on the QSPR Thesaurus Web site of the CADASTER project.25
Any intersections between the sources were eliminated: in case of duplicate measurements from different sources, the earliest published article was selected using the OCHEM “Primary record” function. This utility searches for the earliest record with an identical published experimental value. After filtering of salts and mixtures, molecules that failed for at least one descriptor calculation program, and compounds overlapping with either of the two gold test sets, the OCHEM training data set included 21,883 molecules.
The Enamine data set was provided by Enamine Ltd.,26 one of the leading suppliers of chemicals in the world. The company contributed 30,640 compounds, sampled from more than >1.5 M compounds in stock. They were measured, using the same protocol and as specified in the operation and service manual, with the MPA100 OptiMelt automated melting point system.27 As with the preparation of the OCHEM set, first salts, mixtures, and compounds that failed for at least one descriptor calculation program were eliminated. Second, we eliminated compounds that were included in the OCHEM and “gold test” sets, thus leaving 22,404 compounds. The modeling of data spoiled a group of 117 molecules that had reported values of 16–18 °C. These were molecules that were soluble at room temperature. The company did not measure them at lower temperatures to identify their correct MPs. These molecules were used with a range value (<17 °C) for the development of models using neural networks.
The data in the Enamine set were measured using the same technique and experimental protocol, while the data in other sets came from different sources. The quality of measurements in the Bergström and Bradley sets was high due to strict manual curation of experimental data in both sets.
Methods
Machine-Learning Approaches
A preliminary analysis included a set of five machine-learning methods, namely Associative Neural Network,28−30 Partial Least Squares (PLS), Support Vector Machines, Multiple Linear Regression (MLR), and k Nearest Neighbors. The default parameters of the methods, as specified on the Online Chemical Database and Modeling Environment Web site,31 were used for model development. We found (data not shown) that ASNN gave results that were statistically similar to the LibSVM method. At the same time, both these methods contributed significantly better models (Root Mean Squared Error (RMSE) lower by 5–10 °C) compared to the other investigated approaches. Since training of the ASNN was faster and resulted in smaller models compared to LibSVM, we used the neural networks for all studies in this article. Moreover, the ASNN method can develop models with ranges and intervals, which are fully supported by OCHEM and were present in the analyzed data.
Descriptors
Eleven descriptor packages, available at OCHEM, were used to provide a high diversity of representation of chemical structures for MP modeling. Below we give a brief description of the packages used.
Estate32 refers to electrotopological state indices that are based on chemical graph theory. E-State indices are 2D descriptors that combine the electronic character and topological environment of each skeletal atom.
ISIDA (in Silico Design and Data Analysis) Fragments
These 2D descriptors are calculated with the help of the ISIDA Fragmenter tool,33 developed at the Laboratoire de Chemoinformatique of the University of Strasbourg. Compounds are split into Substructural Molecular Fragments (SMF) of (in our case) lengths 2 to 4. Each fragment type comprises a descriptor, with the number of occurrences of the fragment type as the respective descriptor value. In this study, we used the sequence fragments composed of atoms and bonds.
GSFragments
GSFrag and GSFrag-L34 are used to calculate 2D descriptors representing fragments of length k = 2...10 or k = 2...7, respectively. Similar to ISIDA, descriptor values are the occurrences of specific fragments. GSFrag-L is an extension of GSFrag: it considers labeled vertices in order to take heteroatoms of otherwise identical fragments into account.
CDK (3D)
CDK (Chemistry Development Kit)35 is an open source Java library for structural chemo- and bioinformatics. It provides the Descriptor Engine, which calculates 246 descriptors containing topological, geometric, electronic, molecular, and constitutional descriptors.
Dragon v. 6 (3D)
Dragon is a software package from Talete36 that calculates 4885 molecular descriptors. They cover 0D - 3D space and are subdivided into 29 different logical blocks. Detailed information on the descriptors can be found on the Talete Web site (http://www.talete.mi.it/).
Chemaxon Descriptors (3D)
The Chemaxon Calculator Plugin produces a variety of properties. Only properties encoded by numerical or Boolean values were used as descriptors. They were subdivided into seven groups, ranging from 0D to 3D: elemental analysis, charge, geometry, partitioning, protonation, isomers, and others.
Adriana.Code37 (3D), developed by Molecular Networks GmbH, calculates a variety of physicochemical properties of a molecule. The 211 resulting descriptors range from 0D descriptors (such as molecular weight, or atom numbers) to 1D, 2D, and various 3D descriptors.
ToxAlert functional groups were used as an additional set of descriptors. These descriptors included about 500 groups covering different functional features of molecules. The groups are based on classifications provided by the CheckMol software,38 which was extended to cover new groups, in particular heterocycles.
The descriptor packages with (3D) in their description require 3D structures of the molecules. To determine 3D conformations, we used Corina,39 which is integrated in OCHEM via a web interface.
Model Validation
Cross-validation (CV) was used. In this technique, the set was randomly split into N folds and respective N models were developed. Each of the models had one of the folds as a validation set, and the remaining N–1 folds were used as the respective training sets. The predictive ability of the final model was estimated as the accuracy of the individual N cross-validation models for the prediction of the respective validation sets. In our study, we used a 5-fold cross-validation protocol for all studies. The CV results calculated for the models are reported here and were used to estimate the performance of the final model, which was built using all available data. The same protocol was used for all models developed in this article. Thus, training and validation sets were always the same for all models.
Consensus Modeling
The individual models were combined in the consensus model, which was calculated as a simple average. Since the individual models were validated using the 5-fold CV, the consensus model was also validated using the same protocol.
Estimation of the Performance of the Models
For all analyses we used Root Mean Squared Error
where Ycalci and Yexp are calculated and experimental MP values, and summation is over all N molecules in the analyzed set, as the accuracy of models. We used RMSE only, since this measure provides a straightforward interpretation of results; further, we did not want to overload the article with other statistical coefficients.
Estimation of the Prediction Accuracy
The prediction accuracy assessment was based on the notion of distance to models (DMs). DMs are numeric measures of prediction reliability that estimate how “far” the predicted compound is from the model. There are numerous examples of DMs, and a comprehensive description of this methodology can be found in the literature.40−42
In this study, we used the CONSENSUS-STD as a DM. This DM provided the best estimation of the prediction accuracy for both regression and classification models.40,41 It corresponds to the disagreement of individual models, m = 1,...,N
to predict the average (consensus) value y̅j for molecule j.
The main assumption for DMs is that they correlate with prediction accuracy. On average, higher DM values correspond to higher prediction errors and, therefore, lower prediction accuracy. This allows the prediction accuracy to be estimated using the so-called accuracy averaging technique.42 Once DM values are calculated for all molecules, the dependency of the absolute errors of the consensus model as a function of the DM is calculated using a moving average over a sliding window. We assume that the calculated errors increase monotonically with DM but for each fixed DM value are provided by a normal distribution N(0,σ(ΔM)). Once the DM values are calculated for a new set, this function is used to estimate the prediction errors for it.
Calculation of Confidence Intervals
All the statistical parameters were complemented with their respective confidence intervals. OCHEM calculates the confidence for each statistical parameter using a bootstrap procedure, i.e., using random sampling with replacement, as described elsewhere.43 For the estimation, the analyzed values (e.g., errors between predicted and experimental measurements or predicted calculated errors) are used to generate N = 1,000 data sets of the same size as the analyzed set using the bootstrap. The statistical parameters are then calculated for each bootstrap set, thus generating the respective distributions with N = 1,000 values. The confidence intervals are determined using the 2.5 percentile and the 97.5 percentile of the distributions.
Significance
We considered that there was a significant difference of some statistical parameter if the confidence intervals calculated for two analyzed values of the parameter did not overlap. This corresponded to a significance level of p-value <0.05.
Results
Analysis of Duplicated Values
The OCHEM and Enamine data sets shared n = 3,135 unique compounds, and there were n = 764 duplicated compounds in the Enamine and Bradley sets. However, since the most of the Enamine data were previously supplied together with compound libraries, there was a possibility that some of these values were included as part of the OCHEM and Bradley sets. The majority of Enamine MP values were reported as intervals, ranging from 1 to 42 °C with a std of 2 °C. In contrast, the majority of MP values in the OCHEM data set were reported as single values. Since only a few databases and data-modeling approaches support data as intervals, it is possible that users converted intervals to single values by taking the mean, minimum, or maximum temperature as the experimental MP value. Indeed, the distribution of temperature differences between molecules found both in Enamine and in the OCHEM and Bradley sets showed large peaks near 0 ± 5 °C. These peaks covered 77% and 91% of the observed temperature differences between the Enamine/OCHEM and Enamine/Bradley data sets, respectively. It is interesting that within these peaks, the average differences were −0.9 °C and −0.2 °C for OCHEM/Enamine and Bradley/Enamine, respectively. This suggests that the general strategy of converting intervals to single values may have been to use the lower temperature as the reported experimental MP value.
There were 150 and 21 pairs of measurements with absolute differences of more than 50 °C in the Enamine/OCHEM and Enamine/Bradley data sets, respectively. In fact, all 21 molecules from the Bradley set were also part of the OCHEM set. In addition to experimental variability, compounds with large differences in MP values could appear due to different isoforms, different crystalline, amorphous, or hydrate forms, or major errors such as incorrect units, sign, etc. Indeed, of 150 pairs with large differences, 15 were from the previously identified problematic group of 117 molecules from the Enamine data set, and 13 molecules were salts and mixtures excluded in data-cleaning.
Analysis of CV Results
The models were developed using 11 descriptor sets. The performances of all the models are reported as Supporting Information, while the results of the best individual and consensus models are given in Tables 1 and 2.
Table 1. RMSE of Models Developed Using the OCHEM Set.
| method | CV, training set | Bradley | Bergström | Enamine |
|---|---|---|---|---|
| ASNN best (Estate) | 41.6 ± 0.4 (38.3)a | 36.6 ± 0.6 (37.1) | 36 ± 2 (34) | 43.1 ± 0.3 (38.7) |
| ASNN best (Estate) – outliers filtered | 41.4 ± 0.4 (38.3) | 36.2 ± 0.6 (37.8) | 36 ± 2 (34) | 42.3 ± 0.3 (37.8) |
| ASNN consensus | 39.2 ± 0.3 (34.8) | 33.9 ± 0.6 (33.1) | 34 ± 1 (31) | 40.1 ± 0.3 (34.6) |
| ASNN consensus outliers filtered | 39.5 ± 0.3 (35.2) | 33.9 ± 0.6 (34.4) | 34 ± 1 (31) | 39.9 ± 0.3 (34.4) |
Values in parentheses are calculated for compounds with experimental MP values in [50; 250] °C drug-like interval.
Table 2. RMSE of Models Developed Using the Enamine Set.
| method | CV, training set | Bradley | Bergström | OCHEM |
|---|---|---|---|---|
| ASNN best (Estate) | 38.7 ± 0.3 (33.9)a | 66 ± 1 (40) | 44 ± 3 (42) | 54.6 ± 0.4 (44.7) |
| ASNN best (Estate) – outliers filtered | 38.3 ± 0.3 (33.8) | 64 ± 1 (40.3) | 43 ± 3 (39) | 53.8 ± 0.4 (44.5) |
| ASNN consensus | 37.2 ± 0.3 (31.5) | 73 ± 1 (33.9) | 36 ± 2 (33) | 51.9 ± 0.4 (36.6) |
| ASNN consensus outliers filtered | 36.8 ± 0.3 (31.3) | 71 ± 1 (33.8) | 36 ± 2 (33) | 51.2 ± 0.4 (36.6) |
Values in parentheses are calculated for compounds with experimental MP values in [50; 250]°C drug-like interval.
The Enamine data set had a lower cross-validated RMSE (2–5 °C) for the training set compared to the OCHEM set. This result may indicate a higher consistency of data and/or smaller diversity of molecules in this set compared to the OCHEM set. Indeed, molecules from the Enamine set are MPs of drug-like compounds produced by one chemical provider. These data were measured using the same protocol for compounds with similar purities. In contrast, the the OCHEM set included data from various sources.
The ASNN consensus models provided significantly smaller cross-validated RMSEs than the best individual models for both sets.
Test Set Performances
The models developed using both sets give similar performances for the Bergström drug-like data set. This set has been used as a gold standard in several studies.13,15,44,45 The results calculated in the current study have the lowest RMSE of published results for this set.
Models developed using the OCHEM data set provided excellent accuracy for prediction of the Bradley set. The consensus model achieved 33.9 ± 0.5 °C on this high quality, manually curated data set. It also performed well for the Enamine data set, with a RMSE of 40.1 °C, which is 3 °C higher than the consensus CV RMSE of 37.2 °C obtained for the same set.
However, models developed with the Enamine data set failed to predict the Bradley and OCHEM sets. The RMSE of the consensus ASNN models for the Bradley set (73 °C) was more than twice that obtained for models developed using the OCHEM data set. The consensus model predicted molecules from the OCHEM set with an RMSE of 51.9 °C, which is more than 12 °C higher than the best CV RMSE obtained for this set. Thus, if only the OCHEM or Bradley set is used to judge the accuracy of predictions, we could conclude that models based on the Enamine set perform poorly.
The distributions of MPs of compounds in four analyzed sets (Figure 1) are rather different. The drug-like molecules, which comprise the Bergström set as well as lead-like compounds provided by Enamine, have MP values centered around 150 °C. Indeed, >90% of molecules in both these sets are within the interval [50,250]°C. Prediction of molecules from this “drug-like” region is of the greatest interest for medicinal chemists. The distribution of compounds in the OCHEM set generally resembles those in the two previous sets, with the exception of a large number of compounds in the low temperature region. The most prominent data set is Bradley. This data set has the largest number of compounds in the region [0,50]°C and many compounds in the low temperature region.
Figure 1.
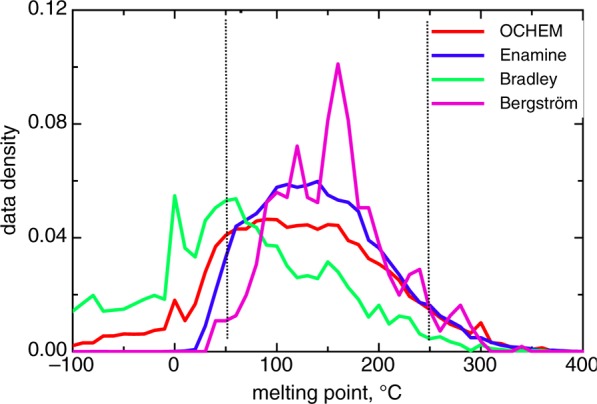
Data distribution in analyzed sets. Dashed lines indicate the drug-like region. Enamine molecules (n = 117) soluble at the room temperature were excluded from the analysis.
Figure 2 shows that both consensus models had excellent accuracy for the central part of the “drug-like” region. The Enamine model calculated an RMSE <30 °C for subsets of analyzed sets, which had molecules with MP in the [60,180]°C interval. The OCHEM consensus model had an RMSE >30 °C for the same tests. This interval incorporated 73%, 65%, 53%, and 39% molecules from the Bergström, Enamine, OCHEM, and Bradley data sets, respectively. For example, in this interval the accuracy of the Enamine model 29.7 ± 0.5 °C was significantly higher than the CV results of the OCHEM model 32.2 ± 0.5 °C for the same molecules from the OCHEM set.
Figure 2.

RMSE of consensus models as a function of the experimental MP. The lowest calculated RMSE are about 30 °C which are still higher than estimated experimental accuracy of the data. Enamine molecules (n = 117) soluble at the room temperature were excluded from the analysis.
Extending our analysis to the whole “drug-like” interval [50,250]°C, both consensus models gave similar performances in the range of 31 to 37 °C (see Tables 1 and 2). The CV results of the training sets of both consensus models were better for 1.5–3 °C than in their use as tests sets. This was expected, since the diversity of chemical compounds was the same for the training and validation sets for the CV results.
The OCHEM consensus model had a smaller RMSE for compounds with low MP values for both the OCHEM and the Bradley set. However, this result is probably not applicable to “drug-like” compounds. Indeed, for Enamine and Bergström molecules the RMSE increased for MP < 100 °C for both consensus models. Thus, models have difficulties in accurate prediction of MPs with low temperature for drug-like compounds. However, this issue may not be of great relevance for medicinal chemistry, since molecules soluble at room temperature are likely to have high solubility, which will not be a limiting factor for drug optimization.
The least positive observation was that both models had difficulties predicting molecules with high MPs. The development of the errors for high temperature values was very similar for CV and the Enamine test when using the OCHEM consensus model. The errors increased less for CV results of the consensus Enamine model. This may be due to a greater consistency and quality of the Enamine data set. Presumably due to the greater diversity of its training set, the OCHEM model was more accurate for molecules with high temperature values for the Bergström set.
Filtering of Outliers
Molecules with large differences between predicted and calculated values could appear due to errors during data collection, or they could reflect some fundamental properties of data that were not learned by the machine-learning algorithm. They could also appear just by chance due to statistical properties of noise present in the data. Table 3 reports the number of observed and expected molecules with large errors for both training sets. The respective thresholds for detection of outlying molecules in the consensus models were calculated based on the assumption that prediction residuals follow a normal distribution. For p = 0.05 both numbers were about the same, while for smaller p-values the proportion of molecules with large errors was significantly higher than can be expected for a normal distribution.
Table 3. Number of Outlying Compounds with Large Differences between Experimental and Predicted Values for the Consensus Models.
| OCHEM |
ENAMINE |
|||
|---|---|---|---|---|
| significance value | estimated | observed | estimated | observed |
| p = 10–5 | 0.22 | 45 | 0.22 | 52 |
| p = 10–4 | 2.2 | 82 | 2.2 | 99 |
| p = 10–3 | 22 | 165 | 22 | 183 |
| p = 0.01 | 219 | 394 | 224 | 427 |
| p = 0.05 | 1094 | 957 | 1120 | 1034 |
We used p = 0.01 to filter out the outlying molecules and recalculated the models. However, in order not to bias comparison by excluded molecules, all molecules were used for calculation of RMSE. The filtering of outliers improved the statistics of individual models. Of 33 predictions (11 individual models × 3 different sets), for 25 and 22, respectively, the RMSE decreased, while 6 predictions remained the same for outlier-free models for the OCHEM and Enamine data sets. A similar decrease was observed for CV results. However, many of the changes in individual model performance were not significant. Not surprisingly, there were no significant changes of RMSE for the consensus models either, while CV results for the OCHEM model even increased.
Analysis of Outliers
For the OCHEM and ENAMINE sets, 394 and 427 compounds were identified as outliers. These outliers corresponded to less than 2% of the respective training set. The ENAMINE outliers had RMSEs of about 129 and 130 °C when predicted by the ENAMINE and OCHEM consensus models, respectively. The same was true for OCHEM outliers, which had RMSEs of about 144 °C when predicted by both consensus models. Thus, the outliers were not artifacts of the respective training sets.
A large number of the outlying compounds, N = 71, of the Enamine set were compounds with <17 °C values. This is not surprising, considering that these compounds had extreme MP values for the Enamine set, and their MPs were not correctly experimentally determined. We therefore excluded these compounds from further analysis.
The outliers from the OCHEM data set were analyzed for possible errors by searching the literature to confirm their experimental data. The analysis identified that for three outlying compounds, the provided values were for the salt form. These compounds were excluded from further analysis. In three cases the error was reporting of wrong units (K instead of °C), and in two cases the minus sign was missed. For 45 other compounds additional experimental values were found. Using the new values decreased the RMSE of the consensus model from 170 to 43 °C for n = 51 compounds.
The remaining 696 compounds were analyzed to identify which molecular features could contribute to low prediction accuracy for these compounds. Both chemical functional groups and functional alerts used by chemical providers and pharma companies to flag reactive and unstable groups were calculated using ToxAlerts.46 The frequencies of groups in the set of outlying molecules were compared to those in the combined OCHEM+ENAMINE set, using the SetCompare module integrated into the OCHEM platform. We found that functional groups that could lead to degradation of chemicals and thus decomposition during storage or/and heating were significantly overrepresented in the set of outlying compounds (see Table 4). The full list of groups is available on the article Web site.
Table 4. Examples of Functional and Reactive Groups Overrepresented in the Outlying Compoundsa.

See the superscript 1 in the first row: Calculated using the hypergeometric test.
Estimation of Errors
As described in the Methods section, the standard deviation of the consensus model members (CONSENSUS-STD) was used to estimate the prediction accuracy (Table 5). Both consensus models predicted higher RMSEs for the Bergström set than the actual calculated values (the estimates were pessimistic). This result may reflect the higher quality of data in the Bergström set compared to either training set. In a similar manner, the OCHEM model predicted higher errors for both the Bradley and Enamine sets. As already mentioned, both these sets had higher consistency and accuracy compared to the OCHEM set. That is why the estimation of errors derived using a noisier set overestimated errors for the cleaner sets. The Enamine consensus model predicted much lower errors for the Bradley and OCHEM sets compared to the calculated values. Compounds with extremely low and high MPs, which are poorly predicted by the Enamine consensus model, have chemical features that are not correctly predicted by this model. By making predictions for these compounds, the model apparently goes outside its applicability domain (AD).20,47 Thus, it would be beneficial to eliminate compounds with predictions outside the AD.
Table 5. Estimated and Calculated RMSE for the Consensus Models.
| OCHEM |
Enamine |
|||
|---|---|---|---|---|
| data set | estimated | calculated | estimated | calculated |
| OCHEM | 43.9 ± 0.5 | 51.9 ± 0.4 (49.9 ± 0.4) | ||
| Enamine | 42.3 ± 0.4 | 40 ± 0.3 (39.8 ± 0.3)a | ||
| Bradley | 41 ± 1 | 33.9 ± 0.5 (32.5 ± 0.3) | 40 ± 1 | 73 ± 1 (73 ± 1) |
| Bergström | 42 ± 4 | 34 ± 1 (34 ± 1) | 44 ± 4 | 36 ± 2 (33 ± 1) |
Values in parentheses are calculated for compounds with experimental MP values in the [50; 250]°C drug-like interval.
In several of our previous studies we used distance to model (DM), covering 95% of compounds from the training set, as a threshold for the model AD.9,43,48,49 We used the same definition in the current study. Of 2262 molecules with MP < 0 values, only <10% were recognized as outside the AD using this DM. Following a suggestion by the reviewers, we analyzed whether the distance to the nearest neighbors could provide a better definition of the model AD. The descriptors from all descriptor packages were processed using the same default protocol used for model development and were standardized to have a zero mean and a standard deviation of 1. Distances to the nearest neighbor as well as exponentially weighted distances to all neighbors in the training set, as defined by Nigsch et al.,10 were used to calculate DMs. As with CONSENSUS-STD, the thresholds for AD were identified as values covering 95% of the training set molecules. The distance to the nearest neighbor and weighted distance were able to identify 18% and <10% compounds with MPs <0 °C as outside the ADs. Thus, three analyzed DM measures did not recognize the majority of molecules with extreme MP values as outside the AD.
Which Is More Important: Data Quality or Data Amount?
When the first author is asked which is more important for a model, “data or a brilliant machine-learning method”, he always answers “data and, in particular, their amount”. Indeed, data even without any machine learning already provide an “excellent” model for predicting compounds with experimental quality. However, the applicability domain of this “data-only” model is its training set and no more; it cannot predict new compounds. When developing a machine-learning model we extend the applicability domain of the “data-only” model, but even the best machine learning methods cannot extrapolate far beyond the chemical space covered by the training set. The bigger data sets provide larger applicability domain, and thus the amount of data is absolutely critical for the success of modeling.
Confirming this statement, we developed consensus models using both gold standard sets. These models provided significantly lower accuracy for prediction of the respective test sets compared to the results obtained with the Enamine and OCHEM data sets (Table 6). It is interesting that the model developed with the Bradley set provided better accuracy of predictions for the drug-like region than the model based on the “drug-like” Bergström set. Indeed, the figure of 1,532 compounds from the Bradley set within this temperature interval was still five times greater than the entire Bergström set. The consensus model developed with the OCHEM set predicted Bergström and Bradley sets with lower RMSEs compared to their CV RMSEs. Thus, the higher data availability allowed us to obtain better models and calculate smaller prediction errors.
Table 6. Consensus Models RMSEs Developed Using High Quality Sets.
| data set | Bergström | Bradley | OCHEM | Enamine |
|---|---|---|---|---|
| Bergström | 39 ± 2 (35)a | 103 ± 1 (49) | 71 ± 1 (47.1) | 54.9 ± 0.3 (47.5) |
| Bradley | 38 ± 2 (35) | 34.6 ± 0.6 (36.8) | 44.6 ± 0.4 (40.3) | 43 ± 0.3 (37.4) |
| OCHEM | 34 ± 1 (31) | 33.9 ± 0.6 (33.1) | 39.2 ± 0.3 (34.8) | 40.1 ± 0.3 (34.6) |
Values in parentheses are for compounds with experimental MP values in the [50; 250]°C drug-like interval.
Statistical Properties of the Final Model
The final model (Table 7) was developed by merging all four data sets and using the corrected MP data for molecules with confirmed errors. No outlying molecules were excluded. The accuracy of the model for molecules with MPs in the “drug-like” interval was very similar (RMSE of 31.5–33.7) for all four sets. In contrast, there was a large discrepancy in the RMSE values for molecules with MPs outside this interval. The molecules from the Bradley set had the lowest error of 32 °C, while molecules from “drug-like” sets had an RMSE of about 60 °C.
Table 7. Cross-Validated Results of the Final Model Developed Using All Compounds.
| all data | inside
of the “drug-like” interval |
outside
of the “drug-like” interval |
|||
|---|---|---|---|---|---|
| data set | RMSE | RMSE | N | RMSE | N |
| all data | 37.1 | 32.6 | 38167 | 51.8 | 9260 |
| OCHEM | 38.0 | 33.7 | 16386 | 48.5 | 5474 |
| ENAMINE | 36.8 | 31.5 | 19992 | 66.1 | 2412 |
| Bradley | 32.6 | 33.1 | 1533 | 32.1 | 1353 |
| Bergström | 34 | 31 | 256 | 57.5 | 21 |
Discussion and Conclusions
In the present study, we collected and made publicly available the largest data set with MP data obtained from over 50 different sources and containing more than 47k unique measurements. These data can be used to develop and validate new models for predicting MPs of chemical compounds.
Following our analysis of distributions of MPs in the Bergström and Enamine sets, we found that about 90% of compounds in both sets had a MP in the range [50,250]°C. These two sets were composed of drug-like and lead-like structure compounds; they represent typical molecules from drug discovery projects. The identified temperature interval is thus of utmost importance for practical applications in the field of medicinal chemistry. Using four different sets, we found that the developed models achieved an average RMSE of 31–36 °C for molecules in this temperature interval; the final consensus model had an average RMSE of 33 °C for all four sets. The excellent accuracy of the developed model will be important for widespread use in the drug discovery field. The accuracy of models outside the “drug-like” space was around 60 °C for the Bergström and Enamine sets. Thus, accurate prediction of MPs in these regions remains a challenge. However, these data regions contained less than 10% of the data sets and, further, presumably had a higher level of experimental errors.
Since the molecules with high and low temperatures are incorrectly predicted, it would be a great advantage to be able to identify them and thus warn a user about potential problems with accurate prediction of their values. We attempted to do this using the applicability domain (AD) as identified by CONSENSUS-STD and two approaches based on the nearest neighbor distance to model (DM). The DMs used were unable to correctly identify and filter out molecules with MP < 0 and thus large errors from the data set. It is interesting that the simplest measure, distance to the nearest neighbor, provided the best (but, unfortunately, still insufficient for practical use) discriminatory power. This negative result indicates a strong need to find a new and better definition of DM measures that could be employed for such a purpose. The provided data could be used as an excellent benchmark for comparison of different AD approaches. A strong need for such data was discussed by leading AD experts, who presented new innovative approaches to this field12,40,50−54 at the recent Gordon conference on Computer Aided Drug Design (West Dover, 2013).
The results presented in this study were based on consensus modeling. Simple averaging of model predictions developed with individual descriptors dramatically increased the accuracy of the final model. The packages were contributed by different groups of OCHEM collaborators ranging from individuals to academic groups and SMEs. Their combined use in the consensus model allowed us to increase the diversity of chemical structure representation, which was one of the requirements for successfully modeling MPs identified by Hughes et al.15 Similar results were obtained with other methods (not shown). An attempt to develop models using all descriptors provided higher RMSE than the consensus model (results not shown). This could be related to a problem with learning of neural networks, which could stack in local minima due to the high dimensionality of data.
We have shown that data availability is likely to be at least as important as data quality. Indeed, models developed with high quality data had lower prediction accuracies than those based on larger data sets as shown in Table 6.
We also showed that consensus modeling had a low sensitivity to the presence of outlying molecules. The latter result can be explained by the fact that, depending on the descriptors used, the outlying molecules bias the individual models in different directions in the different descriptor spaces. The consensus model averages these biases and thus cancels out their effects. This contributes to its high prediction accuracy.
We strongly acknowledge the importance of preparing large, highly curated data sets, such as the Bradley set used in this project. The availability of such sets is very important in comparing the performances of models. Indeed, without the Bradley and Enamine sets, we would have difficulty in evaluating the performance of the OCHEM models using the Bergström set only. Because of the small size of this set, it has wide confidence intervals for RMSE. These intervals overlap for the best individual and consensus model, making it impossible to draw conclusions about a significantly higher performance of the consensus model.
In summary, we have collected the largest public data set of compounds with melting point data. We analyzed the distribution of MP values in drug- and lead-like data sets and identified the temperature interval with the greatest importance for medicinal chemists. We showed that the developed models achieved excellent accuracies for this temperature interval, and we analyzed the origin of outlying predictions and demonstrated the power of consensus modeling. The data sets and models are freely available and can be used to predict new compounds or develop new models at http://ochem.eu/article/55638. Although analyzed distance to models could not filter out predictions, which had MP values outside those in the training set and thus outside the applicability domain of the models, we view this positively as a challenge for the scientific community to contribute better approaches to determine the applicability domain of models.
Acknowledgments
This study was supported with Russian Scientific Foundation (Agreement No 14-43-00024, dated by October 1, 2014). We thank ChemAxon (http://www.chemaxon.com) for providing the Standardizer and calculator plugins. We also thank Molecular Networks GmbH (http://www.molecular-networks.com) and Talete Srl (http://www.talete.mi.it) for contributing their software tools used in this study.
Supporting Information Available
The RMSEs of the individual and consensus models developed using OCHEM and Enamine sets is provided. This material is available free of charge via the Internet at http://pubs.acs.org.
The authors declare the following competing financial interest(s): Dr. Tetko, Dr. Sushko and Dr. Novotarskyi are the founder and the employees of eADMET GmbH, which licenses OCHEM software. Dr. Kondratov and Dr. Petrenko are employees of Enamine Ltd.
Dedication
Dedicated to the memory of Prof. Jean-Claude Bradley.
Supplementary Material
References
- Ran Y.; Jain N.; Yalkowsky S. H. Prediction of aqueous solubility of organic compounds by the general solubility equation (GSE). J. Chem. Inf. Comput. Sci. 2001, 41, 1208–1217. [DOI] [PubMed] [Google Scholar]
- Irmann F. A Simple Correlation Between Water Solubility and Structure of Hydrocarbons and Halohydrocarbons. Chem. Ing. Technol. 1965, 37, 789–98. [Google Scholar]
- Meylan W. M.; Howard P. H. Estimating log P with atom/fragments and water solubility with log P. Perspect. Drug Discovery Des. 2000, 19, 67–84. [Google Scholar]
- Varnek A.; Kireeva N.; Tetko I. V.; Baskin I. I.; Solov’ev V. P. Exhaustive QSPR Studies of a Large Diverse Set of Ionic Liquids: How Accurately Can We Predict Melting Points?. J. Chem. Inf. Model. 2007, 47, 1111–1122. [DOI] [PubMed] [Google Scholar]
- Katritzky A. R.; Kuanar M.; Slavov S.; Hall C. D.; Karelson M.; Kahn I.; Dobchev D. A. Quantitative correlation of physical and chemical properties with chemical structure: utility for prediction. Chem. Rev. 2010, 110, 5714–89. [DOI] [PubMed] [Google Scholar]
- Tetko I. V.Prediction of physicochemical properties. In Computational Toxicology: Risk Assessment for Pharmaceutical and Environmental Chemicals; Ekins S., Ed.; John Wiley & Sons, Inc.: NJ, 2007; Vol. 1, pp 241–275. [Google Scholar]
- Dearden J. C.; Rotureau P.; Fayet G. QSPR prediction of physico-chemical properties for REACH. SAR QSAR Environ. Res. 2013, 24, 279–318. [DOI] [PubMed] [Google Scholar]
- Gavezzotti A. Computational studies of crystal structure and bonding. Top. Curr. Chem. 2012, 315, 1–32. [DOI] [PubMed] [Google Scholar]
- Bhhatarai B.; Teetz W.; Liu T.; Öberg T.; Jeliazkova N.; Kochev N.; Pukalov O.; Tetko I. V.; Kovarich S.; Papa E.; Gramatica P. CADASTER QSPR Models for Predictions of Melting and Boiling Points of Perfluorinated Chemicals. Mol. Inf. 2011, 30, 189–204. [DOI] [PubMed] [Google Scholar]
- Nigsch F.; Bender A.; van Buuren B.; Tissen J.; Nigsch E.; Mitchell J. B. Melting point prediction employing k-nearest neighbor algorithms and genetic parameter optimization. J. Chem. Inf. Model. 2006, 46, 2412–22. [DOI] [PubMed] [Google Scholar]
- Krstajic D.; Buturovic L. J.; Leahy D. E.; Thomas S. Cross-validation pitfalls when selecting and assessing regression and classification models. J. Cheminf. 2014, 6, 10. [DOI] [PMC free article] [PubMed] [Google Scholar]
- Sahlin U.; Jeliazkova N.; Oberg T. Applicability domain dependent predictive uncertainty in QSAR regressions. Mol. Inf. 2014, 33, 26–35. [DOI] [PubMed] [Google Scholar]
- Karthikeyan M.; Glen R. C.; Bender A. General melting point prediction based on a diverse compound data set and artificial neural networks. J. Chem. Inf. Model. 2005, 45, 581–90. [DOI] [PubMed] [Google Scholar]
- Bergström C. A.; Norinder U.; Luthman K.; Artursson P. Molecular descriptors influencing melting point and their role in classification of solid drugs. J. Chem. Inf. Comput. Sci. 2003, 43, 1177–85. [DOI] [PubMed] [Google Scholar]
- Hughes L. D.; Palmer D. S.; Nigsch F.; Mitchell J. B. Why are some properties more difficult to predict than others? A study of QSPR models of solubility, melting point, and Log P. J. Chem. Inf. Model. 2008, 48, 220–32. [DOI] [PubMed] [Google Scholar]
- Sushko I.; Novotarskyi S.; Korner R.; Pandey A. K.; Rupp M.; Teetz W.; Brandmaier S.; Abdelaziz A.; Prokopenko V. V.; Tanchuk V. Y.; Todeschini R.; Varnek A.; Marcou G.; Ertl P.; Potemkin V.; Grishina M.; Gasteiger J.; Schwab C.; Baskin I. I.; Palyulin V. A.; Radchenko E. V.; Welsh W. J.; Kholodovych V.; Chekmarev D.; Cherkasov A.; Aires-de-Sousa J.; Zhang Q. Y.; Bender A.; Nigsch F.; Patiny L.; Williams A.; Tkachenko V.; Tetko I. V. Online chemical modeling environment (OCHEM): web platform for data storage, model development and publishing of chemical information. J. Comput.-Aided Mol. Des. 2011, 25, 533–54. [DOI] [PMC free article] [PubMed] [Google Scholar]
- Bradley J.-C.; Lang A.; Williams A.. Jean-Claude Bradley Double Plus Good (Highly Curated and Validated) Melting Point Dataset. http://dx.doi.org/10.6084/m9.figshare.1031638 (accessed November 15, 2014).
- Bradley J. C.; Lang A. S. I. D.; Williams A. J.; Curtin E. ONS Open Melting Point Collection. http://dx.doi.org/10.1038/npre.2011.6229.1 (accessed November 15, 2014).
- Netzeva T. I.; Worth A.; Aldenberg T.; Benigni R.; Cronin M. T.; Gramatica P.; Jaworska J. S.; Kahn S.; Klopman G.; Marchant C. A.; Myatt G.; Nikolova-Jeliazkova N.; Patlewicz G. Y.; Perkins R.; Roberts D.; Schultz T.; Stanton D. W.; van de Sandt J. J.; Tong W.; Veith G.; Yang C. Current status of methods for defining the applicability domain of (quantitative) structure-activity relationships. The report and recommendations of ECVAM Workshop 52. Altern. Lab. Anim. 2005, 33, 155–173. [DOI] [PubMed] [Google Scholar]
- Tetko I. V.; Bruneau P.; Mewes H. W.; Rohrer D. C.; Poda G. I. Can we estimate the accuracy of ADME-Tox predictions?. Drug Discovery Today 2006, 11, 700–707. [DOI] [PubMed] [Google Scholar]
- ChemExper. http://www.chemexper.com (accessed November 15, 2014).
- EPA U.S. Environmental Protection Agency EPI Suite v 4.10. http://www.epa.gov/opptintr/exposure/pubs/episuitedl.htm (accessed November 15, 2014).
- MDPI. http://www.mdpi.org/cumbase.htm (accessed November 15, 2014).
- ONSMP. http://onswebservices.wikispaces.com (accessed November 15, 2014).
- Brandmaier S.; Peijnenburg W.; Durjava M. K.; Kolar B.; Gramatica P.; Papa E.; Bhhatarai B.; Kovarich S.; Cassani S.; Roy P. P.; Rahmberg M.; Oberg T.; Jeliazkova N.; Golsteijn L.; Comber M.; Charochkina L.; Novotarskyi S.; Sushko I.; Abdelaziz A.; D’Onofrio E.; Kunwar P.; Ruggiu F.; Tetko I. V. The QSPR-THESAURUS: the online platform of the CADASTER project. Altern. Lab. Anim. 2014, 42, 13–24. [DOI] [PubMed] [Google Scholar]
- ENAMINE Ltd. http://www.enamine.net (accessed November 15, 2014).
- OptiMelt. http://www.thinksrs.com/products/MPA100.htm (accessed November 15, 2014).
- Tetko I. V. Associative neural network. Methods Mol. Biol. 2008, 458, 185–202. [DOI] [PubMed] [Google Scholar]
- Tetko I. V. Associative neural network. Neur. Proc. Lett. 2002, 16, 187–199. [Google Scholar]
- Tetko I. V. Neural network studies. 4. Introduction to associative neural networks. J. Chem. Inf. Comput. Sci. 2002, 42, 717–728. [DOI] [PubMed] [Google Scholar]
- OCHEM. http://www.ochem.eu (accessed November 15, 2014).
- Hall L. H.; Kier L. B. Electrotopological State Indexes for Atom Types - a Novel Combination of Electronic, Topological, and Valence State Information. J. Chem. Inf. Comput. Sci. 1995, 35, 1039–1045. [Google Scholar]
- Varnek A.; Fourches D.; Horvath D.; Klimchuk O.; Gaudin C.; Vayer P.; Solov’ev V.; Hoonakker F.; Tetko I. V.; Marcou G. ISIDA - Platform for virtual screening based on fragment and pharmacophoric descriptors. Curr. Comput.-Aided Drug Des. 2008, 4, 191–198. [Google Scholar]
- Skvortsova M. I.; Baskin I. I.; Skvortsov L. A.; Palyulin V. A.; Zefirov N. S.; Stankevich I. V. Chemical graphs and their basis invariants. J. Mol. Struct. 1999, 466, 211–217. [Google Scholar]
- Steinbeck C.; Han Y.; Kuhn S.; Horlacher O.; Luttmann E.; Willighagen E. The Chemistry Development Kit (CDK): an open-source Java library for Chemo- and Bioinformatics. J. Chem. Inf. Comput. Sci. 2003, 43, 493–500. [DOI] [PMC free article] [PubMed] [Google Scholar]
- Todeschini R.; Consonni V.. Handbook of Molecular Descriptors; Wiley-VCH: Weinheim, 2000; p 667. [Google Scholar]
- Gasteiger J. Of molecules and humans. J. Med. Chem. 2006, 49, 6429–34. [DOI] [PubMed] [Google Scholar]
- Haider N. Functionality Pattern Matching as an Efficient Complementary Structure/Reaction Search Tool: an Open-Source Approach. Molecules 2010, 15, 5079–5092. [DOI] [PMC free article] [PubMed] [Google Scholar]
- Sadowski J.; Gasteiger J.; Klebe G. Comparison of Automatic Three-Dimensional Model Builders Using 639 X-ray Structures. J. Chem. Inf. Comput. Sci. 1994, 34, 1000–1008. [Google Scholar]
- Sushko I.; Novotarskyi S.; Korner R.; Pandey A. K.; Cherkasov A.; Li J.; Gramatica P.; Hansen K.; Schroeter T.; Muller K. R.; Xi L.; Liu H.; Yao X.; Oberg T.; Hormozdiari F.; Dao P.; Sahinalp C.; Todeschini R.; Polishchuk P.; Artemenko A.; Kuz’min V.; Martin T. M.; Young D. M.; Fourches D.; Muratov E.; Tropsha A.; Baskin I.; Horvath D.; Marcou G.; Muller C.; Varnek A.; Prokopenko V. V.; Tetko I. V. Applicability Domains for Classification Problems: Benchmarking of Distance to Models for Ames Mutagenicity Set. J. Chem. Inf. Model. 2010, 50, 2094–2111. [DOI] [PubMed] [Google Scholar]
- Tetko I. V.; Sushko I.; Pandey A. K.; Zhu H.; Tropsha A.; Papa E.; Oberg T.; Todeschini R.; Fourches D.; Varnek A. Critical assessment of QSAR models of environmental toxicity against Tetrahymena pyriformis: focusing on applicability domain and overfitting by variable selection. J. Chem. Inf. Model. 2008, 48, 1733–46. [DOI] [PubMed] [Google Scholar]
- Sushko I.Applicability domain of QSAR models; Technical University of Munich: Munich, 2011. [Google Scholar]
- Vorberg S.; Tetko I. V. Modeling the Biodegradability of Chemical Compounds Using the Online CHEmical Modeling Environment (OCHEM). Mol. Inf. 2014, 33, 73–85. [DOI] [PMC free article] [PubMed] [Google Scholar]
- Clark M. Generalized fragment-substructure based property prediction method. J. Chem. Inf. Model. 2005, 45, 30–8. [DOI] [PubMed] [Google Scholar]
- Jain A.; Yalkowsky S. H. Estimation of melting points of organic compounds-II. J. Pharm. Sci. 2006, 95, 2562–618. [DOI] [PubMed] [Google Scholar]
- Sushko I.; Salmina E.; Potemkin V. A.; Poda G.; Tetko I. V. ToxAlerts: A Web Server of Structural Alerts for Toxic Chemicals and Compounds with Potential Adverse Reactions. J. Chem. Inf. Model. 2012, 52, 2310–6. [DOI] [PMC free article] [PubMed] [Google Scholar]
- Jaworska J.; Nikolova-Jeliazkova N.; Aldenberg T. QSAR applicabilty domain estimation by projection of the training set descriptor space: a review. Altern. Lab. Anim. 2005, 33, 445–59. [DOI] [PubMed] [Google Scholar]
- Tetko I. V.; Novotarskyi S.; Sushko I.; Ivanov V.; Petrenko A. E.; Dieden R.; Lebon F.; Mathieu B. Development of dimethyl sulfoxide solubility models using 163 000 molecules: using a domain applicability metric to select more reliable predictions. J. Chem. Inf. Model. 2013, 53, 1990–2000. [DOI] [PMC free article] [PubMed] [Google Scholar]
- Oprisiu I.; Novotarskyi S.; Tetko I. V. Modeling of non-additive mixture properties using the Online CHEmical database and Modeling environment (OCHEM). J. Cheminform. 2013, 5, 4. [DOI] [PMC free article] [PubMed] [Google Scholar]
- Sheridan R. P. Using random forest to model the domain applicability of another random forest model. J. Chem. Inf. Model. 2013, 53, 2837–50. [DOI] [PubMed] [Google Scholar]
- Clark R. D.; Liang W.; Lee A. C.; Lawless M. S.; Fraczkiewicz R.; Waldman M. Using beta binomials to estimate classification uncertainty for ensemble models. J. Cheminf. 2014, 6, 34. [DOI] [PMC free article] [PubMed] [Google Scholar]
- Brandmaier S.; Sahlin U.; Tetko I. V.; Oberg T. PLS-Optimal: A Stepwise D-Optimal Design Based on Latent Variables. J. Chem. Inf. Model. 2012, 52, 975–983. [DOI] [PubMed] [Google Scholar]
- Norinder U.; Carlsson L.; Boyer S.; Eklund M. Introducing conformal prediction in predictive modeling. A transparent and flexible alternative to applicability domain determination. J. Chem. Inf. Model. 2014, 54, 1596–603. [DOI] [PubMed] [Google Scholar]
- Wood D. J.; Carlsson L.; Eklund M.; Norinder U.; Stalring J. QSAR with experimental and predictive distributions: an information theoretic approach for assessing model quality. J. Comput.-Aided. Mol. Des. 2013, 27, 203–19. [DOI] [PMC free article] [PubMed] [Google Scholar]
Associated Data
This section collects any data citations, data availability statements, or supplementary materials included in this article.