

ABSTRACT
Influenza virus is taken up from a pH-neutral extracellular milieu into an endosome, whose contents then acidify, causing changes in the viral matrix protein (M1) that coats the inner monolayer of the viral lipid envelope. At a pH of ∼6, M1 interacts with the viral ribonucleoprotein (RNP) in a putative priming stage; at this stage, the interactions of the M1 scaffold coating the lipid envelope are intact. The M1 coat disintegrates as acidification continues to a pH of ∼5 to clear a physical path for the viral genome to transit from the viral interior to the cytoplasm. Here we investigated the physicochemical mechanism of M1's pH-dependent disintegration. In neutral media, the adsorption of M1 protein on the lipid bilayer was electrostatic in nature and reversible. The energy of the interaction of M1 molecules with each other in M1 dimers was about 10 times as weak as that of the interaction of M1 molecules with the lipid bilayer. Acidification drives conformational changes in M1 molecules due to changes in the M1 charge, leading to alterations in their electrostatic interactions. Dropping the pH from 7.1 to 6.0 did not disturb the M1 layer; dropping it lower partially desorbed M1 because of increased repulsion between M1 monomers still stuck to the membrane. Lipid vesicles coated with M1 demonstrated pH-dependent rupture of the vesicle membrane, presumably because of the tension generated by this repulsive force. Thus, the disruption of the vesicles coincident with M1 protein scaffold disintegration at pH 5 likely stretches the lipid membrane to the point of rupture, promoting fusion pore widening for RNP release.
IMPORTANCE Influenza remains a top killer of human beings throughout the world, in part because of the influenza virus's rapid binding to cells and its uptake into compartments hidden from the immune system. To attack the influenza virus during this time of hiding, we need to understand the physical forces that allow the internalized virus to infect the cell. In particular, we need to know how the protective coat of protein inside the viral surface reacts to the changes in acid that come soon after internalization. We found that acid makes the molecules of the protein coat push each other while they are still stuck to the virus, so that they would like to rip the membrane apart. This ripping force is known to promote membrane fusion, the process by which infection actually occurs.
INTRODUCTION
While it is becoming clearer that multiple processes unite to form a pathway for the entry of the influenza virus after its uptake into endosomes, it is not yet clear how and to what extent the pH-driven changes in the viral matrix contribute to that pathway. Influenza virus is an enveloped negative-strand RNA virus of the Orthomyxoviridae family (1). Its outer envelope consists of a host cell-derived bilayer lipid membrane (BLM) with the incorporated glycoproteins hemagglutinin (HA) and neuraminidase along with proton channel M2. The inner envelope of the virion is a membrane-associated scaffold of matrix protein M1, which contacts both the viral ribonucleoprotein (RNP) and the lipid envelope (2). Influenza virus penetrates the cell via endocytosis (3). The trigger for the fusion of viral and endosomal membranes is a pH drop inside the late endosome (4). A drop to pH 6.0 results in possible conformational changes in core proteins, especially M1, that prime the viral core for release from the membrane and uncoating once fusion occurs (5). This priming leads to the dissociation of M1 protein from RNP (5–7) and some softening of the viral particle (8). The conformational change in HA below pH 5.5 leads to tight contact between viral and endosomal membranes and the formation of a small fusion pore (9). Electron microscopy (EM) shows an intact lipid-protein envelope with target membrane deformation only under the action of viral fusion proteins (10). Further pH decreases (to 4.7 to 5.0) result in acidification of the medium inside the viral particle because of the continuous action of proton channel M2, leading to deformation of the viral envelope (11). The latter effect is attributed to a putative disintegration of the matrix protein M1 scaffold (12). Finally, these processes result in widening of the fusion pore and the entry of viral RNP into the cytoplasm of the infected cell (2). The experiments testing the correlations between RNP release from the virus particle and disassembly of the M1 scaffold polymer as a result of acidification of the inner virus space are reviewed in detail in reference 13. Thus, pH-dependent disintegration of the M1 protein scaffold of influenza virus is a critical prerequisite for efficient cell infection.
Existing X-ray structures of M1 (14–16) show that the N-terminal part of M1 forms a dimer. There are small differences at pH 7 and pH 4 within a single protein monomer but completely different interactions between monomers in a dimer (16). The main change in the dimer is an alteration of the protein charge with the pH; presumably, electrostatic forces play a pivotal role in these conformational changes in M1. Loss of the C-terminal domain (88 of the total of 252 amino residues) during purification and crystallization of the protein hampers experimental efforts to elucidate all of the conformational changes in the whole M1 protein. Solution studies of full-length M1 protein using dynamic light scattering show a monomer at pH 7 (17). Our small-angle X-ray scattering experiments (18) proved that M1 is also a monomer at pH 4.7 with a small tendency to form helical oligomers but not dimers. While the C-terminal domain is most likely responsible for the interaction of M1 with viral RNP (5), there is also a possible role for this domain in protein dimerization (19).
In addition to these effects of pH on the conformation, dimerization, and oligomerization of M1, it interacts with the viral envelope, as evidenced by its possible hydrophobic binding and incorporation into the bilayer (20–22) and electrostatic interactions with the lipid bilayer (23, 24). The viral membrane contains about 30 mol% negatively charged phosphatidylserine, all concentrated on the inner leaflet (25). M1 protein absorbs better to negatively charged lipid bilayers at pH 7, with weaker adsorption to noncharged polar lipids (26, 27), and M1-lipid interactions enhance protein oligomerization (27). Cryo-EM (12) of intact virions under acidic conditions (pH 4.9) shows predominantly desorption of M1 protein from the viral lipid membrane, but in some cases, the M1 matrix layer becomes unresolved from the viral lipid membrane, meaning tighter attachment of M1 to lipids. The latter pH effect is attributed to possible conformational changes in the M1 protein. Significant growth of the protein charge at pH 5.0, together with the irreversibility of its adsorption to lipid bilayers containing anionic lipids, demonstrates a change in M1-lipid interactions in acidic environments (28); there is a decrease in M1 multimerization on lipid bilayers after a pH change from 7 to 5 (27). Presumably, these changes in M1-membrane interaction with pH reflect the critical role of M1 in viral entry, but they do not precisely define the role of M1.
To address these questions, here we used purified M1 and several model membrane systems to study the mechanism of M1 protein-protein and protein-lipid interactions in neutral and acidic environments by (i) comparing the adsorption of M1 on planar lipid bilayers at acidic and neutral pHs by the intramembrane field compensation (IFC) technique, (ii) investigating the pH dependency of the structure of the M1 layer by atomic force microscopy (AFM), and (iii) tracing the release of water-soluble fluorescent dye from liposomes with adsorbed M1 upon stepwise changes in the bulk pH. In addition, we measured the binding constants of M1 to the lipid bilayer and between M1 molecules. On the basis of these results, we suggest a mechanism of assembly and destruction of the M1 protein scaffold as a function of pH and propose a new role for M1 electrification to provide a transient increase in influenza virus envelope surface tension needed to widen the fusion pore of infection.
MATERIALS AND METHODS
Purification of M1 protein.
Influenza A virus strain PR/8/34 was propagated in 10-day-old embryonic chicken eggs and purified by centrifugation in 20% (vol/vol) sucrose in STE buffer (100 mM NaCl, 10 mM Tris-HCl, 1 mM EDTA, pH 7.4) at 21,000 rpm for 90 min at 8°C in the SW 27.1 rotor of a Beckman-Spinco L5-75 centrifuge (29). Isolation of M1 protein from a purified virus suspension was carried out by acid-dependent solubilization of the influenza virus membrane with the mild nonionic detergent NP-40 (Igepal; Sigma) in 50 mM morpholineethanesulfonic acid (MES)–100 mM NaCl, pH 4.0, by Zhirnov's method (30). The isolated M1 protein at a concentration of 0.1 to 0.2 mg/ml was dialyzed against the same buffer with Bio-Beads SM-2 adsorbent (Bio-Rad) for 18 h at 4°C with dialysis tubing cellulose membranes (molecular weight cutoff [MWCO] of 14,000; Sigma). The protein suspension/buffer ratio was 1:400 (vol/vol), and to every 200 μg of M1 protein was added 700 mg of Bio-Beads pretreated with methanol. The dialyzed M1 protein was concentrated with Microcon membranes (Microcon, Ultracel YM-10 regenerated cellulose, MWCO of 10,000; Millipore) at 10,000 rpm for 2 h at 4°C to a final concentration of 0.2 to 0.3 mg/ml. The protein concentration was determined by quantitative amino acid analysis of the protein hydrolysates on a Hitachi L-8800 analyzer.
The quality of the protein obtained was verified by the Laemmli method of polyacrylamide gel electrophoresis (PAGE) (31) (Fig. 1). Electrophoresis was performed under nonreducing conditions with 15% separating and 6% stacking polyacrylamide gels in a Mini-PROTEAN 3 cell (Bio-Rad). Before application to the gel, samples (5 to 10 μl) were mixed with an equal volume of lysis buffer (62.5 mM Tris-HCl [pH 6.8], 2% SDS, 6 M urea, 20% glycerol, 0.02% bromophenol blue) and heated for 3 min at 100°C. Gels were stained with 0.22% Coomassie G-250 (Serva).
FIG 1.

SDS-PAGE of M1 protein sample. LWM, low-weight markers. The values to the left are molecular weights in thousands.
IFC.
Planar BLMs were formed by the Mueller-Rudin technique (32) at the aperture with a diameter of 0.8 mm in a septum dividing two 500-μl chambers of the Teflon cell. Chambers were filled with a working buffer solution of 10 or 20 mM KCl, 0.1 mM EDTA, 5 mM HEPES, or 5 mM sodium citrate at pH 7.1 or 5.0. BLMs were made from a solution of 30 mol% diphytanoylphosphatidylserine (DPhPS) and 70 mol% diphytanoylphosphatidylcholine (DPhPC) (Avanti Polar Lipids) in decane (Sigma) with a total lipid concentration of 10 mg/ml. In some experiments, 15 and 25 mol% cholesterol (Avanti Polar Lipids) was added to the lipid solution with a decreasing fraction of DPhPC, or a solution of 30 mol% dioleoylphosphatidylserine (DOPS) and 70 mol% dioleoylphosphatidylcholine (DOPC) (Avanti Polar Lipids) in decane (Sigma) with a total lipid concentration of 10 mg/ml was used.
Electrical measurements were performed with a pair of Ag/AgCl electrodes contacting the buffer in chambers through salt bridges (micropipette plastic tips filled with agar and 0.1 M KCl). The electrical resistance of electrodes with salt bridges did not exceed 50 kΩ. Adsorption of M1 protein on the one side of a BLM changed the difference in boundary potentials across the lipid bilayer, which was measured by the IFC technique (33). The method is based on membrane electrostriction in an external field with the minimal membrane capacitance at zero difference in boundary potential. To find the voltage corresponding to this capacitance, the second harmonic of the capacitive current is used. The experimental setup was the same as that described in reference 34. In brief, the sum of sine and constant voltages was applied to the BLM with a G3-118 generator (Radiopribor) and the current response was amplified by a Keithley 427 current amplifier and sent to a DSP SR830 lock-in amplifier (Stanford Research Systems) to extract the second harmonics of the capacitive current. The self-made software attenuated the amplitude of the constant voltage automatically, the negative feedback set the second harmonics to zero, and the constant voltage was then equal to the boundary potential difference (PD) across the membrane. M1 protein was washed from the cell by perfusion with a peristaltic pump (LKB).
Adsorption isotherm procedure and theory.
Protein was added stepwise to change the final bulk concentration in 10 nM steps. Each point corresponds to a stationary level for a given concentration, averaged over three to five independent series of experiments. The dependence shows the change in adsorption behavior over a concentration range of 60 to 80 nM. After a concentration of 110 nM was reached, further addition of the protein (up to 150 nM) did not lead to an increase in the PD (only two points are shown). To verify that the total effect depends not on the number of addition steps but only on the total M1 bulk concentration, we compared the final PDs for 100 nM protein added in one, two, or nine serial steps. The saturation levels differed by less than 15%.
In IFC experiments, we cannot measure the amount of protein molecules adsorbed to a BLM, q, but only the change in boundary PD, Δφ, caused by the adsorption of charged protein molecules. This PD depends on many factors, such as the concentration of the electrolyte, its ability to penetrate the protein layer, and the distribution of fixed charges in this layer (35). Although the theory of the IFC method was developed to analyze the adsorption of small molecules, reliable results are obtained from the adsorption of large protein molecules as well (36–38). The simplest classic model of the relationship between the potential and surface charge density, which is proportional to the amount of protein molecules on the surface, is the equation of Gouy and Chapman (39, 40),
| (1) |
where σ is the surface charge density; cel is the electrolyte concentration in the bulk; ε and ε0 are the dielectric permeabilities of the bulk solution and a vacuum, respectively; R is the gas constant; T is the absolute temperature; F is Faraday's constant; and Δφ is the PD across the membrane. This equation means that the relationship between q and Δφ can approach linearity if the potential change created by protein adsorption is less than RT/F (approximately 25.4 mV). The potential measured in our experiments was less than this value but not much less. The justifiability of the linear approximation in this case can be easily calculated; if the argument of the hyperbolic sine is equal to 0.5, the function exceeds its value by 5%. This means that even when the potential is 25.4 mV, the error of the linear approximation does not exceed 5%. The value of 5% is within the accuracy range of potential measurements by the IFC technique. Therefore, we assumed that the measured PD, Δφ, is directly proportional to the amount of protein adsorbed per unit area of the membrane. This means that we can take q = AΔφ and qm = AΔφm, where Δφm corresponds to the complete monolayer of adsorbed protein and A is a constant, and use Δφ and Δφm instead of q and qm in equation 3 (see below). Later, we will additionally justify this assumption with our AFM experiments.
To increase the resolution of the method, we used low-ionic-strength conditions to decrease the surface charge screening (10 or 20 mM KCl, 0.1 mM EDTA, 5 mM HEPES, or 5 mM sodium citrate instead of the 100 mM KCl and 50 mM MES used in other techniques). To justify this change, we compared stationary levels of protein adsorption measured at salt concentrations ranging from 15 to 150 mM. Since the ratios of corresponding boundary PDs were equal to the inverse ratios of the square roots of the ionic strengths, this change corresponds to equation 1 (data not shown), which means that the effect of ionic strength was only on the charge screening and not on protein adsorption.
AFM.
AFM of M1 adsorption was carried out with the Multimode Nanoscope IV setup (Veeco Digital Instruments) equipped with an E type scanner and an electrochemical fluid cell. All experiments were performed in tapping mode at room temperature in buffer solution. For scanning, we used Ultrasharp SiN3 cantilevers with a nominal spring constant of 0.06 N/m and a tip radius of approximately 1 nm (Bruker).
In experiments, we placed a 200-μl droplet of protein solution in 100 mM KCl–50 mM MES (pH 7.1, 6.0, or 5.0) on the surface of a disk of freshly cleaved mica with a diameter of 1.5 cm (Veeco Digital Instruments). When noted, the droplet was placed on a supported lipid bilayer. Supported BLMs consisting of DOPC and DOPS (Avanti Polar Lipids) at molar ratios of 7:1 to 7:3 were prepared as described in reference 41. The sample was then incubated for 30 min at room temperature and put into the AFM cell filled with the same buffer solution. All of the images obtained had dimensions of 1 by 1 μm2. When the protein layer was very dense, we used a nanolithography technique to determine the actual thickness of the adsorbed layer (42, 43). For that, we increased the image size to 3 by 3 μm2, switched the microscope to the contact mode, and scratched a protein layer patch with dimensions of 0.7 by 0.7 μm2 off using a cantilever with a nominal spring constant of 0.12 N/m and a tip radius of approximately 10 nm (Bruker). The same cantilever was then used for scanning. All AFM images were processed with WSxM software (44).
Leakage experiments.
Large unilamellar vesicles (LUVs) containing 30% DOPS and 70% DOPC were prepared by extrusion through filters with a 100-nm pore diameter (Avestin) in buffer containing 4 mM TbCl3, 40 mM dipicolinic acid (DPA), 30 mM sodium citrate, 20 mM HEPES, and 70 mM NaCl (pH 7.0) with the final liposome concentration of 15 g/liter (45). The optical density of the solution was measured by turbidimetry. To remove the external Tb3+-DPA complex from the solution, we used a PD-10 column. The solution was purified against a buffer containing 100 mM NaCl and 50 mM MES, pH 7.0. The optical density of the suspension obtained was also measured by turbidimetry. The sample with the highest density was selected for the experiments. The approximate concentration of the purified LUV solution was estimated by comparison of the optical densities measured before and after purification.
The fluorescence intensity of the high-fluorescence Tb-DPA complex (46) was measured with a Hitachi F-2700 fluorescence spectrophotometer (Hitachi). We used excitation at 276 nm and emission at 545 nm with corresponding 2.5- and 10-nm monochromator slits. All experiments were conducted with a buffer containing 100 mM NaCl, 50 mM MES, and 1 mM EDTA, pH 7.0. EDTA in working buffer was used to chelate the Tb3+ of the Tb3+-DPA complex. Liposomes from selected samples were added to the working buffer to a final concentration of 0.076 g/liter. To mix the solution, we used a small magnetic stirrer. Matrix protein M1 was added to a final concentration of 75 nM in a spectrophotometry cell. The pH inside the cell was changed by adding the proper amount of HCl. As a control for total LUV disruption, we added a 0.75% solution of octylglucoside (OG) at the end of every recording. After every addition, we waited until the signal reached a stationary level (usually about 15 min). LUV leakage was calculated with the equation
| (2) |
where I1, I0, and IOG are the stationary fluorescence intensity level after the addition of protein or a change in pH, the initial fluorescence intensity level, and the fluorescence intensity level after LUV disruption with OG, respectively.
RESULTS
M1 adsorption at neutral pH.
Because an adsorbed protein bearing a charge generally alters the surface potential of the lipid monolayer to which it is bound, the transmembrane electrical field is also altered for any asymmetric addition of protein to a bilayer. The resulting change in the transmembrane field can be measured by determining the external field that neutralizes this asymmetry. In a related way, the IFC technique provides time-resolved measurements of protein adsorption. At pH 7.1, addition of influenza virus matrix protein M1 to one side of a free-standing planar phospholipid membrane led to a rapid increase in the boundary PD of the membrane, with the initial slope proportional to protein bulk concentration (Fig. 2), reflecting fast adsorption of M1 to the lipid bilayer. In 2 to 6 min, the PD reached a stationary level; subsequent perfusion with M1-free buffer led to a decrease in PD in 10 to 90 min, so M1 adsorption was reversible at neutral pH. The M1 adsorption kinetics were the same for a BLM containing either 15 or 25 mol% cholesterol and for a BLM formed from a 30:70 DOPS-DOPC mixture (data not shown). Because DOPS-DOPC membranes had shorter lifetimes, DPhPC-DPhPS bilayers were used in subsequent experiments unless stated otherwise.
FIG 2.

Kinetics of change in boundary PD after addition of M1 protein from one side of the BLM. Time zero is the moment of protein addition. Arrows indicate the start of buffer perfusion. The membrane has a DPhPS/DPhPC ratio of 3:7.
Since reversibility of M1 adsorption at a neutral pH means a thermodynamic equilibrium, we built an adsorption isotherm for M1 (Fig. 3) (see Materials and Methods). The adsorption we observed can be described by a simple Langmuir model only for low protein bulk concentrations (up to 75 nM) but not over the whole range (Fig. 4). We found that it could be well fitted with the BET (Brunauer-Emmet-Teller) model proposed for the description of multilayer adsorption in a gas phase (47) and later modified for the case of adsorption in liquid solutions (48):
| (3) |
where q is the amount of adsorbed protein, qm is the amount of adsorbate needed to complete the first monolayer, K1 is the binding constant of the molecules in the first monolayer, K2 accounts for the binding in all subsequent layers, and C is the bulk concentration of the protein. The dashed line in Fig. 3 represents the resulting fit of the experimental data by equation 3.
FIG 3.

Adsorption isotherm of M1 protein on the lipid bilayer surface. Each point corresponds to a stationary level for the given concentration, averaged over three to five independent series of experiments. The dashed line is a fit of the experimental data by equation 3, with the following parameters: Δφm = 14.2 ± 1.3 mV, K1 = (2.6 ± 0.4) × 107 M−1, K2 = (3.7 ± 0.3) × 106 M−1, and R2 = 0.998. The inset shows the kinetics of the PD change from 100 nM protein added in one (red) or two (blue) steps. The arrow indicates the moment of the second addition of protein.
FIG 4.

Adsorption isotherm of M1 protein on the lipid bilayer surface in Langmuir rectifying coordinates. The blue line is the Langmuir fit of all of the data points, the red line is the fit of the first adsorbed layer of protein (according to the BET adsorption isotherm), and the green line is the fit of the second layer (according to the BET adsorption isotherm).
There is an inflection on the isotherm at a PD of 14.2 ± 1.3 mV (75 nM M1 in bulk solution), presumably because of the completion of the first monolayer, since the adsorption of M1 protein to this first layer can be well fitted by the simple Langmuir model. The deviation from equation 3 after 110 nM M1 is due not to second-layer completion (see further AFM experiments) but probably to the anisotropy of the M1 molecule (18): the C-terminal domain is responsible for M1-RNP binding, while the N-terminal domain presumably interacts with the lipid bilayer (5). Thus, different protein-protein interactions reign within the first and the second layers versus between the layers.
To clarify the proposed hypothesis of proportionality between PD and the amount of adsorbed protein and to check the predicted possibility of multilayer adsorption of M1, we conducted a series of AFM experiments. At pH 7.1, M1 was adsorbed to one surface of a 3:7 DOPS-DOPC supported lipid bilayer from bulk bathing solutions of differing initial concentrations. At 20 nM, M1 protein adsorbed as spatially independent particles with some amount of oligomeric clusters. The average height of the individual particles was 3.5 ± 0.7 nm (Fig. 5A). At 50 nM, surface coverage was significantly higher (Fig. 5B), and at 70 nM, we observed a dense protein layer (Fig. 5C) with bound protein aggregates above the layer. Thorough washing of the sample with the protein-free working buffer (more than 10 times) led to partial desorption of the protein, as shown in reference 27; this supports the reversible nature of M1 adsorption revealed in our IFC experiments. The measured height of particles corresponds to the 4-nm thickness of the M1 scaffold obtained by cryoelectron tomography of intact virions (12). Thus, the independent particles in our experiments correspond to M1 monomers in height and to either M1 monomers or dimers laterally (because of AFM limitations, we cannot clearly distinguish between the two).
FIG 5.

AFM topography images of M1 adsorbed at pH 7.1 to supported BLMs (A to C) and mica (D to F) at the following bulk concentrations: A and D, 10 nM; B and E, 50 nM; C and F, 70 nM. The full z-axis scale is 5 nm for panels A and D to F and 10 nm for panels B and C. The bright spots in panels B and C are protein aggregates. The working buffer was 100 mM KCl–50 mM MES. The inset in panel C is a 300-by-300-nm2 enlargement of the image. The full z-axis scale of the inset is 5 nm.
A second adsorbed layer of M1 formed in the presence of higher concentrations. The AFM image of this second layer differs from that of the first layer, presumably because of the previously discussed anisotropy of the M1 molecule (Fig. 6). Completion of this second M1 layer occurs at ∼300 nM protein in the added buffer (Fig. 7). The height of protein molecules in the second layer (4.0 ± 0.7 nm) was significantly different from that in the first layer, indicating a difference in the orientation of M1 in each layer. Further increases in the solution M1 concentration (up to 1 μM; data not shown) did not lead to the formation of a third adsorption layer, which means that two protein layers are maximal. A double layer of M1 matrix in vivo has been reported (49), although the commonly accepted view is that only the monolayer M1 matrix is physiological (12).
FIG 6.

AFM topography image of M1 adsorbed at pH 7.1 to freshly cleaved mica at a bulk concentration of 250 nM. The full z-axis scale is 10 nm. The bright spots are protein aggregates. The inset is an enlargement of the area in the white square at the upper left. The full z-axis scale of the inset is 5 nm.
FIG 7.

AFM topography images of M1 adsorbed at pH 7.1 to mica at bulk concentrations corresponding to the formation of a second adsorbed layer. Panels: A, 150 nM; B, 200 nM; C, 300 nM. The full z-axis scale is 25 nm in panel A, 10 nm in panel B, and 5 nm in panel C. The bright spots in panel A are protein aggregates in the second layer. Panel B shows the formation of an unstructured second protein layer. In panel C, only the structured second layer is shown.
For comparison, individual IFC measurements at equilibrium and AFM surface coverage data after a single M1 addition were normalized and graphed together (Fig. 8). For the normalized PD, 1.0 is to the Δφm value obtained by fitting the experimental data with equation 3 (Fig. 3). The good agreement of the data obtained by IFC and AFM supports our assumption about the linear dependence of Δφ on the amount of adsorbed protein. The inflection in the isotherm in Fig. 3 corresponds to the completion of the first protein layer.
FIG 8.

Surface coverage of M1 protein measured by AFM (green bars) (error bars, SD; n = 5) compared with Δφm-normalized PD values (red bars) (error bars, SD; n = 5).
Confirmation of electrostatic mechanism of adsorption.
With smaller amounts of DOPS in the lipid bilayer, we obtained less surface coverage at 70 nM M1 in the added bulk solution (Fig. 9), as expected (see reference 27), supporting the hypothesis that the adsorption of M1 is electrostatic in nature (23). If this hypothesis is correct, then altering the bilayer to the substrate with the same surface charge should not change the surface coverage of M1. To test this prediction of the electrostatic hypothesis, M1 was allowed to adsorb directly to a mica surface at pH 7 and then imaged by AFM. Mica possesses a negative charge in water solutions with a surface density of 0.032 C/m2 (50), similar to that of a lipid bilayer comprising 30 mol% DOPS (0.04 C/m2) (51). Topographic images of M1 on mica (Fig. 5D to F) show adsorption patterns similar to topographic images of M1 on bilayers (Fig. 5A to C). Surface coverage rose as protein was added up to the formation of a dense layer at approximately 70 nM M1 in solution (Fig. 5F), with no change in the height of the protein particles. The thickness of the protein layer measured by the nanolithography technique was 3.5 ± 0.5 nm (Fig. 10), which is the size of individual proteins determined in the experiments with the supported lipid bilayers. Thus, the binding of M1 to the charged lipids is predominantly electrostatic in nature. This seems to be also the main contribution to the M1 interaction with the inner monolayer of a viral envelope, as shown by direct EM observations of intact virions (23).
FIG 9.

Dependency of M1 adsorption density on the percentage of DOPS (from 10 to 30%) in supported lipid bilayers measured by AFM. The bulk concentration of M1 is 70 nM. Every column is an average of five individual topography images.
FIG 10.
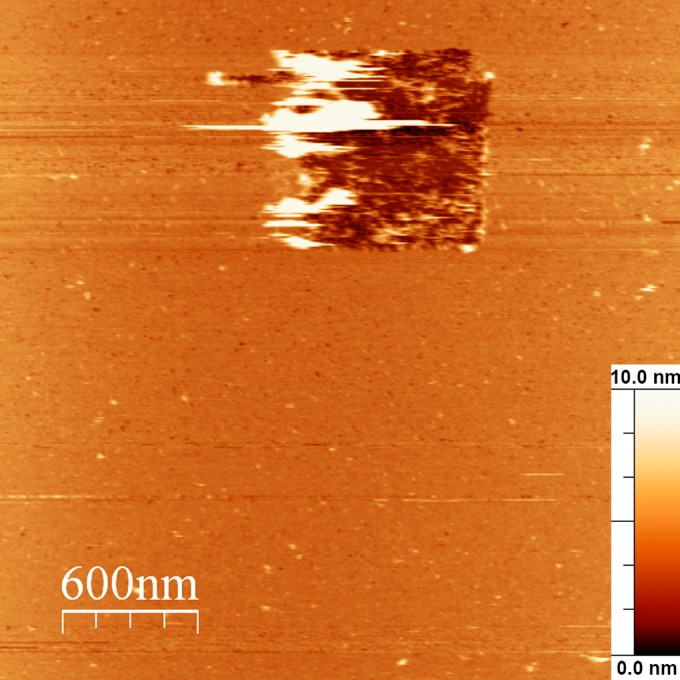
AFM topography image of the protein layer adsorbed at an M1 bulk concentration of 100 nM with a removed square patch of the protein layer with dimensions of 0.7 by 0.7 μm2. The full z-axis scale is 10 nm.
Acidification.
Since the proposed priming of influenza virus at pH 6.0 during infection alters the M1-RNP interaction (5) while disassembly of the physiologically relevant single layer of M1 should occur at a pH near 5.0 (7, 12, 13), we predicted that a completely assembled coat of M1 on a surface would be stable if exposed to pH 6 buffer after its formation at neutral pH but would subsequently disintegrate if exposed to pH 5 buffer. To test the first part of this prediction, M1 was allowed to adsorb at pH 7.1 to the surface of a supported DOPS-DOPC lipid bilayer (Fig. 5C) and then the buffer was changed to one with a pH of 6.0. No changes in protein layer structure were detected for up to 1 h of incubation at pH 6 (data not shown), nor were any changes detected at pH 6 in a complete coat formed on a bare mica surface. However, the pattern was different when the protein was adsorbed from buffers at pH 6.0: a sparser layer resulted in the occupation of only 65% ± 6% (standard deviation [SD]; n = 5) of the surface (Fig. 11B and E).
FIG 11.

AFM topography images of M1 protein layer structures on supported BLMs (A to C) and mica (D to F). (A, D) Changes in M1 layer structure upon a pH drop from 7.1 to 5.0 or pH transitions from 7.1 to 6.0 to 5.0. The bright spots are protein aggregates. (B, E) M1 initially adsorbed at pH 6.0. (C, F) M1 initially adsorbed at pH 5.0. The protein bulk concentration was 70 nM. The working buffer was 100 mM KCl–50 mM MES. The full z-axis scale is 10 nm in panels A to D and 5 nm in panels E and F.
To test the second part of the prediction, M1 was allowed to adsorb at pH 7.1 to the surface of a supported DOPS-DOPC lipid bilayer and mica (see Fig. 5C and F) and then the buffer was changed to one with a pH of 5.0 or stepwise to pH 5.0 through pH 6.0 (1 h of incubation at each step). A significant change in protein layer structure resulted at pH 5.0, regardless of the number of steps, with surface-attached oligomeric clusters and separate M1 molecules observed with notable gaps between them (Fig. 11A and D) along with the formation of large protein aggregates above the layer. A similar pattern but with smaller amounts of aggregates was obtained when M1 adsorbed to supported lipid bilayers directly from pH 5 solutions (Fig. 11C and F) with a lot of free space between M1 molecules. The whole structure of the layer was different from that seen under neutral conditions and from that seen after direct adsorption from pH 6 solutions. Thus, in line with the reported decrease in the M1 multimerization state upon a drop in pH from 7 to 5 (27), acidification of M1 coats on lipid and mica surfaces to pH 5.0 results in a path-independent transition from a dense structure to the much sparser one.
Given the reversibility of M1 coat formation at neutral pH reported above, we were puzzled by the significant effect of pH 6 on M1 coat assembly but a lack thereof on M1 coat disassembly and wondered if protein-protein interactions predominated in M1 coat assembly but not in coat disassembly. To test the effect of pH 6 on M1-M1 interactions, a double layer of M1 was prepared. The protein was adsorbed at 300 nM and pH 7.1 (Fig. 7C) and then incubated at pH 6.0 for 1 h. The resulting image contained only one layer of M1 with some amount of protein aggregates above the layer (Fig. 12), which means that that incubation at pH 6 broke the connection between the two protein layers.
FIG 12.

AFM topography image of M1 protein layer structure on mica after adsorption at pH 7.1 at a concentration of 300 nM and incubation at pH 6.0 for 1 h.
Physical consequences of M1 coat disassembly at pH 5.
In contrast to the reversibility of M1 coat assembly at neutral pH, there is irreversibility of M1 adsorption to lipid bilayers in an acidic environment (28), as well as an increase in the monomer charge. Since electrostatics dominate both M1-M1 and M1-surface interactions, we hypothesize that the increased M1 charge at pH 5 leads to both stronger M1 adhesion to negatively charged surfaces and repulsion between M1 monomers. Given the limited volume and lipid material of the viral particle, we predict that the interplay of these two factors will result in an increase in the surface area of the M1 protein scaffold, resulting in stretching of the lipid bilayer and destabilization of the viral envelope. We note that this hypothesis would explain the disruption of viral particles shown in reference 11. To test this prediction, 3:7 DOPS-DOPC LUVs were loaded with the highly fluorescent Tb3+-DPA complex with EDTA in the outer buffer. EDTA chelates Tb3+ so that leakage of liposomes would result in a decrease in total fluorescence (42). As we are interested in the disintegrating effect of M1 only, we needed to subtract from the observed total leakage any possible component of leakage due to vesicle fusion, which is expected to take place at an acidic pH. M1 was added to the LUV suspension in a pH 7 buffer at a concentration that leads to monolayer coverage (75 nM). We observed a slight decrease in fluorescence intensity in the limits of 10% ± 3% (SD; n = 6, data not shown), presumably the indirect effect of protein adsorption. After the pH was changed to 6.0, the total fluorescence reached a new stationary level in approximately 15 min, regardless of the presence of M1 (Fig. 13A). This background is presumably due to acid-promoted leaky fusion events (45). In all likelihood, acidification to pH 6 does not change the M1 monolayer with its underlying lipid bilayer, consistent with the above finding that the physical properties of the M1 monolayer is not altered at pH 6.
FIG 13.

pH-induced leakage of LUVs loaded with the Tb3+-DPA complex with EDTA in the outer buffer. Adsorption of 75 nM M1 to LUVs was allowed for 15 min prior to acidification. (A) Kinetics of fluorescence intensity change in LUVs with M1 (red curve) and protein-free liposomes (green curve) upon stepwise pH drops. Arrows indicate the moments when pH changes occurred. a.u., arbitrary units. (B) LUV leakage after a change in pH. Error bars show the SD of the data; n = 4 for control experiments, and n = 6 for LUVs with M1.
Further acidification from pH 6.0 to pH 5.0 led to a 50% higher rate and extent of leakage of M1-covered liposomes (53% ± 11% [SD] fluorescence intensity decrease; n = 6) than in control experiments (35% ± 3% [SD] fluorescence intensity decrease; n = 4) (Fig. 13B). Acidification directly to pH 5.0 from pH 7.0 gave exactly the same level of intensity as the sum of the transitions from pH 7 to pH 6 and from pH 6 to pH 5 (data not shown). Thus, only the last acidification step from pH 6 to pH 5 is needed for M1 layer rearrangements. This result is consistent with the prediction that the transition from pH 6 to pH 5 would lead to stretching and disruption of the lipid membrane, measured here as leakage or promotion of leaky fusion secondary to an increase in membrane tension (11).
DISCUSSION
As we observed, at pH 7.1, M1 adsorbs reversibly, allowing estimation of the binding constant of M1 adsorption to a BLM, which is K1 = (2.6 ± 0.4) × 107 M−1. The value of K1 is typical for matrix proteins (52) and other peripheral proteins (see, e.g., references 53 and 54), so M1 can adsorb to the plasma membrane on its own, if its concentration in the cytoplasm is on the same order as 1/K1. According to reference 55, wild-type M1 concentrates predominantly in the nuclear region, and only the acylated mutant form of M1 was found on the plasma membrane. Thus, trafficking of M1 to the plasma membrane possibly involves other proteins, although negatively charged lipids on the inner leaflet of the plasma membrane enhance M1 binding to the membranes with the formation of net-like structures observed by EM on intact virions (23). The reversible nature of M1 adsorption under neutral conditions can also explain different forms of M1 (ribbon-like or coil structure) (23, 56) obtained in different experiments because at every moment in time, some amount of the protein inside a virion can be in a non-membrane-bound state.
According to reference 19, the C-terminal domain of M1 is responsible for protein dimerization. On the other hand, in reference 5, the authors demonstrate that this domain of the protein binds to viral RNP and dissociation of such a bond occurs at pH 6. Thus, dimerization of M1 molecules can occur not predominantly in one layer but only from one layer to another layer. These dimers dissociate at pH 6, and M1 loses its connection to RNP under such conditions. This is in good agreement with a study showing that purified M1 molecules exist in the form of monomers in acidic medium (pH 4.7) (18). In the case of the viral particle, the C domain is bound predominantly to viral RNP, and that is why two layers of M1 are atypical for most strains of influenza virus. However, in vitro we obtained such an M1 configuration in the absence of a viral RNP complex. This configuration allows us to estimate the binding constant of two M1 monomers in a dimer, which is K2 = (3.7 ± 0.3) × 106 M−1, 10 times as weak as that of M1-lipid binding.
The results presented here suggest that there is a fundamental difference in M1 adsorption to a negatively charged surface under acidic conditions and that under neutral conditions. The repulsion between the monomers at pH 5 possibly drives the conformational change in the protein molecule, changing the interacting surface between M1 monomers (16) and explaining the lower surface coverage and the completely differently layered structure of M1 matrix protein under acidic conditions (Fig. 11). For the limited volumes and lipid materials of an individual influenza viral particle, the acidification of the virus interior results in (i) increased M1-lipid interaction (28) and (ii) M1-M1 repulsion leading to destabilization of both the protein matrix and the lipid envelope (8, 11). These two electrostatic mechanisms should increase the surface area of the protein scaffold, resulting in its tighter attachment to the viral lipid envelope prior to disintegration of the M1 matrix. The tighter attachment of the remaining M1 molecules should tend to increase the surface tension of the viral envelope. This apparently paradoxical combination has been documented before (12) for tighter attachment of M1 to the viral lipid envelope despite desorption of M1 from the lipid surface under acidic conditions. Since the kinetics of both processes could vary, the experiments on LUV leakage demonstrate that the overall effect of the balance of these two processes that result from the M1 charge increase upon acidification to pH 5 is a transient break in membrane integrity, most probably through M1-induced stretching of the lipid bilayer. Since we did not observe any effect of a pH drop from 7 to 6, the change in the interaction of the M1 matrix with the lipid envelope is predicted to occur physiologically only in the late endosome (again near pH 5). While M1 molecules (at least part of them) under acidic conditions remain bound to the lipid membrane, increase of their charge should lead to charging of the electrical double layer of the electrolyte solution near the protein layer, resulting in forces tending to increase the liposome surface areas. This force is balanced by the mechanical properties of the lipid membrane, the stretching modulus of which is rather high (57). To determine if it is reasonable that the increased leakiness between pH 6 and pH 5 is due to an increase in liposome tension, regardless of the mechanism, we undertook a theoretical estimation of the possible work that derives from the electrostatics of M1 acidification (see Appendix). The results indicate that charging of M1 molecules in acidic medium can indeed induce stretching and rupture of liposomes or the viral lipid envelope. Occurring at around pH 5, this stage coincides with the formation of small fusion pores by the influenza virus HA (5). HA alone can mediate membrane fusion, as shown for HA-expressing cell systems (58, 59). On the other hand, it has also been demonstrated that the M1 scaffold prevents complete fusion and can arrest the system at the small fusion pore stage (10). This means that HA is the main fusion trigger and can produce fusion pores alone, but expansion of the pore to a size big enough for RNP release is impossible without disintegration of the M1 scaffold at the pH of the late endosome. Moreover, the mutual repulsion of M1 molecules at low pH physiologically, leading to increased lateral tension in the viral lipid envelope, would act to widen the fusion pore (60) in addition to M1's intrinsic ability to release RNP from the viral matrix.
ACKNOWLEDGMENTS
We thank S. A. Akimov and P. Pohl for fruitful discussions and S. G. Markushin and V. I. Zolotarevskii for excellent technical assistance.
This work was supported in part by Russian Scientific Foundation project 15-14-00060 (O.V.B.), Russian Foundation for Basic Research (RFBR) project 15-54-74002 (O.V.B., L.A.S., N.V.F.), and the Division of Intramural Research of the NICHD (J.Z.).
O.V.B., V.S.S., and D.G.K. designed the research. O.V.B., L.A.S., M.V.K., V.Y.T., and D.G.K. performed the experiments. O.V.B., L.A.B., J.Z., and Y.A.C. analyzed the data. N.V.F. contributed reagents/materials/analysis tools. O.V.B., D.G.K., J.Z., and Y.A.C. wrote the paper.
APPENDIX
In a theoretical estimation of the increase in liposome bilayer tension resulting from M1 coat acidification, the total energy of the system is calculated as follows:
| (A1) |
where q and q0 are the outer charges of the M1 layer corresponding to surface areas S and S0, respectively; C0 is the specific capacity of the electrical double layer; S and S0 are the actual and initial liposome surface areas; and Ka is the stretching modulus of the lipid bilayer. Minimizing this energy by S, we obtain an equilibrium liposome surface area for the given charge of the protein layer as follows:
 |
(A2) |
where σ = q/S0 is the surface charge density of the protein layer for the case of an S/S0 ratio close to 1.
Thus, the charging of M1 molecules in acidic medium will increase the surface area of liposomes, leading to their stretching. In reference 24, we showed that an M1 protein monolayer at pH 7.0 introduces a surface charge of 0.5 × 10⁻² C/m2, while this value should be 4.5 times as high at pH 5.0. Taking typical values of Ka = 250 mN/m (52) and C0 = 0.1 F/m2 for physiological conditions, we find that for 100-nm-diameter liposomes, the increase in surface area at pH 5.0 will be near 1%, which might be sufficient for the formation of defects in LUVs (61), which have no excess area, while the surface charge at pH 6 (1.6 × 10⁻² C/m2) is not enough, since it gives an area increase twice as small.
Funding Statement
N/A
REFERENCES
- 1.Lamb RA, Krug RM. 2001. Orthomyxoviridae: the viruses and their replication, p 1487–1532. In Knipe DM, Howley PM, Griffin DE, Lamb RA, Martin MA, Roizman B, Straus SE (ed), Fields virology, 4th ed Lippincott Williams & Wilkins, Philadelphia, PA. [Google Scholar]
- 2.Lamb RA, Choppin PW. 1983. The structure and replication of influenza virus. Annu Rev Biochem 52:467–506. doi: 10.1146/annurev.bi.52.070183.002343. [DOI] [PubMed] [Google Scholar]
- 3.Sun X, Whittaker GR. 2006. Entry of influenza virus, p 72–82. In Poehlmann S, Simmons G (ed), Viral entry into host cells. Springer Science & Business Media, LLC, New York, NY. [Google Scholar]
- 4.Lakadamyali M, Rust MJ, Babcock HP, Zhuang X. 2003. Visualizing infection of individual influenza viruses. Proc Natl Acad Sci U S A 100:9280–9285. doi: 10.1073/pnas.0832269100. [DOI] [PMC free article] [PubMed] [Google Scholar]
- 5.Stauffer S, Feng Y, Nebioglu F, Heilig R, Picotti P, Helenius A. 2014. Stepwise priming by acidic pH and a high K+ concentration is required for efficient uncoating of influenza A virus cores after penetration. J Virol 88:13029–13046. doi: 10.1128/JVI.01430-14. [DOI] [PMC free article] [PubMed] [Google Scholar]
- 6.Martin K, Helenius A. 1991. Nuclear transport of influenza virus ribonucleoproteins: the viral matrix protein (M1) promotes export and inhibits import. Cell 67:117–130. doi: 10.1016/0092-8674(91)90576-K. [DOI] [PubMed] [Google Scholar]
- 7.Helenius A. 1992. Unpacking the incoming influenza virus. Cell 69:577–578. doi: 10.1016/0092-8674(92)90219-3. [DOI] [PubMed] [Google Scholar]
- 8.Li S, Sieben C, Ludwig K, Hofer CT, Chiantia S, Herrmann A, Eghiaian F, Schaap IAT. 2014. pH-controlled two-step uncoating of influenza virus. Biophys J 106:1447–1456. doi: 10.1016/j.bpj.2014.02.018. [DOI] [PMC free article] [PubMed] [Google Scholar]
- 9.Kemble GW, Danieli T, White JM. 1994. Lipid-anchored influenza hemagglutinin promotes hemifusion, not complete fusion. Cell 76:383–391. doi: 10.1016/0092-8674(94)90344-1. [DOI] [PubMed] [Google Scholar]
- 10.Lee KK. 2010. Architecture of a nascent viral fusion pore. EMBO J 29:1299–1311. doi: 10.1038/emboj.2010.13. [DOI] [PMC free article] [PubMed] [Google Scholar]
- 11.Ruigrok RWH, Cremers AFM, Beyer WEP, Ronde-Verloop FM. 1984. Changes in the morphology of influenza particles induced at low pH. Arch Virol 82:181–194. doi: 10.1007/BF01311162. [DOI] [PubMed] [Google Scholar]
- 12.Fontana J, Steven AC. 2013. At low pH, influenza virus matrix protein M1 undergoes a conformational change prior to dissociating from the membrane. J Virol 87:5621–5628. doi: 10.1128/JVI.00276-13. [DOI] [PMC free article] [PubMed] [Google Scholar]
- 13.Chizmadzhev YA. 2004. The mechanisms of lipid-protein rearrangements during viral infection. Bioelectrochemistry 63:129–136. doi: 10.1016/j.bioelechem.2003.10.016. [DOI] [PubMed] [Google Scholar]
- 14.Sha B, Luo M. 1997. Structure of a bifunctional membrane-RNA binding protein, influenza virus matrix protein M1. Nat Struct Biol 4:239–244. doi: 10.1038/nsb0397-239. [DOI] [PubMed] [Google Scholar]
- 15.Harris AF, Forouhar SQ, Sha B, Luo M. 2001. The crystal structure of the influenza matrix protein M1 at neutral pH: M1-M1 protein interfaces can rotate in the oligomeric structures of M1. Virology 289:34–44. doi: 10.1006/viro.2001.1119. [DOI] [PubMed] [Google Scholar]
- 16.Safo MK, Musayev FN, Mosier PD, Zhou Q, Xie H, Desai UR. 2014. Crystal structures of influenza A virus matrix protein M1: variations on a theme. PLoS One 9:e109510. doi: 10.1371/journal.pone.0109510. [DOI] [PMC free article] [PubMed] [Google Scholar]
- 17.Arzt S, Baudin F, Barge A, Timmins P, Burmeister WP, Ruigrok RW. 2001. Combined results from solution studies on intact influenza virus M1 protein and from a new crystal form of its N-terminal domain show that M1 is an elongated monomer. Virology 279:439–446. doi: 10.1006/viro.2000.0727. [DOI] [PubMed] [Google Scholar]
- 18.Shtykova EV, Baratova LA, Fedorova NV, Radyukhin VA, Ksenofontov AL, Volkov VV, Shishkov AV, Dolgov AA, Shilova LA, Batishchev OV, Jeffries CM, Svergun DI. 2013. Structural analysis of influenza A virus matrix protein M1 and its self-assemblies at low pH. PLoS One 8:e82431. doi: 10.1371/journal.pone.0082431. [DOI] [PMC free article] [PubMed] [Google Scholar]
- 19.Zhang K, Wang Z, Liu X, Yin C, Basit Z, Xia B, Liu W. 2012. Dissection of influenza A virus M1 protein: pH-dependent oligomerization of N-terminal domain and dimerization of C-terminal domain. PLoS One 7:e37786. doi: 10.1371/journal.pone.0037786. [DOI] [PMC free article] [PubMed] [Google Scholar]
- 20.Lenard J, Wong CY, Compans RW. 1974. Association of the internal membrane protein with the lipid bilayer in influenza virus. A study with the fluorescent probe 12-(9-anthroyl)-stearic acid. Biochim Biophys Acta 332:341–349. [Google Scholar]
- 21.Bucher DJ, Kharitonenkov IG, Zakomirdin JA, Grigoriev VB, Klimenko SM, Davis JF. 1980. Incorporation of influenza virus M-protein into liposomes. J Virol 36:586–590. [DOI] [PMC free article] [PubMed] [Google Scholar]
- 22.Gregoriades A, Frangione B. 1981. Insertion of influenza M protein into the viral lipid bilayer and localization of site of insertion. J Virol 40:323–328. [DOI] [PMC free article] [PubMed] [Google Scholar]
- 23.Ruigrok RWH, Barge A, Durrer P, Brunner J, Ma K, Whittaker GR. 2000. Membrane interaction of influenza virus M1 protein. Virology 267:289–298. doi: 10.1006/viro.1999.0134. [DOI] [PubMed] [Google Scholar]
- 24.Kretzschmar E, Bui M, Rose JK. 1996. Membrane association of influenza virus matrix protein does not require specific hydrophobic domains or the viral glycoproteins. Virology 220:37–45. doi: 10.1006/viro.1996.0283. [DOI] [PubMed] [Google Scholar]
- 25.Gerl MJ, Sampaio JL, Urban S, Kalvodova L, Verbavatz JM, Binnington B, Lindemann D, Lingwood CA, Shevchenko A, Schroeder C, Simons K. 2012. Quantitative analysis of the lipidomes of the influenza virus envelope and MDCK cell apical membrane. J Cell Biol 196:213–221. doi: 10.1083/jcb.201108175. [DOI] [PMC free article] [PubMed] [Google Scholar]
- 26.Shishkov AV, Bogacheva EN, Dolgov AA, Chulichkov AL, Knyazev DG, Fedorova NV, Ksenofontov AL, Kordyukova LV, Lukashina EV, Mirsky VM, Baratova LA. 2009. The in situ structural characterization of the influenza A virus matrix M1 protein within virion. Protein Pept Lett 16:1407–1413. doi: 10.2174/092986609789353682. [DOI] [PubMed] [Google Scholar]
- 27.Hilsch M, Goldenbogen B, Sieben C, Höfer CT, Rabe JP, Klipp E, Herrmann A, Chiantia S. 2014. Influenza A matrix protein M1 multimerizes upon binding to lipid membranes. Biophys J 107:912–923. doi: 10.1016/j.bpj.2014.06.042. [DOI] [PMC free article] [PubMed] [Google Scholar]
- 28.Knyazev DG, Radyuhin VA, Sokolov VS. 2009. Intermolecular interactions of influenza M1 proteins on the model lipid membrane surface: a study using the inner field compensation method. Biochemistry (Mosc) Suppl Ser A Membr Cell Biol 3:81–89. [Google Scholar]
- 29.Kordyukova LV, Serebryakova MV, Polyakov VY, Ovchinnikova TV, Smirnova YA, Fedorova NV, Baratova LA. 2008. Influenza A virus M1 protein structure probed by in situ limited proteolysis with bromelain. Protein Pept Lett 15:922–930. doi: 10.2174/092986608785849254. [DOI] [PubMed] [Google Scholar]
- 30.Zhirnov O. 1992. Isolation of matrix protein M1 from influenza viruses by acid-dependent extraction with nonionic detergent. Virology 186:324–330. doi: 10.1016/0042-6822(92)90090-C. [DOI] [PubMed] [Google Scholar]
- 31.Laemmli UK. 1970. Cleavage of structural proteins during the assembly of the head of bacteriophage T4. Nature 227:680–685. doi: 10.1038/227680a0. [DOI] [PubMed] [Google Scholar]
- 32.Mueller P, Rudin DO, Tien HT, Wescott WC. 1963. Methods for the formation of single bimolecular lipid membranes in aqueous solution. J Phys Chem 67:534–535. doi: 10.1021/j100796a529. [DOI] [Google Scholar]
- 33.Sokolov VS, Kuz'min VG. 1980. Measurement of the differences in the surface potentials of bilayer membranes according to the second harmonic of a capacitance current. Biofizika 25:170–172. (In Russian.) [PubMed] [Google Scholar]
- 34.Sokolov VS, Pohl P. 2009. Membrane transport of singlet oxygen monitored by dipole potential measurements. Biophys J 96:77–85. doi: 10.1529/biophysj.108.135145. [DOI] [PMC free article] [PubMed] [Google Scholar]
- 35.Vorotyntsev MA, Ermakov YA, Markin VS, Rubashkin AA. 1993. Distribution of the interfacial potential drop in a situation when ionic solution components enter a surface-layer of finite thickness with fixed space-charge. Russ J Electrochem 29:730–748. [Google Scholar]
- 36.Bähr G, Diederich A, Vergeres G, Winterhalter M. 1998. Interaction of the effector domain of MARCKS and MARCKS-related protein with lipid membranes revealed by electric potential measurements. Biochemistry 37:16252–16261. doi: 10.1021/bi981765a. [DOI] [PubMed] [Google Scholar]
- 37.Sokolov VS, Sokolenko EA, Filinsky DV, Ermakov YA, Lopina OD, Apell HJ. 2007. Electrostatic potentials arising due to adsorption of Na+, K+-ATPase-containing membrane fragments on bilayer lipid membrane. Biol Membr (Mosc) 24:333–347. [Google Scholar]
- 38.Sokolov VS, Sokolenko EA, Sokolov AV, Dontsov AE, Chizmadzhev YA, Ostrovsky MA. 2007. Interaction of pyridinium bis-retinoid (A2E) with bilayer lipid membranes. J Photochem Photobiol B 86:177–185. doi: 10.1016/j.jphotobiol.2006.09.006. [DOI] [PubMed] [Google Scholar]
- 39.Gouy M. 1910. Sur la constitution de la charge électrique à la surface d'un électrolyte. J Phys Theor Appl 9:457–468. (In French.) doi: 10.1051/jphystap:019100090045700. [DOI] [Google Scholar]
- 40.Chapman DL. 1913. A contribution to the theory of electrocapillarity. Philos Mag Ser 6 25:475–481. doi: 10.1080/14786440408634187. [DOI] [Google Scholar]
- 41.Krenn BM, Egorov A, Romanovskaya-Romanko E, Wolschek M, Nakowitsch S, Ruthsatz T, Kiefmann B, Morokutti A, Wressnigg N, Sturlan S, Ferko B, Batishchev OV, Indenbom AV, Zhu R, Kastner M, Hinterdorfer P, Humer J, Kiselev O, Muster T, Romanova J. 2011. Single HA2 mutation increases the infectivity and immunogenicity of live attenuated H5N1 intranasal influenza vaccine candidate lacking NS1. PLoS One 6:e18577. doi: 10.1371/journal.pone.0018577. [DOI] [PMC free article] [PubMed] [Google Scholar]
- 42.Tseng AA. 2011. Removing material using atomic force microscopy with single- and multiple-tip sources. Small 7:3409–3427. doi: 10.1002/smll.201100486. [DOI] [PubMed] [Google Scholar]
- 43.Garcia-Manyes S, Domènech Ò, Sanz F, Montero MT, Hernandez-Borrell J. 2007. Atomic force microscopy and force spectroscopy study of Langmuir-Blodgett films formed by heteroacid phospholipids of biological interest. Biochim Biophys Acta 1768:1190–1198. doi: 10.1016/j.bbamem.2007.02.004. [DOI] [PubMed] [Google Scholar]
- 44.Horcas I, Fernandez R, Gomez-Rodriguez JM, Colchero J, Gomez-Herrero J, Baro AM. 2007. WSxM: a software for scanning probe microscopy and a tool for nanotechnology. Rev Sci Instrum 78:013705. doi: 10.1063/1.2432410. [DOI] [PubMed] [Google Scholar]
- 45.Sun J, Pohl EE, Krylova OO, Krause E, Agapov II, Tonevitsky AG, Pohl P. 2004. Membrane destabilization by ricin. Eur Biophys J 33:572–579. doi: 10.1007/s00249-004-0400-9. [DOI] [PubMed] [Google Scholar]
- 46.Düzgüneş N, Wilschut J. 1993. Fusion assays monitoring intermixing of aqueous contents. Methods Enzymol 220:3–14. doi: 10.1016/0076-6879(93)20069-F. [DOI] [PubMed] [Google Scholar]
- 47.Brunauer S, Emmet PH, Teller E. 1938. Adsorption of gases in multimolecular layers. J Am Chem Soc 60:309–319. doi: 10.1021/ja01269a023. [DOI] [Google Scholar]
- 48.Ebadi A, Mohammadzadeh JSS, Khudiev A. 2009. What is the correct form of BET isotherm for modeling liquid phase adsorption? Adsorption 15:65–73. doi: 10.1007/s10450-009-9151-3. [DOI] [Google Scholar]
- 49.Fujiyoshi Y, Kume NP, Sakata K, Sato SB. 1994. Fine structure of influenza A virus observed by electron cryo-microscopy. EMBO J 13:318–326. [DOI] [PMC free article] [PubMed] [Google Scholar]
- 50.Pashley RM. 1981. Hydration forces between mica surfaces in aqueous electrolyte solutions electrolyte solutions. J Colloid Interface Sci 80:153–162. doi: 10.1016/0021-9797(81)90171-5. [DOI] [Google Scholar]
- 51.Eisenberg M, Gresalfi T, Riccio T, McLaughlin S. 1979. Adsorption of monovalent cations to bilayer membranes containing negative phospholipids. Biochemistry 18:5213–5223. doi: 10.1021/bi00590a028. [DOI] [PubMed] [Google Scholar]
- 52.Soni SP, Adu-Gyamfi E, Yong SS, Jee CS, Stahelin RV. 2013. The Ebola virus matrix protein deeply penetrates the plasma membrane: an important step in viral egress. Biophys J 104:1940–1949. doi: 10.1016/j.bpj.2013.03.021. [DOI] [PMC free article] [PubMed] [Google Scholar]
- 53.Stahelin RV. 2013. Surface plasmon resonance: a useful technique for cell biologists to characterize biomolecular interactions. Mol Biol Cell 24:883–886. doi: 10.1091/mbc.E12-10-0713. [DOI] [PMC free article] [PubMed] [Google Scholar]
- 54.Minton AP. 2010. Analysis of membrane binding equilibria of peripheral proteins: allowance for excluded area of bound protein. Anal Biochem 397:247–249. doi: 10.1016/j.ab.2009.10.023. [DOI] [PMC free article] [PubMed] [Google Scholar]
- 55.Wang D, Harmon A, Jin J, Francis DH, Christopher-Hennings J, Nelson E, Montelaro RC, Li F. 2010. The lack of an inherent membrane targeting signal is responsible for the failure of the matrix (M1) protein of influenza A virus to bud into virus-like particles. J Virol 84:4673–4681. doi: 10.1128/JVI.02306-09. [DOI] [PMC free article] [PubMed] [Google Scholar]
- 56.Greber UF. 2014. How cells tune viral mechanics—insights from biophysical measurements of influenza virus. Biophys J 106:2317–2321. doi: 10.1016/j.bpj.2014.04.025. [DOI] [PMC free article] [PubMed] [Google Scholar]
- 57.Rawicz W, Olbrich KC, McIntosh T, Needham D, Evans E. 2000. Effect of chain length and unsaturation on elasticity of lipid bilayers. Biophys J 79:328–339. doi: 10.1016/S0006-3495(00)76295-3. [DOI] [PMC free article] [PubMed] [Google Scholar]
- 58.Melikyan GB, Niles WD, Peeples ME, Cohen FS. 1993. Influenza hemagglutinin-mediated fusion pores connecting cells to planar membranes: flickering to final expansion. J Gen Physiol 102:1131–1149. doi: 10.1085/jgp.102.6.1131. [DOI] [PMC free article] [PubMed] [Google Scholar]
- 59.Frolov VA, Cho M-S, Bronk P, Reese TS, Zimmerberg J. 2000. Multiple local contact sites are induced by GPI-linked influenza hemagglutinin during hemifusion and flickering pore formation. Traffic 1:622–630. doi: 10.1034/j.1600-0854.2000.010806.x. [DOI] [PubMed] [Google Scholar]
- 60.Chizmadzhev YA, Kuzmin PI, Kumenko DA, Zimmerberg J, Cohen FS. 2000. Dynamics of fusion pores connecting membranes of different tensions. Biophys J 78:2241–2256. doi: 10.1016/S0006-3495(00)76771-3. [DOI] [PMC free article] [PubMed] [Google Scholar]
- 61.Evans E, Heinrich V, Ludwig F, Rawicz W. 2003. Dynamic tension spectroscopy and strength of biomembranes. Biophys J 85:2342–2350. doi: 10.1016/S0006-3495(03)74658-X. [DOI] [PMC free article] [PubMed] [Google Scholar]