

ABSTRACT
To assess the dynamics of genetic reversion of live poliovirus vaccine in humans, we studied molecular evolution in Sabin-like poliovirus isolates from Nigerian acute flaccid paralysis cases obtained from routine surveillance. We employed a novel modeling approach to infer substitution and recombination rates from whole-genome sequences and information about poliovirus infection dynamics and the individual vaccination history. We confirmed observations from a recent vaccine trial that VP1 substitution rates are increased for Sabin-like isolates relative to the rate for the wild type due to increased nonsynonymous substitution rates. We also inferred substitution rates for attenuating nucleotides and confirmed that reversion can occur in days to weeks after vaccination. We combine our observations for Sabin-like virus evolution with the molecular clock for VP1 of circulating wild-type strains to infer that the mean time from the initiating vaccine dose to the earliest detection of circulating vaccine-derived poliovirus (cVDPV) is 300 days for Sabin-like virus type 1, 210 days for Sabin-like virus type 2, and 390 days for Sabin-like virus type 3. Phylogenetic relationships indicated transient local transmission of Sabin-like virus type 3 and, possibly, Sabin-like virus type 1 during periods of low wild polio incidence. Comparison of Sabin-like virus recombinants with known Nigerian vaccine-derived poliovirus recombinants shows that while recombination with non-Sabin enteroviruses is associated with cVDPV, the recombination rates are similar for Sabin isolate-Sabin isolate and Sabin isolate–non-Sabin enterovirus recombination after accounting for the time from dosing to the time of detection. Our study provides a comprehensive picture of the evolutionary dynamics of the oral polio vaccine in the field.
IMPORTANCE The global polio eradication effort has completed its 26th year. Despite success in eliminating wild poliovirus from most of the world, polio persists in populations where logistical, social, and political factors have not allowed vaccination programs of sustained high quality. One issue of critical importance is eliminating circulating vaccine-derived polioviruses (cVDPVs) that have properties indistinguishable from those of wild poliovirus and can cause paralytic disease. cVDPV emerges due to the genetic instability of the Sabin viruses used in the oral polio vaccine (OPV) in populations that have low levels of immunity to poliovirus. However, the dynamics responsible are incompletely understood because it has historically been difficult to gather and interpret data about evolution of the Sabin viruses used in OPV in regions where cVDPV has occurred. This study is the first to combine whole-genome sequencing of poliovirus isolates collected during routine surveillance with knowledge about the intrahost dynamics of poliovirus to provide quantitative insight into polio vaccine evolution in the field.
INTRODUCTION
Over the last 50 years, mass vaccination campaigns with oral polio vaccine (OPV) have been a key factor in the dramatic decrease in the incidence of paralytic poliomyelitis and the eradication of wild poliovirus type 2 (1–3). OPV has proven highly effective because of its ease of administration and ability to transmit to secondary contacts (4–7). OPV contains live attenuated poliovirus (Sabin) strains that exhibit significantly reduced neurovirulence and likely reduced transmissibility relative to the neurovirulence and transmissibility of wild-type poliovirus due to key attenuating nucleotide substitutions (1, 7). However, in a vaccine recipient or close contact, the vaccine strains experience significant positive selection pressure that drives reversion of the attenuating nucleotide substitutions. In the absence of sufficient population immunity, the ability to be transmitted allows vaccine-derived poliovirus (VDPV) strains to circulate, evolve, and cause outbreaks of poliomyelitis indistinguishable from those caused by wild-type poliovirus.
Understanding the rates of nucleotide substitution early in the vaccine reversion process is critical to the development of a quantitative understanding of the processes leading to circulating VDPV (cVDPV) emergence. Due to genetic drift and selection, the Sabin strains distributed in OPV evolve to first become Sabin-like viruses that are defined to have genetic sequences that closely match the genetic sequence of the originating vaccine strain (<10 VP1 mutations for types 1 and 3; <6 VP1 mutations for type 2) (8). Sustained persistence in the human population allows further evolution into VDPV, of which the cVDPVs are a subset that are confirmed to be circulating by epidemiological investigation and genetic linkage. The substitution rate of the VP1 gene, estimated from the number of VP1 substitutions between the genome sequence of the sampled isolate and that of the vaccine strain, is used to estimate the transmission time from the time of vaccination to the time of cVDPV detection. For circulating wild-type polioviruses, the neutral substitution rate of the VP1 region of the capsid is approximately 2.8 × 10⁻⁵ nucleotides (nt) per site per day (9). This is approximately 0.025 nt per day, equivalent to 9 VP1 sites per year. Most of these substitutions are synonymous (dn/ds = 0.03, where dn is the rate of nonsynonymous substitutions and ds is the rate of synonymous substitutions) (8). However, previous studies have indicated that in Sabin strains, reversion of known attenuating sites can occur within the duration of a single infection and that VP1 substitutions accumulate more quickly than would be expected from the wild-type neutral substitution rate; multiple VP1 substitutions occur within the first month after administration of the vaccine dose (10–15). In addition, most reported cVDPV isolates are recombinants with Sabin-derived capsid and enterovirus C (poliovirus and nonpoliovirus) noncapsid sequences, although the role of selection pressure in this process is not clear (1, 2, 11, 16–26). cVDPV has become a significant source of poliomyelitis. A better understanding of the timeline of events leading to cVDPV emergence may provide a basis for improved estimates of the risk of cVDPV emergence and is critical for improving models of OPV cessation and postcessation outbreak response strategies.
Here we describe 241 Sabin-like isolates collected in Nigeria via routine acute flaccid paralysis (AFP) surveillance during the period from 2009 through 2012. With the aid of a detailed intrahost model of poliovirus infection (27), we confirm that the VP1 substitutions accumulate at significantly higher rates in Sabin-like isolates than in circulating wild-type poliovirus and that the rates observed in this OPV-experienced population are consistent with the rates observed in newborns (14). We confirm that many key attenuating sites known to be responsible for the low neurovirulence and reduced replicative fitness of the vaccine strains revert in days to weeks during primary vaccine-induced infections. We identified Sabin-like isolates containing consensus recombinant genomes and compared their sequences with those of known cVDPV index case isolates. We found that cVDPV index case isolates are associated with a higher frequency of recombination with non-Sabin enteroviruses but that recombination rates that account for the time since vaccination are comparable in VDPV index case isolates and Sabin-like isolates.
MATERIALS AND METHODS
Viruses.
Viral isolates were obtained from stool samples collected during routine surveillance for AFP in Nigeria from 2009 to 2012 (28). Individuals were drawn from 35 of Nigeria's 36 states and Abuja, the federal capital. The age at the time of paralysis ranged from 0 to 12 years (mean, 2.5 years), the number of reported lifetime OPV doses ranged from 0 to 24 (mean, 4.9), and the precise timing of vaccination was rarely reported. The typical vaccination history contains more than the three recommended doses because polio vaccination in Nigeria is dominated by supplementary immunization activities (SIAs), and roughly 8 SIAs per year were typical during this time period (29–31) (Fig. 1). Isolates that were categorized as “Sabin-like” by intratypic differentiation using real-time reverse transcription-PCR (32, 33) were included in the study. After samples that contained mixtures of multiple poliovirus strains (about 15% of all available samples) were excluded, the initial sample set was reduced to 241 monotypic samples from 238 unique individuals. Because our focus was on mutation in Sabin-like isolates, we also excluded from the study an additional 168 type 1 wild polioviruses, 354 type 3 wild polioviruses, and 216 cVDPV type 2 isolates that were collected within the same time period (29–31).
FIG 1.
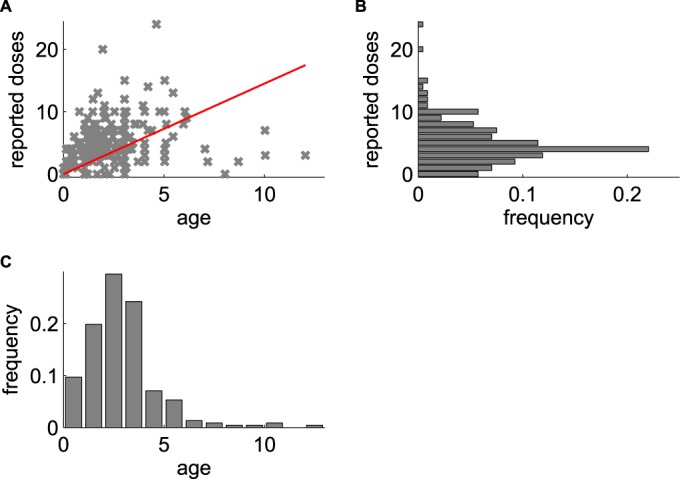
Sample population age and vaccination exposure. (A) Reported number of OPV doses versus age (in years) for each AFP case included in this study; red line, best fit of mean doses per year of 1.45. (B) Histogram of normalized number of reported doses. (C) Histogram of normalized age at paralysis.
Poliovirus genome sequencing and assembly.
Total nucleic acid was extracted from 200 μl of each virus isolate using a MagNA Pure compact nucleic acid isolation kit and a MagNA Pure compact automated extractor (Roche Applied Science, Indianapolis, IN). For each isolate, two fragments of the genome were amplified using primers 5′ NCR (5′-AAGCAGGCTTTAAAACAGCTCTGGGGTT-3′) and 3′ NCR (5′-TCTCCGAATTAAAGAAAAATTTACCCCTACA-3′) and primer Internal Y7 (5′-GGGTTTGTGTCAGCCTGTAATGA-3′) and Internal Q8(367) (5′-AAGAGGTCTCTRTTCCACAT-3′) (34). Barcoded sequencing libraries were prepared using Nextera DNA sample preparation kits (Epicentre, Madison, WI). Next-generation whole-genome sequencing was performed by the use of 36-bp single-end reads on an Illumina GAIIx instrument (htSEQ, Seattle, WA). The preliminary quality evaluation for each sample was generated using the FASTQC program (version 0.10.1; Babraham Bioinformatics [http://www.bioinformatics.babraham.ac.uk/projects/fastqc/]). We preprocessed the raw data to remove the bases or reads with poor quality, reads containing adaptor sequences, and reads containing ambiguous base calls before performing downstream analysis using the CLC Genomics Workbench program (version 6.5.1; CLC Bio). All scores for sample per base sequence quality and sample per sequence quality passed the evaluation with the quality control software performed after the trimming process. A summary of each evaluation of the quality of the trimmed reads was extracted into Excel software tables and is available upon request. See Fig. 2 for more information about sample classification.
FIG 2.
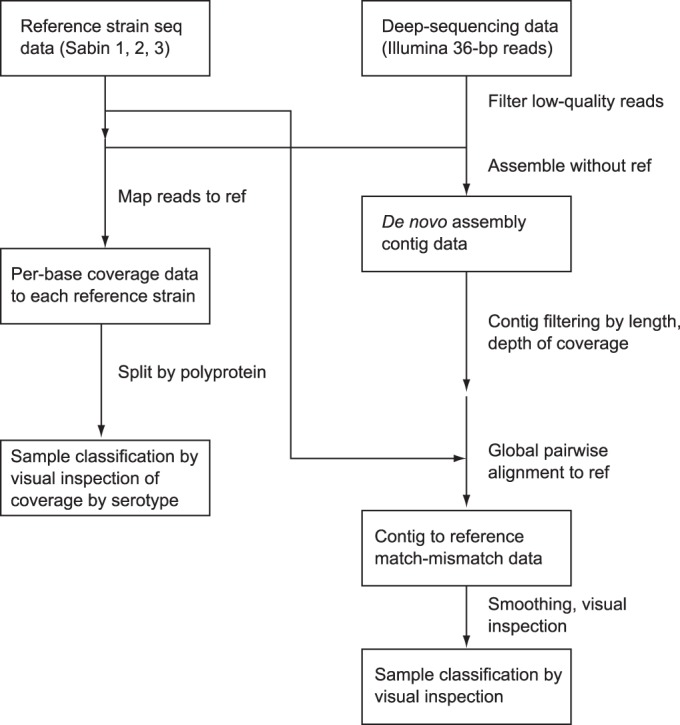
Flowchart describing the sample classification procedure. For the alignment of the consensus sequence to both the reference sequence (ref) and the de novo assembly, our primary goal was to identify the primary consensus genotype and remove any mixtures that got through the initial intratypic differentiation process.
Consensus sequences were constructed as follows: the filtered reads were aligned with the bowtie program (35) to the three Sabin reference sequences (sequences with GenBank accession numbers AY184219, AY184220, AY184221), single nucleotide variants were identified using SAMTools (36) and the VarScan program (37), the serotype was determined by maximum mean coverage, and the consensus sequence was defined as the most common nucleotide at each position. Poliovirus serotype was assigned on the basis of the VP1 sequence, according to standard practice (38).
We also constructed de novo assemblies of the trimmed reads using both CLC Bio software and the SSAKE algorithm (28). The assemblies generated by CLC Bio were compared to those generated by the SSAKE algorithm. The assemblies generated by CLC Bio were selected for further analysis due to their longer contig lengths and better quality scores (the de novo assemblies are available upon request). For each sample, all contigs that were longer than 200 nucleotides and that had a mean coverage depth of more than 10% of that of the longest contig were selected for further analysis. The sequence of each contig was pairwise aligned to the sequences of the three Sabin reference strains with the Needleman-Wunsch algorithm in the MATLAB program (MATLAB and Bioinformatics Toolbox release 2012a; MathWorks, Natick, MA, USA), and positions were labeled as matched or missed. The alignment match/miss was smoothed with a 200-nt window and plotted, and sample identity was determined by visual inspection; recombination breakpoints correspond to regions on a contig where the highest-quality alignment to the reference sequence changes between strains. We identified 10 samples that contained recombinant genomes with noncapsid consensus sequences: 9 contained Sabin enterovirus-Sabin enterovirus recombinants and 1 contained a Sabin enterovirus–non-Sabin enterovirus recombinant (Fig. 3 and Table 1).
FIG 3.
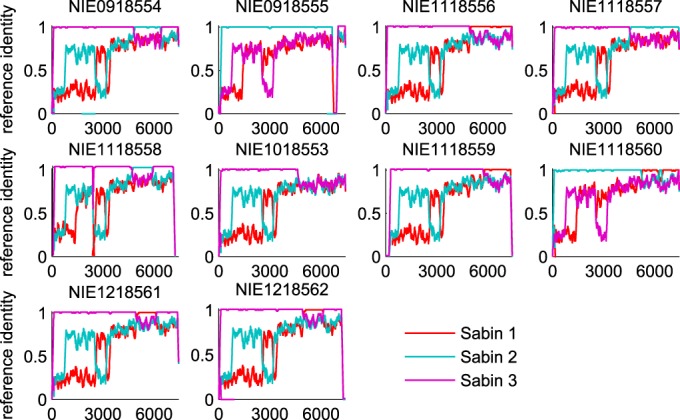
Fixed recombinant de novo alignment identities. The traces show the similarity to the reference sequence for the longest de novo contigs with the highest coverage smoothed with a 200-base sliding window. Each panel is labeled with the strain in GenBank.
TABLE 1.
Approximate description of consensus recombinant genomes
| Strain in GenBank | Description |
|---|---|
| NIE1018553a,b | Sabin type 3 with non-Sabin enterovirus 3′ end after position 4600 |
| NIE0918554a,b | Sabin type 3 with Sabin type 2 insertion between positions 4850 and 6500 |
| NIE0918555a,c | Sabin type 2 with Sabin type 3 3′ end after position 6700 |
| NIE1118556a,b | Sabin type 3 with Sabin type 1 3′ end after position 5000 |
| NIE1118557a,b | Sabin type 3 with Sabin type 2 3′ end after position 4500 |
| NIE1118558a,c | Sabin type 3 with Sabin type 2 insertion between positions 4800 and 6000 |
| NIE1118559a,b | Sabin type 3 with Sabin type 1 3′ end after position 5800 |
| NIE1118560a,b | Type 2/type 1/type 2/type 1 chimera consisting of Sabin type 2 with Sabin type 1 insertion between positions 5100 and 6200, Sabin type 2 insertion between positions 6200 and 6400, and Sabin type 1 3′ end after position 6400 |
| NIE1218561a,b | Sabin type 3 with Sabin type 1 insertion between positions 5000 and 6100 (phylogenetically related to strain NIE1218562 in GenBank) |
| NIE1218562a,b | Sabin 3 with Sabin 1 insertion between positions 5000 and 6100 (phylogenetically related to strain NIE1218561 in GenBank) |
Evidence from coverage of alignment to reference sequence.
Evidence from the full-length de novo assembly.
Evidence from the set of de novo contigs (no full-length sequence is available).
To compare our Sabin-like isolates to circulating wild-type and cVDPV strains, we determined the consensus wild-type nucleotide at each position from a global alignment of all wild-type complete genome sequences available in GenBank under the search string “Human poliovirus x complete genome,” where x is types 1 to 3. The consensus sequence was derived after exclusion by hand of vaccine-derived sequences not associated with circulating outbreaks.
Modeling of duration of infection for each sample by estimation of vaccination dates from the SIA campaign calendar and reported vaccination history.
To estimate substitution rates from observations of the number of substitutions, one must also know for each case the time interval from the start of OPV infection to the sampling time. For our samples obtained from surveillance for AFP in Nigeria, the sampling date is known, but the OPV exposure date is generally unavailable. Therefore, we used a Bayesian approach to infer a plausible range of values for the unknown exposure time point. To derive data-informed probability distributions that describe plausible exposure dates for each case, we incorporated several types of data, including shedding duration and lifetime vaccine exposure. Using Bayes' theorem, we posit that, given that shedding was observed on the sampling date, the posterior probability (P) that exposure occurred on a certain date (texposure) can be inferred by
| 1 |
where texposure is the exposure date, P(shedding | texposure) is the probability that an individual will still be shedding on the sampling day given the exposure date, and p0(texposure) is the prior probability for the exposure date independent of shedding status (throughout this paper, we obey the convention that p denotes probability densities and P denotes probabilities).
To inform the exposure date prior probability, p0(texposure), we used the fact that most vaccine recipients in Nigeria are reached by short-duration SIA campaigns (http://www.polioeradication.org/Aboutus/Strategy/Supplementaryimmunization.aspx). For each sample, we identified plausible SIA campaign sources of exposure: any campaign that administered a vaccine consistent with the observed poliovirus type in the case's state and district that also took place less than 60 days preceding the sample collection date. For 60% of the samples, at least one plausible campaign source was found. Because the bulk of an SIA campaign occurs within 3 days of the campaign start day, with additional time possibly being needed for wrap-up activities, we represented the probability of a certain exposure date, given that a campaign was observed, with a combination of a uniform and an exponential distribution:
where tcampaign start is the campaign start date. This distribution was normalized so that it was continuous at tcampaign start + 3 days. In addition to exposure from SIAs, exposure may also have resulted from unreported routine vaccination, to which we assign a constant probability P(texposure | routine), which is abbreviated γ. The routine exposure probability was set relative to the campaign exposure probability so that the odds of exposure by routine vaccination relative to exposure by SIA vaccination roughly match expectations within Nigeria for each serotype. For types 1 and 3, we assumed that γ was equal to 0.15, and for type 2, we assumed that γ was equal to 0.5. The difference between serotypes reflects the fact that bivalent type 1 and 3 OPV is more commonly used than trivalent OPV in campaigns. It is difficult to accurately estimate routine immunization exposure in Nigeria beyond knowing that it is low compared to SIA campaign exposure, but our results were insensitive to this difficult-to-estimate parameter for any plausible value (γ < 0.75). We then represented the complete exposure date prior distribution as the sum of the probability of routine exposure and the probability of SIA campaign exposure as follows:
| 2 |
Motivated by the observation that the majority of our samples contained genotypes closely matching those of the vaccine strains, we assumed that the shedding duration distribution for individual poliovirus infections determines the probability of shedding after a certain duration T, which is equal to t − texposure, P(shedding | T). The shedding duration was assumed to follow a log-normal distribution:
| 3 |
The shedding duration depends on prior immunity to each serotype, as measured by the neutralizing serum antibody titer, log(NAb), such that μ is equal to log(Tmax)[1 − kT log (NAb)] and σ is equal to σT, where Tmax is the mean duration of shedding in the absence of immunity, kT is the reduction in shedding duration due to immunity, and σT is the standard deviation of the shedding duration. From published studies (27, 39), we derived the following values: Tmax is equal to 25.3 days, kT is equal to 0.15, and σT is equal to 0.58 log(days). This shedding duration distribution encompasses the 5- to 60-day characteristic time scale of a poliovirus infection, in which higher antibody titers correlate with shorter infectious durations. Given the sampling date, we used the distribution for shedding given the duration in equation 3 to derive the distribution for shedding given exposure date P(shedding | texposure), needed in equation 1.
Because serological information is not routinely collected during surveillance for AFP, we estimated log(NAb) from the self-reported vaccination history and lifetime vaccination campaign exposure using the model developed in reference 27. The history dependence is important because the shedding duration for each individual depends on the individual's immune state and can vary significantly across individuals. First, for each individual, we estimated the number of vaccination attempts for each serotype, and then we modeled the expected antibody titer that would result from that vaccination history (assuming no waning). The estimated number of vaccination attempts for each serotype is as follows: number of vaccinations of serotype x = (reported number of lifetime doses)(number of lifetime campaigns with serotype x/number of lifetime campaigns), where the number of campaigns is determined using the campaign calendar for Nigeria provided by WHO (29–31), and multivalent vaccines were counted as independent attempts with each serotype contained in the vaccines. For children who reported known routine immunization doses, trivalent OPV was attributed to each routine dose and the campaign exposure accounted for the remaining doses only. After estimating the vaccination history of each individual, we used the antibody-dependent dose-response model in reference 27 to estimate the mean humoral antibody titer. In the model, individuals are challenged according to their vaccine history, where the probability of acquiring infection from vaccination is given by equation 9 of reference 27. We scaled the probability from the model by use of a multiplier of 0.8 to account for vaccine take in Nigerian AFP cases relative to that in healthy trial subjects (27, 40). Successful vaccinations increase the antibody titer (NAb) according to equations 3 and 4 of reference 27. Both the shedding and exposure features of the model are combined using equation 1 to construct the prior for the time interval between the date of exposure and the sampling date for each case.
To check the self-consistency of the immunity model that sets the log(NAb) parameter in equation 3, we compared the number of samples collected and the number of VP1 substitutions for each sample to the modeled estimated mean number of prior infections and estimated mean antibody titer (Fig. 4). We see that for higher levels of estimated immunity, we were less likely to detect any shedding and less likely to detect shedding at longer durations of infection (as measured by the number of VP1 mutations). Both of these observations are consistent with expectations from the literature that shedding duration and shedding probability after exposure decrease with increasing immunity (27, 41).
FIG 4.

Immunity model checking. The modeled infection history and the modeled mean OPV-induced humoral antibody titer for each AFP case versus differences in the VP1 sequence from that of the reference strain are shown. A small amount of random noise was added for visual separation. The sample count (n) and the mean number of VP1 substitutions (green bar) are shown for each column. The number of samples and the maximum duration of infection measured by the VP1 substitution rate decrease with increasing estimated immunity.
Estimation of VP1 substitution rate for Sabin-like isolates.
For each sample, we then derived the distribution of rate R given k substitutions from Bayes' theorem:
| 4 |
where the probability distribution of each possible shedding duration, p(T | shedding), was given by equation 1 and T is equal to t − texposure. For the prior distribution for R, p0(R), we assumed a normal distribution with mean and standard deviation derived from the neutral wild-type VP1 substitution rate of 0.028 ± 0.003 nucleotides per day (9). To represent the probability of each number of VP1 nucleotide substitutions k given a particular nucleotide substitution rate R and shedding duration T, we used a Poisson distribution:
The VP1 substitution rate distribution conditioned on the entire set of samples, p(R), then follows as the product over i sample estimates:
| 5 |
Vaccine stock diversity at position 2493 in Sabin type 3.
Sequencing-based studies of vaccine stocks have previously indicated that diversity may exist at certain positions, including position 2493 in Sabin type 3, especially between vaccine suppliers (42). Such diversity may affect our estimation of VP1 substitution rates for Sabin type 3; therefore, we accounted for the uncertainty in the number of substitutions at position 2493. In this case, instead of calculating the rates based solely on the observed number of substitutions relative to the reference sequence (which could inappropriately attribute reversion in the vaccine stock to evolution within people), we assumed that the number of substitutions at position 2493 that were attributable to reversion varied from 0 to the observed substitution count. This assumption was represented by a uniform distribution on the number of substitutions, which was used as a prior distribution in calculating the per base rate at position 2493 as well as the total and nonsynonymous VP1 substitution rates. In this study, we refer to position 2493 as a known attenuating site in order to be consistent with the majority of the literature.
Posterior updated exposure date distribution.
After estimating VP1 substitution rates, we performed a Bayesian update step to improve the precision of our exposure date distributions for each sample by using the information contained in the number of VP1 substitutions. The updated posterior for each sample is given by
where p(R) is the posterior VP1 substitution rate distribution.
Estimation of per base fixation rate.
To estimate a per base fixation rate, p(R ∣ k = 1), we repeated the previous calculation in equation 5 under the assumptions that substitutions reach fixation and additional substitutions at the same site occur with a negligible probability prior to sampling. In this case, we formulated the likelihood of the rate R, P(k | R, T) as
| 6 |
The prior distribution for the fixation rate, p0(R), was posed as the weighted sum of a Gaussian distribution centered at the neutral wild-type rate and a uniform distribution:
| 7 |
where 𝒩(μ, σ) is a normal distribution with mean, μ equal to 2.8 × 10⁻⁵ nt per day and σ equal to 0.28 × 10⁻⁵ nt per day, (9), and ΔR is the range of R, which spanned the interval 5 × 10⁻⁶ < R < 1 nt per day. We set γ equal to 10/7,440 to represent the assumption that approximately 10 nucleotide positions were expected to revert at rates significantly exceeding the wild-type neutral rate. This representation assumes that most sites are under weak or no selection (described by the Gaussian prior distribution) but still allows the possibility that some sites are under strong selection pressure (described by the wider uniform prior distribution). We identified sites under strong positive selection as those for which the posterior substitution rate distribution is significantly greater than the prior distribution rate in equation 7 (nonoverlapping 95% highest-density intervals). We found that when the mean posterior per base rate was 3 or more orders of magnitude above the expected wild-type neutral rate, the inference became insensitive to the details of the chosen prior. For rates higher than but closer to the expected neutral rate, the heavy weight of the prior on the Gaussian component near the wild-type neutral rate biases the posterior estimated rate to be low in comparison to that obtained with a uniform prior (γ = 1). This property of the prior encodes a Bayesian approach to multiple-testing correction: the evidence for strong selection at a site has to be sufficient to overcome the prior expectation that the site is neutral with probability (1 − γ) = 0.9987.
Estimated date to VDPV emergence from the time of vaccine administration.
To improve estimates of the time between initiation of the dose and VDPV detection (TVDPV), we propose the inclusion of information about the higher VP1 substitution rates identified from the Sabin-like isolates. Because there are no known phylogenetic lineages linking Sabin-like virus sequences to circulating outbreaks to provide definitive evidence for how the VP1 substitution rate evolves, we propose using a model where (i) VP1 sites under strong selection evolve independently at the per base rates sampled from the posterior distributions derived above and (ii) all other sites mutate randomly at the wild-type rate of 1% per year. To estimate the time to VDPV using this model, we generated 106 realizations of the model and defined VDPV using a VP1 threshold, NVDPV, of 10 substitutions for Sabin types 1 and 3 and 6 substitutions for Sabin type 2 (8). Specifically, we used the following algorithm:
Sample the rate of reversion, Rsite, for each attenuating VP1 position under strong selection from the corresponding posterior distribution. The total number of sites under strong selection is denoted Nrevert.
Sample the time to reversion, Trevert, for each attenuating nucleotide from an exponential distribution with rate Rsite as follows: p(Trevert ∣ k = 1) = Rsitee−RsiteTrevert.
Sample the time Tbackground to any given number of additional VP1 mutations from a gamma distribution with shape parameter α, which is equal to NVDPV − N, and rate parameter β, which is equal to (0.01/365)[(length of VP1) − Nrevert)].
If Tbackground is greater than the maximum value of Trevert, then VDPV has already been generated and TVDPV is equal to Tbackground.
- Else, a VDPV has not yet been generated. Sample the time to an additional background VP1 mutation from an exponential distribution with rate β and add it to Tbackground. Repeat until the number of background mutations plus the number of reverted mutations with Trevert < Tbackground is ≥NVDPV.
- If the sum is equal to NVDPV, then TVDPV is equal to Tbackground.
- Else, TVDPV is equal to max(Trevert, Tbackground).
Recombination rate estimation in samples with Sabin-like isolates.
For the consensus recombinants, we estimated a Poisson rate for recombination averaged over all serotypes and recombination breakpoint positions using the methodology described above for the VP1 substitution rate, with k being equal to the number of recombination breakpoints. A uniform distribution was assumed for the prior recombination rate distribution. For comparison, we performed a similar analysis on the index case isolates of known cVDPV type 2 lineages in Nigeria (19).
Analysis of within-sample genetic diversity.
To characterize whole-genome diversity, we calculated whole-genome entropy for each sample. We processed variant call format (VCF) files by assuming a maximum of two variants at each position (e.g., A and G at Sabin type 2 position 481). The variant frequencies at each position were p and 1 − p, where p is the frequency reported in the VCF file. We calculated Shannon entropy (H) as Σ[−p log p − (1 − p) log(1 − p)]. Per sample entropies were plotted against the mean ages of infection for the individuals providing samples, and curves were fit using least-squares regression in MATLAB (MathWorks, Natick, MA).
Accession numbers.
Consensus genome sequences for all samples are available in GenBank under consecutive accession numbers KJ170425 through KJ170677 (VP1 sequences only for recombinants are available in GenBank under accession numbers KJ170425 to KJ170435; whole-genome sequences are available for all others). The raw sequencing reads and their associated metadata are available in the Short Read Archive under consecutive BioSample accession numbers SAMN04125839 to SAMN04126091.
RESULTS
Sampled population.
We found 241 samples that contained at least one high-quality whole-genome alignment for a single strain (Sabin type 1, n = 97; Sabin type 2, n = 43; Sabin type 3, n = 101). For 3 individuals, serial stool samples expressed Sabin type 1 on one day and Sabin type 3 on another, but none of the stool samples contained a mixture of types. The relative abundances of the frequencies of the three serotypes in the samples are roughly consistent with the relative amounts of trivalent and bivalent (type 1 and 3) OPV administered in Nigeria during the time period sampled (2009 to 2012) (29–31). We also found 10 samples that contained recombinant noncapsid consensus genome sequences (Fig. 3 and Table 1).
The cases studied represent a convenience sample obtained from surveillance for AFP. OPV causes vaccine-associated paralytic poliomyelitis (VAPP) at a rate of roughly 3.8 cases per million births (range, 2.9 to 4.7 cases per million births) (43). Nigeria experienced 7 million births per year during the 4-year period sampled (http://www.unicef.org/infobycountry/nigeria_statistics.html), and so approximately 106 VAPP cases (range, 81 to 132 VAPP cases) are expected in our data set. The classification of an AFP case as VAPP depends on clinical disease status (AFP, residual paralysis at 60-day follow-up) and a history of recent vaccination (onset of paralysis within 4 to 40 days after OPV exposure) (43, 44; http://www.paho.org/hq/index.php?option=com_content&id=1934). Since the timing of vaccination is largely unreported, a formal diagnosis of VAPP is not possible for the majority of cases. However, of the 191 cases that were not lost to 60-day follow-up, 89 exhibited residual paralysis and so had conditions clinically compatible with VAPP. The remaining 102 exhibited no residual weakening and so were not clinically compatible with poliomyelitis. They represented non-polio AFP cases that had been shedding Sabin poliovirus due to recent exposure at the time of paralysis. To test if the properties of the samples might depend on the clinical outcome, we compared the distributions of the number of reported doses by residual paralysis status for each serotype and found no significant differences (P > 0.05, pairwise Kolmogorov-Smirnov test). Similarly, there were no significant differences in age.
Estimated duration of infection: intervals between exposure and sampling dates.
The posterior exposure date distributions for the three types are shown in Fig. 5A. They represent our data-driven inferences about the typical duration of infection in field samples from patients infected with Sabin-like isolates. The mean interval from the time of exposure to the time of sample collection was 7 days, and there were no significant differences among the three types.
FIG 5.

Exposure date estimation. The exposure date for each sample was estimated from the campaign calendar and the inferred molecular clock, as described in Materials and Methods. (A) Posterior exposure date distribution for each Sabin type averaged over all samples. These posteriors can be thought of as Bayesian model predictions for the histograms of the duration of infection had the vaccination dates been known. d, days. (B) Comparison of the results obtained with the model to available data. Exposure date distributions for the 13 cases for which a self-reported recent vaccination date was listed in the AFP database are shown (green, prior; blue, posterior; red, sample date minus reported vaccination date; P values compare the reported date versus the distribution and are two-sided (pprior, P value of the prior distribution; ppost, P value of the posterior distributions); k is number of VP1 substitutions). For 9 of the 13 samples, the self-reported date is consistent with the estimate at the 95% confidence level. For the 4 samples for which the self-reported date is inconsistent with the estimate, the self-reported age of infection is older than the mean age of infection, while the number of VP1 mutations is less than the mean number of mutations in the data set, suggesting that the last reported exposure is not the source of the observed infection.
To assess the plausibility of the exposure date estimation procedure, we examined the results for the 13 samples for which a self-reported date of the most recent vaccination was available. When the last reported dose was the source of the sampled infection, the result obtained by the Bayesian method should be consistent with the report. Disagreement may show error in the model or may occur because the child received the infection from a source other than the last reported dose. Figure 5B compares the prior and posterior distributions to the date of exposure, assuming that the last reported dose was the source. The results for 9 of the 13 samples were consistent at the 95% confidence level. The results for the remaining 4 differed in ways that suggest that the reported date of last exposure was not the source of the infection detected in the sample: for the mismatches, the mean reported interval between the time of sampling and the last reported exposure (33.5 days) was significantly longer than the mean reported interval for the matches (8.4 days), but the mean number of VP1 substitutions for the mismatches (k = 0.5) was less than the mean number of VP1 substitutions for the matches (k = 1.0).
VP1 substitution rates in Sabin-like isolates.
The frequencies of total VP1 substitutions for each serotype are shown in Fig. 6A. The mean number of VP1 substitutions was 0.50 for Sabin type 1, 0.63 for Sabin type 2, and 0.94 for Sabin type 3. To test if the VP1 substitution count might be correlated with clinical outcome, we compared the distributions of VP1 mutations by residual paralysis status for each serotype and found no significant differences (P > 0.05, pairwise Kolmogorov-Smirnov test).
FIG 6.

Number of VP1 substitutions and substitution rates (reported as number of nucleotides per day). (A) Fraction of samples with each number of total VP1 substitutions compared with the sequences of the Sabin strains (mean number of substitutions, 0.50 for Sabin type 1, 0.63 for Sabin type 2, and 0.94 for Sabin type 3). (B) Frequency of synonymous substitutions (means, 0.17 for Sabin type 1, 0.27 for Sabin type 2, and 0.22 for Sabin type 3). (C) Nonsynonymous substitutions (means, 0.33 for Sabin type 1, 0.36 for Sabin type 2, and 0.72 for Sabin type 3). (D to F) The wild-type substitution rate is the appropriate comparison with the VP1 substitution rate reported by Jorba et al. (9). (D) Total VP1 substitution rates. (E) VP1 synonymous site substitution rates. (F) VP1 nonsynonymous site substitution rates. The wild-type nonsynonymous site substitution rate (mean, 7.5 × 10⁻⁴ nt per day (8) is too small to be clearly visible on this scale. For Sabin type 3, as described in Materials and Methods, the estimate of the nonsynonymous mutation rate is broadened because of the uncertainty of the vaccine genotype sequence at position 2493.
From the observed VP1 substitution counts (Fig. 6A to C) and our model of the interval between the time of exposure and the time of sampling for each case, we estimated the VP1 substitution rate for each Sabin type. We estimated that substitutions in VP1 accumulate in Sabin-like isolates at rates 2 to 8 times faster than the rate that characterizes the accumulation of substitutions in circulating strains with the wild phenotype (0.28 × 10⁻⁴ ± 0.03 × 10⁻⁴ nt per site per day) (9): • Sabin type 1, 0.83 × 10⁻⁴ nt per site per day (95% highest posterior density [HPD], 0.57 × 10⁻⁴ < R < 1. 15 × 10−4 nt per site per day) • Sabin type 2, 1.07 × 10⁻⁴ nt per site per day (95% HPD, 0.65 × 10⁻⁴ < R < 1.65 × 10⁻⁴ nt per site per day) • Sabin type 3, 0.85 × 10⁻⁴ nt per site per day (95% HPD, 0.45 × 10⁻⁴ < R < 1.38 × 10⁻⁴ nt per site per day) (Fig. 6D) For types 1 and 2, the rate estimates from the full model are closely approximated by dividing the mean number of substitutions per site by the mean estimated sampling interval (7 days). For type 3, the rate estimate is adjusted downward to account for the possibility that some of the substitutions at position 2493 within VP1 were present in the vaccine stock (42) and should not be attributed to within-host evolution (see Materials and Methods).
The rates of nonsynonymous substitutions were comparable to the rates of synonymous ones (Fig. 6E and F) and, thus, were 2 orders of magnitude higher than the wild-type rate of nonsynonymous substitutions of 8.3 × 10⁻⁷ nt per site per day (9). This is due to the strong selection pressure acting in the sampled population. We also observed that synonymous substitution rates were insignificantly different from the synonymous substitution rate for the wild-type molecular clock, although the mean estimate of the rate for type 2 was twice the rate for the wild type and the estimated mean rates for types 1 and 3 (Fig. 6E).
To check the plausibility of our model-based estimates of the VP1 substitution rates, we compared our VP1 substitution rate for Sabin type 1 to the result reported in a recent longitudinal study of shedding after monovalent OPV type 1 challenge in vaccinated infants in Egypt (14). Both studies produced similar estimates for the expected number of substitutions over time, despite substantial differences in the study designs (Fig. 7).
FIG 7.
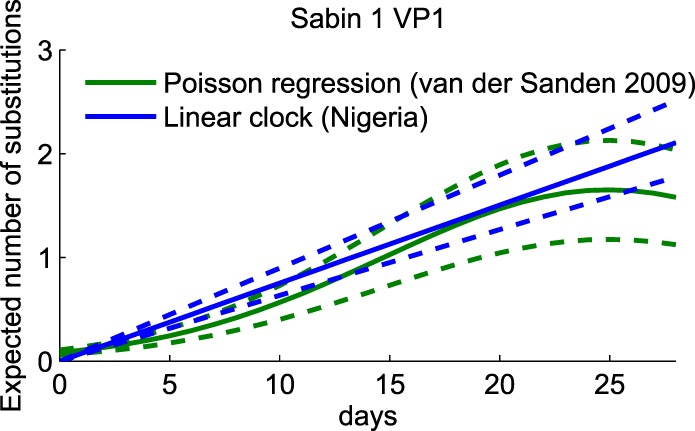
Comparison of the expected number of VP1 substitutions in Sabin type 1 for Nigerian AFP cases and Egyptian infants. Green, replot of the Poisson regression for the mean number of substitutions over time for Sabin type 1 from the work of van der Sanden et al. (14); blue, expected number of substitutions on the basis of the data in Fig. 2A for Sabin type 1; dashed lines, prediction from the mean ± standard deviation of the expected number of substitutions. Estimates are similar from both studies, despite differences in the populations sampled and the study designs.
Per base substitution rates for nonrecombinant samples.
To identify the sites under strong positive selection, we estimated the per base substitution rate at each site. Isolates with possible recombinant segments were excluded from this analysis. Results are shown in Fig. 8 and Tables 2 to 4. The rate estimates for each position derived from the full model can be approximated from the fraction of samples that contained a variant, f, which is equal to the (number of samples with substitutions)/(total number of samples), and the mean estimated interval between the time of exposure by inverting equation 7, as follows: mean estimated interval ≈ (1/7 days)[f/(1 − f)].
FIG 8.

Per base substitution rates. (A) Sabin type 1; (B) Sabin type 2; (C) Sabin type 3. Vertical bars, 95% HPD; red bars, known attenuating sites. When the rate inference is performed independently for each site, most sites are consistent with evolution at the neutral substitution rate (2.8 × 10⁻⁵ nt per site per day (9), as indicated by the 95% HPD. Sites under strong selection pressure show substitution rates that are significantly above the prior estimate for the neutral rate. Note that our estimate for position 2493 of Sabin type 3 is dramatically broadened to account for the possibility of nonnegligible variation in vaccine stock (42, 52). The results in panels A to C correspond to those in Tables 2 to 4, respectively.
TABLE 2.
Sabin type 1 sites under strong selectionh
| Nucleotidea | Amino acidb | Consensus circulating nucleotidec | No. of fixed variants (n = 97) | Mean rate (10−3 nt/day)d | Highest posterior density (10−3 nt/day) |
|||
|---|---|---|---|---|---|---|---|---|
| Lower 50% | Upper 50% | Lower 95% | Upper 95% | |||||
| G-480-A | A | 4 | 8 | 6 | 11 | 3 | 19 | |
| U-525-Cf | U | 6 | 12 | 9 | 15 | 5 | 25 | |
| U-935 | S-4065 | G (A) | 0 | ? | ||||
| C-1941-AGe | A-3059-EG | C (A) | 9 | 19 | 14 | 23 | 8 | 36 |
| A-2438-U | M-3225-L | U (L) | 2 | 0.24 | 0.02 | 0.03 | <0.02 | 4 |
| A-2747-Uf | I-1090-L | A (M) | 3 | 6 | 3 | 8 | 0.02 | 15 |
| A-2749-Gf | I-1090-M | G (M) | 8 | 17 | 12 | 20 | 7 | 31 |
| A-2795-G | T-1106-A | G (A) | 5 | 11 | 7 | 13 | 4 | 22 |
| U-2879 | F-1134 | U (F)g | 0 | ? | ||||
| C-6203-U | H-3D073-Y | U (Y) | 1 | 0.027 | 0.026 | 0.028 | 0.025 | 0.03 |
Bold indicates a known attenuating site (1, 26). Nucleotides are reported as Sabin isolate sequence-position-mutant isolate sequence.
Amino acids are reported as Sabin isolate sequence-gene position-mutant isolate sequence, as in reference 1. For example, T-1106-A indicates that the threonine (T) at position 1106 in VP1 in a Sabin type 1 strain was replaced with an alanine (A). No variant amino acid is reported for synonymous substitutions.
Consensus sequence derived from available whole-genome PV1 sequences, as described in the Materials and Methods (amino acids are given in parentheses.)
?, site is a known reverting site, but we did not observe a significant number of substitutions.
Neutralizing antigenic site (26).
The sequence of parent strain Mahoney (GenBank accession no. V01149) differs from the consensus sequence, C (L).
This table corresponds to Fig. 8A.
TABLE 4.
Sabin type 3 sites under strong selectioni
| Nucleotidea | Amino acidb | Consensus circulating nucleotidec | No. of fixed variants (n = 101) | Mean rate (10−3 nt/day) | Highest posterior density (10−3 nt/day) |
|||
|---|---|---|---|---|---|---|---|---|
| Lower 50% | Upper 50% | Lower 95% | Upper 95% HPD | |||||
| U-472-C | C | 37 | 119 | 97 | 136 | 71 | 187 | |
| G-537-A | G | 13 | 25 | 19 | 30 | 12 | 43 | |
| A-898-G | K-4052 | A (K) | 11 | 20 | 16 | 24 | 10 | 37 |
| G-1445-AUd | V-2165-LI | G (V) | 3 | 4 | 0.03 | 7 | 0.02 | 13 |
| U-2034-C | F-3091-S | C (S) | 2 | ?e | ||||
| A-2440-U | R-3226 | C (R) | 22 | 50 | 40 | 58 | 28 | 81 |
| C-2493-Uf | T-1006-I | U (I) | 56f | 81 | 0.03 | 170 | 0.02 | 385 |
| G-2636-Ag | A-1054-T | G (G) | 5 | 9 | 6 | 11 | 3 | 19 |
| C-2637-Ug | A-1054-V | U (G)h | 4 | 7 | 5 | 9 | 2 | 16 |
| A-4171-G | E-2C019 | A (N) | 4 | 7 | 5 | 9 | 2 | 16 |
| U-5832-C | I-3C135-T | C (T) | 6 | 11 | 7 | 13 | 4 | 21 |
| A-6760-U | R-3D262-S | G (S)h | 21 | 47 | 37 | 54 | 26 | 76 |
See footnote a of Table 2.
See footnote b of Table 2.
Consensus derived from available whole-genome poliovirus type 3 sequences, as described in the Materials and Methods (amino acids are given in parentheses).
Known neutralizing antigenic site (26).
?, site is a known reverting site, but we did not observe a significant number of substitutions.
To account for diversity in the vaccine stock (42), estimates for this position are broadened by assuming a uniform prior for the number of substitutions observed that are due to reversion in subjects.
The sequence of parent strain Leon (GenBank accession no. K01392) differs from the consensus sequence of circulating strains.
This table corresponds to Fig. 8C.
For 97% of sites in all serotypes, zero consensus substitutions were observed. We identified sites under strong positive selection to be sites for which the posterior estimate of the substitution rate was significantly greater than the prior estimate of the neutral rate (0.28 × 10⁻⁴ ± 0.03 × 10⁻⁴ nt per site per day) (9) (see Materials and Methods). For this data set, our definition of strong selection flags all nucleotide positions (sites) for which 3 or more samples contained a substitution at that site (a complete list of all sites with two or more fixed substitutions appears in Table 5). We identified high reversion rates at known attenuating sites in all three Sabin types.
TABLE 5.
All nucleotide positions at which two or more samples contained consensus variants
| Sabin 1 (n = 97) |
Sabin 2 (n = 43) |
Sabin 3 (n = 101) |
|||||||||
|---|---|---|---|---|---|---|---|---|---|---|---|
| Position | Amino acid in: |
No. of isolates | Position | Amino acid in: |
No. of isolates | Position | Amino acid in: |
No. of isolates | |||
| Sabin strain | Variant | Sabin strain | Variant | Sabin strain | Variant | ||||||
| 472 | U | A | 2 | 152 | U | C | 2 | 472 | U | C | 37 |
| 480 | G | A | 4 | 398 | U | C | 3 | 537 | G | A | 13 |
| 525 | U | C | 6 | 481 | A | G | 17 | 675 | A | U | 2 |
| 979 | C | U | 2 | 882 | U | C | 2 | 684 | C | U | 2 |
| 1941 | C | A/G | 9 | 1305 | U | C | 2 | 898 | A | G | 11 |
| 2438 | A | U | 2 | 2074 | A | G | 2 | 1176 | A | G | 2 |
| 2465 | A | C | 2 | 2908 | A | G | 2 | 1404 | G | A | 2 |
| 2747 | A | U | 3 | 2909 | U | A/C | 8 | 1445 | G | A/U | 3 |
| 2749 | A | G | 8 | 1567 | U | A | 2 | ||||
| 2766 | C | U | 2 | 2034 | U | C | 2 | ||||
| 2772 | C | U | 2 | 2440 | A | U | 22 | ||||
| 2795 | A | G | 5 | 2493 | C | U | 56 | ||||
| 3059 | A | U | 2 | 2636 | G | A | 5 | ||||
| 5185 | C | U | 2 | 2637 | C | U | 4 | ||||
| 5401 | A | G | 2 | 2796 | G | A | 2 | ||||
| 6008 | C | U | 2 | 2878 | C | U | 2 | ||||
| 6235 | C | U | 2 | 2973 | A | G/U | 2 | ||||
| 6322 | G | A | 2 | 3248 | A | G | 2 | ||||
| 6433 | A | G | 2 | 3262 | C | U | 2 | ||||
| 7087 | A | G | 2 | 3361 | A | G | 2 | ||||
| 7225 | C | U | 2 | 3640 | C | U | 3 | ||||
| 7303 | G | A | 2 | 3679 | C | U | 2 | ||||
| 3700 | C | U | 2 | ||||||||
| 4129 | G | A | 2 | ||||||||
| 4171 | A | G | 4 | ||||||||
| 4297 | C | U | 2 | ||||||||
| 5832 | U | C | 6 | ||||||||
| 6307 | A | G | 2 | ||||||||
| 6460 | G | A | 2 | ||||||||
| 6760 | A | U | 21 | ||||||||
| 6826 | G | A | 2 | ||||||||
| 7135 | C | U | 2 | ||||||||
For Sabin type 1 (Fig. 8A; Table 2), we observed high reversion rates for three of the six known neurovirulence-attenuating sites at positions 480, 2749, and 2795 (1, 45). Reversions at nt 2438 and 6203 are consistent with the occurrence of substitutions at the neutral rate, and reversion at nt 935 likely occurs too slowly to have been observed in this data set. Typical reversion rates at key sites for Sabin type 1 are an order of magnitude lower than those for types 2 and 3. Along with the high number of attenuating mutations in Sabin type 1 (1), the reduced reversion rates may be responsible for the reduced VAPP rate in individuals who received Sabin type 1 relative to that in individuals who received the other types (1).
For Sabin type 2 (Fig. 8B; Table 3), both attenuating sites at positions 481 and 2909 reverted quickly with respect to the wild-type baseline rate, as expected (1, 5, 10–12, 14, 16, 46, 47), with estimated mean times to reversion of 6 days and 21 days, respectively. We also observed a high substitution rate at the site at position 398, which has not been associated with neurovirulence but which is a possible second-site substitution associated with reversion at the site at position 481 (1, 48); the substitution is also represented in the consensus sequence of circulating strains derived from available poliovirus type 2 sequences in GenBank. The short time scales of reversion are such that the wild-type phenotype can be attained within the duration of a single infection (41).
TABLE 3.
Sabin type 2 sites under strong selectionf
| Nucleotidea | Amino acidb | Consensus circulating nucleotidec | No. of fixed variants (n = 43) | Mean rate (10−3 nt/day) | Highest posterior density (10−3 nt/day) |
|||
|---|---|---|---|---|---|---|---|---|
| Lower 50% | Upper 50% | Lower 95% | Upper 95% | |||||
| U-398-Cd | Ce | 4 | 21 | 13 | 27 | 6 | 48 | |
| A-481-G | G | 17 | 154 | 112 | 185 | 70 | 297 | |
| U-2909-C | I-1143-T | C (T) | 8 | 47 | 32 | 57 | 18 | 96 |
See footnote a of Table 2.
See footnote b of Table 2.
Consensus sequence derived from available whole-genome poliovirus type 2 sequences as described in the Materials and Methods (amino acids are given in parentheses.).
The sequence of parent strain P-712 (GenBank accession no. X00595) differs from the consensus sequence (U).
This table corresponds to Fig. 8B.
For Sabin type 3 (Fig. 8C; Table 4), we observed high reversion rates at the attenuating site at position 472 (1, 49–51). The site at position 472 is believed to be the primary site of neurovirulence attenuation in Sabin type 3, and the reversion rate at that nucleotide is insignificantly different from that of the homologous nucleotide at position 481 in type 2. Because of the vaccine stock diversity issue previously described in Materials and Methods (42, 52), we were unable to provide a precise estimate of the mutation rate for position 2493; the estimate provided averages over all possible substitution counts, consistent with the data described in Materials and Methods. The variation that we observed at the attenuating site at position 2034 was not sufficient to infer a significantly increased reversion rate (94 of 101 isolates had the U residue of the Sabin reference strain; 2 of 101 isolates had the fixed C of the wild-type strain; 5 of 101 isolates had diverse U and C residues [<50% of the reads in the sample reverted]). During replication, the absence of strong selection at this neurovirulence-attenuating site and possible suppression by second-site mutations at positions 2636 and 2637 (49, 53) may be partially responsible for the reduced rate of emergence of cVDPV type 3 relative to that of cVDPV types 1 and 2.
For all types, additional sites other than the known attenuating sites experience significantly higher substitution rates. As indicated in Tables 2 to 4, some of these sites have previously been observed to undergo rapid reversion but have not been associated with neurovirulence or temperature sensitivity (45, 48, 54–57). These sites may be relevant to other aspects of the replicative fitness and wild-type phenotype not described by monkey, mouse, and tissue culture assays.
We also observed significant selection at antigenic sites consisting of position 1941 in Sabin type 1 (position 56 in VP3) and position 1445 in Sabin type 3 (position 165 in VP2) (26, 48, 54–56, 58). To test for an association with prior immunity, we stratified by reported dose history and found no significant difference in the proportion of antigenic variants between cases reporting zero doses and cases reporting at least one dose (P > 0.05, two-sample z test). While we observed a significant number of antigenic variants in Sabin-like isolates, the antigenic variants were not found among the wild-type strains in GenBank (Tables 2 and 4).
To test if reversion of the primary neurovirulence-attenuating sites in the 5′ noncoding region (NCR) is associated with the residual paralysis clinical outcome, we compared the proportions of samples displaying reverted nucleotides at known attenuating sites in the 5′ NCR (nt 480 for Sabin type 1, nt 481 for Sabin type 2, nt 472 for Sabin type 3) and found no significant differences (P > 0.05, two-sample z test).
Within-sample genetic diversity increases over time.
The variant frequency data provided by Illumina sequencing provided the basis for characterizing within-sample genetic diversity and its evolution over time. Our diversity measure, the Shannon entropy, emphasizes diversification without fixation as opposed to substitution. Sites under strong selection contribute little to the entropy because significant coexistence of variants is unlikely when one variant has a much higher level of fitness. Changes in entropy over time describe the development of the quasispecies cloud, which may have its own contributions to fitness and phenotype that are not well described by fixation of substitutions (59–61).
We found that diversity increases with the estimated age of infection, and it increases faster for type 2 than for types 1 and 3 (Fig. 9). This pattern of diversification rates (type 2 > type 1 = type 3) was the same as that observed for synonymous VP1 substitutions (Fig. 6E) and is suggestive of differences in the underlying mutation rate. Increased replication fidelity has been associated with decreased replicative fitness (62, 63), and thus, this observation may also help explain the higher rate of cVDPV emergence due to type 2. Differences in diversification rates could also be due to differences in the viral population ecology within the gut, which is affected by immune status (41, 64–66). An alternative hypothesis that we cannot rule out is that our assumption that most of the samples are from primary vaccine recipients is more often false for type 2 due to higher levels of secondary spread of type 2 (6), and so we may be underestimating the range of times from the time of exposure to the time of sampling and, thus, overestimating the diversification rate. A more detailed population genetic analysis of the diversity data is in preparation.
FIG 9.

Whole-genome entropy. Red dots, whole-genome entropy per sample at the mean estimated duration of infection; blue, population mean ± 95% confidence interval of the mean. Diversity accumulates more quickly for type 2 than types 1 and 3.
Estimated date of VDPV emergence postvaccination.
The accelerated early VP1 substitution rates have implications for dating the origin of cVDPV outbreaks. Sequences are characterized as cVDPV on the basis of a VP1 substitution count threshold. Before a case is considered evidence of circulation, Sabin types 1 and 3 must accumulate at least 10 VP1 substitutions and Sabin type 2 must accumulate at least 6 VP1 substitutions (8). The assumption has been that these substitutions accumulate at the wild-type neutral rate of approximately 9 VP1 nt per year, and so it has been assumed that cVDPV lineages must be circulating for about a year (range, 240 days [type 2] to 410 days [types 1 and 3]) (1, 19, 23).
We propose to update the model of the time from the initiation of dosing to VDPV detection to account for strong selection on attenuating sites in VP1. As described in Materials and Methods, we used a model that accounts for the fast mutation of selected sites and the neutral evolution of the rest of the VP1 gene to estimate the distribution of the times from the time of initiation of the dose to the time of attainment of either 6 or 10 substitutions for Sabin type 2 or Sabin types 1 and 3, respectively: for Sabin type 1, 300 days (100 < T < 600 days); for Sabin type 2, 210 days (50 < T < 460 days); for Sabin type 3, 390 days (140 < T < 710 days) (Fig. 10). The estimate of the time to VDPV for type 2 shows that there is a finite probability that 6 VP1 substitutions can occur within the duration of a single infection in an otherwise healthy, immunologically naive individual (41).
FIG 10.
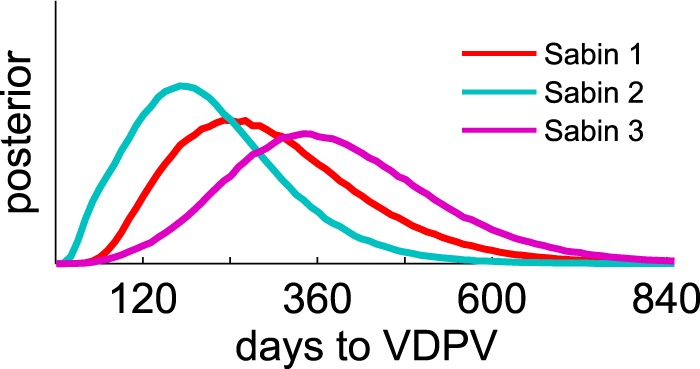
Estimated number of days to VDPV emergence from the time of vaccine administration. Distributions show the probability of the time from initiation of the vaccine dose to the VDPV emergence threshold (10 VP1 substitutions for Sabin types 1 and 3, 6 VP1 substitutions for Sabin type 2 [8]) from the two-stage evolution model (Sabin-like to wild isolates) proposed in the text. For type 2, there is a significant probability that VDPV emergence will be reached in long-lived primary infections (30 to 60 days [41]), and so VDPV type 2 genomes can appear within the duration of a single normal infection.
Evidence of circulation among samples infected with Sabin-like isolates.
To identify possible circulating lineages, we looked for sets of sequences that were closer to each other in genetic distance than they were to their Sabin parent strain with respect to the whole-genome sequence and VP1 only. We identified three pairs of sequences (two pairs for type 3, one pair for type 1) that showed evidence for linkage by descent. Summary statistics based on genetic distances are shown in Table 6, and the shared nucleotide substitutions are listed in Table 7. The evidence is stronger for type 3: the genetic divergence from the Sabin strain was greater for both pairs, and the geographic proximity was closer. All occurred in geographic locations and during periods with a low wild poliovirus incidence (29–31). No known established circulating vaccine-derived polio outbreaks caused by types 1 and 3 have occurred in Nigeria, which indicates that these lineages died out without targeted intervention. For type 2, there was no evidence of circulation of the Sabin-like sequences. Furthermore, there was no evidence that any of the type 2 Sabin-like sequences are ancestral to known cVDPV emergences (not shown).
TABLE 6.
Circulating lineages
| Sero type | Nigerian state | Sampling date | Child age (yr) | No. of OPV dosesa | GenBank accession no. | No. of nucleotide differences |
Mean estimated initiating dose dateb | |||
|---|---|---|---|---|---|---|---|---|---|---|
| VP1 |
Whole genome |
|||||||||
| From Sabin strain | From each other | From Sabin strain | From each other | |||||||
| 1 | Edo | 2 Apr 2009 | 4.4 | 7 | KJ170513 | 2 | 0 | 4 | 0 | 7 Mar 2009 |
| Rivers | 10 Apr 2009 | 8.7 | 2 | KJ170514 | 2 | 4 | ||||
| 3 | Katsina | 27 Feb 2010 | 3.0 | 2 | KJ170610 | 3 | 0 | 13 | 0 | 17 Jan 2010 |
| Katsina | 5 Mar 2010 | 3.0 | 6 | KJ170650 | 3 | 13 | ||||
| 3 | Kano | 15 Mar 2012 | 1.7 | 1 | KJ170433 | 4 | 1 | 37c | 1c | 15 Jan 2011 |
| Kano | 20 Mar 2012 | 3.0 | 0 | KJ170434 | 3 | 36c | ||||
OPV doses are self-reported by the parent/guardian.
Date estimation based on inferred VP1 substitution rates reported in Fig. 6D.
These isolates are recombinant with a Sabin type 1 insertion between approximately nt 5000 and nt 6100. Nucleotide differences based on nearly full-length de novo assemblies and gaps at the end of the alignment are excluded.
TABLE 7.
Shared substitutions for circulating lineages
| Serotype | Nigerian state source of isolates (isolate GenBank accession no.) | Positions with shared substitutions |
|---|---|---|
| 1 | Edo (KJ170513) and Rivers (KJ170514) | 2438,a,b 2749,a 2772,a,b 6008a,b |
| 3 | Katsina (KJ170610) and Katsina (KJ170650) | 472, 675,b 1176,a,b 1404,a,b 2493,a 2636,a 3248,a,b 3679,b 4297,b 5832,a 6307,b 6826,b 7135b |
| 3 | Kano (KJ170433) and Kano (KJ170434) | 472, 2493,a 2637,a 3361,b Sabin 1 insertion between approx nt 5000 and nt 6100b |
Nonsynonymous.
The substitution was observed only within the pair.
Recombination rate in Sabin-like samples.
Of the 10 consensus recombinant samples (capsid; Sabin type 2, n = 2; Sabin type 3, n = 8) identified, 2 were phylogenetically related and so we counted the pair as only one sample in the analyses described below. Breakpoints between Sabin strains were concentrated in the 2C and 3C regions (Fig. 3 and Table 1), consistent with previous observations (19, 21, 22, 67). One sample with a Sabin type 3 capsid is a recombinant near nt 4600 in region 2C with a non-Sabin virus; alignment of the de novo assembly with available non-Sabin enterovirus sequences from GenBank most closely matched sequences of coxsackieviruses in species enterovirus C (GenBank accession numbers AF499637 [coxsackie A virus type 13], AF499639 [coxsackie A virus type 17], and AF499640 [coxsackie A virus type 13] [68]). The consensus recombinants were systematically older than the viruses in the other samples: the mean estimated date since exposure was 15 days, which is significantly different from the 7-day mean for all samples. The estimated Poisson rate (R) to fix recombinant genomes averaged over all types was (184 days)−1 [range, (403 days)−1 < R < (104 days)−1].
To put our Sabin-like recombination fixation results in context, we compared them with those for the index case isolates of known cVDPV emergences in Nigeria (19). We observed that the proportion of Nigerian cVDPV index case isolates that are recombinant in the 3Dpol region with non-Sabin enteroviruses, 16 of 20, was significantly higher than that for Sabin-like fixed 3Dpol recombinants: 1 of 9 for all types aggregated (P = 0.00005, Fisher's exact test) and 0 of 2 for Sabin type 2 only (P = 0.033). However, cVDPV index case isolates are systematically more diverged from Sabin strains than the isolates in this study, and thus, more time prior to cVDPV detection is available for recombination to occur. To account for the difference in the duration of infection/circulation time, we also estimated the recombination rate prior to cVDPV emergence. Twenty of the 23 outbreaks arose from viruses with recombinant genomes containing recombinant 3Dpol (19). Based on the estimated time intervals between the time of initiation of the dose and the time of detection of the first isolate derived from VP1 substitution counts, we estimated that the recombination fixation rate (R) preceding cVDPV emergence, averaged over breakpoint position, is (300 days)−1 [range, (510 days)−1 < R < (210 days)−1]. This is not significantly different from the recombination fixation rate that we inferred for the Sabin-like isolates.
DISCUSSION
As we approach the eradication of wild poliovirus, cVDPV is of great concern, and many unknowns about the dynamics of reversion persist (1, 23). This study provides the first estimates of the whole-genome substitution rate of Sabin-like isolates from immunologically experienced individuals in a region of endemicity. It also confirms key results from the analysis of van der Sanden et al. of vaccine reversion in newborns (14): that VP1 substitutions in Sabin-like poliovirus shed by primary vaccine recipients occur at rates faster than those observed in circulating wild-type isolates.
The Poisson rate of substitution of the VP1 segment of the genome is approximately 3 to 4 times faster in Sabin-like isolates than in circulating wild strains of poliovirus. Key attenuating sites in the capsid and 5′ noncoding region begin reverting within days of vaccine administration, consistent with previous observations (10–15). Thus, it is possible for the substitutions needed to regain the wild phenotype to revert within a primary vaccine recipient, especially for type 2. This observation is consistent with studies of OPV spread that indicate that Sabin type 2 is more highly transmissible than Sabin type 1 and Sabin type 3 (6, 7). The observation that cVDPV outbreaks are rare, occurring only a few times per year, given the hundreds of millions of OPV doses administered annually, indicates the difficulty of establishing endemic circulation. However, as the world moves to a post-OPV future, decreasing intestinal immunity may make cVDPV emergence easier if OPV is used in response to outbreaks. The observations in this study will be helpful for more accurate modeling of OPV transmission to study outbreak dynamics and anticipate future risks.
The increased rate of VP1 mutations in Sabin-like isolates relative to that in the wild type has implications for inferring the timing between VDPV detection and the initiation of dosing. After accounting for fast reversion at key sites, we infer that type 2 likely requires 210 days of sustained transmission, on average, to reach VDPV emergence (versus 240 days if the wild-type rate is assumed), type 1 requires 300 days, and type 3 requires 390 days (versus 410 days if the wild-type rate for types 1 and 3 is assumed). The length of time required to reach the VDPV detection thresholds, defined empirically to correlate with cVDPV emergence, provides a measure of the number of generations of infection that are required to establish circulation, with type 3 requiring the longest chains of transmission. This is consistent with the rates of cVDPV emergence: type 2 is more common than type 1, which is more common than type 3 (23).
We found no significant associations between the clinical outcome of residual paralysis 60 days after AFP onset (a proxy for VAPP diagnosis) and case age or vaccination history. The lack of association is consistent with recently reviewed data from India which indicate that VAPP in low-income countries commonly occurs even after three or more doses of OPV (43). We also found no correlation between residual paralysis and the number of VP1 substitutions or the presence of reverted attenuating sites in the 5′ NCR. This lack of association of clinical outcome and genotype has been previously reported (49) and is not unexpected. The polioviruses found in the central nervous systems of paralytic cases are often not identical to the polioviruses excreted in stool at the time of paralysis due to possible coinfection with multiple serotypes (69) and due to within-serotype intrahost diversification to target different tissues (59, 70).
We identified circulating type 3 (and possibly type 1) vaccine strains during times or in geographic regions of low wild poliovirus transmission. As there have been no cVDPV outbreaks of those types, we can conclude that these strains that circulated briefly during a period with high rates of use of monovalent type 1 and bivalent type 1 and 3 OPV in vaccination campaigns (29–31) died out without further targeted intervention. For type 2, we did not identify any circulating Sabin-like isolates or any sequences ancestral to known cVDPV isolates. These results support the adequacy of the current operational cVDPV detection criteria for identifying problematic circulating VDPV lineages in regions with sustained vaccination coverage. They also demonstrate that it is possible to detect circulation prior to reaching the operational VDPV detection threshold and that sequencing of all Sabin-like isolates in the period after OPV cessation may be helpful for the early detection of their circulation.
We observed that cVDPV emergence is significantly more likely to be associated with non-Sabin isolate recombination prior to the index case than non-Sabin isolate recombination in Sabin-like isolates but that the recombination rates in index case isolates and Sabin-like isolates are similar. Unfortunately, these data do not provide evidence for or against the hypothesis that recombination with wild enteroviruses is advantageous relative to Sabin isolate-Sabin isolate recombination. Conclusive resolution of the question of selective advantage is unlikely to be possible without additional data about rates of coinfection with poliovirus and nonpoliovirus enteroviruses.
While our study reduces many of the uncertainties around the timing of reversion events, only limited information on the correlations between genotype and human infectivity is available (23). There are large gaps in our understanding of transmissibility in human populations that fundamentally limit our ability to predict the risk of emergence of cVDPV. Contact-tracing studies with longitudinal sampling are necessary to assess transmissibility and its dependence on genotype. Coupled with the substitution rates reported here, quantitative measures of transmissibility would allow us to model in detail the process of cVDPV emergence to better assess the risks and benefits of the vaccination strategies needed to eradicate wild poliovirus, respond to cVDPV, and transition away from OPV.
ACKNOWLEDGMENTS
We thank Annelet Vincent (CDC) for RNA extractions, Peter Sabo and Eric Haugen (University of Washington; htseq.org) for sequencing, Shanda Boyle (the Bill and Melinda Gates Foundation) for collaboration in initial study design and administration, Alex Upfill-Brown and Hil Lyons (Institute for Disease Modeling) for helpful input into the construction of the exposure dating model, Adi Stern (Tel Aviv University) for interesting discussions about the dynamics of selection, and Jing Shaw for the NCBI submission.
Funding Statement
We thank the Bill and Melinda Gates Foundation for financial support and Bill Gates and Melinda Gates for their active support of the Institute for Disease Modeling through Global Good, Bellevue, WA.
REFERENCES
- 1.Kew OM, Sutter RW, de Gourville EM, Dowdle WR, Pallansch MA. 2005. Vaccine-derived polioviruses and the endgame strategy for global polio eradication. Annu Rev Microbiol 59:587–635. doi: 10.1146/annurev.micro.58.030603.123625. [DOI] [PubMed] [Google Scholar]
- 2.Chumakov K, Ehrenfeld E, Wimmer E, Agol VI. 2007. Vaccination against polio should not be stopped. Nat Rev Microbiol 5:952–958. doi: 10.1038/nrmicro1769. [DOI] [PubMed] [Google Scholar]
- 3.Sutter RW, Maher C. 2006. Mass vaccination campaigns for polio eradication: an essential strategy for success. Curr Top Microbiol Immunol 304:195–220. [DOI] [PubMed] [Google Scholar]
- 4.World Health Organization 2012. Progress towards global interruption of wild poliovirus transmission, January 2011-March 2012. Wkly Epidemiol Rec 87:195–200. [PubMed] [Google Scholar]
- 5.Sutter RW, Kew OM, Cochi S, Aylward B. 2013. Poliovirus vaccine—live, p 598–645. In Plotkin SA, Orenstein W, Offit PA (ed), Vaccines, 6th ed Elsevier, Philadelphia, PA. [Google Scholar]
- 6.Benyesh-Melnick M, Melnick JL, Rawls WE, Wimberly I, Oro JB, Ben-Porath E, Rennick V. 1967. Studies of the immunogenicity, communicability and genetic stability of oral poliovaccine administered during the winter. Am J Epidemiol 86:112–136. [DOI] [PubMed] [Google Scholar]
- 7.Chen RT, Hausinger S, Dajani AS, Hanfling M, Baughman AL, Pallansch MA, Patriarca PA. 1996. Seroprevalence of antibody against poliovirus in inner-city preschool children. JAMA 275:1639–1645. doi: 10.1001/jama.1996.03530450029028. [DOI] [PubMed] [Google Scholar]
- 8.Wassilak S, Pate MA, Wannemuehler K, Jenks J, Burns CC, Chenoweth P, Abanida EA, Adu F, Baba M, Gasasira A, Iber J, Mkanda P, Williams A, Shaw JJ, Pallansch MA, Kew OM. 2011. Outbreak of type 2 vaccine-derived poliovirus in Nigeria: emergence and widespread circulation in an underimmunized population. J Infect Dis 203:898–909. doi: 10.1093/infdis/jiq140. [DOI] [PMC free article] [PubMed] [Google Scholar]
- 9.Jorba J, Campagnoli R, De L, Kew OM. 2008. Calibration of multiple poliovirus molecular clocks covering an extended evolutionary range. J Virol 82:4429–4440. doi: 10.1128/JVI.02354-07. [DOI] [PMC free article] [PubMed] [Google Scholar]
- 10.Evans DM, Dunn G, Minor PD, Schild GC, Cann AJ, Stanway G, Almond JW, Currey K, Maizel JV. 1985. Increased neurovirulence associated with a single nucleotide change in a noncoding region of the Sabin type 3 poliovaccine genome. Nature 314:548–550. doi: 10.1038/314548a0. [DOI] [PubMed] [Google Scholar]
- 11.Minor PD, John A, Ferguson M, Icenogle JP. 1986. Antigenic and molecular evolution of the vaccine strain of type 3 poliovirus during the period of excretion by a primary vaccinee. J Gen Virol 67:693–706. doi: 10.1099/0022-1317-67-4-693. [DOI] [PubMed] [Google Scholar]
- 12.Laassri M, Lottenbach K, Belshe R, Wolff M, Rennels M, Plotkin S, Chumakov K. 2005. Effect of different vaccination schedules on excretion of oral poliovirus vaccine strains. J Infect Dis 192:2092–2098. doi: 10.1086/498172. [DOI] [PubMed] [Google Scholar]
- 13.El-Sayed N, Yehia E-G, Abbassy A-A, Seoud I, Salama M, Kandeel A, Hossny E, Shawky A, Hussein HA, Pallansch MA, van der Avoort HG, Burton AH, Sreevatsava M, Malankar P, Wahdan MH, Sutter RW. 2008. Monovalent type 1 oral poliovirus vaccine in newborns. N Engl J Med 359:1655–1665. doi: 10.1056/NEJMoa0800390. [DOI] [PubMed] [Google Scholar]
- 14.van der Sanden S, Pallansch MA, van de Kassteele J, El-Sayed N, Sutter RW, Koopmans M, van der Avoort HG. 2009. Shedding of vaccine viruses with increased antigenic and genetic divergence after vaccination of newborns with monovalent type 1 oral poliovirus vaccine. J Virol 83:8693–8704. doi: 10.1128/JVI.02388-08. [DOI] [PMC free article] [PubMed] [Google Scholar]
- 15.Abraham R, Minor P, Dunn G, Modlin JF, Ogra PL. 1993. Shedding of virulent poliovirus revertants during immunization with oral poliovirus vaccine after prior immunization with inactivated polio vaccine. J Infect Dis 168:1105–1109. doi: 10.1093/infdis/168.5.1105. [DOI] [PubMed] [Google Scholar]
- 16.Agol V. 2006. Molecular mechanisms of poliovirus variation and evolution. Curr Top Microbiol Immunol 299:211–259. [DOI] [PubMed] [Google Scholar]
- 17.Kew OM, Wright PF, Agol V, Delpeyroux F, Shimizu H, Nathanson N, Pallansch MA. 2004. Policy and practice circulating vaccine-derived polioviruses: current state of knowledge. Bull World Health Organ 82:16–23. [PMC free article] [PubMed] [Google Scholar]
- 18.Savolainen-Kopra C, Blomqvist S. 2010. Mechanisms of genetic variation in polioviruses. Rev Med Virol 20:358–371. doi: 10.1002/rmv.663. [DOI] [PubMed] [Google Scholar]
- 19.Burns CC, Shaw J, Jorba J, Bukbuk D, Adu F, Gumede N, Pate MA, Abanida EA, Gasasira A, Iber J, Chen Q, Vincent A, Chenoweth P, Henderson E, Wannemuehler K, Naeem A, Umami RN, Nishimura Y, Shimizu H, Baba M, Adeniji A, Williams AJ, Kilpatrick DR, Oberste MS, Wassilak SG, Tomori O, Pallansch MA, Kew O. 2013. Multiple independent emergences of type 2 vaccine-derived polioviruses during a large outbreak in northern Nigeria. J Virol 87:4907–4922. doi: 10.1128/JVI.02954-12. [DOI] [PMC free article] [PubMed] [Google Scholar]
- 20.Jiang P, Faase JAJ, Toyoda H, Paul A, Wimmer E, Gorbalenya AE. 2007. Evidence for emergence of diverse polioviruses from C-cluster coxsackie A viruses and implications for global poliovirus eradication. Proc Natl Acad Sci U S A 104:9457–9462. doi: 10.1073/pnas.0700451104. [DOI] [PMC free article] [PubMed] [Google Scholar]
- 21.Combelas N, Holmblat B, Joffret M-L, Colbère-Garapin F, Delpeyroux F. 2011. Recombination between poliovirus and coxsackie A viruses of species C: a model of viral genetic plasticity and emergence. Viruses 3:1460–1484. doi: 10.3390/v3081460. [DOI] [PMC free article] [PubMed] [Google Scholar]
- 22.Jegouic S, Joffret M-L, Blanchard C, Riquet FB, Perret C, Pelletier I, Colbere-Garapin F, Rakoto-Andrianarivelo M, Delpeyroux F. 2009. Recombination between polioviruses and co-circulating coxsackie A viruses: role in the emergence of pathogenic vaccine-derived polioviruses. PLoS Pathog 5:e1000412. doi: 10.1371/journal.ppat.1000412. [DOI] [PMC free article] [PubMed] [Google Scholar]
- 23.Duintjer Tebbens RJ, Pallansch MA, Kim J-H, Burns CC, Kew OM, Oberste MS, Diop OM, Wassilak SGF, Cochi SL, Thompson KM. 2013. Oral poliovirus vaccine evolution and insights relevant to modeling the risks of circulating vaccine-derived polioviruses (cVDPVs). Risk Anal 33:680–702. doi: 10.1111/risa.12022. [DOI] [PMC free article] [PubMed] [Google Scholar]
- 24.Agol V, Belov G, Cherkasova E. 2001. Some problems of molecular biology of poliovirus infection relevant to pathogenesis, viral spread and evolution, p 43–50. In Progress in polio eradication: vaccine strategies for the end game. S. Karger AG, Basel, Switzerland. [PubMed] [Google Scholar]
- 25.Zhang Y, Zhang F, Zhu S, Chen L, Yan D, Wang D, Tang R, Zhu H, Hou X, An H, Zhang H, Xu W. 2010. A Sabin 2-related poliovirus recombinant contains a homologous sequence of human enterovirus species C in the viral polymerase coding region. Arch Virol 155:197–205. doi: 10.1007/s00705-009-0564-9. [DOI] [PubMed] [Google Scholar]
- 26.Minor PD, Ferguson M, Evans DM, Almond JW, Icenogle JP. 1986. Antigenic structure of polioviruses of serotypes 1, 2 and 3. J Gen Virol 67(Pt 7):1283–1291. doi: 10.1099/0022-1317-67-7-1283. [DOI] [PubMed] [Google Scholar]
- 27.Behrend MR, Hu H, Nigmatulina KR, Eckhoff P. 2014. A quantitative survey of the literature on poliovirus infection and immunity. Int J Infect Dis 18:4–13. doi: 10.1016/j.ijid.2013.09.005. [DOI] [PubMed] [Google Scholar]
- 28.World Health Organization. 2004. Polio laboratory manual, 4th ed World Health Organization, Geneva, Switzerland. [Google Scholar]
- 29.Centers for Disease Control and Prevention. 2010. Progress toward poliomyelitis eradication—Nigeria, January 2009-June 2010. MMWR Morb Mortal Wkly Rep 59:802–807. [PubMed] [Google Scholar]
- 30.Centers for Disease Control and Prevention. 2011. Progress toward poliomyelitis eradication—Nigeria, January 2010-June 2011. MMWR Morb Mortal Wkly Rep 60:1053–1057. [PubMed] [Google Scholar]
- 31.Centers for Disease Control and Prevention. 2012. Progress toward poliomyelitis eradication—Nigeria, January 2011-September 2012. MMWR Morb Mortal Wkly Rep 61:899–904. [PubMed] [Google Scholar]
- 32.Kilpatrick DR, Yang C-F, Ching K, Vincent A, Iber J, Campagnoli R, Mandelbaum M, De L, Yang S-J, Nix A, Kew OM. 2009. Rapid group-, serotype-, and vaccine strain-specific identification of poliovirus isolates by real-time reverse transcription-PCR using degenerate primers and probes containing deoxyinosine residues. J Clin Microbiol 47:1939–1941. doi: 10.1128/JCM.00702-09. [DOI] [PMC free article] [PubMed] [Google Scholar]
- 33.Kilpatrick DR, Ching K, Iber J, Chen Q, Yang S-J, De L, Williams AJ, Mandelbaum M, Sun H, Oberste MS, Kew OM. 2014. Identification of vaccine-derived polioviruses using dual-stage real-time RT-PCR. J Virol Methods 197:25–28. doi: 10.1016/j.jviromet.2013.11.017. [DOI] [PMC free article] [PubMed] [Google Scholar]
- 34.Kilpatrick D, Iber J, Chen Q, Ching K, Yang S, De L, Mandelbaum MD, Emery B, Campagnoli R, Burns C, Kew OM. 2011. Poliovirus serotype-specific VP1 sequencing primers. J Virol Methods 174:128–130. doi: 10.1016/j.jviromet.2011.03.020. [DOI] [PubMed] [Google Scholar]
- 35.Langmead B, Trapnell C, Pop M, Salzberg SL. 2009. Ultrafast and memory-efficient alignment of short DNA sequences to the human genome. Genome Biol 10:R25. doi: 10.1186/gb-2009-10-3-r25. [DOI] [PMC free article] [PubMed] [Google Scholar]
- 36.Li H, Handsaker B, Wysoker A, Fennell T, Ruan J, Homer N, Marth G, Abecasis G, Durbin R. 2009. The sequence alignment/Map format and SAMtools. Bioinformatics 25:2078–2079. doi: 10.1093/bioinformatics/btp352. [DOI] [PMC free article] [PubMed] [Google Scholar]
- 37.Koboldt DC, Chen K, Wylie T, Larson DE, McLellan MD, Mardis ER, Weinstock GM, Wilson RK, Ding L. 2009. VarScan: variant detection in massively parallel sequencing of individual and pooled samples. Bioinformatics 25:2283–2285. doi: 10.1093/bioinformatics/btp373. [DOI] [PMC free article] [PubMed] [Google Scholar]
- 38.Kilpatrick D, Nottay B, Yang C-F, Yang S, Da Silva E, Peñaranda S, Pallansch MA, Kew OM. 1998. Serotype-specific identification of polioviruses by PCR using primers containing mixed-base or deoxyinosine residues at positions of codon degeneracy. J Clin Microbiol 36:352–357. [DOI] [PMC free article] [PubMed] [Google Scholar]
- 39.Wagner BG, Behrend MR, Klein DJ, Upfill-Brown AM, Eckhoff PA, Hu H. 2014. Quantifying the impact of expanded age group campaigns for polio eradication. PLoS One 9:e113538. doi: 10.1371/journal.pone.0113538. [DOI] [PMC free article] [PubMed] [Google Scholar]
- 40.Mangal TD, Aylward RB, Mwanza M, Gasasira A, Abanida E, Pate MA, Grassly NC. 2014. Key issues in the persistence of poliomyelitis in Nigeria: a case-control study. Lancet Glob Health 2:e90–e97. doi: 10.1016/S2214-109X(13)70168-2. [DOI] [PubMed] [Google Scholar]
- 41.Alexander JP, Gary HE, Pallansch MA. 1997. Duration of poliovirus excretion and its implications for acute flaccid paralysis surveillance: a review of the literature. J Infect Dis 175(Suppl:S176–S182. doi: 10.1093/infdis/175.Supplement_1.S176. [DOI] [PubMed] [Google Scholar]
- 42.Neverov A, Chumakov K. 2010. Massively parallel sequencing for monitoring genetic consistency and quality control of live viral vaccines. Proc Natl Acad Sci U S A 107:20063–20068. doi: 10.1073/pnas.1012537107. [DOI] [PMC free article] [PubMed] [Google Scholar]
- 43.Platt LR, Estívariz CF, Sutter RW. 2014. Vaccine-associated paralytic poliomyelitis: a review of the epidemiology and estimation of the global burden. J Infect Dis 210(Suppl:S380–S389. doi: 10.1093/infdis/jiu184. [DOI] [PMC free article] [PubMed] [Google Scholar]
- 44.Wallace GS, Oberste MS. 2013. Poliomyelitis, p 12.1–12.9 In Roush SW, Baldy LM (ed), Manual for the surveillance of vaccine-preventable diseases. Centers for Disease Control and Prevention, Atlanta, GA. [Google Scholar]
- 45.Georgescu MM, Balanant J, Macadam A, Otelea D, Combiescu M, Combiescu A, Crainic R, Delpeyroux F. 1997. Evolution of the Sabin type 1 poliovirus in humans: characterization of strains isolated from patients with vaccine-associated paralytic poliomyelitis. J Virol 71:7758–7768. [DOI] [PMC free article] [PubMed] [Google Scholar]
- 46.Ogra PL, Faden HS, Abraham R, Duffy LC, Sun M, Minor PD. 1991. Effect of prior immunity on the shedding of virulent revertant virus in feces after oral immunization with live attenuated poliovirus vaccines. J Infect Dis 164:191–194. doi: 10.1093/infdis/164.1.191. [DOI] [PubMed] [Google Scholar]
- 47.Martinez CV, Old MO, Kwock DK, Khan SS, Garcia JJ, Chan CS, Webster R, Falkovitz-Halpern MS, Maldonado YA. 2004. Shedding of Sabin poliovirus type 3 containing the nucleotide 472 uracil-to-cytosine point mutation after administration of oral poliovirus vaccine. J Infect Dis 190:409–416. doi: 10.1086/421703. [DOI] [PubMed] [Google Scholar]
- 48.Muzychenko AR, Lipskaya GY, Maslova SV, Svitkin YV, Pilipenko EV, Nottay BK, Kew OM, Agol VI. 1991. Coupled mutations in the 5′-untranslated region of the Sabin poliovirus strains during in vivo passages: structural and functional implications. Virus Res 21:111–122. doi: 10.1016/0168-1702(91)90002-D. [DOI] [PubMed] [Google Scholar]
- 49.Macadam AJ, Arnold C, Howlett J, John A, Marsden S, Taffs F, Reeve P, Hamada N, Wareham K, Almond J. 1989. Reversion of the attenuated and temperature-sensitive phenotypes of the Sabin type 3 strain of poliovirus in vaccinees. Virology 172:408–414. doi: 10.1016/0042-6822(89)90183-9. [DOI] [PubMed] [Google Scholar]
- 50.Westrop GD, Wareham KA, Evans DM, Dunn G, Minor PD, Taffs F, Marsden S, Skinner MA, Schild GC. 1989. Genetic basis of attenuation of the Sabin type 3 oral poliovirus vaccine. J Virol 63:1338–1344. [DOI] [PMC free article] [PubMed] [Google Scholar]
- 51.Tatem JM, Weeks-Levy C, Georgiu A, DiMichele SJ, Gorgacz EJ, Racaniello VR, Cano FR, Mento SJ. 1992. A mutation present in the amino terminus of Sabin 3 poliovirus VP1 protein is attenuating. J Virol 66:3194–3197. [DOI] [PMC free article] [PubMed] [Google Scholar]
- 52.Chumakov KM, Norwood LP, Parker ML, Dragunsky EM, Ran YX, Levenbook IS. 1992. RNA sequence variants in live poliovirus vaccine and their relation to neurovirulence. J Virol 66:966–970. [DOI] [PMC free article] [PubMed] [Google Scholar]
- 53.Cann AJ, Stanway G, Hughes PJ, Minor PD, Evans DMA, Schild GC, Almond JW. 1984. Reversion to neurovirulence of the live-attenuated Sabin type 3 oral poliovirus vaccine. Nucleic Acids Res 12:7787–7792. doi: 10.1093/nar/12.20.7787. [DOI] [PMC free article] [PubMed] [Google Scholar]
- 54.Nomoto A, Omata T, Toyoda H, Kuge S, Horie H, Kataoka Y, Genba Y, Nakano Y, Imura N. 1982. Complete nucleotide sequence of the attenuated poliovirus Sabin 1 strain genome. Proc Natl Acad Sci U S A 79:5793–5797. doi: 10.1073/pnas.79.19.5793. [DOI] [PMC free article] [PubMed] [Google Scholar]
- 55.Odoom JK, Yunus Z, Dunn G, Minor PD, Martín J. 2008. Changes in population dynamics during long-term evolution of Sabin type 1 poliovirus in an immunodeficient patient. J Virol 82:9179–9190. doi: 10.1128/JVI.00468-08. [DOI] [PMC free article] [PubMed] [Google Scholar]
- 56.Christodoulou C, Colbere-Garapin F, Macadam AJ, Taffs LF, Marsden S, Minor P, Horaud F. 1990. Mapping of mutations associated with neurovirulence in monkeys infected with Sabin 1 poliovirus revertants selected at high temperature. J Virol 64:4922–4929. [DOI] [PMC free article] [PubMed] [Google Scholar]
- 57.Ren RB, Moss EG, Racaniello VR. 1991. Identification of two determinants that attenuate vaccine-related type 2 poliovirus. J Virol 65:1377–1382. [DOI] [PMC free article] [PubMed] [Google Scholar]
- 58.Minor PD, John A, Ferguson M, Icenogle JP. 1986. Antigenic and molecular evolution of the vaccine strain of type 3 poliovirus during the period of excretion by a primary vaccinee. J Gen Virol 67(Pt 4):693–706. doi: 10.1099/0022-1317-67-4-693. [DOI] [PubMed] [Google Scholar]
- 59.Vignuzzi M, Stone JKJ, Arnold JJ, Cameron CE, Andino R. 2006. Quasispecies diversity determines pathogenesis through cooperative interactions in a viral population. Nature 439:344–348. doi: 10.1038/nature04388. [DOI] [PMC free article] [PubMed] [Google Scholar]
- 60.Lauring AS, Andino R. 2010. Quasispecies theory and the behavior of RNA viruses. PLoS Pathog 6:e1001005. doi: 10.1371/journal.ppat.1001005. [DOI] [PMC free article] [PubMed] [Google Scholar]
- 61.Pfeiffer JK. 2010. Innate host barriers to viral trafficking and population diversity: lessons learned from poliovirus. Adv Virus Res 77:85–118. doi: 10.1016/B978-0-12-385034-8.00004-1. [DOI] [PMC free article] [PubMed] [Google Scholar]
- 62.Vignuzzi M, Wendt E, Andino R. 2008. Engineering attenuated virus vaccines by controlling replication fidelity. Nat Med 14:154–161. doi: 10.1038/nm1726. [DOI] [PubMed] [Google Scholar]
- 63.Pfeiffer JK, Kirkegaard K. 2005. Increased fidelity reduces poliovirus fitness and virulence under selective pressure in mice. PLoS Pathog 1:e11. doi: 10.1371/journal.ppat.0010011. [DOI] [PMC free article] [PubMed] [Google Scholar]
- 64.Glezen WP, McCollough RH, Lamb GA, Chin TDY. 1969. Quantitative relationship of preexisting homotypic antibodies to excretion of poliovirus types 1, 2 and 3 following the feeding of trivalent attenuated poliovirus vaccine. Am J Epidemiol 90:146–156. [DOI] [PubMed] [Google Scholar]
- 65.Ogra PL. 1995. Comparative evaluation of immunization with live attenuated and inactivated poliovirus vaccines. Ann N Y Acad Sci 754:97–107. doi: 10.1111/j.1749-6632.1995.tb44442.x. [DOI] [PubMed] [Google Scholar]
- 66.O'Ryan M, Bandyopadhyay AS, Villena R, Espinoza M, Novoa J, Weldon WC, Oberste MS, Self S, Borate BR, Asturias EJ, Clemens R, Orenstein W, Jimeno J, Rüttimann R, Costa Clemens SA. 26 August 2015. Inactivated poliovirus vaccine given alone or in a sequential schedule with bivalent oral poliovirus vaccine in Chilean infants: a randomised, controlled, open-label, phase 4, non-inferiority study. Lancet Infect Dis 10.1016/S1473-3099(15)00219-4. [DOI] [PubMed] [Google Scholar]
- 67.Cuervo N, Guillot S. 2001. Genomic features of intertypic recombinant Sabin poliovirus strains excreted by primary vaccinees. J Virol 75:5740–5751. doi: 10.1128/JVI.75.13.5740-5751.2001. [DOI] [PMC free article] [PubMed] [Google Scholar]
- 68.Brown B, Oberste MS, Maher K, Pallansch MA. 2003. Complete genomic sequencing shows that polioviruses and members of human enterovirus species C are closely related in the noncapsid coding region. J Virol 77:8973–8984. doi: 10.1128/JVI.77.16.8973-8984.2003. [DOI] [PMC free article] [PubMed] [Google Scholar]
- 69.Georgescu MM, Delpeyroux F, Tardy-Panit M, Balanant J, Combiescu M, Combiescu A, Guillot S, Crainic R. 1994. High diversity of poliovirus strains isolated from the central nervous system from patients with vaccine-associated paralytic poliomyelitis. J Virol 68:8089–8101. [DOI] [PMC free article] [PubMed] [Google Scholar]
- 70.Pfeiffer JK, Kirkegaard K. 2006. Bottleneck-mediated quasispecies restriction during spread of an RNA virus from inoculation site to brain. Proc Natl Acad Sci U S A 103:5520–5525. doi: 10.1073/pnas.0600834103. [DOI] [PMC free article] [PubMed] [Google Scholar]