

ABSTRACT
The introduction of West Nile virus (WNV) into North America in 1999 is a classic example of viral emergence in a new environment, with its subsequent dispersion across the continent having a major impact on local bird populations. Despite the importance of this epizootic, the pattern, dynamics, and determinants of WNV spread in its natural hosts remain uncertain. In particular, it is unclear whether the virus encountered major barriers to transmission, or spread in an unconstrained manner, and if specific viral lineages were favored over others indicative of intrinsic differences in fitness. To address these key questions in WNV evolution and ecology, we sequenced the complete genomes of approximately 300 avian isolates sampled across the United States between 2001 and 2012. Phylogenetic analysis revealed a relatively star-like tree structure, indicative of explosive viral spread in the United States, although with some replacement of viral genotypes through time. These data are striking in that viral sequences exhibit relatively limited clustering according to geographic region, particularly for those viruses sampled from birds, and no strong phylogenetic association with well-sampled avian species. The genome sequence data analyzed here also contain relatively little evidence for adaptive evolution, particularly of structural proteins, suggesting that most viral lineages are of similar fitness and that WNV is well adapted to the ecology of mosquito vectors and diverse avian hosts in the United States. In sum, the molecular evolution of WNV in North America depicts a largely unfettered expansion within a permissive host and geographic population with little evidence of major adaptive barriers.
IMPORTANCE How viruses spread in new host and geographic environments is central to understanding the emergence and evolution of novel infectious diseases and for predicting their likely impact. The emergence of the vector-borne West Nile virus (WNV) in North America in 1999 represents a classic example of this process. Using approximately 300 new viral genomes sampled from wild birds, we show that WNV experienced an explosive spread with little geographical or host constraints within birds and relatively low levels of adaptive evolution. From its introduction into the state of New York, WNV spread across the United States, reaching California and Florida within 4 years, a migration that is clearly reflected in our genomic sequence data, and with a general absence of distinct geographical clusters of bird viruses. However, some geographically distinct viral lineages were found to circulate in mosquitoes, likely reflecting their limited long-distance movement compared to avian species.
INTRODUCTION
West Nile virus (WNV) has imposed a significant disease burden on the avian population of North America since its introduction in 1999 (1). The virus infects a remarkably large number of species, with WNV-associated mortality observed in over 300 bird species spanning 30 different families, half of which are native to the United States (2, 3), although active replication may not occur in all (4). WNV has also resulted in massive population losses in several U.S. bird species, with the American crow (Corvus brachyrhynchos) experiencing the highest levels of morbidity and mortality, with disease manifested in more than 90% of infected individuals (5, 6) and a 45% decrease in population size (7). The virus is transmitted within an enzootic cycle involving mosquitoes and birds, with humans and other mammals acting as dead-end hosts (8). Although most human infections are asymptomatic, 1% of infections result in fatal neuroinvasive disease, and since 1999 more than 1,000 people have died from WNV infection in the United States (9). WNV was first reported in Uganda in 1937 and was long restricted to the Old World, with cases reported in Africa, the Middle East, and Europe (10, 11). However, the virus was not regarded as a major threat to humans, and only two large outbreaks were reported in Israel in the 1950s and in South Africa in 1974 (12). In 1996, the first major outbreak associated with severe encephalitis in humans was reported in Romania, followed by a second in Russia 2 years later (13, 14). The incidence of encephalitis has increased, with epidemics occurring regularly in Europe, Africa, and the Middle East (8, 15). In the United States, over 40,000 human disease cases resulting from WNV infection have been recorded, with a peak of 10,000 in 2003 (9).
WNV belongs to the genus Flavivirus (family Flaviviridae) of single-stranded positive-sense RNA viruses and is comprised of four lineages denoted I to IV that differ by 10 to 26% in nucleotide identity (11). The virus isolated in the United States in 1999 is classified in lineage I (1). Notably, this New World WNV exhibits higher avian virulence than other lineage I viruses (16), which has been associated with a single Thr-to-Pro amino acid change at residue 249 in the viral helicase (encoded by NS3) (17). Also of importance is a Val159Ala amino acid substitution in the viral envelope (E) gene, which was first documented in 2002; viruses carrying this mutation quickly replaced those WNV strains previously circulating in the United States (18). The E-Val159Ala mutation is now fixed in the North American WNV population and has been linked to adaptation to the main Culex spp. mosquito vectors (19, 20).
Previous phylogenetic analyses have revealed two main genetic variants of WNV in the United States; an NY99 genotype, including the first U.S. strain isolated in 1999, and a more recent WN02 genotype that replaced NY99 in 2003 (21) (although other genotypes have been proposed; see below). WNV phylogenies are also characterized by relatively little spatial structure (18, 22, 23), although a relatively large clade of mosquito WNV sequences was recently documented in California (24). In addition, birds seem to harbor greater WNV diversity than mosquitoes (25, 26).
The ongoing epidemic of WNV in the United States serves as an informative example of the successful establishment of a virus in a new environment. The high incidence and mortality of WNV in the native bird population, together with human infections, have led to intensive surveillance efforts. Indeed, the combined analysis of viral genome sequences and incidence data from birds, mosquitoes, and humans allows the evolution and spatial spread of WNV across the United States to be closely monitored (27). Herein, we report the complete genome sequences of almost 300 new WNV strains collected from dead birds across the United States from 2001 to 2012, with the aim of achieving a better understanding of the spatial and temporal dynamics of WNV during this epizootic. In particular, we sought to determine whether there are barriers to the spread of the virus across North America, including those imposed by transmission in different host species.
MATERIALS AND METHODS
Sample collection.
Wild birds were submitted to the USGS National Wildlife Health Center for determination of cause of death. A complete postmortem examination was performed, and when WNV was suspected, a tissue pool of kidney and spleen tissues was submitted for virological testing. Feather pulp samples were used for corvids, which are highly susceptible to WNV (28). Suspect samples were inoculated into flasks containing the Vero cell line, and the identity of WNV in cultures exhibiting cytopathic effects was determined via reverse transcription-PCR (RT-PCR) (29).
Genome sequencing.
RNA amplification was performed as described previously (30). Illumina library construction was performed using NexteraXT (Illumina) according to the manufacturer's protocol. Sequencing was performed on the Illumina HiSeq2500 platform, generating paired-end 101-bp reads, and de novo genome assembly was performed using the VICUNA assembly program (31).
Comparative sequence data.
Complete coding sequences of WNV were downloaded from GenBank and combined with the sequences generated here. Sequences from humans and other nonavian species were excluded, as they represent dead-end hosts and are not involved in the natural transmission cycle. Hence, we reasoned that although small in number, the inclusion of these sequences could bias estimates of evolutionary rate. In addition, it has previously been shown that human sequences fall at multiple places across the WNV phylogeny (23). Sequence alignment was performed using MAFFT (32), and these results were inspected manually. This resulted in a total of 696 unique WNV genome sequences of 10,299 nucleotides in length (298 sequences from this study and 398 from GenBank; see Table S1 in the supplemental material). These data included viruses from 38 U.S. states, 51 bird species, and 281 sequences isolated from mosquitoes and covered a time span of 14 years, from 1999 to 2012. Prior to phylogenetic analysis, sequences were inspected for possible recombination by using the single breakpoint recombination (SBP) tool available in the program HyPhy (33, 34). No recombinants were found. A maximum likelihood (ML) tree of the full data set was estimated with RAxML (version 7.2.8) (35), employing the GTR+Γ nucleotide substitution model and 200 bootstrapping replicates. For Bayesian analyses (see below), the sequences were subdivided into three data sets, denoted A, B, and C, by randomly sampling (with replacement) 300 sequences for each (see Table S1). Finally, we created a data set comprising only those sequences generated here, referred to as the “this study” data set.
Evolutionary rates.
We estimated evolutionary rates by using the Bayesian Markov chain Monte Carlo (MCMC) method implemented in the program BEAST (36). As computation time was excessive for the complete data set, we performed this analysis on WNV data subsets A, B, and C. Prior to this analysis, we used JModelTest (37) to determine the best-fit model of nucleotide substitution, which was found to be GTR+Γ. All subsequent Bayesian analyses therefore were run using a GTR+Γ nucleotide substitution model, an uncorrelated log-normal relaxed clock, and a logistic population growth prior (with the latter found to be a better fit to the data than constant population size and exponential growth demographic models). In addition, all analyses were run for at least 100 million steps, sampling every 10,000 steps to allow convergence for all parameters. The first 10% of the estimated distribution was removed as burn-in. Maximum clade credibility trees (MCC) were estimated using TreeAnnotator implemented in BEAST, with statistical support for individual nodes given as posterior probability values.
To determine the extent of temporal structure in the data, we performed a root-to-tip regression on the ML tree of the complete data set in Path-O-Gen (http://tree.bio.ed.ac.uk/software/pathogen/). We also performed a tip-date randomization test to evaluate the temporal signal in the data (38). For this, we ran 10 randomizations of data subset A in BEAST under the same evolutionary parameters as outlined above. A data set can be considered to possess temporal structure if none of the rate distributions from the randomizations overlap the rate distribution from the true data set (39).
Phylogeny-trait association tests.
To determine which epidemiological variables were best associated with the data, we performed a series of phylogeny-trait association tests using the parsimony score (PS), association index (AI), and maximum clade size (MC) statistics available within the Bayesian Tip-association Significance (BaTS) program (40), utilizing the posterior distribution of trees recovered in the BEAST analysis (data sets A to C). In particular, we sought to determine whether these WNV sequence data were more structured by geographic region (including U.S. state and avian flyway), host species, or year of sampling, rather than that expected by chance alone. To this end, we divided the United States into four regions according to the U.S. Census Bureau (https://www.census.gov/geo/reference/gtc/gtc_census_divreg.html): (i) North East: Connecticut (CT), Massachusetts (MA), Rhode Island (RI), New Jersey (NJ), New York (NY), and Pennsylvania (PA); (ii) South: District of Columbia (DC), Florida (FL), Louisiana (LA), Georgia (GA), Maryland (MD), North Carolina (NC), Virginia (VA), Alabama (AL), Kentucky (KY), Mississippi (MS), Tennessee (TN), Arkansas (AR), Oklahoma (OK), and Texas (TX); (iii) Midwest: Illinois (IL), Michigan (MI), Ohio (OH), Wisconsin (WI), Iowa (IA), Kansas (KS), Minnesota (MN), Missouri (MO), Nebraska (NE), North Dakota (ND), and South Dakota (SD); (iv) West: Arizona (AZ), Idaho (ID), Colorado (CO), Montana (MT), Nevada (NV), New Mexico (NM), and California (CA). Similarly, we subdivided the sequences into four zones reflecting broad avian migration flyways (see: http://www.ducks.org/conservation/where-we-work/flyways): (i) Atlantic (MA, CT, RI, NY, PA, NJ, MD, DC, VA, NC, GA, and FL); (ii) Mississippi (MN, LA, IA, MO, AR, WI, IL MI, KY, TN, MS, AL, and OH); (iii) Central (MT, CO, NM, ND, SD, NE, KS, OK, and TX); (iv) Pacific (CA, NV, ID, and AZ).
Analysis of selection pressures.
To determine whether any codons across the WNV genome may have been subject to adaptive evolution, manifest as a greater number of nonsynonymous (dN) than synonymous (dS) substitutions per site, we used the SLAC (single-likelihood ancestor counting), FUBAR (fast unbiased Bayesian approximation), and MEME (mixed effects model of evolution) methods (41–43) available in the HyPhy package, utilizing the GTR substitution model and the ML tree inferred for the full data set of 696 sequences. To determine whether there are instances of positive selection of individual branches of the WNV phylogeny, we employed the branch-site REL method (44) in HyPhy. In addition, we estimated the ratio of nonsynonymous to synonymous substitutions per site (dN/dS) on internal and external branches separately, using PAML (45), in which an excess of nonsynonymous substitutions on internal branches is compatible with adaptive evolution.
Nucleotide sequence accession numbers.
All sequences generated here have been deposited in GenBank under the accession numbers KJ501233 to KJ501530 (Table S1 in the supplemental material). Raw sequencer files can be found under BioProject PRJNA31237.
RESULTS
Rapid dispersal of WNV in the United States.
We sequenced WNV from dead birds sampled between 2001 and 2012, with the exception of 2011 (for which no samples were available). These data comprise 298 complete WNV genomes from 34 states and 43 different bird species, of which 101 viruses were from the American crow. Additionally, we downloaded full-length WNV genomes from GenBank, which were combined with the data generated here (see Table S1 in the supplemental material). The 398 sequences from GenBank comprised 281 isolates from mosquitoes and 117 from birds. These sequences were sampled from 11 U.S. states over a time span of 14 years (1999 to 2012). The majority of the viral sequences came from two disjunct regions in the United States, (i) New York (n = 78) and Connecticut (n = 160), as these states were focal points of the early outbreak, and (ii) California (n = 101).
Phylogenetic analysis revealed a relatively star-like tree topology, both across the tree as a whole and within individual genotypes, indicative of the explosive expansion of WNV in the United States from its introduction in 1999 (Fig. 1). To display aspects of spatial structure more clearly, we color-coded the tree according to the U.S. region from which they were isolated: Midwest, Northeast, South, and West. Visually, there was little clustering according to geographic location, especially in the avian samples, which is compatible with rapid continental spread in the absence of major geographic barriers. However, two large sequence clusters were apparent in the western United States (Fig. 1, in green), reflecting a set of viruses isolated from mosquitoes in California (24). A more quantitative analysis of geographic structure is presented below.
FIG 1.
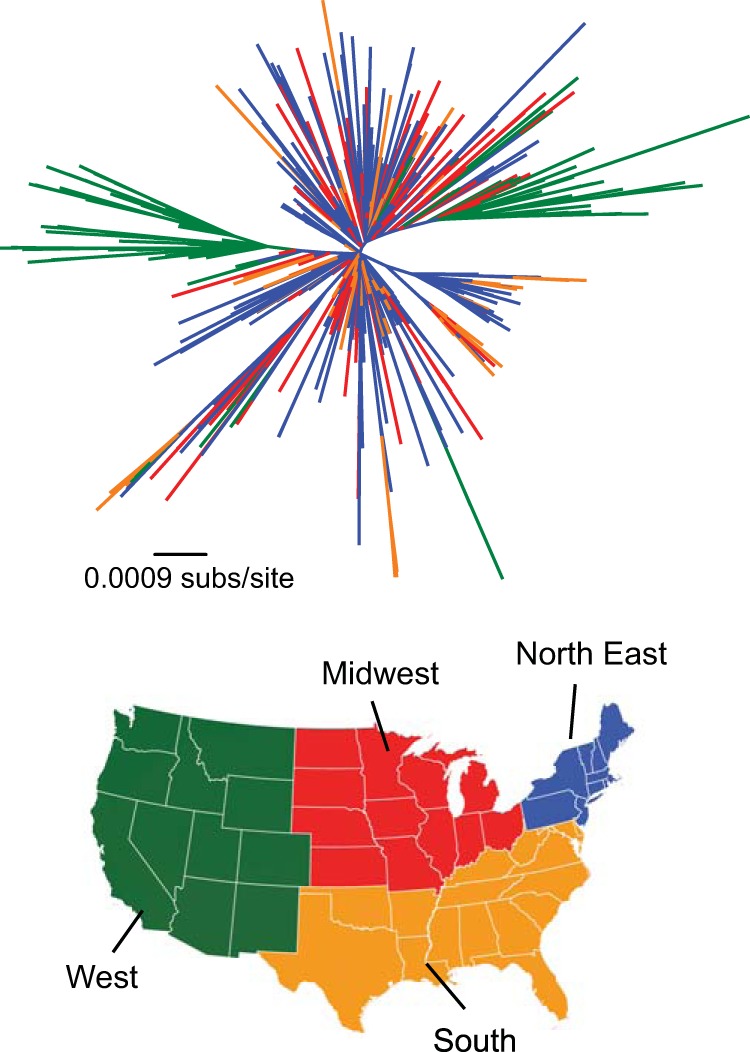
Evolution and geographic distribution of WNV sequences in the United States. The top panel shows an unrooted phylogenetic tree of the complete data set of 696 WNV coding sequences, with branch lengths scaled to the number of nucleotide substitutions per site. Branches are colored according to geographic regions in the United States shown on the map below.
These data also contained four clusters of sequences that represent the four different WNV genotypes proposed previously (11), each of which receives strong bootstrap support (at least 80%): NY99, Intermediate, WN02, and SW03 (Fig. 2). Whereas earlier studies contained only a limited number of viruses from the Intermediate genotype (18, 46), our samples added 29 Intermediate genotype viruses from multiple states, indicating that it was more widely distributed than previously realized. The Intermediate genotype differs from the NY99 genotype by 14 synonymous and 1 nonsynonymous substitution and from the WN02 genotype by 15 synonymous and 2 nonsynonymous substitutions (Table 1). In contrast, the WN02 genotype differs in only nine silent mutations and one amino acid substitution from the NY99 genotype. Notably, we found that the E-Val159Ala amino acid substitution, which is strongly associated with the WN02 genotype and might represent an adaptation to American Culex species (20), also occurs in phylogenetically distinct sequences within the Intermediate and NY99 genotypes (occurring twice in each) and was always supported by high bootstrap values (87 to 100%). Hence, this mutation has clearly evolved convergently multiple times. Also of note is the putative SW03 genotype (Fig. 2, purple), which falls within the phylogenetic diversity of the WN02 genotype, such that the latter is no longer a monophyletic group. The SW03 genotype seemingly appeared in 2002 and has predominantly circulated in the Midwest and West of the United States. The consensus sequence of this genotype differs from WN02 by 12 synonymous and 2 characteristic amino acid substitutions (NS4A-Ala85Thr and NS5-Lys314Arg) (11, 22, 47) (Table 1). As with E-Val159Ala, both the NS4A-Ala85Thr and NS5-Lys314Arg substitutions have evolved independently across the WNV phylogeny, this time in several sequence clusters in the WN02 genotype. Despite these mutational differences, the SW03 genotype is not as clearly visible on our phylogeny as the other genotypes, because the majority of consensus mutations defining this genotype do not fall on the immediate branch leading to it (i.e., they are not synapomorphic).
FIG 2.

Spatial and temporal dynamics of WNV in the United States. The occurrence and spatial distribution of the four proposed WNV genotypes over time: NY99 (red), Intermediate (yellow), WN02 (blue), and SW03 (purple). (Top) A phylogenetic tree (rooted by the NY99 genotype) was used to assist the interpretation of genotype spread. (Bottom, left) the prevalence of sequences sampled in different states per year. (Right) U.S. states colored per genotype, per year, according to the presence of WNV sequences.
TABLE 1.
Nucleotide differences among the proposed genotypes of WNV
| Nucleotide positiona | Gene product | Amino acid position | Amino acid at indicated position inb: |
||||
|---|---|---|---|---|---|---|---|
| Reference sequence | NY99 | Intermediate | WN02 | SW03 | |||
| 564 | prM | C | C | C | T | T | |
| 1224 | E | A | A | A | A | G | |
| 1346 | E | 159 | T (Val) | T (Val) | T (Val) | C (Ala) | C (Ala) |
| 1878 | E | C | C | C | C | T | |
| 2370 | E | C | C | C | T | T | |
| 2736 | NS1 | T | T | C | T | T | |
| 3303 | NS1 | T | T | T | T | C | |
| 4050 | NS2A | A | A | G | G | G | |
| 4468 | NS2B | T | T | C | T | T | |
| 4707 | NS3 | C | C | C | T | T | |
| 6042 | NS3 | C | C | T | T | T | |
| 6142 | NS3 | C | C | C | C | T | |
| 6183 | NS3 | G | G | A | G | G | |
| 6330 | NS3 | C | C | T | T | T | |
| 6625 | NS4A | 85 | G (Ala) | G (Ala) | G (Ala) | G (Ala) | A (Thr) |
| 6669 | NS4A | T | T | T | T | C | |
| 6675 | NS4A | A | A | G | A | A | |
| 6840 | NS4B | T | T | T | T | C | |
| 6900 | NS4B | C | C | C | T | T | |
| 6919 | NS4B | T | C | C | C | C | |
| 7066 | NS4B | 83 | G (Ala) | G (Ala) | T (Ser) | G (Ala) | G (Ala) |
| 7113 | NS4B | A | A | A | A | T | |
| 7173 | NS4B | T | T | T | T | C | |
| 7842 | NS5 | T | T | C | C | C | |
| 8454 | NS5 | C | C | C | C | T | |
| 8525 | NS5 | 314 | A (Lys) | A (Lys) | A (Lys) | A (Lys) | G (Arg) |
| 8580 | NS5 | A | A | G | A | A | |
| 8715 | NS5 | T | C | C | C | C | |
| 8742 | NS5 | T | T | C | T | T | |
| 8982 | NS5 | G | G | A | G | G | |
| 9168 | NS5 | T | T | T | T | C | |
| 9256 | NS5 | C | C | C | T | T | |
| 9564 | NS5 | C | C | C | C | T | |
| 9648 | NS5 | T | T | C | T | T | |
| 9966 | NS5 | T | T | T | T | C | |
| 10221 | NS5 | C | C | T | C | C | |
| 10297 | NS5 | C | C | T | C | C | |
Nucleotide numbering is in reference to the consensus sequence for each genotype.
Position numbering is according to that for the WNV (NY99) reference sequence (GenBank accession number NC_009942). Amino acid substitutions are shown in parentheses.
The NY99 genotype entered the Northeast United States region in 1999 (Fig. 2). Around 2001, the Intermediate and WN02 genotypes emerged, dispersing to the South and Midwest (Intermediate) and the West (WN02) regions. These two descendant genotypes therefore appear to have generally spread in different geographical regions compared to NY99, as there is only a little overlap in genotype sampling per U.S. state, suggesting that they arose by allopatric separation. In 2003, WN02 replaced both the NY99 and Intermediate genotypes throughout the United States. Interestingly, the SW03 and WN02 genotypes were isolated in the same states during the same time period, such that they cocirculated (Fig. 2), although since 2009 the SW03 genotype has only been isolated in California.
Limited evidence for adaptive evolution in WNV.
To help determine whether the spread of WNV across the United States since 1999 was associated with host adaptation in a new environment, we estimated the ratio of nonsynonymous to synonymous substitutions per site (dN/dS) for different genes and branches. The dN/dS ratio for the complete coding sequence of the full WNV data set (696 sequences) was 0.083, while the values for the external and internal branches were 0.086 and 0.076, respectively (Table 2). These ratios are suggestive of a slight excess of transient deleterious mutations in WNV evolution, as observed previously (48). In most cases, individual genes exhibited a pattern similar to that in the whole genome. The strongest examples of excess deleterious mutations were observed in the membrane and envelope genes (external and internal dN/dS values of 1.5 and 1.4, respectively). In contrast, three genes, NS1, NS4A, and NS4B, exhibited a slight excess of nonsynonymous mutations on internal versus external branches, although the ratios observed (∼0.9) were perhaps more suggestive of a general neutral evolution. The capsid gene exhibited the greatest excess of nonsynonymous substitutions on internal branches (ratio of external/internal dN/dS, 0.7). Although this could indicate the past occurrence of positive selection on some amino acid sites and is supported by the observation that the capsid gene also had the highest overall dN/dS ratio (0.315), no positively selected sites were identified in this gene when using site-specific bioinformatic approaches (see below). Strikingly, one of the lowest dN/dS values in the data set (0.056) was observed for the envelope gene, indicating that it has been subject to the strongest purifying selection.
TABLE 2.
Estimates of dN/dS values across the WNV genome and phylogeny
| Nucleotide positions | Gene product |
dN/dS estimate |
|||
|---|---|---|---|---|---|
| Overall | External | Internal | External/internal ratio | ||
| 1–123 | Capsid | 0.378 | 0.345 | 0.502 | 0.687 |
| 124–290 | Membrane | 0.064 | 0.071 | 0.048 | 1.493 |
| 291–791 | Envelope | 0.056 | 0.061 | 0.042 | 1.449 |
| 792–1143 | NS1 | 0.102 | 0.101 | 0.108 | 0.930 |
| 1144–1374 | NS2A | 0.175 | 0.179 | 0.162 | 1.107 |
| 1375–1505 | NS2B | 0.072 | 0.072 | 0.071 | 1.010 |
| 1506–2124 | NS3 | 0.052 | 0.055 | 0.043 | 1.278 |
| 2125–2273 | NS4A | 0.103 | 0.100 | 0.111 | 0.901 |
| 2274–2528 | NS4B | 0.135 | 0.130 | 0.149 | 0.873 |
| 2529–3343 | NS5 | 0.065 | 0.070 | 0.051 | 1.376 |
| 1–3433 | Complete coding sequence | 0.083 | 0.086 | 0.076 | 1.128 |
We further estimated the site-specific selection pressures acting on WNV, reflected in values for dN and dS. Only two amino acid sites, NS2A-119 and NS4A-135, were found to harbor significant evidence for positive selection across all three methods used (SLAC, FUBAR, and MEME) (Fig. 3, red bars). Site NS4B-240 was also found to be subject to positive selection according to the FUBAR analysis, while site NS2A-52 was similarly identified as selected by MEME. Strikingly, the only evidence for positive selection at amino acid sites that delineate the different WNV genotypes was observed at NS5-314, where a Lys-to-Arg substitution distinguishes SW03 (Table 1), although this was marginal in all cases (P = 0.048 in MEME; P = 0.086 in SLAC; posterior probability of 0.947 in FUBAR). Notably, the E-Val159Ala substitution exhibited no signal of positive selection under either method, and we found no evidence for positive selection on any individual lineage on the WNV phylogeny. Although there was evidence for positive selection (P ≤ 0.05) at an additional 17 amino acid sites according to the MEME analysis, these involved either mutations at tips of the tree alone (10/17 cases) or in very small clusters (n ≤ 3 sequences), so that their biological significance is difficult to determine and false positives cannot be discounted. Finally, we determined that the mean pairwise identity across the WNV genome was 99.6% per site, with 69.6% of nucleotide sites identical in all sequences (Fig. 3). Interestingly, and in contrast to what is observed in most RNA viruses, greater genetic diversity was apparent in the nonstructural genes, particularly NS3 and NS4, than the structural genes.
FIG 3.

Genetic variability across the WNV genome. The graph shows the value of dN − dS (left y axis; estimated by the SLAC method) for each codon across the WNV coding sequence (displayed in the top panel). Negative values for dN − dS are shown in gray, and positive values are shown in black. Sites that show consistent evidence for positive selection based on the SLAC, FUBAR, and MEME methods are marked in red. The black line on top (right x axis) indicates the average nucleotide identity estimated as the average value across 100 nucleotides, using a sliding window of 5-nucleotide steps.
Evolutionary dynamics of WNV in the USA.
We utilized a Bayesian coalescent method to reveal the dynamics of WNV spread across the United States. Prior to this analysis, we used a root-to-tip analysis of the ML tree to determine whether these sequence data possessed sufficient temporal signal to accurately infer evolutionary rates. This revealed a strongly significant (P < 0.0001) correlation between time of sampling and genetic divergence (Fig. 4A). Similarly, a strong clock-like structure was revealed by use of a tip-date randomization test, in which none of the rate distributions from the randomizations overlapped with the true tip-date rate (Fig. 4B).
FIG 4.
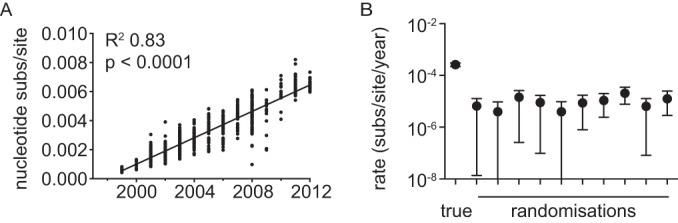
Tests of temporal structure in WNV. (A) Root-to-tip genetic divergence (on the ML phylogeny against year of sampling) for the complete WNV data set. The P values for the linear regression and the R2 values are indicated. (B) Tip-date randomization for data subset A (300 sequences). Ten independent tip-date randomizations were performed and run in BEAST together with the “true” data set (left-most point).
Our Bayesian MCMC analysis revealed that the population dynamics of WNV in the United States best fit a model of logistic population growth, reflecting an initial period of exponential population growth, corresponding to the spread of the NY99 genotype, followed by a lower growth rate during the time period in which the WN02 genotype dominated the viral population (21). The mean nucleotide substitution rate for each data subset was as follows (mean [95% highest posterior density, or HPD, interval]): A, 4.47 × 10⁻⁴ ([4.08 to 4.89] × 10−4); B, 4.27 × 10⁻⁴ ([3.86 to 4.61] × 10−4); C, 4.16 × 10⁻⁴ ([3.81 to 4.51] × 10−4) nucleotide substitutions per site, per year. Similarly, the times to the most recent common ancestor were estimated: A, 1998.0 (1997.1 to 1998.6); B, 1997.8 (1997.1 to 1998.5); C, 1997.9 (1997.2 to 1998.6), whereas that for the Intermediate and WN02 genotypes spanned (the range of 95% HPD intervals) 1998.8 to 2000.3 and 1998.6 to 2000.4, respectively, indicating that they diverged shortly after the first appearance of WNV in the United States. Finally, the emergence of SW03 was estimated to be around 2001 for all three data sets (range of 95% HPD intervals, 2000.5 to 2002.1). As an internal control, we repeated the BEAST analysis with sequences isolated in this study (birds) or from mosquitoes only, which resulted in very similar rate estimates (range of [3.50 to 4.65] × 10−4 and [4.34 to 5.12] × 10−4 subtitutions/site/year, respectively), suggesting that they are robust.
Clustering by host species and sampling location.
We performed a series of Bayesian phylogeny-trait association tests to reveal the extent of clustering by host species, geographic location, and year of sampling. Although this analysis is conservative, because the null hypothesis of overall random clustering by the trait in question is nearly always rejected, it does provide a useful way to assess the relative strength of clustering of different traits.
This analysis revealed a significant phylogenetic association with mosquitoes in all three data subsets (i.e., mosquito sequences are more closely clustered together than expected by chance alone) (Table 3), although most of these involve small clusters of sequences. In addition, given that there is often focused sampling of mosquito WNVs, exemplified by a recent study in California (24), it is likely that there is a strong geographic sampling bias in the analysis of clustering by host (see Discussion). In marked contrast, no such strong clustering was observed in birds, although only the American crow, American white pelican, and the blue jay had a sufficient sample size for individual analyses. Only the American crow data set for this study (P = 0.01) and the American white pelican in data subset C (P = 0.005) exhibited statistically significant clustering. Hence, overall, these data paint a picture of extensive population mixing between different bird species.
TABLE 3.
Phylogeny-trait association analysis of WNV evolutiona
| Category and trait | Data set A |
Data set B |
Data set C |
This study |
||||
|---|---|---|---|---|---|---|---|---|
| n | P value | n | P value | n | P value | n | P value | |
| Host | ||||||||
| American crow | 84 | 0.112 | 88 | 0.462 | 81 | 0.016 | 101 | 0.010 |
| American white pelican | 26 | 0.314 | 19 | 1.000 | 34 | 0.005 | 59 | 0.146 |
| Blue jay | 30 | 0.018 | 31 | 0.434 | 27 | 0.015 | 54 | 0.012 |
| Great horned owl | 4 | 1.000 | 3 | 1.000 | 5 | 1.000 | 10 | 1.000 |
| Mosquito | 123 | 0.001 | 116 | 0.001 | 112 | 0.001 | NA | |
| Geographic region | ||||||||
| Midwest | 68 | 0.250 | 64 | 0.968 | 71 | 0.243 | 139 | 0.053 |
| North East | 129 | 0.001 | 114 | 0.008 | 118 | 0.001 | 29 | 0.001 |
| South | 49 | 0.010 | 54 | 0.070 | 55 | 0.001 | 103 | 0.232 |
| West | 54 | 0.001 | 68 | 0.001 | 56 | 0.001 | 27 | 0.001 |
| Flyway | ||||||||
| Atlantic | 155 | 0.001 | 144 | 0.001 | 143 | 0.001 | 89 | 0.001 |
| Central | 43 | 0.004 | 51 | 0.068 | 55 | 0.001 | 93 | 0.001 |
| Mississippi | 56 | 0.143 | 47 | 0.829 | 57 | 0.123 | 106 | 0.017 |
| Pacific | 46 | 0.001 | 58 | 0.001 | 45 | 0.001 | 10 | 0.002 |
| States (region, flyway) | ||||||||
| California (West, Pacific) | 42 | 0.001 | 53 | 0.001 | 40 | 0.001 | 5 | 1.000 |
| Connecticut (North East, Atlantic) | 76 | 0.001 | 63 | 0.002 | 64 | 0.001 | NA | |
| District of Columbia (South, Atlantic) | 7 | 0.001 | 8 | 0.001 | 7 | 0.002 | 16 | 0.005 |
| Illinois (Midwest, Mississippi) | 10 | 0.041 | 14 | 0.097 | 14 | 0.072 | 7 | 1.000 |
| Maryland (South, Atlantic) | 5 | 1.000 | 10 | 1.000 | 4 | 1.000 | 14 | 1.000 |
| Minnesota (Midwest, Mississippi) | 11 | 1.000 | 6 | 1.000 | 11 | 0.048 | 22 | 0.177 |
| Missouri (Midwest, Mississippi) | 6 | 0.001 | 5 | 0.012 | 2 | 0.001 | 12 | 0.001 |
| Montana (West, Central) | 5 | 1.000 | 6 | 1.000 | 9 | 0.001 | 14 | 0.002 |
| North Dakota (Midwest, Central) | 9 | 1.000 | 12 | 1.000 | 12 | 1.000 | 24 | 0.190 |
| New York (North East, Atlantic) | 41 | 0.655 | 39 | 0.645 | 38 | 0.564 | 1 | 1.000 |
| Ohio (Midwest, Mississippi) | 4 | 1.000 | 3 | 1.000 | 4 | 1.000 | 11 | 1.000 |
| Pennsylvania (North East, Atlantic) | 5 | 0.015 | 9 | 0.033 | 10 | 0.002 | 15 | 0.004 |
| South Dakota (Midwest, Central) | 8 | 1.000 | 8 | 1.000 | 11 | 1.000 | 20 | 0.126 |
| Texas (South, Central) | 8 | 0.001 | 10 | 0.042 | 15 | 0.001 | 10 | 0.037 |
| Virginia (South, Atlantic) | 3 | 1.000 | 5 | 0.017 | 6 | 0.011 | 13 | 0.002 |
| Wisconsin (Midwest, Central) | 10 | 0.036 | 6 | 1.000 | 11 | 0.003 | 19 | 0.120 |
| Year | ||||||||
| 2001 | 39 | 0.029 | 30 | 0.001 | 32 | 0.001 | 59 | 0.001 |
| 2002 | 51 | 0.091 | 48 | 0.850 | 49 | 0.067 | 98 | 0.164 |
| 2003 | 57 | 0.935 | 73 | 0.049 | 64 | 0.007 | 62 | 0.028 |
| 2004 | 18 | 0.193 | 20 | 0.217 | 15 | 1.000 | 11 | 1.000 |
| 2005 | 26 | 0.001 | 24 | 0.286 | 25 | 0.001 | 13 | 0.002 |
| 2006 | 19 | 0.004 | 13 | 1.000 | 20 | 0.003 | 17 | 0.002 |
| 2007 | 20 | 0.186 | 24 | 0.304 | 23 | 0.209 | 5 | 0.004 |
| 2008 | 33 | 0.034 | 30 | 0.424 | 28 | 0.313 | 19 | 0.001 |
| 2009 | 9 | 1.000 | 12 | 0.003 | 10 | 0.001 | 7 | 0.014 |
| 2011 | 11 | 0.001 | 13 | 0.001 | 13 | 0.064 | NA | |
| 2012 | 6 | 0.001 | 4 | 0.008 | 10 | 0.001 | 4 | 0.001 |
n is the number of sequences in the particular data set. P values of ≤0.01 are shown in italics for trait data sets containing at least 10 sequences. Traits are shown in bold if the association was significant in all data sets. NA, not applicable, as no sequences of that trait were sampled (e.g., the data set from this study contained no mosquito sequences).
To better assess the impact of geographical structure, we divided the WNV sequences into four regions according to the U.S. Census Bureau: North East, Midwest, South, and West (Table 3). The Midwest did not show significant clustering in any data set, whereas significant values were observed in the North East and West regions in all four data sets. The clustering according to U.S. state only exhibited significant values in all available data sets for Connecticut and for California in the three data subsets (Table 3). Importantly, 154 of the 160 sequences from Connecticut and 101 of the 106 sequences from California were isolated from mosquitoes (see above), again revealing that the geography and host species are confounding variables in this case. Indeed, it was recently shown that mosquito sequences sampled between 2003 and 2011 in California form two large clusters, indicative of strongly local evolution (24).
Finally, we tested whether phylogenetic pattern was structured by avian flyway, although it is obviously difficult to distinguish these effects from those of geographic region in general. Accordingly, we grouped the sequences according to which of four general flyways they fell, although flyway boundaries are sometimes difficult to determine: Atlantic, Central, Mississippi, and Pacific (Table 3). This analysis revealed significant clustering in all four data sets for the Atlantic and Pacific flyways, in part mirroring the significant clustering of the North East and West regions described above, and in three of the four data subsets for the Central flyway. No clustering was observed for the Mississippi flyway in any data set. Finally, no year of virus sampling exhibited statistically significant clustering across all four data sets, excluding the occurrence of successive waves of WNV lineage replacement.
DISCUSSION
The U.S. epizootic occurrence of WNV is noteworthy for two reasons: the virus spread across the contiguous United States within 4 years, and it was able to infect a wide range of birds and mosquitoes, such that it has a broad host range, with very high mortality in some avian species (49).
Previous studies of the molecular evolution of WNV in North America have largely utilized sequences from mosquitoes, been restricted to local areas, relied on partial genomes (18, 26, 46, 47, 50), or mainly focused on those viruses sampled from humans within the context of WNV in birds (23). Hence, the current study is notable in that we obtained ∼300 complete genome sequences of WNV from birds across the United States. With these data in hand, we were able to reveal that the evolution of WNV in the United States is characterized by relatively little phylogenetic structure (such as distinct clusters of sequences separated by long branches), suggesting that the virus was able to spread in a rapid and generally unconstrained manner. This might, in part, reflect the patterns and dynamics of bird migration across the United States that clearly facilitate rapid virus dispersal. Although we have documented some evidence that phylogenetic structure is shaped by avian flyway, a pattern that has also been observed for avian influenza virus (51), it is difficult to distinguish the impact of avian flyway from other geographic effects on these data. It is also likely that long distance viral movements, rather than simple homogenous dispersal, have impacted the continental spread of WNV (52). Interestingly, the relatively weak geographical clustering observed here is in contrast to the pattern seen for St. Louis encephalitis virus (SLEV), the only other avian arthropod-borne virus known be associated with encephalitis in humans in the United States prior to the emergence of WNV and that was first isolated in 1933 (53, 54). Like WNV, SLEV is transmitted in a bird-mosquito cycle with humans as dead-end hosts (55). However, SLEV has a smaller geographic distribution than WNV and is seemingly dominated by local patterns of transmission (54–56).
WNV in the United States has been classified into at least three genotypes, NY99, Intermediate, and WN02 (57), with a fourth SW03 genotype proposed (11, 47) but that is rather less distinct in phylogenetic trees. Our analysis shows that the NY99 genotype gave rise to two sister genotypes (Intermediate and WN02) that circulated in parallel for 3 years but with relatively little spatial overlap. Notably, WN02 rapidly replaced NY99, with the latter last detected in 2003, and the Intermediate genotype became extinct in 2005. Hence, the WN02 genotype was able to spread throughout the continental United States, suggesting that it is the fittest of the WNV genotypes. In this context it is therefore striking that we found sequences harboring the E-Val159Ala mutation that has been proposed to be a key fitness determinant in WN02, in both the Intermediate and NY99 genotypes, indicating that its impact may be context dependent and which may also have complicated our analyses of selection pressures (see below).
Although WNV represents a case of emergence in a novel geographic region and set of host species, we found relatively little evidence for adaptive evolution in these data when we used dN/dS values as the index. The overall dN/dS ratios were low, there was relatively weak evidence for positive selection at individual codon sites, and comparisons of dN/dS on internal versus external branches of the WNV phylogeny suggested that purifying selection was the main pressure acting on these data, as commonly seen in vector-borne RNA viruses (58). However, these results should also be interpreted with caution. In particular, analyses of dN/dS ratios lack power when applied to a single population (as here), when there are more sequence polymorphisms than fixation events or when adaptive evolution involves a limited number of mutations that occur on a single branch (59). As a case in point, positive selection was only detected on the Thr249Pro mutation in NS3 when multiple lineages of WNV were compared (17). Indeed, our dN/dS analysis failed to detect positive selection on E-Val195Ala, even though this mutation has been experimentally demonstrated to increase fitness in mosquitoes (19). In this context, it is also notable that we observed a far higher proportion of nonsynonymous mutations on internal (compared to external) branches than a previous study (48), indicative of weaker purifying selection in our data. Why these estimates are so different is unclear, although the earlier study was based on global WNV sequences from multiple lineages, whereas we have only considered viruses from a single epizootic occurrence. It is therefore possible that fewer mutations were deleterious in our study set, such that they reached higher frequencies in the population, representing transient polymorphisms rather than true fixation events.
Also of note was our observation that the highest dN/dS ratios (but no positively selected sites) were associated with the capsid protein and one of the lowest ratios was for the envelope gene; not only is the latter a structural gene, but also it contains the putative Val159Ala fitness determinant. Despite the limitations of bioinformatics-based analyses of natural selection, at the very least this observation suggests that other mutations in the envelope gene are strongly deleterious, acting to reduce dN/dS values. In turn, it may also be that the capsid is able to tolerate more nonsynonymous mutations without reducing the viral fitness. Similarly, it is surprising that we consistently observed more positive selection in nonstructural than structural genes, indicating that immune-driven selection is unlikely to be the cause of any fitness increases.
Previous estimates of the rate of evolutionary change in WNV in the United States vary from 2.3 × 10⁻⁴ to 8.2 × 10⁻³ substitutions/site/year (21–26, 46, 60). The evolutionary rate estimated in our study, (4.08 to 4.32) × 10−4 substitutions/site/year, is within the range of those estimated previously and close to that determined for SLEV (4.10 × 10⁻⁴ substitutions/site/year) (61). Similar evolutionary rates have been reported in three other arthropod-borne viruses associated with human disease: dengue virus (62), Japanese encephalitis virus (63), and the emerging Chikungungya virus (CHIKV). In the case of CHIKV, the highest rates (sometimes in excess of 1 × 10⁻³ substitutions/site/year) have been observed in the lineage associated with the recent human epidemic that began in the Indian Ocean (64, 65). Although this higher rate may simply represent a strong time dependency, such that rates are elevated in the short term due to the presence of transient deleterious mutations and depressed in the long term due to site saturation (64, 66), it is possible that evolutionary rates have increased due to more transmission cycles per unit time and/or stronger immune selection associated with epidemic spread. Indeed, it is interesting that some estimates of the rate of WNV evolution that have included human sequences (23) are higher than those reported here, in which WNVs from humans were excluded.
Based on these rates, we estimated the time to the most recent common ancestor of WNV in the United States to be between 1997 and 1998. Although this is obviously before the first documented appearance of WNV in 1999, this difference between molecular clock and epidemiological estimates may simply reflect a lack of precision in sampling dates, as we only have information on the year of isolation and not month or day. An alternative, but less likely, scenario is that more than one WNV lineage entered the United States prior to its detection in 1999. We similarly estimated the time of the most recent common ancestor of the Intermediate and WN02 genotypes to be around 1999, indicating that these two genotypes emerged shortly after the initial appearance of the NY99 genotype, with SW03 emerging around 2001. Our Bayesian coalescent analysis also revealed that WNV exhibits a pattern of logistic population pattern in the United States, with a rapid increase in viral diversity during the initial viral invasion followed by a more constant population size after the virus was established nationwide, suggesting that the virus is now effectively endemic in the U.S. environment.
Also of note was that our phylogeographic analysis revealed relatively little geographic clustering in most cases. Hence, the virus seemingly experienced few geographic constraints as it spread across the United States. In contrast, a recent study of WNV phylodynamics in California proposed that resident birds are responsible for virus overwintering, resulting in strong geographic clustering in this case (24). Although plausible, only mosquito sequences were included in that analysis, such that the phylogeographic patterns exhibited by avian WNV in California is uncertain. Despite this ease of geographic movement, our phylogeographic analysis did reveal some (relatively weak) significant geographic clustering, with those viruses sampled in the North East and West regions of the United States the most distinct, although this is confounded by the strong association with mosquito sampling in Connecticut and California. In this context, it is important to note that our sampling is inevitably biased, likely having missed those bird species responsible for the majority of cross-country virus transmission. Indeed, WNV does not cause disease or death in all infected birds (4), such that asymptomatically infected animals will necessarily be missed in our sampling process that relied on dead birds. It has been proposed that the American robin (Turdus migratorius) is the main host for WNV in North America, particularly as they experience low levels of mortality (4), are prevalent across North America, are preferential hosts for mosquitoes (67), and use migratory flyways, although the exact routes are uncertain (www.allaboutbirds.org/guide/American_Robin/lifehistory). Unfortunately, we have only two sequences from the American robin in our data set, so that we cannot test its impact on WNV evolution and epidemiology, although this is clearly a priority for future phylogeographic studies.
Finally, although birds are the main host for WNV, it was striking that we only found a significant association between phylogenetic clustering and host species for mosquitoes and not for any of the bird species for which sufficient data were available. Although the clustering in the mosquito viruses likely reflects a geographical effect, as most of the mosquito sequences sampled here were from Connecticut and California (whereas the avian WNV samples were obtained throughout the United States), the lack of clustering by bird species reveals the extensive mixing that occurs among bird species, such that there are few host and virological barriers to productive infection. WNV is evidently a highly successful generalist avian virus.
Supplementary Material
ACKNOWLEDGMENTS
This project was funded in part with federal funds from the National Institute of Allergy and Infectious Diseases, National Institutes of Health, Department of Health and Human Services, under contract HHSN272200900018C to the Broad Institute's Genomic Sequencing Center for Infectious Diseases. F.D.G. is support by the Swiss National Science Foundation grant number P2ZHP3_151594, and E.C.H. is supported by an NHMRC Australia Fellowship.
We thank Katy Griffin, Renee Long, and Tina Egstad for their dedication and expert technical assistance.
The use of trade, product, or firm names is for descriptive purposes only and does not imply endorsement by the U.S. Government.
Footnotes
Supplemental material for this article may be found at http://dx.doi.org/10.1128/JVI.02305-15.
REFERENCES
- 1.Lanciotti RS, Roehrig JT, Deubel V, Smith J, Parker M, Steele K, Crise B, Volpe KE, Crabtree MB, Scherret JH, Hall RA, MacKenzie JS, Cropp CB, Panigrahy B, Ostlund E, Schmitt B, Malkinson M, Banet C, Weissman J, Komar N, Savage HM, Stone W, McNamara T, Gubler DJ. 1999. Origin of the West Nile virus responsible for an outbreak of encephalitis in the northeastern United States. Science 286:2333–2337. doi: 10.1126/science.286.5448.2333. [DOI] [PubMed] [Google Scholar]
- 2.Centers for Disease Control and Prevention. 2015. Species of dead birds in which West Nile virus has been detected, United States, 1999–2012. CDC, Atlanta, Georgia: http://www.cdc.gov/westnile/resources/pdfs/birdspecies1999-2012.pdf Accessed 20 July 2015. [Google Scholar]
- 3.Komar N. 2003. West Nile virus: epidemiology and ecology in North America. Adv Virus Res 61:185–234. doi: 10.1016/S0065-3527(03)61005-5. [DOI] [PubMed] [Google Scholar]
- 4.Komar N, Langevin S, Hinten S, Nemeth N, Edwards E, Hettler D, Davis B, Bowen R, Bunning M. 2003. Experimental infection of North American birds with the New York 1999 strain of West Nile virus. Emerg Infect Dis 9:311–322. doi: 10.3201/eid0903.020628. [DOI] [PMC free article] [PubMed] [Google Scholar]
- 5.Kramer LD, Bernard KA. 2001. West Nile virus infection in birds and mammals. Ann N Y Acad Sci 951:84–93. doi: 10.1111/j.1749-6632.2001.tb02687.x. [DOI] [PubMed] [Google Scholar]
- 6.Yaremych SA, Warner RE, Mankin PC, Brawn JD, Raim A, Novak R. 2004. West Nile virus and high death rate in American crows. Emerg Infect Dis 10:709–711. doi: 10.3201/eid1004.030499. [DOI] [PMC free article] [PubMed] [Google Scholar]
- 7.LaDeau SL, Kilpatrick AM, Marra PP. 2007. West Nile virus emergence and large-scale declines of North American bird populations. Nature 447:710–713. doi: 10.1038/nature05829. [DOI] [PubMed] [Google Scholar]
- 8.Dauphin G, Zientara S, Zeller H, Murgue B. 2004. West Nile: worldwide current situation in animals and humans. Comp Immunol Microbiol Infect Dis 27:343–355. doi: 10.1016/j.cimid.2004.03.009. [DOI] [PubMed] [Google Scholar]
- 9.Centers for Disease Control and Prevention 2013. West Nile virus disease cases and deaths reported to CDC by year and clinical presentation, 1999–2013. CDC, Atlanta, Georgia: http://www.cdc.gov/westnile/resources/pdfs/cummulative/99_2013_CasesAndDeathsClinicalPresentationHumanCases.pdf Accessed 29 January 2015. [Google Scholar]
- 10.Weaver SC, Barrett AD. 2004. Transmission cycles, host range, evolution and emergence of arboviral disease. Nat Rev Microbiol 2:789–801. doi: 10.1038/nrmicro1006. [DOI] [PMC free article] [PubMed] [Google Scholar]
- 11.Mann BR, McMullen AR, Swetnam DM, Barrett AD. 2013. Molecular epidemiology and evolution of West Nile virus in North America. Int J Environ Res Public Health 10:5111–5129. doi: 10.3390/ijerph10105111. [DOI] [PMC free article] [PubMed] [Google Scholar]
- 12.Hubalek Z, Halouzka J. 1999. West Nile fever: a reemerging mosquito-borne viral disease in Europe. Emerg Infect Dis 5:643–650. doi: 10.3201/eid0505.990505. [DOI] [PMC free article] [PubMed] [Google Scholar]
- 13.Tsai TF, Popovici F, Cernescu C, Campbell GL, Nedelcu NI. 1998. West Nile encephalitis epidemic in southeastern Romania. Lancet 352:767–771. doi: 10.1016/S0140-6736(98)03538-7. [DOI] [PubMed] [Google Scholar]
- 14.Platonov AE, Shipulin GA, Shipulina OY, Tyutyunnik EN, Frolochkina TI, Lanciotti RS, Yazyshina S, Platonova OV, Obukhov IL, Zhukov AN, Vengerov YY, Pokrovskii VI. 2001. Outbreak of West Nile virus infection, Volgograd region, Russia, 1999. Emerg Infect Dis 7:128–132. doi: 10.3201/eid0701.010118. [DOI] [PMC free article] [PubMed] [Google Scholar]
- 15.Campbell GL, Marfin AA, Lanciotti RS, Gubler DJ. 2002. West Nile virus. Lancet Infect Dis 2:519–529. doi: 10.1016/S1473-3099(02)00368-7. [DOI] [PubMed] [Google Scholar]
- 16.Engler O, Savini G, Papa A, Figuerola J, Groschup MH, Kampen H, Medlock J, Vaux A, Wilson AJ, Werner D, Jost H, Goffredo M, Capelli G, Federici V, Tonolla M, Patocchi N, Flacio E, Portmann J, Rossi-Pedruzzi A, Mourelatos S, Ruiz S, Vazquez A, Calzolari M, Bonilauri P, Dottori M, Schaffner F, Mathis A, Johnson N. 2013. European surveillance for West Nile virus in mosquito populations. Int J Environ Res Public Health 10:4869–4895. doi: 10.3390/ijerph10104869. [DOI] [PMC free article] [PubMed] [Google Scholar]
- 17.Brault AC, Huang CY, Langevin SA, Kinney RM, Bowen RA, Ramey WN, Panella NA, Holmes EC, Powers AM, Miller BR. 2007. A single positively selected West Nile viral mutation confers increased virogenesis in American crows. Nat Genet 39:1162–1166. doi: 10.1038/ng2097. [DOI] [PMC free article] [PubMed] [Google Scholar]
- 18.Davis CT, Ebel GD, Lanciotti RS, Brault AC, Guzman H, Siirin M, Lambert A, Parsons RE, Beasley DW, Novak RJ, Elizondo-Quiroga D, Green EN, Young DS, Stark LM, Drebot MA, Artsob H, Tesh RB, Kramer LD, Barrett AD. 2005. Phylogenetic analysis of North American West Nile virus isolates, 2001-2004: evidence for the emergence of a dominant genotype. Virology 342:252–265. doi: 10.1016/j.virol.2005.07.022. [DOI] [PubMed] [Google Scholar]
- 19.Moudy RM, Meola MA, Morin LL, Ebel GD, Kramer LD. 2007. A newly emergent genotype of West Nile virus is transmitted earlier and more efficiently by Culex mosquitoes. Am J Trop Med Hyg 77:365–370. [PubMed] [Google Scholar]
- 20.Kilpatrick AM, Meola MA, Moudy RM, Kramer LD. 2008. Temperature, viral genetics, and the transmission of West Nile virus by Culex pipiens mosquitoes. PLoS Pathog 4:e1000092. doi: 10.1371/journal.ppat.1000092. [DOI] [PMC free article] [PubMed] [Google Scholar]
- 21.Snapinn KW, Holmes EC, Young DS, Bernard KA, Kramer LD, Ebel GD. 2007. Declining growth rate of West Nile virus in North America. J Virol 81:2531–2534. doi: 10.1128/JVI.02169-06. [DOI] [PMC free article] [PubMed] [Google Scholar]
- 22.Bertolotti L, Kitron U, Goldberg TL. 2007. Diversity and evolution of West Nile virus in Illinois and the United States, 2002-2005. Virology 360:143–149. doi: 10.1016/j.virol.2006.10.030. [DOI] [PubMed] [Google Scholar]
- 23.Anez G, Grinev A, Chancey C, Ball C, Akolkar N, Land KJ, Winkelman V, Stramer SL, Kramer LD, Rios M. 2013. Evolutionary dynamics of West Nile virus in the United States, 1999-2011: phylogeny, selection pressure and evolutionary time-scale analysis. PLoS Negl Trop Dis 7:e2245. doi: 10.1371/journal.pntd.0002245. [DOI] [PMC free article] [PubMed] [Google Scholar]
- 24.Duggal NK, Reisen WK, Fang Y, Newman RM, Yang X, Ebel GD, Brault AC. 2015. Genotype-specific variation in West Nile virus dispersal in California. Virology 485:79–85. doi: 10.1016/j.virol.2015.07.004. [DOI] [PMC free article] [PubMed] [Google Scholar]
- 25.Bertolotti L, Kitron UD, Walker ED, Ruiz MO, Brawn JD, Loss SR, Hamer GL, Goldberg TL. 2008. Fine-scale genetic variation and evolution of West Nile virus in a transmission “hot spot” in suburban Chicago, USA. Virology 374:381–389. doi: 10.1016/j.virol.2007.12.040. [DOI] [PubMed] [Google Scholar]
- 26.Amore G, Bertolotti L, Hamer GL, Kitron UD, Walker ED, Ruiz MO, Brawn JD, Goldberg TL. 2010. Multi-year evolutionary dynamics of West Nile virus in suburban Chicago, USA, 2005-2007. Philos Trans R Soc Lond B Biol Sci 365:1871–1878. doi: 10.1098/rstb.2010.0054. [DOI] [PMC free article] [PubMed] [Google Scholar]
- 27.USGS. 2015. Disease maps. U.S. Geological Survey, Reston, VA: http://diseasemaps.usgs.gov/mapviewer/ Accessed 20 May 2015. [Google Scholar]
- 28.Docherty DE, Long RR, Griffin KM, Saito EK. 2004. Corvidae feather pulp and West Nile virus detection. Emerg Infect Dis 10:907–909. doi: 10.3201/eid1005.030825. [DOI] [PMC free article] [PubMed] [Google Scholar]
- 29.Lanciotti RS, Kerst AJ, Nasci RS, Godsey MS, Mitchell CJ, Savage HM, Komar N, Panella NA, Allen BC, Volpe KE, Davis BS, Roehrig JT. 2000. Rapid detection of West Nile virus from human clinical specimens, field-collected mosquitoes, and avian samples by a TaqMan reverse transcriptase-PCR assay. J Clin Microbiol 38:4066–4071. [DOI] [PMC free article] [PubMed] [Google Scholar]
- 30.Malboeuf CM, Yang X, Charlebois P, Qu J, Berlin AM, Casali M, Pesko KN, Boutwell CL, DeVincenzo JP, Ebel GD, Allen TM, Zody MC, Henn MR, Levin JZ. 2013. Complete viral RNA genome sequencing of ultra-low copy samples by sequence-independent amplification. Nucleic Acids Res 41:e13. doi: 10.1093/nar/gks794. [DOI] [PMC free article] [PubMed] [Google Scholar]
- 31.Yang X, Charlebois P, Gnerre S, Coole MG, Lennon NJ, Levin JZ, Qu J, Ryan EM, Zody MC, Henn MR. 2012. De novo assembly of highly diverse viral populations. BMC Genomics 13:475. doi: 10.1186/1471-2164-13-475. [DOI] [PMC free article] [PubMed] [Google Scholar]
- 32.Kuraku S, Zmasek CM, Nishimura O, Katoh K. 2013. Leaves facilitates on-demand exploration of metazoan gene family trees on MAFFT sequence alignment server with enhanced interactivity. Nucleic Acids Res 41:W22–W28. doi: 10.1093/nar/gkt389. [DOI] [PMC free article] [PubMed] [Google Scholar]
- 33.Kosakovsky Pond SL, Frost SDW, Muse SV. 2005. HyPhy: hypothesis testing using phylogenies. Bioinformatics 21:676–679. doi: 10.1093/bioinformatics/bti079. [DOI] [PubMed] [Google Scholar]
- 34.Kosakovsky Pond SL, Posada D, Gravenor MB, Woelk CH, Frost SDW. 2006. Automated phylogenetic detection of recombination using a genetic algorithm. Mol Biol Evol 23:1891–1901. doi: 10.1093/molbev/msl051. [DOI] [PubMed] [Google Scholar]
- 35.Stamatakis A. 2006. RAxML-VI-HPC: maximum likelihood-based phylogenetic analyses with thousands of taxa and mixed models. Bioinformatics 22:2688–2690. doi: 10.1093/bioinformatics/btl446. [DOI] [PubMed] [Google Scholar]
- 36.Drummond AJ, Suchard MA, Xie D, Rambaut A. 2012. Bayesian phylogenetics with BEAUti and the BEAST 1.7. Mol Biol Evol 29:1969–1973. doi: 10.1093/molbev/mss075. [DOI] [PMC free article] [PubMed] [Google Scholar]
- 37.Darriba D, Taboada GL, Doallo R, Posada D. 2012. jModelTest 2: more models, new heuristics and parallel computing. Nat Methods 9:772. doi: 10.1038/nmeth.2109. [DOI] [PMC free article] [PubMed] [Google Scholar]
- 38.Ramsden C, Holmes EC, Charleston MA. 2009. Hantavirus evolution in relation to its rodent and insectivore hosts: no evidence for codivergence. Mol Biol Evol 26:143–153. doi: 10.1093/molbev/msn234. [DOI] [PubMed] [Google Scholar]
- 39.Duchêne S, Duchêne D, Holmes EC, Ho SY. 2015. The performance of the date-randomization test in phylogenetic analyses of time-structured virus data. Mol Biol Evol 32:1895–1906. doi: 10.1093/molbev/msv056. [DOI] [PubMed] [Google Scholar]
- 40.Parker J, Rambaut A, Pybus OG. 2008. Correlating viral phenotypes with phylogeny: accounting for phylogenetic uncertainty. Infect Genet Evol 8:239–246. doi: 10.1016/j.meegid.2007.08.001. [DOI] [PubMed] [Google Scholar]
- 41.Kosakovsky Pond SL, Frost SDW. 2005. Not so different after all: a comparison of methods for detecting amino acid sites under selection. Mol Biol Evol 22:1208–1222. doi: 10.1093/molbev/msi105. [DOI] [PubMed] [Google Scholar]
- 42.Murrell B, Moola S, Mabona A, Weighill T, Sheward D, Kosakovsky Pond SL, Scheffler K. 2013. FUBAR: a fast, unconstrained Bayesian approximation for inferring selection. Mol Biol Evol 30:1196–1205. doi: 10.1093/molbev/mst030. [DOI] [PMC free article] [PubMed] [Google Scholar]
- 43.Murrell B, Wertheim JO, Moola S, Weighill T, Scheffler K, Kosakovsky Pond SL. 2012. Detecting individual sites subject to episodic diversifying selection. PLoS Genet 8:e1002764. doi: 10.1371/journal.pgen.1002764. [DOI] [PMC free article] [PubMed] [Google Scholar]
- 44.Kosakovsky Pond SL, Murrell B, Fourment M, Frost SDW, Delport W, Scheffler K. 2011. A random effects branch-site model for detecting episodic diversifying selection. Mol Biol Evol 28:3033–3043. doi: 10.1093/molbev/msr125. [DOI] [PMC free article] [PubMed] [Google Scholar]
- 45.Yang Z. 2007. PAML 4: phylogenetic analysis by maximum likelihood. Mol Biol Evol 24:1586–1591. doi: 10.1093/molbev/msm088. [DOI] [PubMed] [Google Scholar]
- 46.Armstrong PM, Vossbrinck CR, Andreadis TG, Anderson JF, Pesko KN, Newman RM, Lennon NJ, Birren BW, Ebel GD, Henn MR. 2011. Molecular evolution of West Nile virus in a northern temperate region: Connecticut, USA, 1999-2008. Virology 417:203–210. doi: 10.1016/j.virol.2011.06.006. [DOI] [PMC free article] [PubMed] [Google Scholar]
- 47.McMullen AR, May FJ, Li L, Guzman H, Bueno R, Dennett JA, Tesh RB, Barrett AD. 2011. Evolution of new genotype of West Nile virus in North America. Emerg Infect Dis 17:785–793. doi: 10.3201/eid1705.101707. [DOI] [PMC free article] [PubMed] [Google Scholar]
- 48.Pybus OG, Rambaut A, Belshaw R, Freckleton RP, Drummond AJ, Holmes EC. 2007. Phylogenetic evidence for deleterious mutation load in RNA viruses and its contribution to viral evolution. Mol Biol Evol 24:845–852. doi: 10.1093/molbev/msm001. [DOI] [PubMed] [Google Scholar]
- 49.Bernard KA, Maffei JG, Jones SA, Kauffman EB, Ebel G, Dupuis APn Ngo KA, Nicholas DC, Young DM, Shi PY, Kulasekera VL, Eidson M, White DJ, Stone WB, Kramer LD, NY State West Nile Virus Surveillance Team. 2001. West Nile virus infection in birds and mosquitoes, New York State, 2000. Emerg Infect Dis 7:679–685. doi: 10.3201/eid0704.017415. [DOI] [PMC free article] [PubMed] [Google Scholar]
- 50.Mann BR, McMullen AR, Swetnam DM, Salvato V, Reyna M, Guzman H, Bueno R, Dennett JA, Tesh RB, Barrett AD. 2013. Continued evolution of West Nile virus, Houston, Texas, USA, 2002-2012. Emerg Infect Dis 19:1418–1427. doi: 10.3201/eid1909.130377. [DOI] [PMC free article] [PubMed] [Google Scholar]
- 51.Lam TT, Ip HS, Ghedin E, Wentworth DE, Halpin RA, Stockwell TB, Spiro DJ, Dusek RJ, Bortner JB, Hoskins J, Bales BD, Yparraguirre DR, Holmes EC. 2012. Migratory flyway and geographical distance are barriers to the gene flow of influenza virus among North American birds. Ecol Lett 15:24–33. doi: 10.1111/j.1461-0248.2011.01703.x. [DOI] [PMC free article] [PubMed] [Google Scholar]
- 52.Pybus OG, Suchard MA, Lemey P, Bernardin FJ, Rambaut A, Crawford FW, Gray RR, Arinaminpathy N, Stramer SL, Busch MP, Delwart EL. 2012. Unifying the spatial epidemiology and molecular evolution of emerging epidemics. Proc Natl Acad Sci U S A 109:15066–15071. doi: 10.1073/pnas.1206598109. [DOI] [PMC free article] [PubMed] [Google Scholar]
- 53.CDC. 2015. Saint Louis encephalitis. Centers for Disease Control and Prevention, Atlanta, GA: http://www.cdc.gov/sle/technical/transmission.html Accessed 25 July 2015. [Google Scholar]
- 54.Kopp A, Gillespie TR, Hobelsberger D, Estrada A, Harper JM, Miller RA, Eckerle I, Muller MA, Podsiadlowski L, Leendertz FH, Drosten C, Junglen S. 2013. Provenance and geographic spread of St. Louis encephalitis virus. mBio 4:e00322-13. doi: 10.1128/mBio.00322-13. [DOI] [PMC free article] [PubMed] [Google Scholar]
- 55.Reisen WK. 2003. Epidemiology of St. Louis encephalitis virus. Adv Virus Res 61:139–183. doi: 10.1016/S0065-3527(03)61004-3. [DOI] [PubMed] [Google Scholar]
- 56.Kramer LD, Chandler LJ. 2001. Phylogenetic analysis of the envelope gene of St. Louis encephalitis virus. Arch Virol 146:2341–2355. [DOI] [PubMed] [Google Scholar]
- 57.Kilpatrick AM. 2011. Globalization, land use, and the invasion of West Nile virus. Science 334:323–327. doi: 10.1126/science.1201010. [DOI] [PMC free article] [PubMed] [Google Scholar]
- 58.Holmes EC. 2003. Patterns of intra- and interhost nonsynonymous variation reveal strong purifying selection in dengue virus. J Virol 77:11296–11298. doi: 10.1128/JVI.77.20.11296-11298.2003. [DOI] [PMC free article] [PubMed] [Google Scholar]
- 59.Kryazhimskiy S, Plotkin JB. 2008. The population genetics of dN/dS. PLoS Genet 4:e1000304. doi: 10.1371/journal.pgen.1000304. [DOI] [PMC free article] [PubMed] [Google Scholar]
- 60.May FJ, Davis CT, Tesh RB, Barrett AD. 2011. Phylogeography of West Nile virus: from the cradle of evolution in Africa to Eurasia, Australia, and the Americas. J Virol 85:2964–2974. doi: 10.1128/JVI.01963-10. [DOI] [PMC free article] [PubMed] [Google Scholar]
- 61.Auguste AJ, Pybus OG, Carrington CV. 2009. Evolution and dispersal of St. Louis encephalitis virus in the Americas. Infect Genet Evol 9:709–715. doi: 10.1016/j.meegid.2008.07.006. [DOI] [PubMed] [Google Scholar]
- 62.Twiddy SS, Holmes EC, Rambaut A. 2003. Inferring the rate and time-scale of dengue virus evolution. Mol Biol Evol 20:122–129. doi: 10.1093/molbev/msg010. [DOI] [PubMed] [Google Scholar]
- 63.Schuh AJ, Ward MJ, Leigh Brown AJ, Barrett ADT. 2013. Phylogeography of Japanese encephalitis virus: genotype is associated with climate. PLoS Negl Trop Dis 7:e2411. doi: 10.1371/journal.pntd.0002411. [DOI] [PMC free article] [PubMed] [Google Scholar]
- 64.Volk SM, Chen R, Tsetsarkin KA, Adams AP, Garcia TI, Sall AA, Nasar F, Schuh AJ, Holmes EC, Higgs S, Maharaj PD, Brault AC, Weaver SC. 2010. Genome scale phylogenetic analyses of chikungunya virus reveal independent emergences of recent epidemics and varying evolutionary rates. J Virol 84:6497–6504. doi: 10.1128/JVI.01603-09. [DOI] [PMC free article] [PubMed] [Google Scholar]
- 65.Lo Presti A, Ciccozzi M, Cella E, Lai A, Simonetti FR, Galli M, Zehender G, Rezza G. 2012. Origin, evolution, and phylogeography of recent epidemic CHIKV strains. Infect Genet Evol 12:392–398. doi: 10.1016/j.meegid.2011.12.015. [DOI] [PubMed] [Google Scholar]
- 66.Duchêne S, Holmes EC, Ho SYW. 2014. Analyses of evolutionary dynamics in viruses are hindered by a time-dependent bias in rate estimates. Proc Biol Sci 281:20140732. doi: 10.1098/rspb.2014.0732. [DOI] [PMC free article] [PubMed] [Google Scholar]
- 67.Kilpatrick AM, Daszak P, Jones MJ, Marra PP, Kramer LD. 2006. Host heterogeneity dominates West Nile virus transmission. Proc Biol Sci 273:2327–2333. doi: 10.1098/rspb.2006.3575. [DOI] [PMC free article] [PubMed] [Google Scholar]
Associated Data
This section collects any data citations, data availability statements, or supplementary materials included in this article.