Abstract
We have developed the Weighted Gene Expression Tool and database (WeGET, http://weget.cmbi.umcn.nl) for the prediction of new genes of a molecular system by correlated gene expression. WeGET utilizes a compendium of 465 human and 560 murine gene expression datasets that have been collected from multiple tissues under a wide range of experimental conditions. It exploits this abundance of expression data by assigning a high weight to datasets in which the known genes of a molecular system are harmoniously up- and down-regulated. WeGET ranks new candidate genes by calculating their weighted co-expression with that system. A weighted rank is calculated for human genes and their mouse orthologs. Then, an integrated gene rank and p-value is computed using a rank-order statistic. We applied our method to predict novel genes that have a high degree of co-expression with Gene Ontology terms and pathways from KEGG and Reactome. For each query set we provide a list of predicted novel genes, computed weights for transcription datasets used and cell and tissue types that contributed to the final predictions. The performance for each query set is assessed by 10-fold cross-validation. Finally, users can use the WeGET to predict novel genes that co-express with a custom query set.
INTRODUCTION
Ever since the publication of the first gene expression arrays, the correlated expression of genes involved in a related molecular process has been used to predict functional relations between gene pairs (1). Large amounts of microarray and RNA-seq transcript expression, measured under a plethora of conditions enable mining for concordantly expressed genes. Indeed, this concept has been successfully employed in databases such as COEXPRESSdb, GeneFriends, GeneMANIA and STARNET 2 (2–5). Nevertheless, relative to other types of genomics data, co-expression has lower sensitivity and selectivity (6). To improve the quality of the predictions, various strategies have been applied, like exploiting the conservation of co-expression between species (7), combining many gene expression datasets (8,9) or biclustering datasets to identify groups of genes that co-express within a subset of the experiments (see (10) for a review). Expression screening, an extension of biclustering methods (11), weighs gene expression datasets based on the co-expression of genes within a molecular system and uses those weights to predict new genes involved in that system. It has been successfully applied to predict new mitochondrial proteins essential for the organelle (11) and to discover new players in heme biosynthesis (12). The principle behind this method is appealing: it systematically exploits the available gene expression data and, via its weighting scheme, implicitly solves the question facing many researchers: which gene expression data to use to predict new genes for a pathway? Nevertheless, it is computationally costly, as the weighting has to be recalculated for each pathway separately and additional cross validation requires multiple runs per pathway. We have therefore developed and implemented a fast expression screening algorithm that includes a dataset weighting and allows for the rapid computation of genes that co-regulate with a query gene set. Our algorithm was employed to compile a weighted co-expression database for all Gene Ontology (GO) terms and human pathways annotated in the KEGG and Reactome databases. Furthermore, we provide information regarding the original experimental setup of the highly weighted datasets. In particular, WeGet reports the cell and tissue types in which the query genes are consistently up- and down-regulated with each other. Finally, the robustness of the predicted results is assessed by 10-fold cross-validation and reported as the receiver operating characteristic (ROC) curve.
We compared WeGET with five popular web tools and databases that predict novel genes based on their co-expression with specified query gene sets, using two query gene sets published by Baughman et al. (ref 11) and show that indeed, weighting the datasets results in improved precision, in particular at low recall rates (the top 100 genes). The complete WeGET database, together with a custom query submission system, is available through the WeGET website.
THE WeGET ANALYSIS PIPELINE
WeGET uses a compendium of 465 human and 560 murine gene expression datasets ranging from 6 to 192 samples per dataset. In total, ∼30 000 samples from multiple mammalian platforms were collected from the Gene Expression Omnibus (GEO) (13).
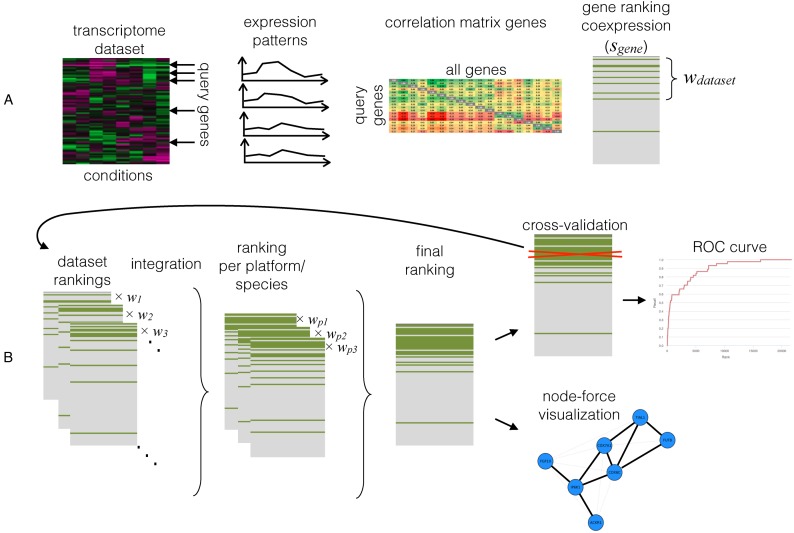
The WeGET computational pipeline starts with selecting the normalized expression values for all probes associated with the query genes. For genes with multiple probes, the probe with the highest average Pearson correlation coefficient with all other query probes is selected. Subsequently, the pipeline calculates the average Pearson correlation between each gene and the set of query genes in every dataset (Figure 1). Then, all probes are ranked based on their average correlation with the query probes and mapped back to their associated gene. Each gene i obtains a score si depending on the fraction of the query set that has been ranked above that gene. These calculations are then repeated four times for the same query set and gene expression dataset, where the expression values have been randomly permuted between the genes in every measurement. This step estimates the number of genes that are expected to highly correlate with the query set in a random model. To calculate the dataset weight, an N100 value is calculated that is the fraction of query genes found among the top 100 genes with highest average Pearson correlation. The ratio between the N100 from the original dataset and the average N100 value for the randomized datasets constitutes the weight of the experiments. A species score is the weighted average of all its datasets. The final ranked gene list is obtained by integrating the ranked human and mouse list (mouse genes that are unambiguous human one-to-one orthologs). This is performed using the RobustRankAggreg R-package (14) that computes the final gene rankings using a rank-order statistic (15,16).
Figure 1.
WeGET computational pipeline used to create the database. (A) Determining the dataset weight wdataset. The transcriptome measurements are converted into a correlation matrix. The average correlation with the query set (sgene) is used for gene ranking and the dataset weight calculation wdataset. (B) Data integration across datasets, platforms and species. Gene scores sgene from all datasets are combined taking into account the precomputed weights. Subsequently different transcriptome platforms and species data are integrated to arrive at the final ranking. The process is repeated after excluding each query gene to construct a receiver operating characteristic (ROC) curve that visualizes predictive power of the method for a specific query set of genes.
Thus for each set of expression data the pipeline measures whether genes in a given pathway are co-expressed with each other better than expected and uses that to assign weights to that expression dataset. These weights are subsequently used in determining the (weighted) co-expression of all genes with that pathway. The source of the variation in the weights between the datasets can be technical, e.g. variation in the probes that have been used, or biological, e.g. variation in the tissues in which gene expression has been measured. The important assumption behind the method is that new genes for a pathway are significantly co-expressed with the majority of the genes of a pathway that they belong to, rather than only with some of its members. This, in turn, depends on the pathway definition. To aid in finding the genes from a pathway that co-express with each other, the results include a visualization of co-expression between query genes displayed as a network. This allows the user to select a subset of co-expressed genes from that pathway to repeat the procedure.
WeGET VALIDATION AND COMPARISON TO OTHER CO-EXPRESSION DATABASES
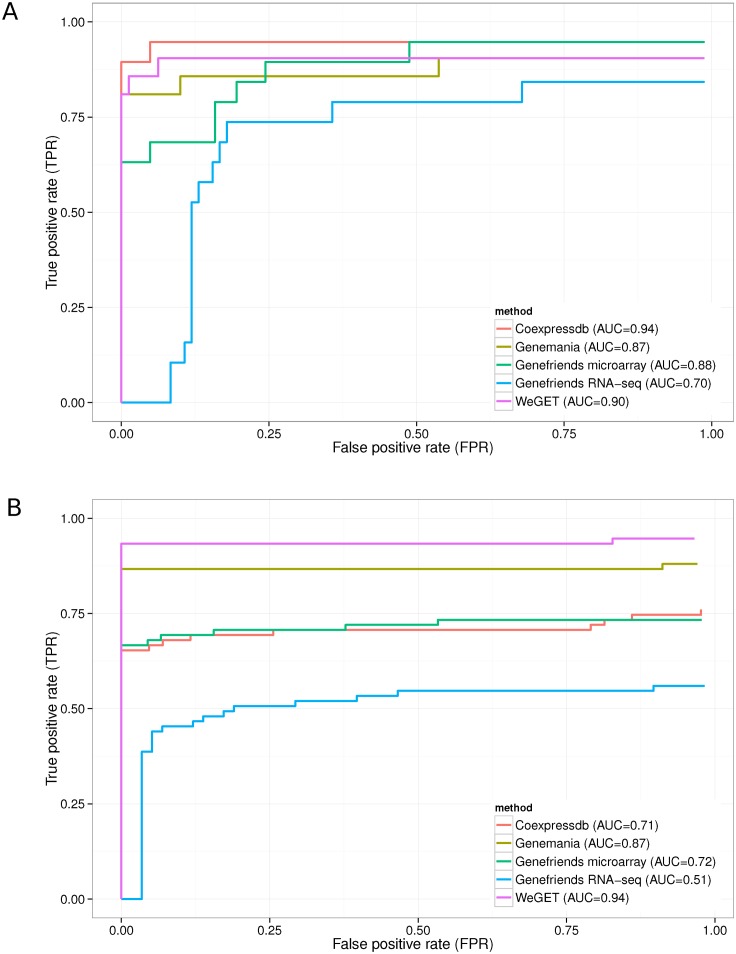
To assess and compare the predictive power of different co-expression methods (see Supplementary Table SI1), we used two query gene sets (11): 19 query genes in the cholesterol biosynthesis pathway and 76 genes involved in oxidative phosphorylation (OXPHOS). We manually performed leave-one-out or 10-fold cross validation by multiple submissions (see Supplementary Methods for details). We took into account the top 100 ranked genes as a likely use case scenario. Figure 2 shows the WeGET results for the cholesterol biosynthesis pathway and OXPHOS system compared to other online tools employing the co-expression analysis.
Figure 2.
ROC performance curves for online co-expression tools (see Supplementary Table SI1). Performance measured by multiple cross-validation runs is indicated by the area under the curve (AUC) for the top 100 genes corresponding to a typical use case scenario. (A) Results for 19 genes in the cholesterol pathway using leave-one-out cross-validation. (B) Results for 10-fold cross-validation in the oxidative phosphorylation (OXPHOS) query set.
Baughman et al. (11) carried out one-time computations for cholesterol and OXPHOS datasets. The Weget webserver achieves identical (cholesterol) or marginally better performance (OXPHOS, 86.4% sensitivity at 99.8% specificity, compared to 85% and 99.4%, respectively, see Supplementary Figure SI1).
THE WeGET DATABASE AND WEB ACCESS
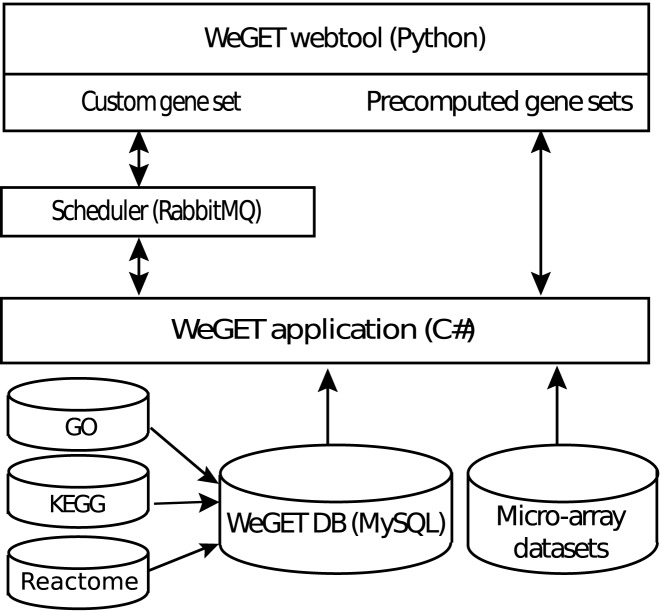
Figure 3 depicts the architecture of the WeGET database. Human pathways and their associated genes from GO and KEGG are stored in a central database. The WeGET parallel algorithm that calculates each dataset on a separate thread precomputes the co-expressed genes and dataset weights for all pathways using the transcriptome compendium. The results are presented to the user using the WeGET webtool (implemented in Python Flask) and can additionally be downloaded.
Figure 3.
The WeGET system architecture. Results for predefined pathways (GO, KEGG and Reactome) are precomputed and exposed through the WeGET webtool. Custom defined gene sets can be analyzed by submitting the gene ids or gene symbols to the webserver.
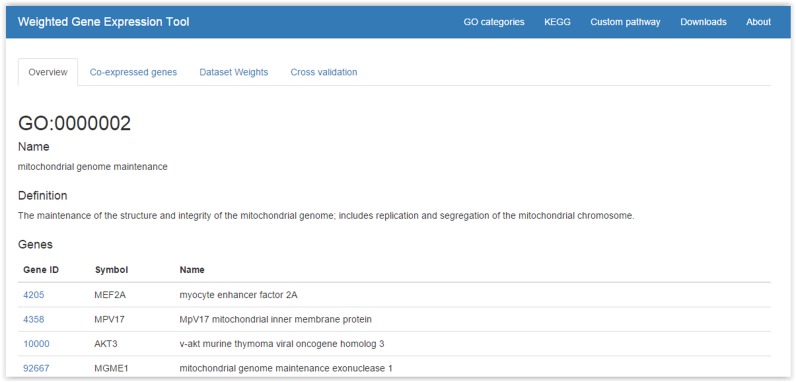
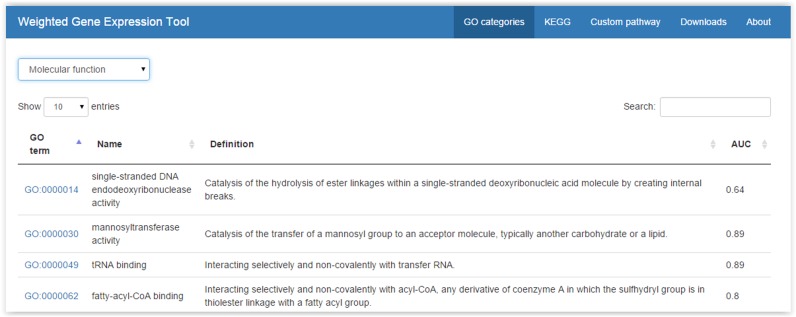
On the WeGET website, pathways are shown in a data grid (Figure 4), which can be sorted and searched. Detailed information (Figure 5), such as the best scoring genes, dataset weights, cell and tissue types in which the genes highly co-express (see also Supplementary Figures SI2 and SI3) and cross-validation results are shown when a row entry is selected. A pathway can be accessed directly as weget.cmbi.umcn.nl/pathwaydb/identifier where pathwaydb denotes the pathway database (one of: GO, KEGG or Reactome) and identifier the category identification (e.g. http://weget.cmbi.umcn.nl/GO/GO:0000398). User queries (different than the predefined sets) can be entered using the ‘Custom pathway’ tab, specifying genes as Entrez ID or HUGO gene symbol. The query is then scheduled for analysis. After the analysis, the user receives an email with results, including the cross-validation and a network that displays the co-regulation of the query genes within the datasets (see below), in a spreadsheet.
Figure 4.
The GO data grid. Users can browse or search the list of Gene Ontology (GO) terms. When a row is clicked, detailed information is provided (see Figure 5). KEGG and Reactome pathways can be accessed in a similar fashion.
Figure 5.
Detailed information for a precomputed term/pathway. The query genes, co-expressed genes, dataset weights and cross-validation results are shown.
The website provides an opportunity to learn more about the experimental conditions in which the concordant expression of the query molecular system has been observed. The tab ‘Dataset Weights’ accessible for each precomputed query set lists GEO dataset records with concordant expression patterns of the query system, indicating congruent co-expression of the gene components of the molecular system. The dataset identifier is directly hyperlinked with the GEO entry description (both online and in Excel output file) such that users can read details of the experiment that lead to harmonious expression of the query set.
EVALUATION OF WeGET RESULTS FOR A QUERY SET
The robustness of the results is tested by k-fold cross-validation and graphically displayed with a ROC curve. The curve illustrates the performance of the WeGET method, by plotting the true positive rate (successfully cross-validated query genes) versus all human genes (Figure 6). The curve is plotted for every molecular system stored in the database (GO, KEGG and Reactome pathways) separately. The area under the curve (AUC) is a measure of the prediction quality and robustness for that pathway. The average AUC computed for all pathways is around 0.7. Well-studied and clearly defined cellular components such as mitochondria and biological processes such as cilium movement and assembly have a higher AUC (average 0.83 and 0.84, respectively) reflecting their concordant expression patterns. For pathways with less than 50 genes we use leave-one-out cross-validation, for larger pathways 10-fold cross-validation is carried out.
Figure 6.
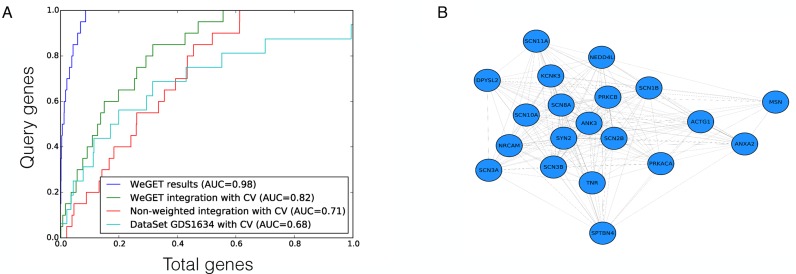
Visualization of performance of the WeGET results for neuropathic pain genes. (A) ROC curves for the neuropathic pain query set (Table 1). The X axis represents fraction of human genes, the Y axis the fraction of the neuropathic pain molecular system. Shown are ROC curves for final results (blue), the cross-validation (CV) of integrated datasets (green), the average co-expression across all datasets (integration with equal contribution of each dataset) with CV (red) and results of co-expression within a single high-weight dataset (GDS1634, a nodose and dorsal root ganglia comparison, cyan) (22). (B) Network visualization of the co-expression allows identification of genes less co-expressed with the core of the query set.
Finally, the cohesion of the query gene set is displayed as a network using a node-force algorithm (Figure 6B). Query genes that consistently co-express perform a large attractive force and therefore cluster together. In contrast, genes that show little evidence of co-regulation exhibit a smaller force and do not cluster with the other query genes. Using this visualization, the user can resubmit the query gene set to omit genes that do not show evidence of co-regulation.
USING WeGET TO PREDICT GENES INVOLVED IN NEUROPATHIC PAIN
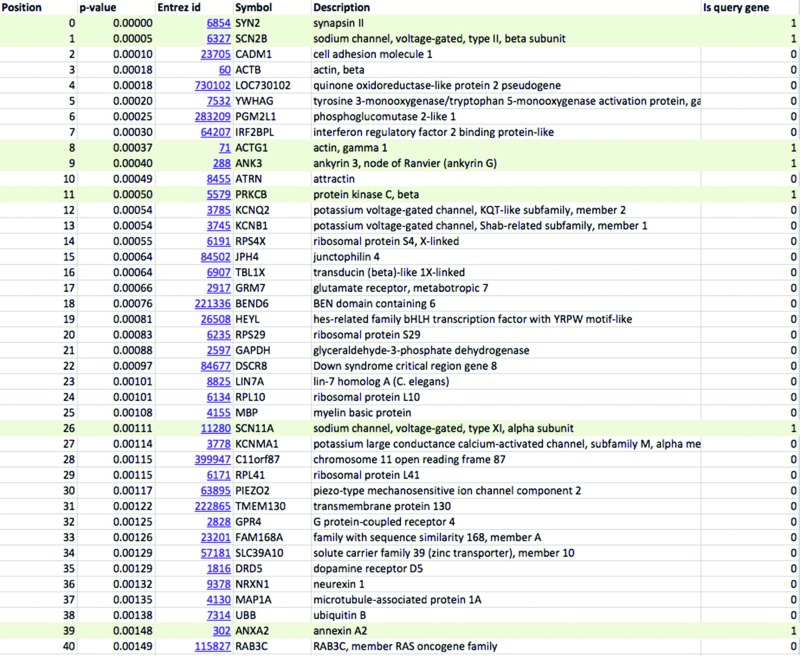
Previous studies indicate that mutations in genes coding for voltage-gated sodium channels and related processes may impair the nociceptive pathway and influence response to pain stimuli (17). From the literature we collected genes implicated in neuropathic pain (Table 1) and used the WeGET database to predict novel candidate genes for this pathway. Table 2 shows genes co-expressing with the neuropathic pain molecular system as calculated by WeGET. Next to sodium channels and its regulators (PRMT8, UNC80 rank 41 and 74, respectively) also genes of the voltage-gated potassium system are strongly represented among top co-expressing genes (MAP1A, PPP2R2C, KCNH3, KCNQ2 rank 6, 7, 66 and 87, respectively) consistent with their involvement in nociceptive processing (18), their expression in dorsal root ganglion neurons analogous to voltage-gated sodium channels (19) and with recently discovered genetic variants that modulate neuropathic pain (20). The PIEZO2 gene, a nociceptive component mechanically activated in nerve endings (21) ranks 74th among all genes. Additional poorly characterized genes such as SERP2, TMEM130 and CCDC155 (ranks 5, 9 and 20, respectively) are also present among genes co-expressing with the system and constitute novel candidate genes for nociceptive pathway. Figure 6A shows the higher performance of WeGET integration of all datasets (cross-validated AUC = 0.82) compared to integration of all datasets with equal weights (average co-expression across all experiments, AUC = 0.71) and a high-weight individual dataset GDS1634 of dorsal root ganglia neurons (AUC = 0.68). Weights assigned to GEO datasets reveal a high contribution of transcriptome measurements related to neurons: a murine nodose and dorsal root ganglia study (GDS1634, weight 3.0) (22), gene expression in human neurofibrillary tangles (GDS2795, weight 2.5) and DNA methylation effect on neural stem cells (GDS538, weight 3.0). The peripheral roles of DPYSL2 (trafficking subset, Table 1), MSN and NEDD4L proteins (peripheral subclass) are visualized in the query gene network (Figure 6B). Currently we screen patients with a familial form of neuropathic pain for genetic variants that may impact the function of the candidate genes.
Table 1. Genes implicated in neuropathic pain collected from the literature.
| No. | Gene Symbol | Sub-system | No. | Gene Symbol | Sub-system | |
|---|---|---|---|---|---|---|
| 1 | ACTG1 | CORE | 11 | DPYSL2 | TAG | |
| 2 | ANK3 | CORE | 12 | KCNK3 | TAG | |
| 3 | SCN10A | CORE | 13 | NRCAM | TAG | |
| 4 | SCN11A | CORE | 14 | ANXA2 | TAG | |
| 5 | SCN1B | CORE | 15 | PRKACA | TAG | |
| 6 | SCN2B | CORE | 16 | PRKCB | TAG | |
| 7 | SCN3A | CORE | 17 | SYN2 | TAG | |
| 8 | SCN3B | CORE | 18 | TNR | TAG | |
| 9 | SCN8A | CORE | 19 | MSN | PI | |
| 10 | SPTBN4 | CORE | 20 | NEDD4L | PI |
Table 2. Results from custom molecular system as received by the user. Top 40 genes prioritized for their involvement in neuropathic pain are shown. Genes that were part of the query set are shown on shaded background.
|
SUPPLEMENTARY DATA
Supplementary Data are available at NAR Online.
FUNDING
European Union 7th Framework Programme [PROPANE Study, 602273]; Metakids Foundation (to R.S.); Centre for Systems Biology and Bioenergetics [CSBR09/013V to W.M.]; European Union's FP7 large scale integrated network Gencodys [http://www.gencodys.eu/, HEALTH-241995 to P.C.]; SYSCILIA [241955]; Centre for Systems Biology and Bioenergetics. Funding for open access charge: Grant funding.
Conflict of interest statement. None declared.
REFERENCES
- 1.Chu S., DeRisi J., Eisen M., Mulholland J., Botstein D., Brown P.O., Herskowitz I. The transcriptional program of sporulation in budding yeast. Science. 1998;282:699–705. doi: 10.1126/science.282.5389.699. [DOI] [PubMed] [Google Scholar]
- 2.Jupiter D., Chen H., VanBuren V. STARNET 2: a web-based tool for accelerating discovery of gene regulatory networks using microarray co-expression data. BMC Bioinformatics. 2009;10:332. doi: 10.1186/1471-2105-10-332. [DOI] [PMC free article] [PubMed] [Google Scholar]
- 3.Obayashi T., Okamura Y., Ito S., Tadaka S., Motoike I.N., Kinoshita K. COXPRESdb: a database of comparative gene coexpression networks of eleven species for mammals. Nucleic Acids Res. 2013;41:D1014–D1020. doi: 10.1093/nar/gks1014. [DOI] [PMC free article] [PubMed] [Google Scholar]
- 4.van Dam S., Craig T., de Magalhães J.P. GeneFriends: a human RNA-seq-based gene and transcript co-expression database. Nucleic Acids Res. 2015;43:D1124–D1132. doi: 10.1093/nar/gku1042. [DOI] [PMC free article] [PubMed] [Google Scholar]
- 5.Zuberi K., Franz M., Rodriguez H., Montojo J., Lopes C.T., Bader G.D., Morris Q. GeneMANIA prediction server 2013 update. Nucleic Acids Res. 2013;41:W115–W122. doi: 10.1093/nar/gkt533. [DOI] [PMC free article] [PubMed] [Google Scholar]
- 6.von Mering C., Krause R., Snel B., Cornell M., Oliver S.G., Fields S., Bork P. Comparative assessment of large-scale data sets of protein-protein interactions. Nature. 2002;417:399–403. doi: 10.1038/nature750. [DOI] [PubMed] [Google Scholar]
- 7.Van Noort V., Snel B., Huynen M.A. Predicting gene function by conserved co-expression. Trends in Genetics. 2003;19:238–242. doi: 10.1016/S0168-9525(03)00056-8. [DOI] [PubMed] [Google Scholar]
- 8.Lee H.K., Hsu A.K., Sajdak J., Qin J., Pavlidis P. Coexpression analysis of human genes across many microarray data sets. Genome Res. 2004;14:1085–1094. doi: 10.1101/gr.1910904. [DOI] [PMC free article] [PubMed] [Google Scholar]
- 9.Zhou X.J., Kao M.-C.J., Huang H., Wong A., Nunez-Iglesias J., Primig M., Aparicio O.M., Finch C.E., Morgan T.E., Wong W.H. Functional annotation and network reconstruction through cross-platform integration of microarray data. Nat. Biotechnol. 2005;23:238–243. doi: 10.1038/nbt1058. [DOI] [PubMed] [Google Scholar]
- 10.Madeira S.C., Oliveira A.L. Biclustering algorithms for biological data analysis: a survey. IEEE/ACM Trans. Comput. Biol. Bioinform. 2004;1:24–45. doi: 10.1109/TCBB.2004.2. [DOI] [PubMed] [Google Scholar]
- 11.Baughman J.M., Nilsson R., Gohil V.M., Arlow D.H., Gauhar Z., Mootha V.K. A computational screen for regulators of oxidative phosphorylation implicates SLIRP in mitochondrial RNA homeostasis. PLoS Genet. 2009;5:e1000590. doi: 10.1371/journal.pgen.1000590. [DOI] [PMC free article] [PubMed] [Google Scholar]
- 12.Nilsson R., Schultz I.J., Pierce E.L., Soltis K.A., Naranuntarat A., Ward D.M., Baughman J.M., Paradkar P.N., Kingsley P.D., Culotta V.C., et al. Discovery of genes essential for heme biosynthesis through large-scale gene expression analysis. Cell Metab. 2009;10:119–130. doi: 10.1016/j.cmet.2009.06.012. [DOI] [PMC free article] [PubMed] [Google Scholar]
- 13.Barrett T., Wilhite S.E., Ledoux P., Evangelista C., Kim I.F., Tomashevsky M., Marshall K.A., Phillippy K.H., Sherman P.M., Holko M., et al. NCBI GEO: archive for functional genomics data sets–update. Nucleic Acids Res. 2013;41:D991–D995. doi: 10.1093/nar/gks1193. [DOI] [PMC free article] [PubMed] [Google Scholar]
- 14.Kolde R., Laur S., Adler P., Vilo J. Robust rank aggregation for gene list integration and meta-analysis. Bioinformatics. 2012;28:573–580. doi: 10.1093/bioinformatics/btr709. [DOI] [PMC free article] [PubMed] [Google Scholar]
- 15.Aerts S., Lambrechts D., Maity S., Van Loo P., Coessens B., De Smet F., Tranchevent L.-C., De Moor B., Marynen P., Hassan B., et al. Gene prioritization through genomic data fusion. Nat. Biotechnol. 2006;24:537–544. doi: 10.1038/nbt1203. [DOI] [PubMed] [Google Scholar]
- 16.Stuart J.M., Segal E., Koller D., Kim S.K. A gene-coexpression network for global discovery of conserved genetic modules. Science. 2003;302:249–255. doi: 10.1126/science.1087447. [DOI] [PubMed] [Google Scholar]
- 17.von Hehn C.A., Baron R., Woolf C.J. Deconstructing the neuropathic pain phenotype to reveal neural mechanisms. Neuron. 2012;73:638–652. doi: 10.1016/j.neuron.2012.02.008. [DOI] [PMC free article] [PubMed] [Google Scholar]
- 18.Tsantoulas C., McMahon S.B. Opening paths to novel analgesics: the role of potassium channels in chronic pain. Trends Neurosci. 2014;37:146–158. doi: 10.1016/j.tins.2013.12.002. [DOI] [PMC free article] [PubMed] [Google Scholar]
- 19.Pollema-Mays S.L., Centeno M.V., Ashford C.J., Apkarian A.V., Martina M. Expression of background potassium channels in rat DRG is cell-specific and down-regulated in a neuropathic pain model. Mol Cell. Neurosci. 2013;57:1–9. doi: 10.1016/j.mcn.2013.08.002. [DOI] [PMC free article] [PubMed] [Google Scholar]
- 20.Costigan M., Belfer I., Griffin R.S., Dai F., Barrett L.B., Coppola G., Wu T., Kiselycznyk C., Poddar M., Lu Y., et al. Multiple chronic pain states are associated with a common amino acid-changing allele in KCNS1. Brain. 2010;133:2519–2527. doi: 10.1093/brain/awq195. [DOI] [PMC free article] [PubMed] [Google Scholar]
- 21.Delmas P., Hao J., Rodat-Despoix L. Molecular mechanisms of mechanotransduction in mammalian sensory neurons. Nat. Rev. Neurosci. 2011;12:139–153. doi: 10.1038/nrn2993. [DOI] [PubMed] [Google Scholar]
- 22.Peeters P.J., Aerssens J., de Hoogt R., Stanisz A., Gohlmann H.W., Hillsley K., Meulemans A., Grundy D., Stead R.H., Coulie B. Molecular profiling of murine sensory neurons in the nodose and dorsal root ganglia labeled from the peritoneal cavity. Physiol. Genomics. 2006;24:252–263. doi: 10.1152/physiolgenomics.00169.2005. [DOI] [PubMed] [Google Scholar]
- 23.Porter J.D., Merriam A.P., Leahy P., Gong B., Khanna S. Dissection of temporal gene expression signatures of affected and spared muscle groups in dystrophin-deficient (mdx) mice. Hum. Mol. Genet. 2003;12:1813–1821. doi: 10.1093/hmg/ddg197. [DOI] [PubMed] [Google Scholar]
- 24.Eijkelkamp N., Linley J.E., Baker M.D., Minett M.S., Cregg R., Werdehausen R., Rugiero F., Wood J.N. Neurological perspectives on voltage-gated sodium channels. Brain. 2012;135:2585–2612. doi: 10.1093/brain/aws225. [DOI] [PMC free article] [PubMed] [Google Scholar]
- 25.Vacher H., Trimmer J.S. Trafficking mechanisms underlying neuronal voltage-gated ion channel localization at the axon initial segment. Epilepsia. 2012;53(Suppl. 9):21–31. doi: 10.1111/epi.12032. [DOI] [PMC free article] [PubMed] [Google Scholar]


