

Abstract
Models of transcription factor (TF) binding sites provide a basis for a wide spectrum of studies in regulatory genomics, from reconstruction of regulatory networks to functional annotation of transcripts and sequence variants. While TFs may recognize different sequence patterns in different conditions, it is pragmatic to have a single generic model for each particular TF as a baseline for practical applications. Here we present the expanded and enhanced version of HOCOMOCO (http://hocomoco.autosome.ru and http://www.cbrc.kaust.edu.sa/hocomoco10), the collection of models of DNA patterns, recognized by transcription factors. HOCOMOCO now provides position weight matrix (PWM) models for binding sites of 601 human TFs and, in addition, PWMs for 396 mouse TFs. Furthermore, we introduce the largest up to date collection of dinucleotide PWM models for 86 (52) human (mouse) TFs. The update is based on the analysis of massive ChIP-Seq and HT-SELEX datasets, with the validation of the resulting models on in vivo data. To facilitate a practical application, all HOCOMOCO models are linked to gene and protein databases (Entrez Gene, HGNC, UniProt) and accompanied by precomputed score thresholds. Finally, we provide command-line tools for PWM and diPWM threshold estimation and motif finding in nucleotide sequences.
INTRODUCTION
Information on the precise locations of DNA sites binding transcription factors (TFs) is necessary to reconstruct regulatory networks (1), as well as to evaluate functional consequences of mutations in DNA regulatory regions (2,3) or interactions between DNA-bound TFs (4). Conventional methods that experimentally reveal nucleotides contacting regulatory proteins are low throughput, laborious and expensive (5). In turn, high throughput methods yield only an approximate location of protein binding sites (6,7). The precise location of binding sites could be predicted by computational methods based on binding motif models such as positional weight matrices (PWMs). Direct information on binding specificities is known for about 30–50% of ∼1400 human TFs (8), and is stored in many proprietary and open access collections such as JASPAR (9), TRANSFAC (10), SwissRegulon (11), HOCOMOCO (12) and others (13). From the beginning, the idea of HOCOMOCO was to provide a single binding model for each transcription factor, except for TFs exhibiting two distinctly different and well-confirmed binding specificities. To this end, we performed the integration of data obtained from experiments of different types, with the best models built from ChIP-Seq data.
Although the first published version (12) proved to be successful in practical applications (14–17), since then there have been many important developments in the area.
DNA binding specificities of many TFs have been assessed in vivo in a large number of new ChIP-Seq experiments (18), particularly within the framework of the ENCODE project (19).
For an even greater number of TFs, DNA binding specificities have been assessed in vitro with high throughput methods, e.g. HT-SELEX (20).
Newly generated data revealed the cases in which traditional mononucleotide PWM models were unable to reproduce characteristic features of binding motifs (21).
The new version of HOCOMOCO provides TF binding sites (TFBS) models for a wider spectrum of TFs and includes a new set of models that account for dependencies of neighboring nucleotides. The HOCOMOCO pipeline also includes quality assessment for all included models. Finally, in the previous HOCOMOCO versions we provided mapping to the mouse UniProt IDs of TFs. Profiting from the mouse ChIP-Seq data that is available, the new HOCOMOCO version provides mouse-specific models in a systematic way.
MATERIALS AND METHODS
The main objective of this study was to perform motif discovery on ChIP-Seq and HT-SELEX data and to evaluate performance of new and existing TFBS models in a comprehensive benchmark based on ChIP-Seq peaks not utilized in motif discovery. For newly derived models, our curation procedure ensured that only the binding motifs of the target TFs entered downstream analysis, thus eliminating those representing binding sites of other proteins (e.g. major cooperatively bound TFs), which could also be found in the ChIP-Seq peaks. Furthermore, given the variable quality of the ChIP-Seq data, we performed benchmarking not only for the models, but for the datasets too. More precisely, for each ChIP-Seq dataset, we evaluated a wide range of the existing PWM models for the respective TF and kept only the motif-enriched ChIP-Seq datasets. The overview of the workflow is shown in Figure 1. The details of each step are described below.
Figure 1.

Overview of the HOCOMOCO update workflow.
ChIP-Seq data processing
As a primary source of the ChIP-Seq data we used GTRD (Gene Transcription Regulation Database, http://gtrd.biouml.org, September 2013 release), the database of genomic TF binding segments within the BioUML platform (http://biouml.org). GTRD provides ChIP-Seq data from different sources processed with a unified pipeline. The ChIP-Seq datasets were systematically collected from literature, Gene Expression Omnibus (GEO), Sequence Read Archive (SRA) and ENCODE. The analysis was done as follows: reads were aligned to reference genomes (hg19/mm9) using Bowtie (22) (with parameters: –best –strata -a -m 10) and the ChIP-Seq peaks were identified using SISSRS (23) (default parameters). All datasets were linked to UniProt IDs. Detailed annotation of the datasets is given in Supplementary Table S1.
Overall, GTRD provided 1381 (309) human (mouse) ChIP-Seq datasets covering 392 (96) TFs with at least 200 peak calls per experiment. The top 1000 highest peaks were taken from each dataset; for 652 datasets the total number of peaks was less than 1000, in such cases all peaks were used.
The even ranked peaks were taken for motif discovery, which was performed within the motif length range from 22 down to 11 bp using ChIPMunk (24) and diChIPMunk (25,26) for mono and dinucleotide PWMs, respectively, assuming zero or one occurrence per sequence (ChIPMunk ‘zoops’ mode). The peak base coverage profiles were taken into account (ChIPMunk ‘peak’ mode). ChIPMunk iteratively performed motif discovery from subsamples of a given sequence set with the optimization for the best motif (24,27). We used the ChIPHorde extension to sequentially search for two over-represented patterns to allow for possible artifact motifs arising from DNA repeats or polymerase chain reaction duplicates. For each dataset, only one model aligning a larger fraction of peaks was kept for further consideration. The odd ranked peaks were used as an independent control data for benchmarking (see the respective section below).
ChIP-Seq motif curation
All models obtained from ChIP-Seq data were curated by hand. For the downstream analysis we selected models satisfying at least one of the following criteria: (i) similar to what is already known (with at least 0.05 Jaccard similarity to HOCOMOCO or HT-SELEX models with a consequent manual curation; the similarity was computed by MACRO-APE (28)), (ii) consistent within a TF family, or at least, (iii) with a clearly exhibited consensus (based on LOGO representation, manually assessed). The results of the curation are presented in Supplementary Table S2. Nearly 50% of the models (692 human and 177 mouse from 1690 total) passed the curation and participated in benchmark (see the respective section).
HT-SELEX data processing
Raw reads from 542 HT-SELEX experiments (20) were processed in the following way. Low-quality read segments were masked with poly-Ns ensuring at least a Q30 average Phred quality score in 10 bp sliding windows. Then, read counts were calculated for all reads for each pair of consequent (n, n + 1) SELEX cycles. Only reads with counts increased in (n + 1) cycle as compared to (n) cycle were kept and aggregated. The largest read count from any of the SELEX cycles was used as a sequence weight for each read. Motif discovery with ChIPMunk and diChIPMunk was performed in a weighted mode on reads from each HT-SELEX experiment, separately (HTSELEX-R models) and additionally for TFs with multiple experiments, by integrating data from all respective sets (HTSELEX-I models).
Existing binding sites models
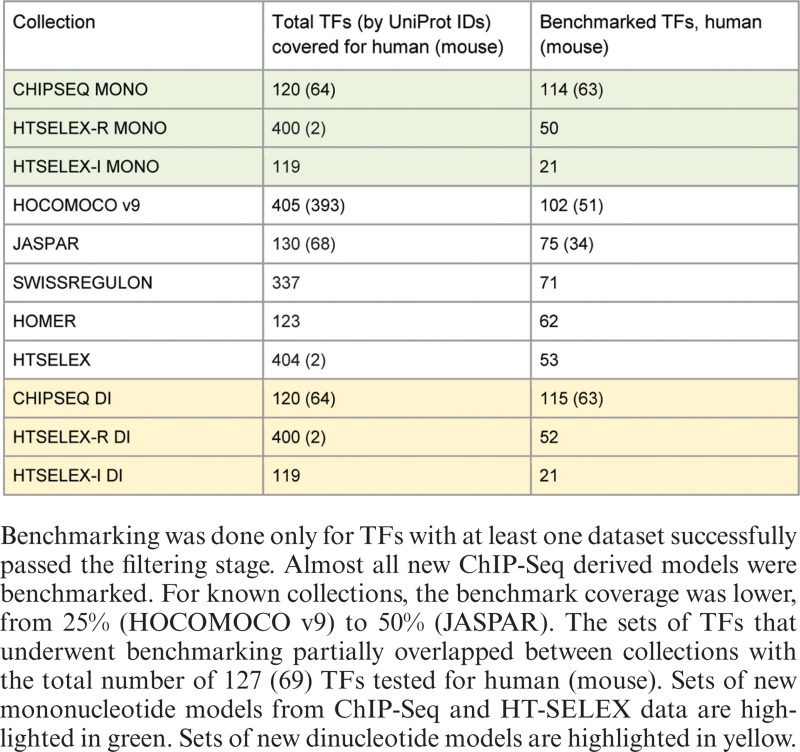
We used the following existing collections of known models: JASPAR CORE (9), HOMER (29), SWISSREGULON (11), existing models from HT-SELEX (20), previous release (v9) of HOCOMOCO (12) and recently published models for pluripotency regulators (30), the latter with the corresponding ChIP-Seq data included in the benchmarking step, see below. All the collections were linked to the appropriate UniProt IDs and multiple models for a single TF were retained if available. For HOMER and SWISSREGULON we used only human UniProt mappings based on the set of TFBS models utilized in FANTOM5 analysis (31). An overview of the total number of TFs covered by each collection is given in Table 1.
Table 1. Overview of binding sites model collections included in benchmarking.
|
Model and dataset benchmarking
To assess performance of the known and new TFBS models we utilized the AUC ROC (area under curve for receiver operating characteristic) based benchmarking, similar to that of the previous HOCOMOCO release (12). For a particular TF, for each model and each dataset we computed the true positive rate (the fraction of peaks with at least one hit per sequence) versus the expected rate of false positive predictions (the percentage of random sequences of comparable lengths containing model hits) at different score thresholds. An important enhancement over the previous setup (12) was accounting for dinucleotide composition of ChIP-Seq peaks when computing motif P-values used to estimate the false positive rate. To this end we used MACRO-APE software (28), which also allowed for processing dinucleotide PWMs in the same fashion.
Although the same pipeline processed all the ChIP-Seq data, the resulting quality and motif enrichment of datasets may vary. At the same time, some known or new binding models may not reflect protein-binding preferences properly. Thus, we used information from known TF binding models to select appropriate ChIP-Seq datasets and vice versa.
Suppose there are N binding site models for a given TF. For each dataset, we introduced the weighted AUC in the following way:
 |
Then for each model we introduced the weighted AUC:
 |
This allowed us to use information contained in several datasets to evaluate the model quality and to use information from several binding models to evaluate the quality of a particular dataset. The weighted AUC performed in a similar way as an average AUC, but received a higher contribution from better datasets and better models.
Still, non-informative models and datasets depleted of binding sites should have been completely excluded. To this end, for each TF we iteratively removed datasets with wAUCdataset < 0.65 and then removed models with wAUCmodel < 0.65 until convergence was achieved. The arbitrary wAUC threshold was selected to keep all benchmarked HOCOMOCO v9 models with high (A and B) quality categories.
Table 1 displays the number of successfully benchmarked TFs for each collection of models. After the wAUC-based filtering of datasets and models, only 786 (206) datasets remained for human (mouse) and the resulting benchmark provided information on 127 (69) human (mouse) TFs. The resulting wAUC values of the datasets are provided in Supplementary Table S3. Finally, to compare overall performance of different collections for each TF we selected the best models from each collection based on the final wAUCmodel score.
Assembling the final collection
By default, for each TF we took the model that was the best in the benchmark. If there were no ChIP-Seq data for a particular TF or no datasets survived the filtering, the HOCOMOCO v9 ABC-quality models were preferred, while HT-SELEX-I/R and HOCOMOCO D-quality had the next priority in this order. We included only models from HOCOMOCO v9 or obtained during this study to have all the final models produced by the same motif discovery tool. In addition to mononucleotide PWMs, we separately gathered dinucleotide PWMs when they had better wAUC than the respective mononucleotide counterparts.
In this update, we introduced a unified model quality assignment procedure based on AUC ROC. The general ideas were the following: (i) the best quality should be assigned to models passing the optimal AUC threshold for at least two available datasets; (ii) if only one ChIP-Seq dataset was available, the validation on such single dataset was more convincing for models that were not derived from ChIP-Seq data; (iii) for models not evaluated in the benchmarking, the existing HOCOMOCO quality could be directly inherited. With these ideas in mind we developed the quality assignment procedure that assigns A–D quality classes, see Supplementary Figure S1.
The choice of an optimal AUC threshold for high quality models was empirical and we were using quality metrics of HOCOMOCO v9 models as a baseline. The selected optimal AUC of 0.8 was reached by 70% (50 of 82) of AB (high) quality HOCOMOCO v9 models and by a two times smaller fraction (35%, 13 of 36 benchmarked) of CD (medium-low) quality HOCOMOCO v9 models.
We additionally introduced the secondary (mostly single-box) models with the special S quality to distinguish them in the collection (thus allowing two models for the same TF). The S models were included for 40 (31) human (mouse) TFs when 2 distinct cases were curated in HOCOMOCO v9, or when a new primary model resembled a notably longer or different pattern (e.g. double-box).
RESULTS
HOCOMOCO v10 significantly expands the collection of TFBS models for mammalian (human and mouse) TFs. We used 992 high quality ChIP-Seq datasets obtained by filtering from the total 1690 datasets, and 542 HT-SELEX datasets. To the best of our knowledge this makes HOCOMOCO the largest systematically derived collection of TFBS models for human and mouse. The models were manually curated, and when possible, verified using in vivo experimental data. A brief comparison of different TFBS model collections is given in Table 2.
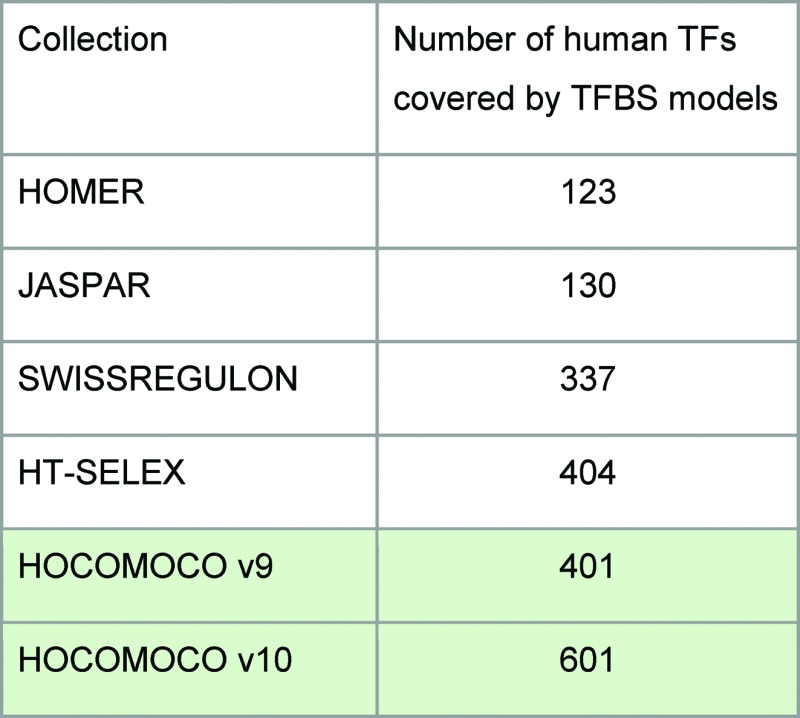
Table 2. The number of human transcription factors covered by TFBS models of known motif collections.
|
As compared to the previous (9th) version, the key features of the new release include:
more than a hundred human and mouse dinucleotide PWMs that account for dependencies between neighboring nucleotides are provided along traditional PWMs; the models are accompanied by command-line tools for motif finding;
a unified benchmark for ChIP-Seq data processing and quality assessment of derived TFBS models based on a receiver-operating characteristic analysis of ChIP-Seq data;
for 200 human TFs without models in HOCOMOCO v9, we supplied the TFBS models increasing the total number of represented TFs from 401 to 601.
Overview of the collection
HOCOMOCO v10 contains 601 (396) binding site models for human (mouse) TFs, with 274 (263) human (mouse) high (ABC) quality models (curated in HOCOMOCO v9 or benchmarked in this study). We also present a completely new complementary collection of 86 (52) human (mouse) dinucleotide PWM TFBS models, accounting for the dinucleotide composition of binding sites, and providing an improvement in binding sites recognition over the respective mononucleotide counterparts.
Models for 92 (52) human (mouse) TFs were produced by motif discovery in ChIP-Seq data, models for 193 (1) human (mouse) TFs were derived from HT-SELEX data and models for 316 (343) human (mouse) TFs were inherited from HOCOMOCO v9. Additionally, for 40 (30) TFs HOCOMOCO v10 includes models of secondary patterns, mostly inherited from HOCOMOCO v9; such models were allowed when a physicochemical interpretation of two TF subtypes was available or if there was an existing single-box variant of a longer primary model.
Benchmarking results
To evaluate performance of different collections, for each collection we counted TFs that participated in benchmarking and estimated the number of TFs for which the model from the selected collection had the best wAUC.
First, we compared each single collection versus all existing mononucleotide PWMs (Figure 2, left side, HOCOMOCO v10 excluded at this stage). Among existing collections JASPAR and HOCOMOCO v9 were the best and scored more than 20 ‘wins’ (TFs with the best models). Newly generated ChIP-Seq models performed remarkably well. Many in vitro models from HT-SELEX were not so good at recognizing binding sites in ChIP-Seq peaks, which agreed with a case study on pluripotency TFs (30). If compared separately, new-made HT-SELEX models were better than original HT-SELEX models in a half of the tested cases. This supports our strategy of assembling HOCOMOCO v10 as a combination of successful new-made ChIP-Seq and HT-SELEX based mononucleotide models combined with successful HOCOMOCO v9 models, and its models perform quite well as compared to all known mono-PWM models (Figure 2, right side).
Figure 2.

Results of the benchmark assessing performance of different model collections on human and mouse ChIP-Seq data. The full height of each bar depicts the total number of assessed TFs for a particular case. The green fraction of a bar depicts the number of TFs for which a model from the given collection was the best (had the highest wAUC). The white fraction of the mono-HOCOMOCO v10 bar consists of TFs with the best models found in the databases that did not participate in the collection assembly (HOMER, SWISSREGULON, JASPAR and the published version of HT-SELEX).
In most cases where dinucleotide models were available, the dinucleotide models outperformed the mononucleotide models. di-HOCOMOCO v10 was assembled of di-PWMs that performed better than mono-PWMs from mono-HOCOMOCO v10 for the same TFs.
Based on the total benchmark of all models, we provide wAUC values as numerical estimates of binding site recognition performance for 145 (76) human (mouse) mononucleotide PWMs and for all dinucleotide PWMs. For each model which has participated in benchmarking, the maximum (the best unweighted) AUC over all the datasets is also provided for convenience. These values can be used as estimates of a classification quality when a TFBS model is used as a classifier of protein-bound and non-bound DNA segments.
The benchmark allowed us not only to compare the performance of binding sites recognition by different models, but also to verify the datasets, i.e. to assess the abundance of predicted binding sites in ChIP-Seq peaks using wAUC values. In particular, only 992 of 1690 datasets passed the datasets filtering stage. This could be a consequence of a unified ChIP-Seq processing pipeline with generic settings not adapted to each particular experiment, or could as well be a consequence of technical problems with some ChIP-Seq samples. A large-scale analysis study that focused on basic ChIP-Seq analysis (32) reported similar results with only approximately half of datasets marked as highly successful.
Accessibility
The HOCOMOCO website was fully redesigned to provide a system of interactive filters making it easier to browse the tables of the collection. The default set of columns provides a compact view of the most important information on TFBS models, more details can be fetched with custom column sets (via ‘select columns’ button). As in HOCOMOCO v9, we provide collection downloads in all major formats, from plain text to TRANSFAC/MEME/HOMER.
The primary mapping in HOCOMOCO is based on UniProt, but we also provide links to Entrez Gene, HGNC-MGI and FANTOM5 SSTAR (31). Furthermore, we included data on TF structural families according to TFClass (33). A tree (Figure 3) depicting subfamilies of TFs (grouped by families) serves as a starting interactive page for the collection website.
Figure 3.

Coverage of TF structural families by TFBS models of HOCOMOCO v10. The area of each blue circle is proportional to the total number of members of a particular family; the orange smaller circle depicts the fraction of TFs for which TFBS models are available. The TF classification is given according to TFClass.
Quite recently, an approach controlling the common false positive rate was acknowledged as the least biased in the extensive benchmarking study (34). Different PWMs require a selection of different threshold levels to achieve the same P-value, the estimated prediction rate at random data (35). Thus, we supplied all the PWMs, both mononucleotide and dinucleotide, with the precomputed thresholds for varying P-value levels. For users interested in in-depth analysis, e.g. P-value computation using different background models, we advise to utilize our MACRO-APE tool (http://opera.autosome.ru/macroape/) that can convert P-values to thresholds and vice versa for both mononucleotide and dinucleotide PWMs.
A web-based GUI to scan a given set of sequences for motif occurrences using HOCOMOCO v10 is now available in BioUML (http://hocomoco.biouml.org). Finally, for users interested in applying dinucleotide PWMs for motif finding, we provide a command line tool named SPRY-SARUS as ChIPMunk addon (http://autosome.ru/chipmunk/). SPRY-SARUS efficiently scans sequences for PWM occurrences using a super-alphabet approach (36) and works with mononucleotide and dinucleotide PWMs in the same fashion.
DISCUSSION
The fact that only 992 out of 1690 ChIP-Seq datasets passed the benchmarking step did not mean that all the discarded datasets were of a low quality. Indeed, our model-centric approach selected only datasets with TF binding specificities primarily agreeing with those of the known models. If the majority of peaks of a dataset did not contain any significant hits of a known or newly constructed and curated PWM model, this dataset was discarded during the benchmarking step due to low wAUC. Some TFs display two clearly different binding subtypes (37). If two subtypes were mixed in a set of ChIP-Seq peaks, no clear single motif would emerge from motif discovery and no single model could provide good AUC ROC. This would also result in discarding the dataset. Additionally, the common peak calling pipeline for all samples could be non-optimal for some specific dataset producing irrelevant peaks and, finally, also forcing the dataset to be discarded during benchmarking.
We used the top 1000 strongest peaks for all datasets, considering these peaks as more robust in terms of peak calling and actual TF binding. In fact, the binding sites enrichment in top peaks may be different for TFs having high and low numbers of functional genomic TFBS. Technically, hundreds of sequences are enough to properly produce baseline models, e.g. the fixed number of peaks was successfully used for motif discovery in FactorBook (38). Yet, the problem of selecting the optimal subset of ChIP-Seq peaks for motif discovery still waits for a final solution. Since our objective was to obtain the single best motif for each TF, we did not compare locations of peaks in different ChIP-seq datasets, assuming that quite different peak sets could yield the same motif. This distinguished our approach from that used in the ENCODE motif discovery pipeline (39), where only peaks identified in Irreproducible Discovery Rate (IDR) analysis were considered (40).
Usage of the even-ranked/odd-ranked peaks for training/testing might also appear too restrictive as compared to a random subset of peaks. In fact, random sampling of input data is used during motif discovery by ChIPMunk, which indeed proved to be quite successful (41–43). Thus, additional randomization during input selection is not necessary. Additionally, the uniform distribution of peaks between training and testing appears to have a lesser bias as compared to other strategies, like using the top 500/next 500 peaks or random subsets. It is known that the binding sites strength positively correlates with the peak height and it seems logical to have similar distributions of the binding sites strength in the training set and in the test set. From a biological point of view it is highly unlikely that there is a regular statistical bias between odd and even ranked peaks.
It is noteworthy, that if several models for the same TF were introduced, deep cross-validation might help to evaluate the true number of distinct motifs optimally describing the available ChIP-Seq data. Yet, we deliberately avoided addressing this issue in HOCOMOCO, restraining ourselves to the single basic model for each TF where possible. Moreover, we skipped possible novel motifs that may come out of lower peaks. In fact, it is quite hard to prove the biological relevance of motifs discovered from low peaks without any direct experimental validation. However, it is possible, that in HOCOMOCO we miss specific motifs characteristic for particular conditions and users should be aware of this.
HOCOMOCO comprises binding models for 601 human TFs, which is less than half of all known human transcription factors (8). How to provide the binding sites models for all known TFs is a non-trivial problem. A conservative approach used e.g. in JASPAR, HOCOMOCO or older TRANSFAC releases, was to provide binding models supported by direct experimental evidence. This left many transcription factors without binding models, but ensured the presented models had comparable reliability. There are at least two extensive ways to cover more transcription factors: (i) to collect as many models as possible from various databases, as in e.g. FootprintDB (44), or (ii) to assign models to transcription factors based on DNA-binding domain similarity, as in e.g. CIS-BP (45). We believe that fast inflow of direct experimental data on TF binding, at least for well-studied model organisms, will make the number of TFs having motifs with experimental evidence quickly approach the total number of known TFs. On the other hand, this will provide a more solid background for homology-based motif assignment for TFs of the less studied species.
Knowledge of direct binding specificities for orthologous TFs in related species, allows detecting differences in binding specificities. Considering HOCOMOCO v10, ChIP-Seq-based mouse models are generally similar to those of human orthologs. At the same time, there are some differences, e.g. in the orientation of boxes of the resulting STAT1 models, which is a tandem repeat for mouse and, preferably, a palindrome for human TF (see Figure 4). Probably those differences are linked with dimerization properties and it is not fully clear whether they are truly related to species or reflect some features of particular ChIP-Seq experiments. In this case a more flexible model allowing a variable spacer and orientation of the boxes might be more suitable than the fixed-width PWM model.
Figure 4.

Binding models of human and mouse STAT1 TFs. LOGO representations of selected models learned from different ChIP-Seq datasets are shown. wAUC values of different models within species are extremely close (about 0.89 for human and 0.78 for mouse). HOCOMOCO v9 human model is shown as the reference. One of human ChIP-Seq datasets yielded a mouse-like model subtype.
Finally, comparing mono- and dinucleotide models, the major consensus sequences of dinucleotide PWMs are very similar to those of the mononucleotide matrices. However, in general diChIPMunk picked up longer segments that flank core consensus. The contribution of flanking sequences into binding site recognition accuracy is an open question (26), and probably varies from one TF to another. Probably, a strategy similar to the one we used for benchmarking can be utilized to specially assess the optimal length of the flanking sequences.
The differences in flanking sequences are, in particular, exhibited for GC-box binding proteins, such as SP or E2F families. Motif discovery on ChIP-Seq datasets yielded models with long G-rich flanks surrounding the known core. It is difficult to estimate whether these flanks are informative or just reflect the general elevated GC-rich composition of the binding sequences (the results were not robust and were highly dependent on motif discovery settings). In this release we kept a shorter single-box version of such models under the S quality section.
Finally, the set of D quality models also requires further analysis and annotation. For example, YBX1 D-quality model is currently inherited from HOCOMOCO v9, but there is a ChIP-Seq based suggestion that YB-1 does not bind to Y-box at all (46). Such inconsistencies can be resolved only with new in vivo and in vitro data.
In conclusion, it should be noted that direct information on binding specificity is currently available only for about half of human or mouse TFs. This limits the practical application of sequence analysis in regulatory genomics. Moreover, for many TFs the binding models are derived from limited datasets or are based only on in vitro data providing rather a rough estimation of in vivo binding specificities, so a further model power estimation is necessary.
In this release of the HOCOMOCO database we used newly published sources of experimental data to increase the number of known binding models, estimated binding site recognition accuracy for hundreds of TFs, and provided the most complete up-to-date collection of dinucleotide models. We believe our collection of models will help researchers to further unravel the gene regulatory code, the next prerequisite of gene expression control by intelligent gene editing.
Acknowledgments
We thank Evolutionary Genomics Laboratory, Faculty of Bioengineering and Bioinformatics (M.V. Lomonosov Moscow State University) and personally Prof. A.S. Kondrashov for computational facilities.
SUPPLEMENTARY DATA
Supplementary Data are available at NAR Online.
FUNDING
Russian Foundation for Basic Research [15-34-20423 to I.V.K.]; Russian Foundation for Basic Research [14-04-01838 to I.V.K., in part]; Russian Science Foundation [14-50-00060, Improvement of motif finding methods to facilitate transcript annotation]; Dynasty Foundation Fellowship (to I.V.K.); Russian Science Foundation [15-14-30002 to Y.A.M., ChIP-Seq models curation]; KAUST base research fund (to V.B.B.). Funding for open access charge: Dynasty Foundation Fellowship (to I.V.K.).
Conflict of interest statement. None declared.
REFERENCES
- 1.Ravasi T., Suzuki H., Cannistraci C.V., Katayama S., Bajic V.B., Tan K., Akalin A., Schmeier S., Kanamori-Katayama M., Bertin N., et al. An atlas of combinatorial transcriptional regulation in mouse and man. Cell. 2010;140:744–752. doi: 10.1016/j.cell.2010.01.044. [DOI] [PMC free article] [PubMed] [Google Scholar]
- 2.Melton C., Reuter J.A., Spacek D.V., Snyder M. Recurrent somatic mutations in regulatory regions of human cancer genomes. Nat. Genet. 2015;47:710–716. doi: 10.1038/ng.3332. [DOI] [PMC free article] [PubMed] [Google Scholar]
- 3.Kamanu F.K., Medvedeva Y.A., Schaefer U., Jankovic B.R., Archer J.A.C., Bajic V.B. Mutations and binding sites of human transcription factors. Front. Genet. 2012;3:100. doi: 10.3389/fgene.2012.00100. [DOI] [PMC free article] [PubMed] [Google Scholar]
- 4.Kazemian M., Pham H., Wolfe S.A., Brodsky M.H., Sinha S. Widespread evidence of cooperative DNA binding by transcription factors in Drosophila development. Nucleic Acids Res. 2013;41:8237–8252. doi: 10.1093/nar/gkt598. [DOI] [PMC free article] [PubMed] [Google Scholar]
- 5.Stormo G.D. Introduction to Protein-DNA Interactions: Structure, Thermodynamics, and Bioinformatics. 1st edn. NY: Cold Spring Harbor Laboratory Press; 2013. [Google Scholar]
- 6.Siggers T., Gordân R. Protein-DNA binding: complexities and multi-protein codes. Nucleic Acids Res. 2014;42:2099–2111. doi: 10.1093/nar/gkt1112. [DOI] [PMC free article] [PubMed] [Google Scholar]
- 7.Kulakovskiy I.V., Makeev V.J. DNA sequence motif: a jack of all trades for ChIP-Seq data. Adv. Protein Chem. Struct. Biol. 2013;91:135–171. doi: 10.1016/B978-0-12-411637-5.00005-6. [DOI] [PubMed] [Google Scholar]
- 8.Vaquerizas J.M., Kummerfeld S.K., Teichmann S.A., Luscombe N.M. A census of human transcription factors: function, expression and evolution. Nat. Rev. Genet. 2009;10:252–263. doi: 10.1038/nrg2538. [DOI] [PubMed] [Google Scholar]
- 9.Mathelier A., Zhao X., Zhang A.W., Parcy F., Worsley-Hunt R., Arenillas D.J., Buchman S., Chen C., Chou A., Ienasescu H., et al. JASPAR 2014: an extensively expanded and updated open-access database of transcription factor binding profiles. Nucleic Acids Res. 2014;42:D142–D147. doi: 10.1093/nar/gkt997. [DOI] [PMC free article] [PubMed] [Google Scholar]
- 10.Wingender E. The TRANSFAC project as an example of framework technology that supports the analysis of genomic regulation. Brief. Bioinform. 2008;9:326–332. doi: 10.1093/bib/bbn016. [DOI] [PubMed] [Google Scholar]
- 11.Pachkov M., Balwierz P.J., Arnold P., Ozonov E., van Nimwegen E. SwissRegulon, a database of genome-wide annotations of regulatory sites: recent updates. Nucleic Acids Res. 2013;41:D214–D220. doi: 10.1093/nar/gks1145. [DOI] [PMC free article] [PubMed] [Google Scholar]
- 12.Kulakovskiy I. V, Medvedeva Y.A., Schaefer U., Kasianov A.S., Vorontsov I.E., Bajic V.B., Makeev V.J. HOCOMOCO: a comprehensive collection of human transcription factor binding sites models. Nucleic Acids Res. 2013;41:D195–D202. doi: 10.1093/nar/gks1089. [DOI] [PMC free article] [PubMed] [Google Scholar]
- 13.Stormo G.D. DNA Motif Databases and Their Uses. Curr. Protoc. Bioinformatics. 2015;51:15. doi: 10.1002/0471250953.bi0215s51. [DOI] [PubMed] [Google Scholar]
- 14.Medvedeva Y.A., Khamis A.M., Kulakovskiy I.V., Ba-Alawi W., Bhuyan M.S.I., Kawaji H., Lassmann T., Harbers M., Forrest A.R.R., Bajic V.B. Effects of cytosine methylation on transcription factor binding sites. BMC Genomics. 2014;15:119. doi: 10.1186/1471-2164-15-119. [DOI] [PMC free article] [PubMed] [Google Scholar]
- 15.Pardo L.M., Rizzu P., Francescatto M., Vitezic M., Leday G.G.R., Sanchez J.S., Khamis A., Takahashi H., van de Berg W.D.J., Medvedeva Y.A., et al. Regional differences in gene expression and promoter usage in aged human brains. Neurobiol. Aging. 2013;34:1825–1836. doi: 10.1016/j.neurobiolaging.2013.01.005. [DOI] [PubMed] [Google Scholar]
- 16.Alam T., Medvedeva Y.A., Jia H., Brown J.B., Lipovich L., Bajic V.B. Promoter analysis reveals globally differential regulation of human long non-coding RNA and protein-coding genes. PLoS One. 2014;9:e109443. doi: 10.1371/journal.pone.0109443. [DOI] [PMC free article] [PubMed] [Google Scholar]
- 17.Khamis A.M., Hamilton A.R., Medvedeva Y.A., Alam T., Alam I., Essack M., Umylny B., Jankovic B.R., Naeger N.L., Suzuki M., et al. Insights into the Transcriptional Architecture of Behavioral Plasticity in the Honey Bee Apis mellifera. Sci. Rep. 2015;5:11136. doi: 10.1038/srep11136. [DOI] [PMC free article] [PubMed] [Google Scholar]
- 18.Wang Q., Huang J., Sun H., Liu J., Wang J., Wang Q., Qin Q., Mei S., Zhao C., Yang X., et al. CR Cistrome: a ChIP-Seq database for chromatin regulators and histone modification linkages in human and mouse. Nucleic Acids Res. 2014;42:D450–D458. doi: 10.1093/nar/gkt1151. [DOI] [PMC free article] [PubMed] [Google Scholar]
- 19.Dunham I., Kundaje A., Aldred S.F., Collins P.J., Davis C.A., Doyle F., Epstein C.B., Frietze S., Harrow J., Kaul R., et al. An integrated encyclopedia of DNA elements in the human genome. Nature. 2012;489:57–74. doi: 10.1038/nature11247. [DOI] [PMC free article] [PubMed] [Google Scholar]
- 20.Jolma A., Yan J., Whitington T., Toivonen J., Nitta K.R., Rastas P., Morgunova E., Enge M., Taipale M., Wei G., et al. DNA-binding specificities of human transcription factors. Cell. 2013;152:327–339. doi: 10.1016/j.cell.2012.12.009. [DOI] [PubMed] [Google Scholar]
- 21.Keilwagen J., Grau J. Varying levels of complexity in transcription factor binding motifs. Nucleic Acids Res. 2015;43:e119. doi: 10.1093/nar/gkv577. [DOI] [PMC free article] [PubMed] [Google Scholar]
- 22.Langmead B., Trapnell C., Pop M., Salzberg S.L. Ultrafast and memory-efficient alignment of short DNA sequences to the human genome. Genome Biol. 2009;10:R25. doi: 10.1186/gb-2009-10-3-r25. [DOI] [PMC free article] [PubMed] [Google Scholar]
- 23.Jothi R., Cuddapah S., Barski A., Cui K., Zhao K. Genome-wide identification of in vivo protein-DNA binding sites from ChIP-Seq data. Nucleic Acids Res. 2008;36:5221–5231. doi: 10.1093/nar/gkn488. [DOI] [PMC free article] [PubMed] [Google Scholar]
- 24.Kulakovskiy I. V, Boeva V.A., Favorov A.V., Makeev V.J. Deep and wide digging for binding motifs in ChIP-Seq data. Bioinformatics. 2010;26:2622–2623. doi: 10.1093/bioinformatics/btq488. [DOI] [PubMed] [Google Scholar]
- 25.Kulakovskiy I., Levitsky V., Oshchepkov D., Bryzgalov L., Vorontsov I., Makeev V. From binding motifs in ChIP-Seq data to improved models of transcription factor binding sites. J. Bioinform. Comput. Biol. 2013;11:1340004. doi: 10.1142/S0219720013400040. [DOI] [PubMed] [Google Scholar]
- 26.Levitsky V.G., Kulakovskiy I.V., Ershov N.I., Oschepkov D.Y., Makeev V.J., Hodgman T.C., Merkulova T.I. Application of experimentally verified transcription factor binding sites models for computational analysis of ChIP-Seq data. BMC Genomics. 2014;15:80. doi: 10.1186/1471-2164-15-80. [DOI] [PMC free article] [PubMed] [Google Scholar]
- 27.Kulakovskiy I.V., Makeev V.J. Discovery of DNA motifs recognized by transcription factors through integration of different experimental sources. Biophysics (Oxford). 2010;54:667–674. [Google Scholar]
- 28.Vorontsov I.E., Kulakovskiy I.V., Makeev V.J. Jaccard index based similarity measure to compare transcription factor binding site models. Algorithms Mol. Biol. 2013;8:23. doi: 10.1186/1748-7188-8-23. [DOI] [PMC free article] [PubMed] [Google Scholar]
- 29.Heinz S., Benner C., Spann N., Bertolino E., Lin Y.C., Laslo P., Cheng J.X., Murre C., Singh H., Glass C.K. Simple combinations of lineage-determining transcription factors prime cis-regulatory elements required for macrophage and B cell identities. Mol. Cell. 2010;38:576–589. doi: 10.1016/j.molcel.2010.05.004. [DOI] [PMC free article] [PubMed] [Google Scholar]
- 30.Papatsenko D., Darr H., Kulakovskiy I.V., Waghray A., Makeev V.J., MacArthur B.D., Lemischka I.R. Single-cell analyses of ESCs reveal alternative pluripotent cell states and molecular mechanisms that control self-renewal. Stem Cell Rep. 2015;5:207–220. doi: 10.1016/j.stemcr.2015.07.004. [DOI] [PMC free article] [PubMed] [Google Scholar]
- 31.Forrest A.R.R., Kawaji H., Rehli M., Baillie J.K., de Hoon M.J.L., Lassmann T., Itoh M., Summers K.M., Suzuki H., Daub C.O., et al. A promoter-level mammalian expression atlas. Nature. 2014;507:462–470. doi: 10.1038/nature13182. [DOI] [PMC free article] [PubMed] [Google Scholar]
- 32.Marinov G.K., Kundaje A., Park P.J., Wold B.J. Large-scale quality analysis of published ChIP-seq data. G3 (Bethesda). 2014;4:209–223. doi: 10.1534/g3.113.008680. [DOI] [PMC free article] [PubMed] [Google Scholar]
- 33.Wingender E., Schoeps T., Haubrock M., Dönitz J. TFClass: a classification of human transcription factors and their rodent orthologs. Nucleic Acids Res. 2015;43:D97–D102. doi: 10.1093/nar/gku1064. [DOI] [PMC free article] [PubMed] [Google Scholar]
- 34.Dabrowski M., Dojer N., Krystkowiak I., Kaminska B., Wilczynski B. Optimally choosing PWM motif databases and sequence scanning approaches based on ChIP-seq data. BMC Bioinformatics. 2015;16:140. doi: 10.1186/s12859-015-0573-5. [DOI] [PMC free article] [PubMed] [Google Scholar]
- 35.Touzet H., Varré J.-S. Efficient and accurate P-value computation for Position Weight Matrices. Algorithms Mol. Biol. 2007;2:15. doi: 10.1186/1748-7188-2-15. [DOI] [PMC free article] [PubMed] [Google Scholar]
- 36.Korhonen J., Martinmäki P., Pizzi C., Rastas P., Ukkonen E. MOODS: fast search for position weight matrix matches in DNA sequences. Bioinformatics. 2009;25:3181–3182. doi: 10.1093/bioinformatics/btp554. [DOI] [PMC free article] [PubMed] [Google Scholar]
- 37.Guillon N., Tirode F., Boeva V., Zynovyev A., Barillot E., Delattre O. The oncogenic EWS-FLI1 protein binds in vivo GGAA microsatellite sequences with potential transcriptional activation function. PLoS One. 2009;4:e4932. doi: 10.1371/journal.pone.0004932. [DOI] [PMC free article] [PubMed] [Google Scholar]
- 38.Wang J., Zhuang J., Iyer S., Lin X., Whitfield T.W., Greven M.C., Pierce B.G., Dong X., Kundaje A., Cheng Y., et al. Sequence features and chromatin structure around the genomic regions bound by 119 human transcription factors. Genome Res. 2012;22:1798–1812. doi: 10.1101/gr.139105.112. [DOI] [PMC free article] [PubMed] [Google Scholar]
- 39.Kheradpour P., Kellis M. Systematic discovery and characterization of regulatory motifs in ENCODE TF binding experiments. Nucleic Acids Res. 2014;42:2976–2987. doi: 10.1093/nar/gkt1249. [DOI] [PMC free article] [PubMed] [Google Scholar]
- 40.Landt S.G., Marinov G.K., Kundaje A., Kheradpour P., Pauli F., Batzoglou S., Bernstein B.E., Bickel P., Brown J.B., Cayting P., et al. ChIP-seq guidelines and practices of the ENCODE and modENCODE consortia. Genome Res. 2012;22:1813–1831. doi: 10.1101/gr.136184.111. [DOI] [PMC free article] [PubMed] [Google Scholar]
- 41.Bi Y., Kim H., Gupta R., Davuluri R. V. Tree-based position weight matrix approach to model transcription factor binding site profiles. PLoS One. 2011;6:e24210. doi: 10.1371/journal.pone.0024210. [DOI] [PMC free article] [PubMed] [Google Scholar]
- 42.Kuttippurathu L., Hsing M., Liu Y., Schmidt B., Maskell D.L., Lee K., He A., Pu W.T., Kong S.W. CompleteMOTIFs: DNA motif discovery platform for transcription factor binding experiments. Bioinformatics. 2011;27:715–717. doi: 10.1093/bioinformatics/btq707. [DOI] [PMC free article] [PubMed] [Google Scholar]
- 43.Ma X., Kulkarni A., Zhang Z., Xuan Z., Serfling R., Zhang M.Q. A highly efficient and effective motif discovery method for ChIP-seq/ChIP-chip data using positional information. Nucleic Acids Res. 2012;40:e50. doi: 10.1093/nar/gkr1135. [DOI] [PMC free article] [PubMed] [Google Scholar]
- 44.Sebastian A., Contreras-Moreira B. footprintDB: a database of transcription factors with annotated cis elements and binding interfaces. Bioinformatics. 2014;30:258–265. doi: 10.1093/bioinformatics/btt663. [DOI] [PubMed] [Google Scholar]
- 45.Weirauch M.T., Yang A., Albu M., Cote A.G., Montenegro-Montero A., Drewe P., Najafabadi H.S., Lambert S.A., Mann I., Cook K., et al. Determination and inference of eukaryotic transcription factor sequence specificity. Cell. 2014;158:1431–1443. doi: 10.1016/j.cell.2014.08.009. [DOI] [PMC free article] [PubMed] [Google Scholar]
- 46.Dolfini D., Mantovani R. YB-1 (YBX1) does not bind to Y/CCAAT boxes in vivo. Oncogene. 2012;32:4189–4190. doi: 10.1038/onc.2012.521. [DOI] [PubMed] [Google Scholar]