Significance
How different kinds of organisms adapt to environmental temperature is central to understanding how they respond to past, present, and future climate change. We applied the Scholander–Irving model of thermoregulation to data on hundreds of species of birds and mammals to assess the contributions of three avenues of adaptation to environmental temperature: body size, basal metabolic rate (BMR), and thermal conductance. Adaptation via body size is limited; the entire ranges of body sizes of birds and mammals occur in nearly all climatic regimes. Using physiological and environmental data for 211 bird and 178 mammal species, we demonstrate that birds and mammals have adapted to geographic variation in environmental temperature regimes by concerted changes in both BMR and thermal conductance.
Keywords: macrophysiology, Bergmann’s rule, body size, metabolic rate, thermal conductance
Abstract
The extent to which different kinds of organisms have adapted to environmental temperature regimes is central to understanding how they respond to climate change. The Scholander–Irving (S-I) model of heat transfer lays the foundation for explaining how endothermic birds and mammals maintain their high, relatively constant body temperatures in the face of wide variation in environmental temperature. The S-I model shows how body temperature is regulated by balancing the rates of heat production and heat loss. Both rates scale with body size, suggesting that larger animals should be better adapted to cold environments than smaller animals, and vice versa. However, the global distributions of ∼9,000 species of terrestrial birds and mammals show that the entire range of body sizes occurs in nearly all climatic regimes. Using physiological and environmental temperature data for 211 bird and 178 mammal species, we test for mass-independent adaptive changes in two key parameters of the S-I model: basal metabolic rate (BMR) and thermal conductance. We derive an axis of thermal adaptation that is independent of body size, extends the S-I model, and highlights interactions among physiological and morphological traits that allow endotherms to persist in a wide range of temperatures. Our macrophysiological and macroecological analyses support our predictions that shifts in BMR and thermal conductance confer important adaptations to environmental temperature in both birds and mammals.
A fundamental problem in ecology and biogeography is to elucidate the physiological processes that determine the environmental tolerances and influence the distributions of species. Across their nearly worldwide distributions, endothermic birds and mammals maintain near-constant body temperatures in the face of extreme and fluctuating environmental temperatures. Elucidating the morphological and physiological adaptations that allow species to inhabit such a wide spectrum of thermal environments is important for understanding the distribution of biodiversity and for predicting responses of species to climate change (1, 2).
In a seminal paper, Scholander et al. (3) showed how endotherms balance rates of heat production and heat loss so as to maintain a constant body temperature in the face of varying environmental temperatures. The essence of the Scholander–Irving (S-I) model is the equation:
where Tb is body temperature, Ta is ambient temperature, B is the rate of metabolic heat production, and C is the rate of heat loss or thermal conductance (4). For a resting animal, which has minimized heat loss by maximizing insulation and optimizing body posture, C = minimum thermal conductance (CMIN); B = basal metabolic rate (BMR); and Ta = Tlc, where Tlc is the lower critical temperature or the lower limit of the thermal neutral zone (TNZ). The TNZ is ecologically important because it is the range of environmental temperatures where energy expenditure is minimal; outside of the TNZ, an organism must expend additional energy on thermoregulation to maintain homeostasis (5). Here, we focus on adaptive responses to varying degrees of cold stress that shift the lower limit of the TNZ, where the S-I model makes straightforward predictions. Endotherms can theoretically modify Tlc by changes in BMR, CMIN, or both (Fig. 1 B and C).
Fig. 1.
Conceptual diagram showing how body size (A), CMIN (B), and BMR (C) affect the lower limit of the TNZ (Tlc). Blue indicates adaptations to cold temperatures, and red indicates adaptations to hot temperatures. In B and C, black represents a species without mass-independent thermal adaptation (A). Because heat production (BMR) increases more rapidly with body size than heat loss (CMIN), larger species should be better able to tolerate colder temperatures than smaller species. Tlc can also be altered by body size-independent changes to BMR or CMIN. Species with CMIN lower than expected for their body size should be able to tolerate colder temperatures, and vice versa. The opposite is true in the case of BMR: Species with higher BMR will tolerate colder temperature and species with lower BMR will tolerate hotter temperatures.
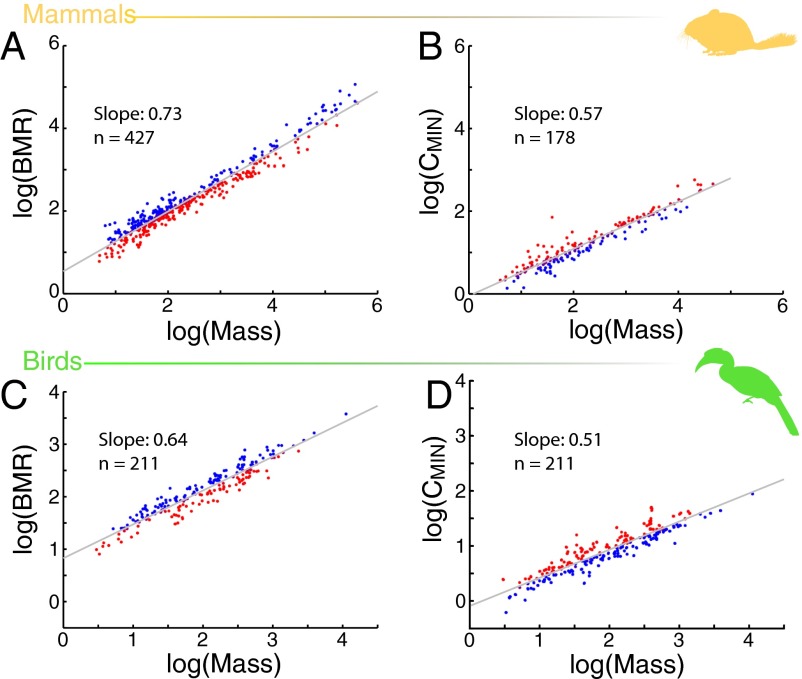
The situation is complicated, however, because BMR and CMIN scale predictably with body size in birds and mammals (Fig. 2). Rates of both heat production and heat loss are higher in larger species than in smaller species (6), but BMR increases with mass more rapidly than CMIN, so larger endotherms are predicted to have a higher ratio of BMR/CMIN, to have a lower Tlc, and to be better able to tolerate colder temperatures than smaller organisms (7, 8).
Fig. 2.
Allometric relationships of BMR and CMIN with body size in mammals and birds. In both groups, BMR [mammals (A), n = 427; birds (C), n = 211] and CMIN [mammals (B), birds (D)] increase with body size. However, because BMR increases with mass more rapidly than CMIN (mammals: BMR slope = 0.73, CMIN slope = 0.56; birds: BMR slope = 0.64, CMIN slope = 0.51), larger organisms have a higher ratio of BMR/CMIN, and therefore are better able to tolerate colder temperatures compared with smaller organisms. Species plotted in red have a BMR or CMIN that provides increased heat tolerance compared with similarly sized species, whereas species plotted in blue are more cold-tolerant. BMR data for mammals are from the PanTHERIA dataset (30); CMIN data for mammals and data for birds are from the present study.
This logic underpins Bergmann’s hypothesis (9) to explain geographic variation in body size within closely related taxa of mammals and birds: In colder environments at high latitudes and elevations, natural selection should favor larger individuals because they expend relatively less energy on thermoregulation. This prediction is generally supported by the examples of intraspecific variation in body size consistent with Bergmann’s rule that have been documented in many, but by no means all, kinds of mammals and birds (10, 11).
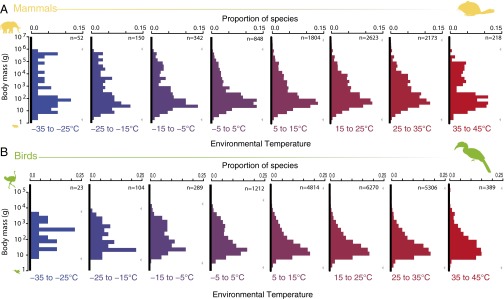
If body size is the predominant means of thermal adaptation, however, it would be predicted that only large-bodied species inhabit the coldest environments and only small bodied species occur in the hottest environments. Such is not the case, as shown by compiling and analyzing data on the geographic ranges of 6,356 species of birds and 2,648 species of terrestrial mammals (Fig. 3). Only five species of mammals with body sizes ranging from 54 g to 312 kg inhabit geographic ranges where average minimum temperatures fall below −35 °C. Otherwise, the smallest bodied mammal species (2.3–3 g) occur across the entire breadth of environmental temperatures from −35 to 45 °C, and, contrary to prediction, the largest species (1,000–3,250 kg) occur only in relatively warm temperatures (5–35 °C; Fig. 3A). In birds, the smallest body sizes (1.9–3 g) support the prediction, because they are missing from the coldest environments (−35 to −5 °C; Fig. 3B). Contrary to prediction and similar to mammals, however, the largest bird species (30–111 kg) occur only in environments with temperatures ranging from moderate to the hottest (5–45 °C). These patterns support previous studies suggesting that adaptive shifts in body size are not a major avenue of climatic adaptation in birds and mammals, except perhaps at the within-species level (12, 13).
Fig. 3.
Body size distributions for mammals (A) and birds (B) across terrestrial environmental temperatures (coldest temperatures in blue, hottest temperatures in red). Maximum and minimum body sizes within each temperature bin are indicated by gray arrows. The limits of each species’ environmental temperature range were determined by the average minimum and maximum temperatures from throughout its geographic range. Species are included in histograms for each 10 °C temperature bin with which this range overlaps. In mammals, the smallest species are present throughout temperature regimes, whereas the largest species occur only in relatively warm climates (5–35 °C). The smallest birds do not occur in the coldest climates (−35 to −5 °C), and the largest species occur only in moderately warm or the hottest environments (5–45 °C).
Theory: Extensions of the S-I Model
The S-I model straightforwardly predicts adaptations to environmental temperature regimes that are independent of body size (4, 14). In colder environments, birds and mammals are predicted to have higher BMR and lower CMIN, or perhaps some combination of these traits. Such adaptations should explain some of the considerable variation around the allometric relationships in Fig. 2. For any species, the variation in these traits independent of body size can be measured statistically as the residuals orthogonal to the body size axis [log(BMR) residuals or log(CMIN) residuals]. A species that falls above the regression line in Fig. 2 A or C has a relatively higher BMR for its size [log(BMR) residuals > 0], and should therefore be better adapted to colder temperatures (i.e., more cold-tolerant). Conversely, species below the line [log(BMR) residuals < 0] should be adapted to warmer temperatures (i.e., more hot-tolerant). The opposite is true in the case of CMIN; species below the regression line in Fig. 2 B or D have lower rates of heat loss than similarly sized species [log(CMIN) residuals < 0] and should be better able to tolerate colder temperatures, and vice versa for species above the line [log(CMIN) residuals > 0].
The magnitude of thermal adaptation depends not only on BMR or CMIN alone, but on how the two traits change relative to one another (14, 15). For example, a species with both a higher BMR and lower CMIN than expected for its body size should be especially well cold-adapted, whereas a species with a higher BMR and higher CMIN than expected might be no more cold-tolerant than an average species of the same size. Deviations in both BMR and CMIN can be combined into a single quantitative measure of mass-independent thermal adaptation (A):
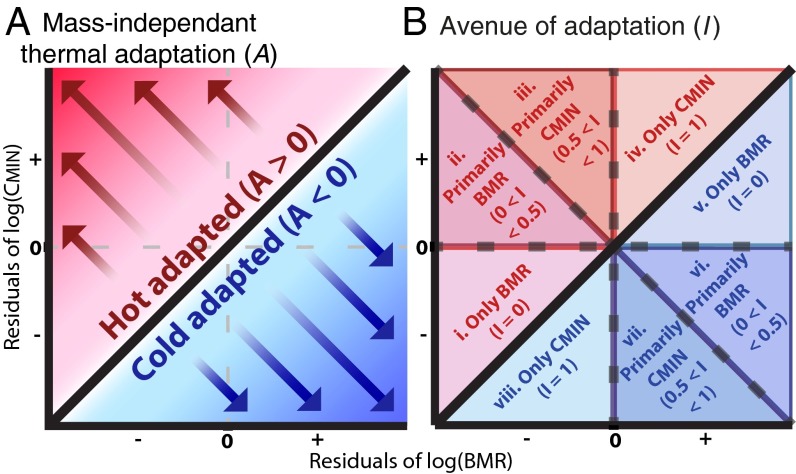
According to this parameterization, species with A > 0 should be better adapted to warmer temperatures than expected for their body size (i.e., hot-tolerant) and species with A < 0 should be better adapted to colder temperatures (i.e., cold-tolerant). The relationship between log(BMR) residuals, log(CMIN) residuals, and mass-independent thermal adaptation is illustrated in the conceptual diagram in Fig. 4A.
Fig. 4.
Conceptual diagrams outlining mass-independent thermal adaptation (A) and our index of avenue of adaptation (I). (A) When comparing the residuals from the relationships of log(BMR) and log(CMIN) with log(body size), any species falling on the one-to-one line (black; A = 0) would have a thermal tolerance as expected for its body size. (A) Species that fall below the line (area in blue; A < 0) should be cold-adapted for their body size, and species that fall above the line (area in red; A > 0) will be able to tolerate hotter temperatures. (B) Relative importance of BMR compared with CMIN in determining A is depicted by a species’ position and corresponds to the value of I. A species can be (i) hot-adapted via increases to CMIN only (I = 1), (ii) hot-adapted via increasing CMIN to a greater extent than decreasing BMR (0.5 < I < 1), (iii) hot-adapted via decreasing BMR to a greater extent than increasing CMIN (0 < I < 0.5), (iv) hot-adapted via decreases to BMR only (I = 0), (v) cold-adapted via increases to BMR only (I = 0), (vi) cold-adapted via increasing BMR to a greater extent than decreasing CMIN (0 < I < 0.5), (vii) cold-adapted via decreasing CMIN to a greater extent than increasing BMR (0.5 < I < 1), or (viii) cold-adapted via decreases to CMIN only (I = 1).
Because changes to BMR or CMIN may not contribute equally to A, we have constructed an index of avenues of adaptation (I) to the thermal environment to quantify the relative contribution of the residuals of log(CMIN) and log(BMR) to the value of A. When the magnitude of A is due entirely to changes in CMIN, I = 1 [i.e., log(CMIN) residuals contribute 100% to |A|, log(BMR) residuals reduce or contribute 0% to |A|]. On the other hand, when the residuals of log(BMR) solely contribute to the magnitude of A, I = 0 [i.e., log(CMIN) residuals decrease or contribute 0% to |A, log(BMR) residuals contribute 100% to |A|]. These situations may represent compromising selective pressures on traits affecting rates of heat production and heat loss due to factors not related directly to the thermal environment. An example would be lower conductance in colder environments to compensate for a low BMR due to adaptation to low environmental productivity and food supply (16, 17). When changes to both CMIN and BMR contribute to the magnitude of A, then I is calculated as:
In these cases, the contributions of log(CMIN) or log(BMR) residuals may not be equal, and I will fall somewhere between 0 and 1. The value of I can be depicted as the position of a species in the thermal adaptation space represented in Fig. 4B.
The above theoretical framework based on the S-I model makes several testable predictions:
-
i)
If body size is an important mechanism of thermal adaptation across species, larger species of birds and mammals should occur in colder environments, and vice versa for warmer environments. Previous studies and our analyses of geographic distributions (Fig. 3) generally do not support this prediction.
-
ii)
Species have responded to thermal environments independent of body size through shifting BMR, CMIN, or both (Fig. 2B).
-
iii)
Combining shifts in BMR and CMIN into a single measure of variation should provide additional evidence for the importance of these two mechanisms, singly and in combination. The overall magnitude of A is predicted to correlate significantly with variation in environmental temperature.
Empirical Evidence
We used published data on the thermal physiology of 211 species of birds and 178 species of mammals and environmental temperatures to evaluate the theoretical framework outlined above and test its predictions. Our objectives were, first, to quantify which body size-independent avenues of thermoregulation, changes in BMR, CMIN, or both, are more common and whether these traits are phylogenetically conserved, and, second, to test whether the magnitudes of mass-independent shifts in these variables correspond to the thermal environments of the species, thereby reflecting physiological adaptations.
Avenues of Adaptation in Hot- and Cold-Tolerant Species.
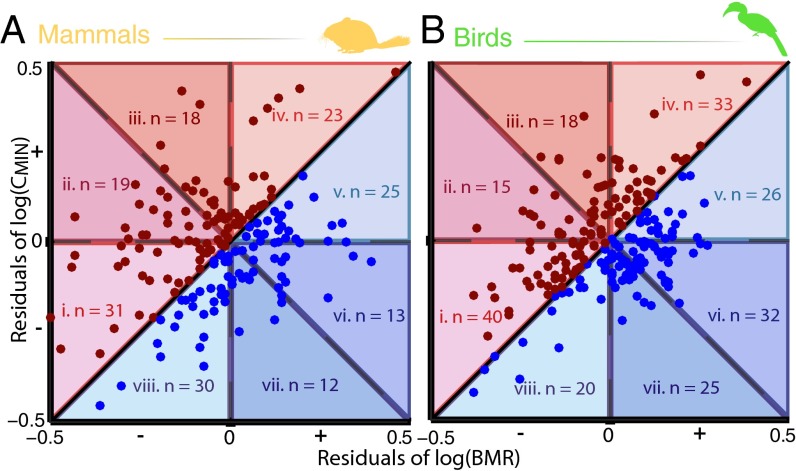
For hot-tolerant mammals (A > 0), low BMR was the most common avenue of adaptation (Fig. 5A). However, the distribution of species across the four categories was not significantly different from random (CMIN only: 23 species; primarily CMIN: 18 species; primarily BMR: 19 species; BMR only: 31 species; P = 0.20). In cold-tolerant mammals (A < 0), there were significantly more species with low CMIN than any other avenues of adaptation (CMIN only: 30 species; primarily CMIN: 12 species; primarily BMR: 13 species; BMR only: 25 species; P = 0.008). Few species of cold-tolerant mammals had low CMIN combined with high BMR.
Fig. 5.
Plotting the residuals of the relationships between BMR and CMIN with body size, as outlined in Fig. 4B, reveals the mass-independent thermal adaptation (A) and avenues of adaptation (I) for 178 mammals (A) and 211 birds (B). Species that are cold-tolerant for their body sizes (A < 0) are plotted in blue, and species that are hot-tolerant (A > 0) are plotted in red. In cold-adapted mammals, changes to CMIN only (area viii; I = 1) were the most common avenue of adaptation (P = 0.008). In hot-adapted birds, changes to BMR alone (area iv; I = 0) were the most common avenue of adaptation (P = 0.001). In the remaining groups, the distribution of species across categories was not significantly different from random (hot-adapted mammals: P = 0.20, cold-adapted birds: P = 0.42). The naked mole-rat (Heterocephalus glaber: BMR residuals = −0.36, CMIN residuals = 1.00) was excluded from A to maintain a similar scale and ease of comparison with B.
Low BMR was also the most common pattern of residuals exhibited by hot-tolerant birds (CMIN only: 33 species; primarily CMIN: 18 species; primarily BMR: 15 species; BMR only: 40 species; P = 0.001). Few species of hot-tolerant birds showed both low BMR as well as high CMIN. In cold-tolerant birds, most species showed shifts in both variables. Positive residuals of log(BMR) were generally greater than negative residuals of log(CMIN), although the distribution of species across categories was not significantly different from random (CMIN only: 20 species; primarily CMIN: 25 species; primarily BMR: 32 species; BMR only: 26 species; P = 0.42).
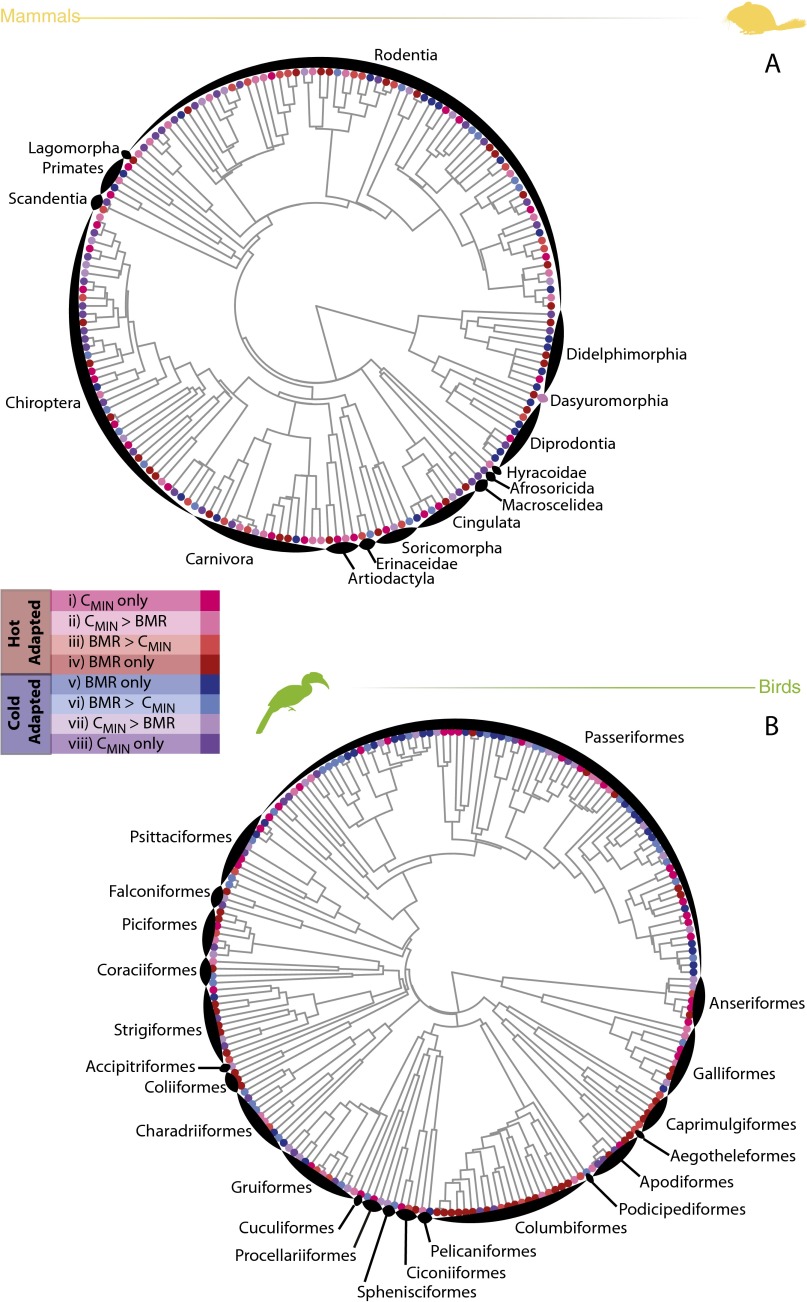
There was little evidence of an influence of phylogenetic relatedness on our I. Blomberg’s K calculated for I was not significantly different from 1 in either mammals or birds [mammals: K = 0.16, P = 0.26; birds: K = 0.015, P = 0.81; the phylogenetic distribution of avenues of adaptation (I) in hot- and cold-tolerant species is shown in Fig. S1].
Fig. S1.
Phylogenetic distribution of various avenues to mass-independent thermal adaptation (A) [(i) hot-adapted via increases to CMIN only, (ii) hot-adapted via increasing CMIN to a greater extent than decreasing BMR, (iii) hot-adapted via decreasing BMR to a greater extent than increasing CMIN, (iv) hot-adapted via decreases to BMR only, (v) cold-adapted via increases to BMR only, (vi) cold-adapted via increasing BMR to a greater extent than decreasing CMIN, (vii) cold-adapted via decreasing CMIN to a greater extent than increasing BMR, or (viii) cold-adapted via decreases to CMIN only] across mammals (A) and birds (B). The avenue of adaptation used by each species is reflected in its position in Fig. 5 A and B. There was little evidence of an effect of phylogenetic relatedness on our I (mammals: K = 0.16, P = 0.26; birds: K = 0.02, P = 0.81).
Thermal Adaptation vs. Environmental Temperature.
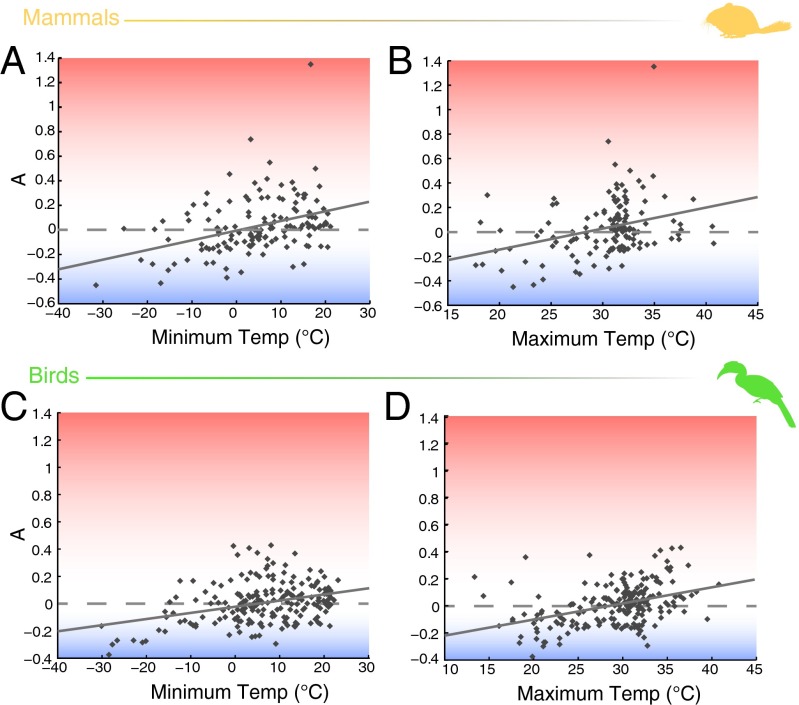
In both birds and mammals, our measure of A was significantly correlated with maximum and minimum environmental temperatures (Fig. 6 and Table 1). In birds, values of A were more strongly correlated with maximum than minimum temperature (maximum: R2 = 0.15, P << 0.001; minimum: R2 = 0.11, P << 0.001), whereas the opposite was true for mammals (maximum: R2 = 0.10, P << 0.001; minimum: R2 = 0.13, P << 0.001). These results remained unchanged when using phylogenetic generalized least squares (PGLS) analyses to account for phylogenetic relationships among species (Table 1).
Fig. 6.
Relationship from ordinary least squares (OLS) regression between mass-independent thermal adaptation (A) and environmental temperature (Temp) in mammals (A and B; excluding Chiroptera, n = 139) and birds (C and D; n = 211). In mammals, minimum environmental temperature explained more of the variation in A than maximum environmental temperature [minimum (A): R2 = 0.13, P << 0.001; maximum (B): R2 = 0.10, P << 0.001]. In birds, the opposite was true [minimum (C): R2 = 0.11, P << 0.001; maximum (D): R2 = 0.15, P << 0.001).
Table 1.
Results for regression analyses comparing A and environmental temperatures in mammals and birds
| Analysis | Environmental temperature | Slope | R2 | P | Lambda |
| Mammals | |||||
| OLS | Minimum | 0.006 | 0.13 | <<0.001 | — |
| Maximum | 0.017 | 0.10 | <<0.001 | — | |
| PGLS | Minimum | 0.005 | 0.05 | 0.004 | 0.69 |
| Maximum | 0.012 | 0.07 | <<0.001 | 0.70 | |
| Birds | |||||
| OLS | Minimum | 0.004 | 0.11 | <<0.001 | — |
| Maximum | 0.011 | 0.15 | <<0.001 | — | |
| PGLS | Minimum | 0.003 | 0.07 | <<0.001 | 0.38 |
| Maximum | 0.010 | 0.14 | <<0.001 | 0.30 |
In mammals, minimum temperatures explained more variation in A, whereas the opposite was true for birds. When using PGLS to account for the relatedness of species, the relationship between A and minimum environmental temperature in mammals was no longer significant. OLS, ordinary least squares.
Discussion
Despite the large effect of body size on thermal physiology, size alone only modestly influences the range of environmental temperature regimes where a species can occur. Nearly the full spectrum of mammalian body sizes occurs across the entire range of terrestrial environmental temperatures. The exceptions are the very largest mammals, which, contrary to predictions based on the relationship between body size and thermal physiology (7, 9), occur only in relatively warm environments. It is possible that the current distributions of the largest-bodied mammals and their absence from cold environments are the result of large-size bias in human-caused extinctions of megafauna outside of Africa (18, 19). In the case of birds, the smallest species do not occur in the coldest environments. As in mammals, the largest birds occur only in moderately warm to very hot environments. Considering that body size affects many other ecologically relevant traits in addition to thermal physiology (6, 20–22), it is not surprising that body size alone cannot account for all thermal adaptations.
In contrast to the patterns in body size, our data and analyses for variation in both BMR and thermal conductance in both birds and mammals provide strong evidence that BMR and thermal conductance are important mechanisms of adaptation to environmental temperature. The empirical patterns of residual variation orthogonal to the body size axis in these two measures of thermal performance support theoretical predictions based on the S-I model. The overall magnitude of A in both birds and mammals varies with environmental temperatures as predicted. In birds, maximum environmental temperatures were the best predictor of A, explaining nearly 20% of variation. Before accounting for phylogeny in mammals, minimum temperatures best explained variation in A. This difference between birds and mammals, as well as the stronger correlation between A and environmental temperature in birds, may reflect differences in lifestyle. For example, a large proportion of mammals are nocturnal, burrowing, and hibernators, attributes that are rare in birds but tend to reduce exposure to extreme temperatures in mammals (23, 24). This interpretation is consistent with results found by Khaliq et al. (1). In both birds and mammals, adaptive body size-independent changes to BMR and thermal conductance, in combination with additional behavioral and physiological traits, allow species to occur in a wide range of thermal environments. Although we focus on interspecific comparisons, similar physiological and morphological changes likely play a role in within-species adaptation to local environments (25).
Our results, specifically the unexplained variation around the relationships in Fig. 6, might be taken to suggest that only a modest number of mammal and bird species exhibit significant physiological adaptations to environmental temperature. This interpretation would be consistent with studies implying that behavioral and ecological factors, rather than physiological energetics, are the most important avenues of thermal adaptation in endotherms (17, 26, 27). However, we suggest that our results demonstrate important physiological avenues of adaptation, and that our analyses are conservative for several reasons.
First, our results show that different species of birds and mammals use different combinations of BMR and CMIN to adapt to similar thermal environments. Certain combinations were more common than others, however: cold-tolerant mammals used low CMIN most frequently, and hot-tolerant birds used low BMR as the primary avenue. Lack of phylogenetic signal for I, our index of the relative contribution of CMIN and BMR, implies that closely related species do not rely on one particular avenue of adaptation.
Second, we caution that our focus on CMIN and BMR directly addresses adaptation to only the cold end of the spectrum of thermal environments experienced by these species. Whereas responses of endotherms to cold stress primarily involve changes in insulation and metabolic rate, which are reflected relatively straightforward in CMIN and BMR, responses to heat stress are more complicated and may also include changes in body temperature and evaporative water loss. Although the S-I model and our extensions allow for direct predictions of the lower end, and not the upper end, of the TNZ, it is likely that these traits are linked to some degree. It is easy to imagine, for example, that increases to insulation that confer tolerance to cold temperatures should be disadvantageous in hot environments. Our emphasis on CMIN and BMR also overlooks the potential of body temperature in conferring thermal tolerance. Being a component of the S-I model, Tb may provide an additional avenue of adaptation to the thermal environment in endotherms.
Third, as previous studies have shown, physiological responses to cold stress may be complicated by tradeoffs in responses to other biological constraints and environmental conditions. For instance, birds use feathers for both insulation and flight; thus, changes that affect conductance may compromise flight, and vice versa (28).
Fourth, although our macroecological analysis highlights important patterns of interspecific variation at geographic spatial scales, it may miss many details that are important at smaller scales. The adaptations of local populations may reflect the range of environmental temperatures encountered by a species over its geographic range and over diel and seasonal cycles. As mentioned above, the extreme environmental temperatures, both cold and warm, actually experienced may be modified by physiological and behavioral adjustments, such as hibernation, estivation, torpor, migration, and microclimate selection. All of these traits are subject to a variety of sometimes conflicting selective pressures, some with offsetting effects acting directly on heat exchange and thermoregulation, and some reflecting other selective pressures on metabolism, integumentary and vascular systems, life history, behavior, and ecology (17, 26, 27, 29).
Our results build on the S-I model of heat transfer by deriving and empirically testing an axis of thermal adaptation that is independent of body size. Our macroecological approach highlights the complex interactions among physiological and morphological traits that allow endotherms to persist in a wide range of thermal regimes at a large geographic scale. Many aspects of structure and function, anatomy, physiology, ecology, and behavior are highly constrained by allometric scaling relationships and, consequently, vary predictably with body size. For this reason, it is easy to understand why mass-independent variations in BMR and CMIN are important avenues of adaptation to environmental temperature regimes, which vary widely and predictably over the geographic ranges of birds and mammals. Additional studies of the interactive effects of body size and other morphological, physiological, and behavioral traits on thermal tolerances and performances will be an important step in predicting how birds and mammals respond to past, present, and future climate change.
Materials and Methods
Body Size Distributions.
We calculated the average minimum and maximum terrestrial temperatures from across the ranges of species for which we had both data on mass and digital shape files of geographic ranges (6,356 birds and 2,648 mammals). Mammal masses are from the PanTHERIA database (30), and bird masses are from Dunning (31). Geographic range data for mammals are from the International Union for Conservation of Nature (32), whereas geographic range data for birds are from Birdlife International (33).
For mammals and all nonmigratory bird species, the limits of the environmental temperature range are the average of the minimum or maximum temperatures of the coldest or warmest months, respectively, from throughout the geographic range (34). For migratory bird species, we calculated temperatures based on when they are likely to occur in different portions of their range. For each species, we calculated the following: the average minimum and maximum summer temperatures (June and July for Northern Hemisphere breeders, December and January for Southern Hemisphere breeders) from throughout the breeding portion of the range; the average minimum and maximum winter temperatures (December and January for Northern Hemisphere breeders, June and July for Southern Hemisphere breeders) from throughout the winter portions of the species range; and the average minimum and maximum temperatures from portions of the range where the species occurs as a year-round resident as explained above for nonmigratory species. We used the minimum and maximum of these temperatures as the limits of migratory species’ environmental temperature range. To construct Fig. 3, we plotted frequency distributions of body sizes for the species whose environmental temperature ranges overlapped with 10 °C temperature bins from −35 to 45 °C. A species was included in histograms for any temperature bin with which its environmental temperature range overlapped, and therefore could be counted in more than one histogram.
Thermal Adaptation and Avenues of Adaptation.
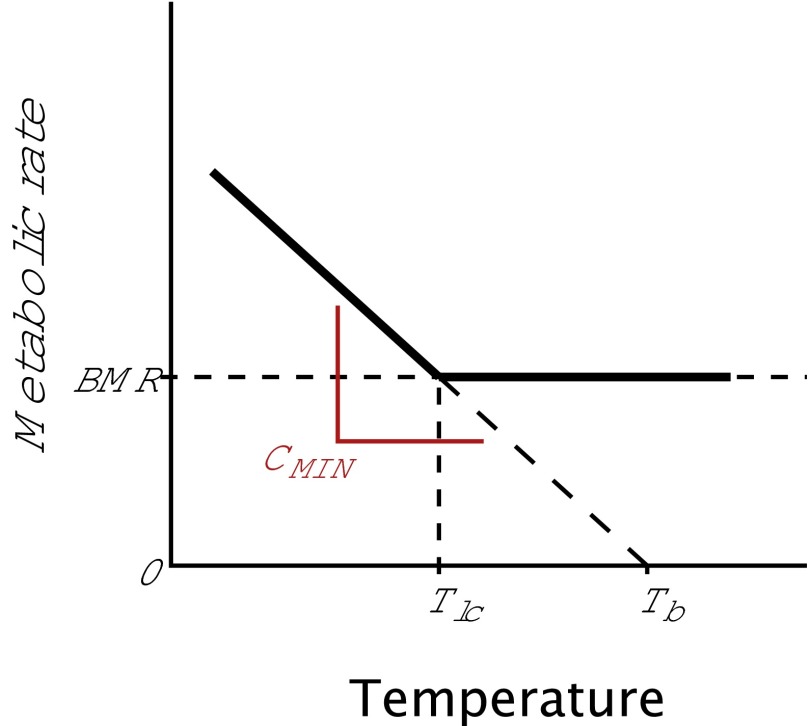
To calculate A and I, we used the residuals of log(CMIN) and log(BMR) from allometric relationships with body size for 211 birds and 178 mammals. CMIN was calculated as the absolute value of the slope of the line connecting Tlc at BMR to Tb when the metabolic rate is 0 (35) (Fig. S2):
Fig. S2.
Conceptual diagram illustrating our calculation of CMIN. For each species, we used the slope of the line connecting thermal Tlc at BMR to Tb when the metabolic rate is 0.
Data on BMR, TB, and Tlc were compiled from published literature following methods outlined by Khaliq et al. (1) (data and sources are provided in Dataset S1). We calculated log(CMIN) residuals from scaling relationships derived from all species for which we were able to estimate CMIN:
in birds and:
in mammals.
Log(BMR) residuals were calculated as the difference between observed data and expected values based on known scaling relationships:
for birds (36) and:
for mammals [calculated from PanTHERIA data (30)].
Residuals of log(CMIN) were plotted against the residuals of log(BMR) following the model in Fig. 4. In addition to calculating I, each species was assigned to one of eight categories reflecting where it occurred within the thermal adaptation space: (i) hot-adapted via increases to CMIN only; (ii) hot-adapted via increasing CMIN to a greater extent than decreasing BMR; (iii) hot-adapted via decreasing BMR to a greater extent than increasing CMIN, (iv) hot-adapted via decreases to BMR only, (v) cold-adapted via increases to BMR only, (vi) cold-adapted via increasing BMR to a greater extent than decreasing CMIN, (vii) cold-adapted via decreasing CMIN to a greater extent than increasing BMR, or (viii) cold-adapted via decreases to CMIN only (Fig. 4B). To determine if any avenue of adaptation was more common than expected by random, we performed χ2 tests separately for cold-tolerant mammals (i.e., A < 0), hot-tolerant mammals (i.e., A > 0), cold-tolerant birds, and hot-tolerant birds.
To determine if I is constrained by phylogeny, we used Blomberg’s K, which indicates the amount of phylogenetic relatedness in the tip data relative to expected (K = 1) for a trait under a Brownian mode of evolution. The significance of K was assessed by comparing the variance of independent contrast for 1,000 randomized trees with the variance of independent contrast of the observed tree using the “phylosignal” function in the R package picante (37).
We used ordinary least squares regression to test for a relationship between calculated values of A with maximum and minimum environmental temperatures. Species’ environmental temperatures were the same values calculated as outlined above for body size distributions. Because we used only terrestrial environments when calculating temperatures, we excluded species of birds whose ranges were primarily pelagic (orders Procellariiformes and Sphenisciformes, as well as families Laridae and Alcidae). Bats (order Chiroptera), differing markedly from other mammals in lifestyle, and likely in how they experience the thermal environment, were also excluded from this analysis. A positive relationship between A and environmental temperature would indicate a match between A and thermal environment. However, comparative analysis involving many species is complicated due to the evolutionary relatedness and nonindependence of species (38). To account for this nonindependence, we used PGLS to estimate and weigh for the level of phylogenetic dependence in the regression residuals in generalized least squared regression calculations.
Supplementary Material
Acknowledgments
We thank Felisa A. Smith and reviewers for their helpful comments. I.K. was supported by the Higher Education Commission of Pakistan and the German Academic Exchange Service. I.K. and C.H. were supported by the Landes-Offensive zur Entwicklung Wissenschaftlich-ökonomischer Exzellenz funding program to the Biodiversity and Climate Research Centre. J.R.B. was supported by the Shadle Fellowship from the American Society of Mammologists. M.A.B. and J.R.B. were supported by the Program in Interdisciplinary Biological and Biomedical Sciences through the University of New Mexico (Grant T32EB009414) from the National Institute of Biomedical Imaging and Bioengineering.
Footnotes
The authors declare no conflict of interest.
This article contains supporting information online at www.pnas.org/lookup/suppl/doi:10.1073/pnas.1521662112/-/DCSupplemental.
References
- 1.Khaliq I, Hof C, Prinzinger R, Böhning-Gaese K, Pfenninger M. Global variation in thermal tolerances and vulnerability of endotherms to climate change. Proc Biol Sci. 2014;281(1789):20141097. doi: 10.1098/rspb.2014.1097. [DOI] [PMC free article] [PubMed] [Google Scholar]
- 2.Sunday JM, Bates AE, Dulvy NK. Thermal tolerance and the global redistribution of animals. Nat Clim Chang. 2012;2(9):686–690. [Google Scholar]
- 3.Scholander PF, Hock R, Walters V, Johnson F, Irving L. Heat regulation in some arctic and tropical mammals and birds. Biol Bull. 1950;99(2):237–258. doi: 10.2307/1538741. [DOI] [PubMed] [Google Scholar]
- 4.McNab BK. The energetics of endotherms. Ohio J Sci. 1974;74(6):370–380. [Google Scholar]
- 5.McNab B, Morrison P. Body temperature and metabolism in subspecies of Peromyscus from arid and mesic environments. Ecol Monogr. 1963;33:63–82. [Google Scholar]
- 6.Schmidt-Nielsen K. Scaling: Why Is Animal Size So Important? Cambridge Univ Press; Cambridge, UK: 1984. [Google Scholar]
- 7.Riek A, Geiser F. Allometry of thermal variables in mammals: Consequences of body size and phylogeny. Biol Rev Camb Philos Soc. 2013;88(3):564–572. doi: 10.1111/brv.12016. [DOI] [PubMed] [Google Scholar]
- 8.Porter WP, Kearney M. Size, shape, and the thermal niche of endotherms. Proc Natl Acad Sci USA. 2009;106(Suppl 2):19666–19672. doi: 10.1073/pnas.0907321106. [DOI] [PMC free article] [PubMed] [Google Scholar]
- 9.Bergmann C. 1847. Über die Verhältnisse der Wärmeökonomie der Thiere zu ihrer Grösse. Göttinger Studien 3(1):595–708. German.
- 10.Millien V, et al. Ecotypic variation in the context of global climate change: Revisiting the rules. Ecol Lett. 2006;9(7):853–869. doi: 10.1111/j.1461-0248.2006.00928.x. [DOI] [PubMed] [Google Scholar]
- 11.Ashton KG, Tracy MC, de Queiroz A. Is Bergmann’s rule valid for mammals? Am Nat. 2000;156(4):390–415. doi: 10.1086/303400. [DOI] [PubMed] [Google Scholar]
- 12.Scholander PF. Evolution of climatic adaptation in homeotherms. Evolution. 1955;9(1):15–26. [Google Scholar]
- 13.McNab BK. On the ecological significance of Bergmann’s rule. Ecology. 1971;52(5):845–854. [Google Scholar]
- 14.Naya DE, Spangenberg L, Naya H, Bozinovic F. Thermal conductance and basal metabolic rate are part of a coordinated system for heat transfer regulation. Proc R Soc Lond B Biol Sci. 2013;280(1767):20131629. doi: 10.1098/rspb.2013.1629. [DOI] [PMC free article] [PubMed] [Google Scholar]
- 15.McNab BK. Extreme Measures: The Ecological Energetics of Birds and Mammals. Univ of Chicago Press; Chicago: 2012. [Google Scholar]
- 16.Lovegrove BG. The Zoogeography of Mammalian Basal Metabolic Rate. Am Nat. 2000;156(2):201–219. doi: 10.1086/303383. [DOI] [PubMed] [Google Scholar]
- 17.Anderson KJ, Jetz W. The broad-scale ecology of energy expenditure of endotherms. Ecol Lett. 2005;8(3):310–318. [Google Scholar]
- 18.Lyons S, Smith F, Brown J. Of mice, mastodons and men: Human-mediated extinctions on four continents. Evol Ecol Res. 2004;6:339–358. [Google Scholar]
- 19.Fritz SA, et al. Diversity in time and space: Wanted dead and alive. Trends Ecol Evol. 2013;28(9):509–516. doi: 10.1016/j.tree.2013.05.004. [DOI] [PubMed] [Google Scholar]
- 20.Peters RH. The Ecological Implications of Body Size. Cambridge Univ Press; Cambridge, UK: 1986. [Google Scholar]
- 21.Brown JH, Kodric-Brown A, Sibly RM. 2013. On body size and life history of mammals. Animal Body Size: Linking Pattern and Process Across Space, Time, and Taxonomic Group, eds Smith FA, Lyons SK (Univ of Chicago Press, Chicago), pp 206–234.
- 22.Smith F, Lyons S, Jone K, Maurer B, Brown J. 2013. The influence of flight on patterns of body size diversity and heritability. Animal Body Size: Linking Pattern and Process Across Space, Time, and Taxonomic Group, eds Smith FA, Lyons SK (Univ of Chicago Press, Chicago), pp 187–205.
- 23.Boyles JG, Seebacher F, Smit B, McKechnie AE. Adaptive thermoregulation in endotherms may alter responses to climate change. Integr Comp Biol. 2011;51(5):676–690. doi: 10.1093/icb/icr053. [DOI] [PubMed] [Google Scholar]
- 24.Bicudo JEP, Buttemer WA, Chappell MA, Pearson JT, Bech C. 2010. Ecological and Environmental Physiology of Birds (Oxford Univ Press, Oxford). Available at https://books.google.com/books?hl=en&lr=&id=4X0fAgAAQBAJ&oi=fnd&pg=PP2&dq=Ecological+and+Environmental+Physiology+of+Birds&ots=cZbm73nRhU&sig=fzY_u-oBQ6vzGIPt2D-PbAc09Us. Accessed July 31, 2015.
- 25.Briscoe NJ, Krockenberger A, Handasyde KA, Kearney MR. Bergmann meets Scholander: Geographical variation in body size and insulation in the koala is related to climate. J Biogeogr. 2015;42(4):791–802. [Google Scholar]
- 26.Naya DE, Spangenberg L, Naya H, Bozinovic F. How does evolutionary variation in Basal metabolic rates arise? A statistical assessment and a mechanistic model. Evolution. 2013;67(5):1463–1476. doi: 10.1111/evo.12042. [DOI] [PubMed] [Google Scholar]
- 27.McNab BK. Behavioral and ecological factors account for variation in the mass-independent energy expenditures of endotherms. J Comp Physiol B. 2015;185(1):1–13. doi: 10.1007/s00360-014-0850-z. [DOI] [PubMed] [Google Scholar]
- 28.HedenstrÖM A, Sunada S. On the aerodynamics of moult gaps in birds. J Exp Biol. 1999;202(1):67–76. doi: 10.1242/jeb.202.1.67. [DOI] [PubMed] [Google Scholar]
- 29.Wilson R, Hustler K, Ryan P. Diving birds in cold water: Do Archimedes and Boyle determine energetic costs? Am Nat. 1992;140:179–200. [Google Scholar]
- 30.Jones K, Bielby J, Cardillo M, Fritz S. 2009. PanTHERIA: A species-level database of life history, ecology, and geography of extant and recently extinct mammals: Ecological Archives E090-184. Ecology 90(9):2648–2648.
- 31.Dunning JB., Jr . CRC Handbook of Avian Body Masses. 2nd Ed CRC; Boca Raton, FL: 2007. [Google Scholar]
- 32.IUCN 2014 The IUCN Red List of Threatened Species. Version 2015-4. Available at iucnredlist.org. Accessed April 1, 2013.
- 33. BirdLife International and NatureServe (2014) Bird Species Distribution Maps of the World (BirdLife International, Cambridge, UK and NatureServe, Arlington, VA)
- 34.Hijmans R, Cameron S. Very high resolution interpolated climate surfaces for global land areas. Int J Climatol. 2005;25:1965–1978. [Google Scholar]
- 35.Lovegrove BG. The influence of climate on the basal metabolic rate of small mammals: A slow-fast metabolic continuum. J Comp Physiol B. 2003;173(2):87–112. doi: 10.1007/s00360-002-0309-5. [DOI] [PubMed] [Google Scholar]
- 36.McNab BK. Ecological factors affect the level and scaling of avian BMR. Comp Biochem Physiol A Mol Integr Physiol. 2009;152(1):22–45. doi: 10.1016/j.cbpa.2008.08.021. [DOI] [PubMed] [Google Scholar]
- 37.Kembel SW, et al. Picante: R tools for integrating phylogenies and ecology. Bioinformatics. 2010;26(11):1463–1464. doi: 10.1093/bioinformatics/btq166. [DOI] [PubMed] [Google Scholar]
- 38.Felsenstein J. Phylogenies and the comparative method. Am Nat. 1985;125:1–15. [Google Scholar]
Associated Data
This section collects any data citations, data availability statements, or supplementary materials included in this article.


