Significance
The mammalian innate immune system recognizes double-stranded RNA (dsRNA) as a signature of infections and cell damage. Cells exposed to dsRNA release interferons to activate protective programs in surrounding tissues. One of these protective programs triggers regulated decay of intracellular RNA by the pseudokinase/endoribonuclease RNase L. Here we map the pathway of this RNA decay transcriptome-wide and identify groups of selectively destabilized human messenger RNAs. We show that RNA decay by RNase L has an important role in homeostasis and serves as a suppressor of cell adhesion. Our work defines the targets of RNase L and clarifies the role of the dsRNA-activated messenger RNA decay in the interferon response.
Keywords: RNase L, microRNA, miR-200, adhesion, dsRNA
Abstract
Double-stranded RNA (dsRNA) activates the innate immune system of mammalian cells and triggers intracellular RNA decay by the pseudokinase and endoribonuclease RNase L. RNase L protects from pathogens and regulates cell growth and differentiation by destabilizing largely unknown mammalian RNA targets. We developed an approach for transcriptome-wide profiling of RNase L activity in human cells and identified hundreds of direct RNA targets and nontargets. We show that this RNase L-dependent decay selectively affects transcripts regulated by microRNA (miR)-17/miR-29/miR-200 and other miRs that function as suppressors of mammalian cell adhesion and proliferation. RNase L mimics the effects of these miRs and acts as a suppressor of proliferation and adhesion in mammalian cells. Our data suggest that RNase L-dependent decay serves to establish an antiproliferative state via destabilization of the miR-regulated transcriptome.
RNase L is a mammalian endoribonuclease regulated by the action of dsRNA and IFNs α/β/λ, which induce the intracellular synthesis of a specific RNase L activator, 2–5A (1). RNA cleavage is thought to account for all biological functions of the RNase L·2–5A complex, including innate immunity during the IFN response (2, 3), and regulation of cell cycle (4), proliferation (5), adipocyte differentiation (6), and apoptosis (7). RNase L inhibits translation by site-specific cleavage of 18S and 28S rRNA (8) and activates transcription and the inflammasome NLRP3 by releasing signaling RNA fragments (2, 9, 10). These mechanisms complement or operate in parallel with posttranscriptional gene control via regulated decay of some mRNAs, including myogenic regulatory factor MyoD (11), components of IFN signaling ISG43 and ISG15 (12), translation-inhibiting kinase PKR (13), cathepsin E gastric protease (3), 3′-UTR–binding protein HuR (4), as well as ribosomal and mitochondrial protein-encoding mRNAs (14–16). Although the repression of these transcripts depends on RNase L, it remains unknown how many of them are cleaved physically and how many are down-regulated indirectly—for example, via transcription.
A recent RNA-sequencing (RNA-seq) study described some of the direct targets of RNase L (8). Cleavages were reported for 18S rRNA and U6 snRNA, however the experiment was designed to detect predominantly ribosomal reads and the direct impact of RNase L on mRNAs was not defined. Structural and biochemical studies found that RNase L cleaves RNA at the consensus sequence UN^N (N = A, U, G, or C; ^ is the cleavage location) (17–19). The UN^N motifs are abundant in all mammalian RNAs, suggesting that RNase L may degrade every mRNA it encounters, which surprisingly contrasts regulation of RNase L by the highly specific stimuli dsRNA, IFNs, and 2–5A.
Mammalian cells contain a transmembrane RNase L homolog, a kinase/RNase Ire1, which drives the unfolded protein response and regulated Ire1-dependent decay (RIDD) (18, 20). The cleavage consensus sequence of Ire1 (UG^C) is similarly relaxed, however Ire1 targets only specific mRNAs. The specificity is achieved by colocalization with cognate mRNAs at the ER membrane (21). For the cytosolic enzyme RNase L, such a specificity mechanism is not documented. To understand mammalian gene regulation by RNase L, we mapped RNase L-dependent decay (RLDD) in human cells. We show that RNase L does not cleave all cellular transcripts and identify biologically related groups of RLDD targets and nontargets.
Results
Direct Cleavage of Human Transcripts by RNase L.
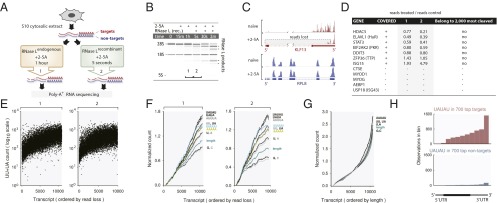
To observe cleavage of human transcripts by RNase L and minimize off-pathway effects from RNase L-independent decay and transcription, we used HeLa S10 extracts. This approach removes the nucleus and the plasma membrane and permits selective and rapid RNase L activation. We exposed the human transcriptome to activated RNase L using two complementary techniques and used either synthetic 2–5A to activate endogenous RNase L (Fig. 1A) or crystallization-purity recombinant human RNase L premixed with 2–5A. Both techniques activate RNase L and produce the characteristic pattern of 28S rRNA cleavage (Fig. 1B).
Fig. 1.
RNA-seq analysis of mRNA cleavage by RNase L in HeLa extracts. (A) Two RNA-seq approaches for detection of direct mRNA cleavage by RNase L. (B) Cleavage of rRNA. Samples 1 and 2 were used for RNA-seq; the numbering is as in A. (C) RNA-seq traces for a target (KLF13) and a nontarget (RPL8). (D) Cleavage properties of previously reported RNase L targets. (E) Frequency of UU+UA dinucleotides as a function of RNase L sensitivity. (F) Running average frequency of motifs as a function of RNase L sensitivity or (G) mRNA length. (H) Distribution of UAUAU sites along mRNA length in targets and nontargets of RNase L.
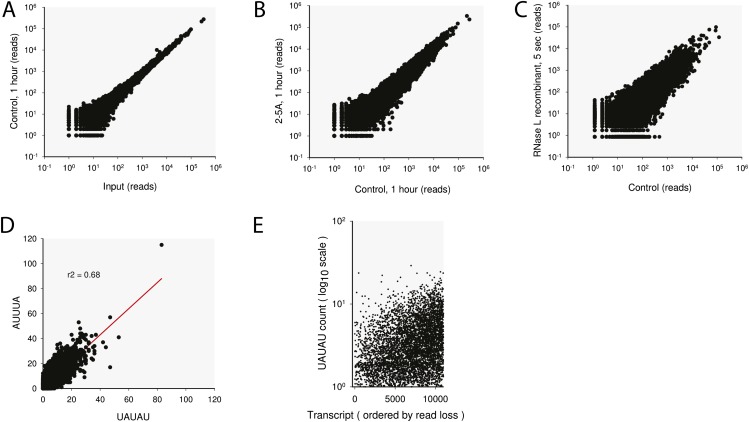
We analyzed the resulting RNA samples using poly-A+ RNA-seq, which captures the poly-A tails and reveals cleavage by the loss of 5′-terminal reads (Fig. 1C). Incubation of untreated S10 extracts had no considerable effects on the mRNA levels (Fig. S1A), whereas addition of 2–5A or the RNase L·2–5A complex produced a broad response (Fig. S1 B and C and Dataset S1). We identified transcripts that exhibited a strong loss of reads (targets) as well as transcripts that remained intact (nontargets; Fig. 1C). The levels of multiple mRNAs fell by 100–1,000-fold when most of the 28S rRNA was still uncleaved (Fig. 1B, “2”). Based on this quantification, the ribosomes are not the preferred targets of RNase L and mRNA cleavage may be substantial even when 28S rRNA is visibly intact. Seven previously reported mRNA targets of RNase L (22) were abundant sufficiently for detection in our samples. Five were cleaved weakly, whereas two (TTP and ISG15) were resistant and belonged to nontargets (Fig. 1D). None belong to 2,000 most strongly cleaved transcripts (Fig. 1D and Dataset S1).
Fig. S1.
RNA-seq analysis of HeLa extracts. (A) Abundance of mRNAs measured by RNA-seq of S10 extract incubated for 1 h under the reaction conditions (Methods) versus matching naїve extract. (B) Abundance of mRNAs measured by RNA-seq of S10 extract cleaved by endogenous RNase L versus matching control extract incubated without 2–5A. (C) Abundance of mRNAs measured by RNA-seq of S10 extract treated with recombinant RNase L for 5 s versus naїve extract. (D) Correlation of AUUUA and UAUAU abundance in the transcripts covered by the RNA-seq analysis. (E) Plain count of UAUAU sites in mRNAs from HeLa S10 samples as a function of read loss upon cleavage by RNase L. Note the log10 y axis scale.
RNase L cleaves the UN^N pattern but prefers UU^N and UA^N sites in model substrates (17, 23). The UU/UA preference is recapitulated in our RNA-seq data (Fig. 1E). We extended this analysis to other sequences and calculated running average counts for a number of motifs. To account for the higher frequency of shorter sequences (such as UU) compared with longer sequences (such as UUUUU), we normalized the running averages by the net average of the dataset and graphed the profiles from the same origin. As a baseline, we plotted the running average of mRNA length, which does not depend on mRNA sequence. The targets of RNase L are generally longer than nontargets, likely due to the presence of more phosphodiester bonds and more opportunities for cleavage of these mRNAs (Fig. 1F). Nucleotides G and C accumulate more slowly than the length, indicating that these bases are negatively selected in RNase L targets. Nucleotides U and A are positively selected, consistent with the reported U > A>>G > C preference of RNase L (23). Motifs UU/UA and UUUUU/AAAAA are enriched in targets, however even stronger enrichment occurs for patterns AUUUA and UAUAU (Fig. 1F). These enrichments cannot be accounted for by the natural composition of long versus short transcripts (Fig. 1G). The AUUUA pattern is a known stability element (AU-rich element) found usually in the 3′-UTRs of mRNAs (24). The UAUAU motif is also enriched in the 3′-UTRs (Fig. 1H) and often co-occurs with the AUUUA motif (Fig. S1D, R2 = 0.68).
The AUUUA/UAUAU sequence preference is not encoded in the RNase L protein (18), therefore our data must reflect the properties of the mRNAs that have these motifs. These mRNAs could be more accessible to RNase L, have a higher tendency to exist in locally single-stranded structures, or have bound helper proteins. The elevated abundance of the AUUUA/UAUAU sites is not the only determinant of RNase L cleavage, as indicated by the large vertical scatter in Fig. 1E and Fig. S1E. Presently unknown features independent from the AU-rich element abundance, such as mRNA localization, binding of proteins or microRNAs, or the identity of translated proteins, must further distinguish the targets of RLDD.
RNase L Selects MicroRNA-Regulated mRNAs.
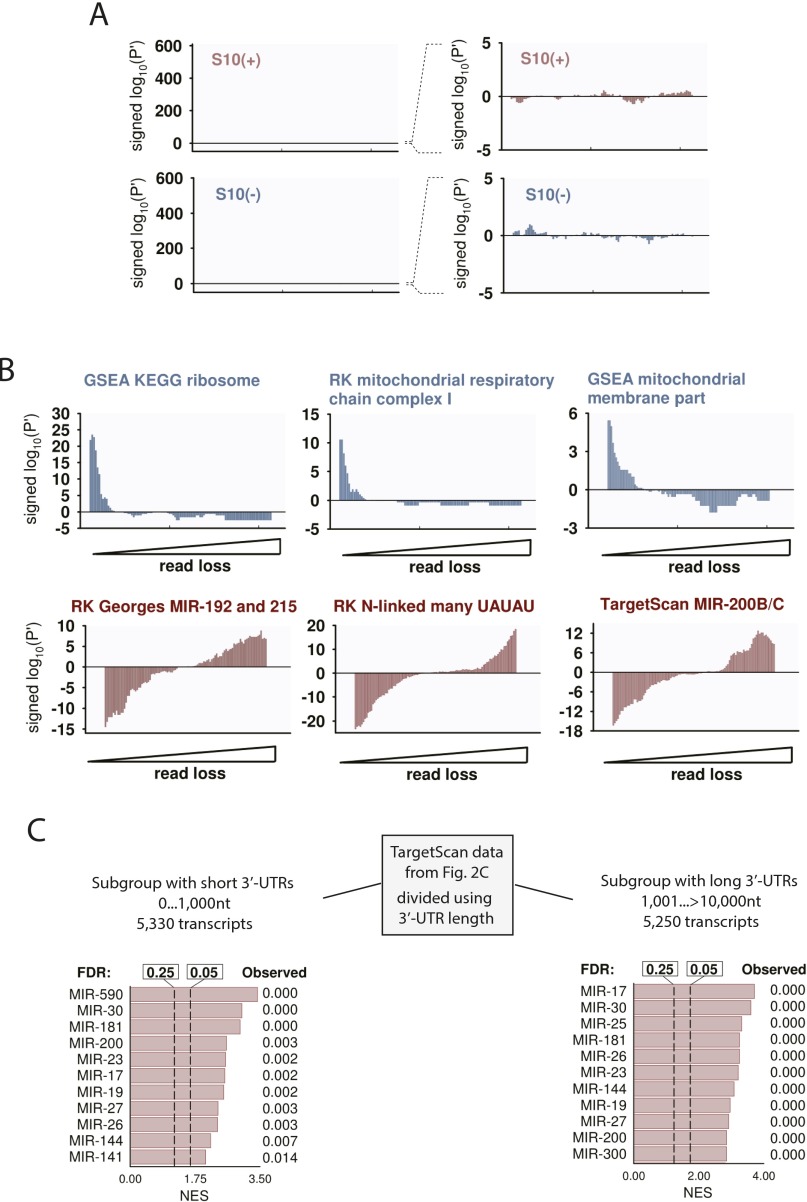
By combining the data from both RNA-seq strategies, we assembled the lists of RNase L targets (S10+ signatures) and nontargets (S10– signatures) (Fig. 2A and Dataset S1). These S10 signatures provide the reference for evaluation of mechanistic RNase L activity in high-throughput datasets. To this end, we used a probability-based approach that uses signed P′ calculations (SI Methods). This method shows positive peaks in the regions of data that have enrichments for signature genes, negative peaks where the signature genes are depleted (Fig. 2B), and absence of peaks when the gene order is random (Fig. S2A). We used the signed P′ analysis as a standard procedure for evaluating RNase L activity in subsequent RNA-seq experiments.
Fig. 2.
Gene set enrichment analysis of RLDD. (A) Overlay of mRNA cleavage profiles for endogenous (1) and recombinant (2) RNase L. Numbering is as in Fig. 1A. Common targets down-regulated by ≥threefold are designated as S10+ signatures; the 1,016 most resistant transcripts from sample 1 and transcripts down-regulated by no more than 10% in sample 2 are designated as S10– signatures. (B) Signed P′ profiles for RNA-seq data from samples 1 and 2. (C) GSEA profiling of the RNA-seq data. The 25% (GSEA-recommended) and the 5% (classic) limits are marked with dashed lines. Observed FDR values for each signature are shown in the right column. x axis shows the GSEA normalized enrichment score (NES).
Fig. S2.
Signed P′ and TargetScan analyses of HeLa extracts. (A) Signed P′ profile for data in Fig. 2B, after randomization of the input data. The |log10(P′)| values for a randomized dataset do not exceed the magnitude of ∼1 and lack the characteristic uniform change from left to right observed with nonrandom data (Fig. 2B). (B) Signed P′ analysis of select signatures indentified by GSEA. Nontargets of RNase L are colored blue; targets are colored red. The P′ analysis shows enrichment of the nontargets in the resistant mRNAs (left half of the x axis) and enrichment of the targets in the cleaved mRNAs (right half of the x axis), as expected. (C) MicroRNA enrichment analysis separately for transcripts with short and long 3′UTRs. The analysis describes two subsets derived from the data in Fig. 1A (experiment 1), based on the 3′UTR length. The first subset contains only mRNAs with short 3′UTRs of ≤1,000 nt (5,330 transcripts, ∼50% of the entire dataset). The second subset has the mRNAs with short 3′UTRs selectively removed and contains 5,250 transcripts (also ∼50% of the entire dataset). GSEA shows robust enrichments for microRNA targets in both subsets, indicating that RNase L preferentially targets microRNA-regulated transcripts within pools of mRNAs with comparable 3′UTR sizes.
To define the biological activities of RLDD, we used GSEA (Gene Set Enrichment Analysis) (25). We expanded the standard GSEA library (10,295 gene sets) by 9,492 gene sets [Rath–Korennykh (RK) signatures, Dataset S2], which we derived from published annotation sources (26, 27). We additionally created two RK subsets with many and few UAUAU motifs, which are intrinsically enriched for targets and nontargets of RNase L, respectively. GSEA found that RNase L nontargets encode predominantly ribosomal and mitochondrial proteins. A false discovery rate (FDR) of <0.25 (25) was observed for gene groups “KEGG ribosome,” “cytosolic ribosome,” “respiratory electron transport,” “mitochondria,” and related terms (Fig. 2C). Notably, ribosomal and mitochondrial mRNAs have been previously proposed to be the targets of RNase L (14–16), whereas we do not see down-regulation of these transcripts, indicating that RLDD does not destabilize them directly. The targets of RNase L are enriched for “zinc finger,” “plasma membrane,” and related gene sets (Fig. 2C and Fig. S2B). The enrichment for zinc fingers, many of which are transcription factors (TFs), suggests a possible cause of transcriptional (10) gene regulation by RNase L. The UAUAU-rich signatures show similar enrichments as well as enrichments for “membrane,” “N-linked,” “GlcNAc,” “extracellular,” and related terms, indicating degradation of many ER-targeted transcripts.
GSEA shows further that the RLDD targets are strongly enriched for transcripts regulated by the microRNAs miR-21, miR-30, miR-155, miR-192, and miR-200 (Fig. 2C, GSEA and RK data). These microRNAs regulate cell cycle, growth, proliferation, apoptosis, carcinogenesis, and adipogenesis (28–31), which recapitulates the known repertoire of RNase L (7, 32–34). To assess the microRNA connection more inclusively, we performed GSEA profiling of conserved microRNA targets from TargetScan 6 (35). This analysis confirmed an extensive overlap between RLDD and microRNA targets (Fig. 2C, TargetScan and Fig. S2C). Because our RNA-seq experiments detect the direct action of RNase L (Fig. 1A), RNase L physically cleaves the mRNA targets of microRNAs rather than destabilizes them via microRNA modulation.
RLDD Is Conserved in Live Cells and Across Cell Types.
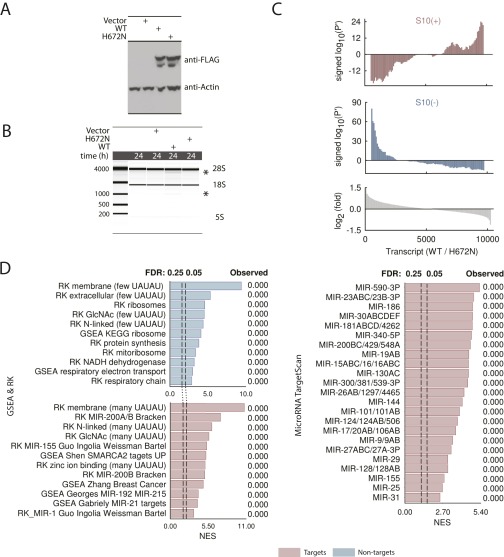
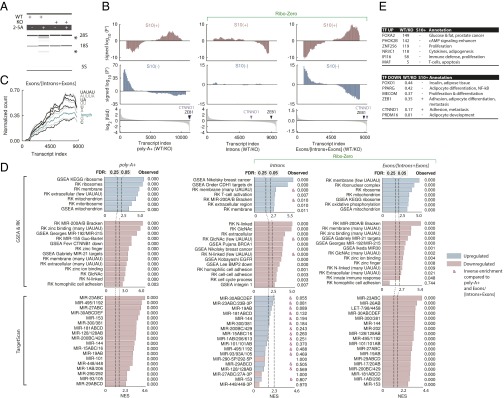
To confirm that S10 extracts reflect RLDD in live cells, we sequenced RNA from HeLa cells overexpressing WT RNase L or the catalytically inactive point mutant H672N (18). Overexpressed WT RNase L was active due to either endogenous dsRNA (36) or autonomous self-association (37), whereas the H672N mutant was inactive. Signed P′ analysis of S10– and S10+ signatures and GSEA profiles in these experiments show that RLDD targets the same mRNA groups in cells and in S10 extracts (Fig. S3).
Fig. S3.
Profiling mRNA targets using RNase L overexpression in live HeLa cells. (A) Western blot analysis of overexpressed WT and H672N RNase L. (B) Cleavage of 28S rRNA in cells overexpressing WT RNase L. The control point mutant H672N shows no rRNA cleavage. Total RNA analysis was conducted on BioAnalyzer with an RNA Nano-Chip. RNase L cleavage products are marked with an asterisk. (C) Signed P′ analysis of S10+ and S10– signatures in RNA-seq samples from HeLa cells overexpressing WT and H672N RNase L. Bottom graph shows running average of log2[(reads, WT)/(reads, H672N)]. Data were obtained using two biological replicates for each, WT and H672N overexpression. (D) GSEA preranked enrichment analysis conducted as in Fig. 2C.
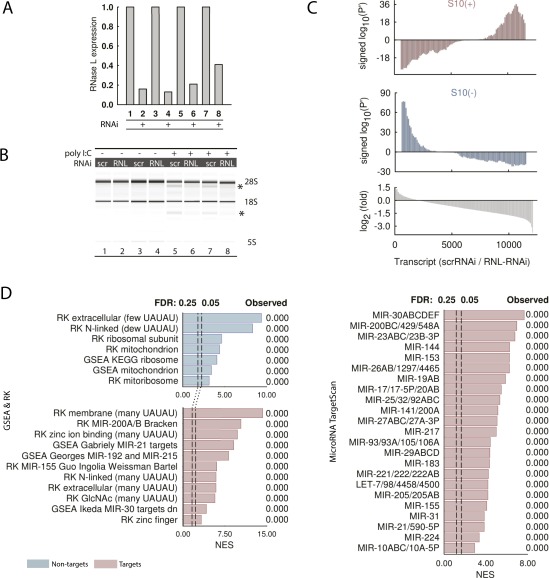
Similar results were obtained using RNAi-knockdown (KD) experiments. The RNAi approach provided 60–80% RNase L KDs in HeLa cells relative to scrambled siRNA controls (Fig. S4A). To activate RNase L in WT and KD cells, we used poly-inosine/cytosine (poly-I:C), a synthetic dsRNA that triggers the IFN response, 2–5A synthesis, and 28S rRNA cleavage (Fig. S4B and Dataset S1). Compared with controls, KD cells showed stabilization of S10+ signatures (Fig. S4C) and GSEA enrichments as in S10 extracts (Fig. S4D). RNAi data thus further confirm the conservation of RLDD between S10 extracts and live cells.
Fig. S4.
Profiling mRNA targets of RNase L in live HeLa cells using RNAi. (A) Expression of RNase L in HeLa cells transfected with RNAi for RNase L and with scrambled RNA control (scrRNA), monitored by qPCR. (B) BioAnalyzer analysis of 28S rRNA cleavage in cells with RNase L KD. Specific cleavage bands of RNase L are marked with an asterisk. RNase L was activated by transfecting poly-I:C (Methods). (C) Signed P′ analysis of the RNA-seq data. Two biological replicates (lines 5 and 7; lines 6 and 8; Table S1) were used for the analysis. (D) GSEA preranked enrichment analysis of the RNA-seq data, conducted as in Fig. 2C.
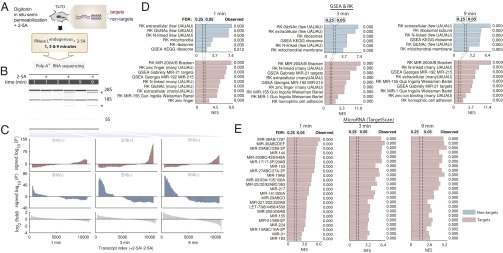
To evaluate whether our findings in HeLa extend to other cell types, we profiled RLDD in T47D human cells. T47D cells express more RNase L than HeLa cells, which allows fast activation of endogenous RNase L while preserving the cellular architecture better than using S10 extracts. Toward this end, we developed an in situ semipermeabilization procedure based on the recent study of receptor Stimulator of Interferon Genes (STING) activation by the second messenger 2′,3′-cGAMP (cyclic GMP-AMP) (38) (Fig. 3A). T47D cells were incubated for 1, 3, and 9 min with digitonin ± 2–5A (Fig. 3B and Fig. S5), and the mRNA samples were analyzed by poly-A+ RNA-seq. These data revealed the same targets and nontargets as in HeLa extracts and HeLa cells (Fig. 3 C–E), demonstrating conservation of RLDD in another cell line.
Fig. 3.
Profiling RLDD by in situ semipermeabilization in T47D cells. (A) Semipermeabilization procedure. (B) BioAnalyzer analysis of rRNA cleavage by RNase L. Cleavage products are marked with an asterisk. (C) Signed P′ analysis of the RNA-seq data. The ratios of reads in the +2–5A samples versus the corresponding mocks were used for analysis. (D) GSEA profiles for GSEA and RK signature sets. (E) GSEA profiles for TargetScan microRNA signature set. Enrichments are observed for the same groups of microRNAs as in HeLa extracts and in live HeLa cells.
Fig. S5.
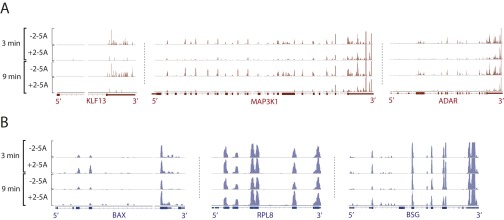
RNA-seq traces for select targets (A) and nontargets (B) of RNase L. Data obtained from T47D cells treated with 2–5A for 3 and 9 min were visualized in IGV (hg19) (50). Reads near the 3′ end are unchanged, whereas reads near the 5′ end are lost due to cleavage by RNase L.
Posttranscriptional and Transcriptional Axes of RLDD.
The knowledge of physical mRNA targets and nontargets allows profiling of the RNase L program with a considerable resolution. Here we built on this knowledge to evaluate the functions of RLDD in homeostasis and examined the transcriptomes of human WT and RNase L-knockout (KO) cells. These experiments extended our coverage to another cell line (HAP1) and defined the physiological effect of RNase L in the presence versus functional absence (Fig. 4A) of this protein. We used two different RNA-seq approaches: poly-A+ and Ribo-Zero sequencing (39).
Fig. 4.
RNA-seq analysis of WT and RNase L-KO human cells. (A) The 2–5A activates cleavage of 28S rRNA in WT but not RNase L-KO HAP1 cells. (B) Signed P′ profiles for poly-A+ and Ribo-Zero RNA-seq data. (C) Running average motif frequency in Ribo-Zero data. (D) GSEA analysis of poly-A+ and Ribo-Zero samples. Gene sets that exhibit inverse enrichment compared with poly-A+ samples are marked with an ampersand (&). (E) Select well-characterized TFs up-regulated and down-regulated in WT versus KO HAP1 cells in poly-A+ data. Poly-A+ RNA-seq data represent two biological replicates and Ribo-Zero data represent a single replicate.
Signed P′ analysis revealed characteristic RLDD profiles in poly-A+ data and in the ratio Exons/(Introns + Exons) in Ribo-Zero samples (Fig. 4B). In contrast, Ribo-Zero intron data had an inverse S10+ profile and a flat S10– profile (Fig. 4B). Our results can be explained by an approximation that changes in the poly-A+ mRNA levels reflect both transcriptional and posttranscriptional regulation; changes in the intron levels in Ribo-Zero data reflect largely transcriptional regulation, whereas changes in the ratio Exons/(Introns + Exons) in Ribo-Zero data correct for transcription and measure largely posttranscriptional regulation (Fig. 4B). The inverse enrichment of RNase L signatures in the intron data suggests a compensatory transcriptional response to mRNA destabilization (transcriptional buffering), observed previously during RNA decay by the exonuclease Xrn1 (40). The global mRNA stabilization in RNase L-KO cells obeys the sequence rules established for direct mRNA cleavage by RNase L in HeLa extracts (Figs. 1F and 4C), indicating that RLDD is conserved in HAP1 cells and that RNase L is constitutively active in these cells due to endogenous dsRNA (36) or 2–5A-independent RNase L activation (37).
Posttranscriptional regulation in HAP1 cells [GSEA poly-A+ and Exons/(Introns + Exons) Ribo-Zero data] resembles that in HeLa and T47D experiments (Fig. 4D). In contrast, transcriptional regulation (revealed by intron counting) is considerably different and shows an absence of the heretofore universally observed S10– signatures comprising ribosomal and mitochondrial enrichments (although 82% of the mitochondrial and 92% of the ribosomal transcripts from S10– signatures were covered by the intron data). The levels of multiple TFs (41) are altered in RNase L-KO cells, including TFs involved in proliferation, adipogenesis, insulin response, and adhesion (Fig. 4E). The majority of the repressed TF mRNAs are not the direct targets of RNase L (Fig. 4E). However, the transcripts of CTNND1 and ZEB1 are regulated directly by RNase L throughout our study (Dataset S1), and posttranscriptionally in HAP1 cells [Fig. 4B, Exon/(Intron + Exon) data]. Of note, CTNND1 and ZEB1 are regulated by microRNAs miR-29 and miR-200 (31, 42), which globally destabilize the same groups of mRNAs as RNase L.
RLDD Restricts Proliferation and Adhesion.
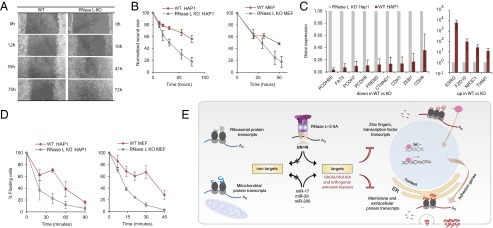
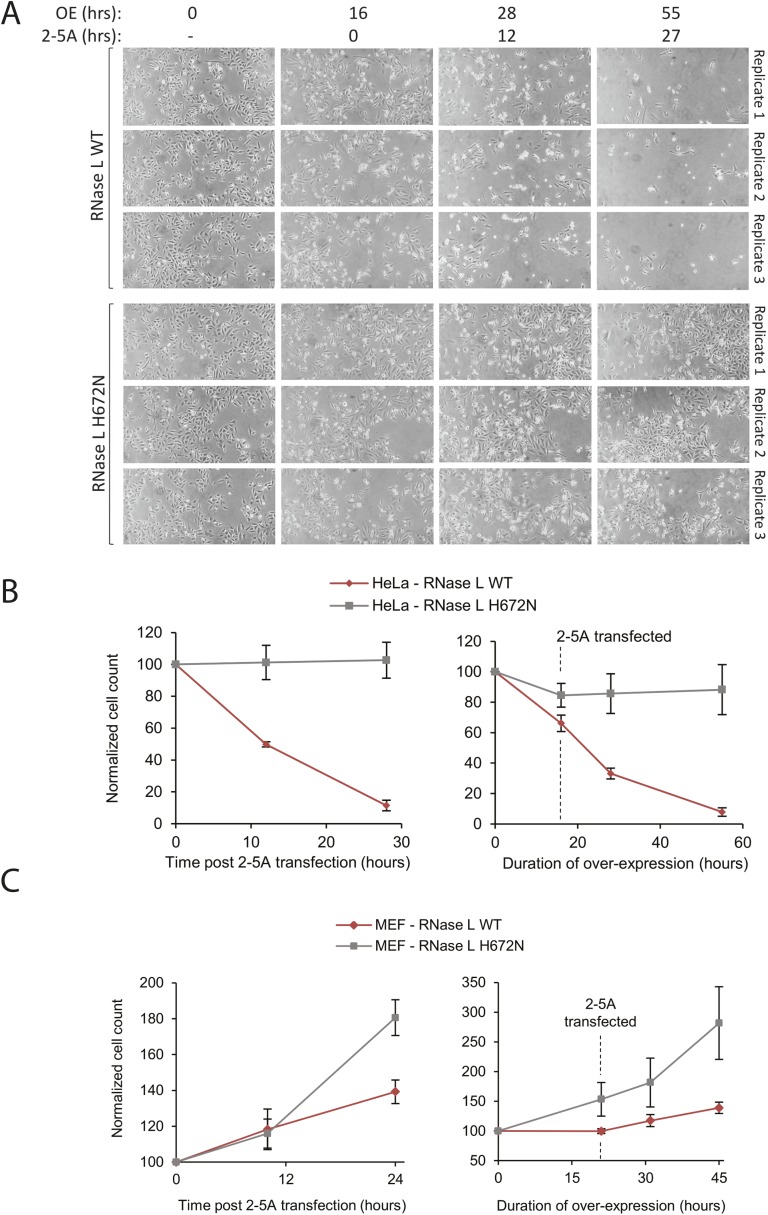
The miR-200/ZEB1 and miR-29/CTNND1 pathways inhibit cell proliferation and adhesion (28, 31, 42, 43). The notion that RNase L shares common targets with these microRNAs suggests that RNase L may exhibit similar physiologic activities. To test whether RNase L regulates proliferation in HAP1 cells, we used a scratch wound healing assay, which has been used previously to evaluate the antiproliferative roles of miR-29 and miR-200 (31, 42, 44). We observed a rapid wound closure in RNase L-KO cells but not in WT cells, confirming a proliferation suppressor function of RNase L (Fig. 5 A and B). The inhibitory action of RNase L on proliferation was also detected in mouse embryonic fibroblast (MEF) RNase L-KO cells and in HeLa cells (Fig. 5B and Fig. S6). The inhibitory effect may arise from more than one activity and reflect altered migration, growth, adhesion, or contact inhibition. The importance of RNase L for some of these processes, such as growth and cell cycle, has been documented (4). Here we report a role of RNase L in suppressing adhesion.
Fig. 5.
RNase L is a suppressor of proliferation and adhesion. (A) Scratch wound healing assay for WT and RNase L-KO HAP1 cells. (B) Quantitation of scratch wound healing in HAP1 and MEF cells. (C) Targeted qPCR of select down-regulated and up-regulated transcripts in WT and RNase L-KO HAP1 cells. (D) Time-dependent adhesion of HAP1 and MEF cells. (E) A schematic representation of transcriptional and posttranscriptional gene regulation by RLDD. Error bars show SE from three biological replicates. For wound healing assay, two different edge sections were used for each replicate quantification.
Fig. S6.
Inhibition of proliferation by RNase L overexpression. (A) HeLa cells were transfected with plasmids encoding WT and H672N mutant RNase L for 16 h. The 2–5A was transfected and cells were counted at several time points (Methods). (B) Quantification of the three replicates in A using ImageJ. The Left panel shows the time courses after 2–5A transfection. The Right panel includes the first 16 h of overexpressing WT or H672N RNase L. Error bars show SEs from three biological replicates. (C) Inhibition of MEF cell proliferation by overexpression of human RNase L, WT versus H672N. Experiments and quantifications were conducted as in A and B.
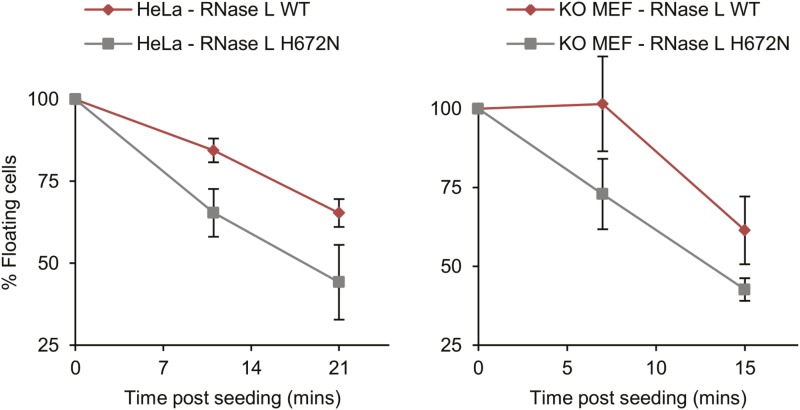
RNase L down-regulates transcripts involved in adhesion both posttranscriptionally (Fig. 3D, FDR = 0.000–0.002) and transcriptionally (Fig. 4D, FDR = 0.001–0.003). Quantitative PCR (qPCR) of select transcripts confirmed the RNA-seq results (Fig. 5C and Table S1). In HAP1 cells, the adhesion group is detected in poly-A+ and intron data, but not in Exons/(Introns + Exons) data, suggesting predominantly a transcriptional down-regulation. In agreement with the RNA-seq data, RNase L-KO HAP1 cells and MEFs adhere rapidly compared with WT cells (Fig. 5D). The inhibitory effect of RNase L on adhesion could be also observed using overexpression (Fig. S7). Our results indicate that RNase L is a functional inhibitor of cell proliferation and adhesion at least in the cell lines that we tested.
Table S1.
PCR primers used in this work
| Gene | Forward | Reverse |
| CDH1 | Hs.PT.58.45747629 (PrimeTime qPCR primer pair; exons 14 and 15) | |
| CDH9 | CAGAAGCCCTGATCCTTTCA | GCAGCAAACAACACGACTAAA |
| CTNND1 | TGCCTCTGCAGTCTCATTTC | CTCTCGGTCACTTCTCTTCTTTC |
| ESRG | GCTGCTAAGACTCTGTCCTTAC | GGTGCGAAGCTGTGTTTAATG |
| FAT4 | GTGGCCTTGATGTGCTTACTA | GGAAGACTTTCTCCACCATACC |
| FREM2 | CAGCCTGGATCTGATGGATTT | ACCTCGATTGGCATTGTCTT |
| FZD10 | AGTTACCCAAAGGGCTTATTGA | CTGGCACTGTGAAGAGAATACA |
| GAPDH | TGTAGTTGAGGTCAATGAAGGG | ACATCGCTCAGACACCATG |
| NR3C1 | GAAGGAAACTCCAGCCAGAA | ATGTTTGGAAGCAATAGTTAAGGAG |
| PCDH7 | CCCAGAGGACAACTATGAAAGG | TCAGGGCTACATCTGGAAGA |
| PCDH9 | AACTCTGATGGGCCTTTGG | CAGGAGGCATCCAGCAATTA |
| PCDHB5 | TTCGAGAGTGTCATGGACAAA | CAACACTTGGACAGCATGAAG |
| RNASEL | GGCCTTCTGAACATTCCAAAAG | TCCGGATGAACTTTAGCAGATC |
| FLAG-RNASEL | GGATTACAAGGATGACGACGATAAG | CCTTCTACCGCTGGAGGAC |
| TIAM1 | AGATTGTGTGCACTGAAGGG | GGAGACGGCATCAGAATCAA |
| ZEB1 | GCTTGTGATTTGTGTGACAAGATA | ATTCCACACTCATGAGGTCTTT |
Fig. S7.
Inhibition of adhesion in HeLa and MEF RNase L-KO cells by RNase L overexpression. HeLa and MEF cells were transfected with plasmids encoding WT and H672N mutant RNase L. After 24 h of adhesion, kinetics was measured using three biological replicates (Methods). Error bars show SEs.
SI Methods
Plasmids and Sequences.
Human RNase L was PCR-amplified to include an N-terminal FLAG tag (Sigma) and cloned into pcDNA4/TO (Life Technologies). DNA primers for site-directed mutagenesis were designed with BiochemLabSolutions ELN Lab Tools (biochemlabsolutions.com/ELN/ELN.html) and purchased from IDT (Integrated DNA Technologies) to create the H672N mutant. Plasmid sequences were verified by DNA sequencing.
Synthesis of 2–5A.
We synthesized 2–5A in buffer containing 20 mM Hepes pH 7.5, 50 mM NaCl, 30 mM MgCl2, 4 mM DTT, 10% (vol/vol) glycerol, 2 μM recombinant human OAS1, 1.25 OD260 poly-I:C, and 10 mM ATP. After incubation for 2 h at 30 °C, 2–5A (≥3 nt) was separated from the unreacted ATP, from the ppp-5′A-2′,5′-A dimer, and from other impurities by Mono-Q ion-exchange FPLC.
Tissue Culture.
All cell lines were grown using ATCC or provider-recommended conditions in MEM + 10% (vol/vol) FBS (HeLa), RPMI + 10% (vol/vol) FBS (T47D and WT and RNase L KO MEFs), or IMDM (Iscove's Modified Dulbecco's Medium) + 10% (vol/vol) FBS (WT and RNase L KO HAP1). All media were purchased from Gibco, Life Technologies. HeLa and T47D cells were a gift from the laboratory of Yibin Kang (Princeton University, Princeton), WT and RNase L KO MEFs were a gift from Robert Silverman (Lerner Research Institute, Cleveland Clinic, Cleveland), and the WT and RNase L clustered regularly interspaced short palindromic repeats (CRISPR) KO HAP1 cells were purchased from Haplogen GmbH. The CRISPR guide RNA sequence (ATAACGCAGTACAAATGAGC) used to generate the RNase L KO HAP1 cell line created a 13-bp deletion in exon 2 of human RNase L, causing a frame shift.
For RNase L overexpression, an 80%-confluent six-well plate of cells was transfected with 2 µg of WT or the H672N mutant plasmid using Lipofectamine 2000 reagent. Cells were harvested at 24 h, and 25% of the final volume was used for Western blot and the remainder for RNA extraction. For each RNase L KD, a combination of two DsiRNAs (Dicer-substrate RNAs)—100 nM f/c HSC.RNAI.N021133.12.1, which targets the CDS/exon 1, and 100 nM f/c HSC.RNAI.N021133.12.1, which targets the 3′-UTR/exon 6 of RNase L—was used. Commercial scrambled DsiRNAs (200 nM f/c) were used as negative control. All DsiRNAs were purchased from IDT and transfected for 36 h using Lipofectamine 2000 reagent. PBS or 1 µg/mL poly-I:C was transfected subsequently for 6 h. For rapid activation of RNase L in T47D cells, the cells were permeabilized with 0.05 mg/mL digitonin (Sigma) with or without 5 µM 5′-p-A2′,5′A2′,5′A2′,5′A for 1, 3, or 9 min. Cells were harvested in 500 μL of RLT (RNA light tris-hydroxymethyl-aminomethane) buffer (Qiagen) and stored at –80 °C until purification according to Qiagen protocol.
Adhesion and Proliferation.
For adhesion measurements, a suspension of naïve WT or RNase L KO cells was obtained from an adherent master plate using 0.25% trypsin + EDTA (Gibco, Life Technologies). These cells were then seeded at 70% confluence into six-well plates. Media (5% by volume) was withdrawn at t = 0 min and at the subsequent time points as noted. Live floating cells at each time point were counted using a hemocytometer. To reintroduce WT RNase L or the catalytically inactive mutant (H672N) into RNase L-KO MEFs or HeLa cells, an 80%-confluent six-well plate was transfected with 2 μg of the respective plasmids using Lipofectamine 2000 reagent (provider’s instructions) 36 h before starting the adhesion assay.
Wound healing measurements used confluent monolayers of WT or RNase L-KO HAP1 cells or MEF cells serum-starved for 12 h and scratched using a 2-mL pipette (Sigma). Cells were immediately placed in fresh media with 10% (vol/vol) serum, and media was changed every 12 h to remove floating/dead cells. Several markings were made on the plate to indicate current sections of the wound, and photographs were captured using 20× magnification at several time points. Wound sizes were measured in pixels using ImageJ (imagej.nih.gov/ij/).
Proliferation assay was conducted using HeLa cells overexpressing WT or catalytically inactive RNase L mutant H672N. A six-well plate was transfected with 2 μg per well of either plasmid using Lipofectamine 2000 reagent (provider’s instructions) for 16 h. At 16 h, 5 μM of 2–5A was transfected using 6 μL of Lipofectamine 2000 reagent per well. Media was changed after 5 h of each transfection, and pictures of the plate were taken using 20× magnification at several time points. Cell counts were obtained in ImageJ.
RNase L Cleavage Assay in HeLa Extracts.
Seven 10-cm dishes of HeLa cells were harvested by trypsinization at ∼80–90% confluence. Cells were washed with 2 × 10 mL cold PBS, and the cell pellet was frozen on dry ice and stored at –80 °C overnight. The cell pellet (∼100 μL) was resuspended in 200 μL phosphate buffer (15 mM sodium phosphate pH 7, 137.5 mM NaCl, 6.125 mM MgCl2, 1.25 mM β-mercaptoethanol, and 0.125% Triton X-100) and incubated for 10 min at 4 °C with gentle rotation. The crude lysate was centrifuged for 10 min at 10,000 × g, 4 °C, and the supernatant taken as S10 extract (A260 = 0.258). RNA cleavage assays were initiated by adding 16 μL of S10 to a tube containing 1 μL of 20 mM ATP, 2 μL of 1 μM RNase L or plain buffer (20 mM Hepes pH 7.5, 300 mM NaCl, 1 mM MgCl2, 10% (vol/vol) glycerol, 2 mM DTT), and 1 μL of 200 μM 5′-p-A2′,5′A2′,5′A2′,5′A. Reactions were incubated at 20 °C, and 4 μL of aliquots were placed at time intervals into 350 μL of RLT buffer (Qiagen). Samples were stored at –80 °C and purified using RNeasy kit (Qiagen).
RNA-Seq Experiments and Computational Analysis.
Total RNA was extracted (RNeasy kit, Qiagen). RNA integrity was verified by an RNA 6000 Nano Chip, using BioAnalyzer and 2100 Expert software (Agilent Technologies). The mRNA was enriched by oligo-dT pull-down from total RNA, followed by fragmentation, adapter ligation, PCR amplification, and finally sequencing on Illumina HiSEq. 2000 platform. For sequencing introns, the oligo-dT pull-down step was replaced with Ribo-Zero rRNA removal (Illumina). Sequencing reads were mapped to the human genome hg19 using TopHat 2 (48) set to map stranded reads with default parameters. Mapped read counts were obtained using HTseq-count run in union mode (49). The reads were normalized using ACTB1 and GAPDH housekeeping genes, and genes with at least 32 reads (unless stated otherwise) were included in the analysis. Our RNA-seq experiments typically identified ∼10,000–11,000 human transcripts with read counts above this cutoff. For browsing, RNA-seq data were visualized using the Integrative Genomics Viewer (Broad Institute) (50).
qPCR Analysis.
cDNA was prepared using random hexamers and a High Capacity RNA-to-cDNA Kit (Applied Biosystems). qPCR was performed using the Power SYBR green PCR mix in a 96-well format in the StepOnePlus qPCR machine as per the manufacturer’s instructions (Life Technologies). Transcript abundance was calculated using the delta-cT method. Primers (IDT) are listed in Table S1.
Western Blotting.
Cell pellets were lysed in sample buffer (NuPAGE), separated by 10% (vol/vol) BisTris PAGE (NuPAGE), and transferred to PVDF membranes (Life Technologies). Following a 1-h incubation with blocking buffer [5% (wt/vol) nonfat dry milk in Tris-Buffered Saline and Tween 20 (TBST)], the membranes were incubated with 1:2,000 mouse anti-FLAG M2 (Sigma) and rabbit anti-human β-actin (Abcam) primary antibodies at 4 °C overnight. The membranes were then washed and incubated with horseradish peroxidase-conjugated anti-mouse or anti-rabbit secondary antibodies (1:10,000, Jackson ImmunoResearch). The membranes were washed, blots were developed with ECL Western blotting detection reagents (GE Healthcare Life Sciences), and gels were exposed to X-ray film for visualization.
Signed P′ Analysis.
The procedure compares two lists. The first list (S) is smaller and contains signature genes. The second list (G) is larger and contains experimentally ranked dataset genes. The computational procedure first calculates probability p for a randomly chosen gene from G to belong to the signature set S. The approach counts common genes, #S∩G, and divides the result by the length of G: P = #S∩G/#G. Next, the list G is split in bins g0 ... gn. For each bin, the number of common genes with S is calculated: ki = #gi∩S; and the binomial probability for finding ki common genes among #gi total genes is computed: Pi = Pbinomial(p, #gi, ki). Next, random binomial probability PR is calculated, PR = Pbinomial(p, #gi, p · #gi). The PR value provides the baseline signal and is subtracted from Pi to give the baseline-corrected value P′i = Pi – PR. The |log10(P′i)| is used as the final magnitude of bin (i). If ki ≥ p · #gi, the result is given a positive sign (genes from S are enriched in bin gi); otherwise, a negative sign is given (genes from S are depleted in bin gi). C#.NET source code and a Windows binary file for signed P′ analysis are available from the authors.
Pattern Counting in mRNAs.
Sequences of mRNAs were obtained from RefSEq. (26). Simple pattern counting was conducted using regular expressions implemented in C#.NET. For each transcript, sums of patterns that match the regular expressions A, G, C, U, UU, UA, AUUUA, UAUAU, and so forth were calculated and used.
GSEA Analysis.
We used GSEA preranked enrichment analysis with GSEA v2.2.0. Transcripts were ranked according to increased read loss, without using other filter or biases. Analysis involved 1,000 random permutations, classic enrichment statistics, and five datasets of signatures: GSEA 4.0 (25), RK, RK with few and many UAUAU sites, microRNA TargetScan, and miR-200, miR-155, miR-192, miR-215, and miR-1 experimental (Dataset S2). Normalized enrichment scores (NES) were used as the magnitude of enrichments. FDR (or q-value) was used as a weighted measure of statistical significance. Significant discoveries in GSEA were expected at FDR ≤ 0.25 (25).
Error Analysis.
For experiments that involved repeated measurements, such as qPCR analysis, adhesion, and proliferation assays, SEs are from three biological replicates.
Discussion
We describe the transcriptome-wide program of mRNA cleavage by RNase L. Our approach identifies nontargets and direct targets shared by three human cell lines. The nontargets have few AUUUA/UAUAU motifs and include ribosomal and mitochondrial protein mRNAs, such as RPL8, RPL11, RPL12, RPL18, MRPL23, ATP5E, ATP5G1, BAX, COX5B, COX6A1, CYBA, NDUFB1, or NDUFB7 (Dataset S1). The targets have many AUUUA/UAUAU motifs and include membrane, extracellular, and zinc finger protein mRNAs, such as CTNND1, AR, BRCA1, PCDHB5, PCDHB7, AHR, ERBB3, FN1, TMEM154, SEMA6B, ADIPOR2, ZEB1, and ZNF260 (Fig. 5E). Among strongly cleaved targets are multiple mRNAs encoding secreted and membrane proteins, which must enter the ER lumen for folding and maturation. RLDD thus resembles RIDD (45), a program activated by misfolded proteins inside the ER lumen to establish a negative feedback loop mitigating the ER stress. However, RLDD is not coupled to the ER stress and is activated in response to innate immune cues.
RLDD-sensitive transcripts (S10+ signatures) contain ∼50–60 targets of each miR-17/miR-29/miR-200, whereas RLDD-resistant transcripts (S10– signatures) contain 3–4 targets of these microRNAs. The destabilization of common molecular targets coincides with similar biologic effects downstream of RLDD and microRNAs. Upstream, the regulation of RLDD differs from that of microRNAs and depends on the second messenger 2–5A, dsRNA, IFNs, and two phosphodiesterases AKAP7 and PDE12 (46). These effectors integrate RLDD into the innate immune system and could use the resulting effects on adhesion and proliferation to eliminate infected or damaged cells and control homeostasis. The action of RNase L could be mechanistically independent from that of microRNAs or be synergistic, if microRNA binding opens or blocks access of RNase L to target mRNAs. The model of cooperation between RNase L and microRNAs is indirectly supported by their simultaneous dependence on the mRNA-binding protein TTP (32, 47). Many of the identified cleaved transcripts encode proteins with known homeostatic and stress response functions, which could explain their destabilization by both microRNAs and RNase L.
Methods
Cell-Based Work.
Cells were grown using ATCC (American Type Culture Collection) or provider-recommended conditions in MEM + 10% (vol/vol) FBS (HeLa), RPMI + 10% (vol/vol) FBS (T47D and MEFs), or IMDM + 10% (vol/vol) FBS (HAP1). Recombinant human RNase L for RNA cleavage in extracts was purified as we described previously (18). We obtained 2–5A by chemical synthesis (ChemGenes) or in house (19).
RNA-Seq Experiments and Computational Analyses.
Total RNA samples were extracted (RNeasy kit, Qiagen), converted into libraries, and sequenced on Illumina HiSEq. 2000 platform. Sequencing reads were mapped to the hg19 human genome using TopHat 2 (48) and counted in HTseq-count (49). Signed P′ analyses and RNA pattern analyses were conducted using custom software described in SI Methods and using RefSeq database (26). GSEA analyses were conducted with GSEA v2.2.0 (25) using preranked procedure. RNA-seq data were visualized in Integrative Genomics Viewer (IGV) (50). A detailed description of the methods, procedures, and reagents is provided in SI Methods.
Error Analysis.
SEs were determined from three biological replicates.
Supplementary Material
Acknowledgments
We thank Prof. Yibin Kang (Princeton University) for providing HeLa and T47D cell lines, Prof. Robert Silverman (Cleveland Clinic) for the gift of WT and RNase L-KO MEFs, and Prof. Lynne Maquat (University of Rochester School of Medicine) for important suggestions. We acknowledge the staff of the Princeton University sequencing core facility for help with RNA-seq and Lance Parsons (Princeton University) for help with GSEA. We thank Prof. Elizabeth Gavis (Princeton University), Prof. Andrei Korostelev (RNA Therapeutics Institute), and members of the Korennykh laboratory for reading the manuscript and providing valuable comments. This study was funded by Princeton University, NIH Grant 5T32GM007388 (to S.R.), NIH Grant 1R01GM110161-01 (to A.K.), Sidney Kimmel Foundation Grant AWD1004002 (to A.K.), and Burroughs Wellcome Foundation Grant 1013579 (to A.K.).
Footnotes
The authors declare no conflict of interest.
This article is a PNAS Direct Submission.
Data deposition: The data reported in this paper have been deposited in the Gene Expression Omnibus (GEO) database, www.ncbi.nlm.nih.gov/geo (accession no. GSE75530).
This article contains supporting information online at www.pnas.org/lookup/suppl/doi:10.1073/pnas.1513034112/-/DCSupplemental.
References
- 1.Silverman RH. Viral encounters with 2′,5′-oligoadenylate synthetase and RNase L during the interferon antiviral response. J Virol. 2007;81(23):12720–12729. doi: 10.1128/JVI.01471-07. [DOI] [PMC free article] [PubMed] [Google Scholar]
- 2.Malathi K, Dong B, Gale M, Jr, Silverman RH. Small self-RNA generated by RNase L amplifies antiviral innate immunity. Nature. 2007;448(7155):816–819. doi: 10.1038/nature06042. [DOI] [PMC free article] [PubMed] [Google Scholar]
- 3.Li XL, et al. An essential role for the antiviral endoribonuclease, RNase-L, in antibacterial immunity. Proc Natl Acad Sci USA. 2008;105(52):20816–20821. doi: 10.1073/pnas.0807265105. [DOI] [PMC free article] [PubMed] [Google Scholar]
- 4.Al-Ahmadi W, Al-Haj L, Al-Mohanna FA, Silverman RH, Khabar KS. RNase L downmodulation of the RNA-binding protein, HuR, and cellular growth. Oncogene. 2009;28(15):1782–1791. doi: 10.1038/onc.2009.16. [DOI] [PMC free article] [PubMed] [Google Scholar]
- 5.Brennan-Laun SE, et al. RNase L attenuates mitogen-stimulated gene expression via transcriptional and post-transcriptional mechanisms to limit the proliferative response. J Biol Chem. 2014;289(48):33629–33643. doi: 10.1074/jbc.M114.589556. [DOI] [PMC free article] [PubMed] [Google Scholar]
- 6.Fabre O, et al. RNase L controls terminal adipocyte differentiation, lipids storage and insulin sensitivity via CHOP10 mRNA regulation. Cell Death Differ. 2012;19(9):1470–1481. doi: 10.1038/cdd.2012.23. [DOI] [PMC free article] [PubMed] [Google Scholar]
- 7.Zhou A, et al. Interferon action and apoptosis are defective in mice devoid of 2′,5′-oligoadenylate-dependent RNase L. EMBO J. 1997;16(21):6355–6363. doi: 10.1093/emboj/16.21.6355. [DOI] [PMC free article] [PubMed] [Google Scholar]
- 8.Cooper DA, Jha BK, Silverman RH, Hesselberth JR, Barton DJ. Ribonuclease L and metal-ion-independent endoribonuclease cleavage sites in host and viral RNAs. Nucleic Acids Res. 2014;42(8):5202–5216. doi: 10.1093/nar/gku118. [DOI] [PMC free article] [PubMed] [Google Scholar]
- 9.Chakrabarti A, et al. RNase L activates the NLRP3 inflammasome during viral infections. Cell Host Microbe. 2015;17(4):466–477. doi: 10.1016/j.chom.2015.02.010. [DOI] [PMC free article] [PubMed] [Google Scholar]
- 10.Malathi K, et al. A transcriptional signaling pathway in the IFN system mediated by 2′-5′-oligoadenylate activation of RNase L. Proc Natl Acad Sci USA. 2005;102(41):14533–14538. doi: 10.1073/pnas.0507551102. [DOI] [PMC free article] [PubMed] [Google Scholar]
- 11.Bisbal C, et al. The 2′-5′ oligoadenylate/RNase L/RNase L inhibitor pathway regulates both MyoD mRNA stability and muscle cell differentiation. Mol Cell Biol. 2000;20(14):4959–4969. doi: 10.1128/mcb.20.14.4959-4969.2000. [DOI] [PMC free article] [PubMed] [Google Scholar]
- 12.Li XL, et al. RNase-L-dependent destabilization of interferon-induced mRNAs. A role for the 2-5A system in attenuation of the interferon response. J Biol Chem. 2000;275(12):8880–8888. doi: 10.1074/jbc.275.12.8880. [DOI] [PubMed] [Google Scholar]
- 13.Khabar KS, et al. RNase L mediates transient control of the interferon response through modulation of the double-stranded RNA-dependent protein kinase PKR. J Biol Chem. 2003;278(22):20124–20132. doi: 10.1074/jbc.M208766200. [DOI] [PubMed] [Google Scholar]
- 14.Andersen JB, Mazan-Mamczarz K, Zhan M, Gorospe M, Hassel BA. Ribosomal protein mRNAs are primary targets of regulation in RNase-L-induced senescence. RNA Biol. 2009;6(3):305–315. doi: 10.4161/rna.6.3.8526. [DOI] [PMC free article] [PubMed] [Google Scholar]
- 15.Le Roy F, et al. The 2-5A/RNase L/RNase L inhibitor (RLI) [correction of (RNI)] pathway regulates mitochondrial mRNAs stability in interferon alpha-treated H9 cells. J Biol Chem. 2001;276(51):48473–48482. doi: 10.1074/jbc.M107482200. [DOI] [PubMed] [Google Scholar]
- 16.Chandrasekaran K, Mehrabian Z, Li XL, Hassel B. RNase-L regulates the stability of mitochondrial DNA-encoded mRNAs in mouse embryo fibroblasts. Biochem Biophys Res Commun. 2004;325(1):18–23. doi: 10.1016/j.bbrc.2004.10.016. [DOI] [PubMed] [Google Scholar]
- 17.Washenberger CL, et al. Hepatitis C virus RNA: Dinucleotide frequencies and cleavage by RNase L. Virus Res. 2007;130(1-2):85–95. doi: 10.1016/j.virusres.2007.05.020. [DOI] [PMC free article] [PubMed] [Google Scholar]
- 18.Han Y, et al. Structure of human RNase L reveals the basis for regulated RNA decay in the IFN response. Science. 2014;343(6176):1244–1248. doi: 10.1126/science.1249845. [DOI] [PMC free article] [PubMed] [Google Scholar]
- 19.Wreschner DH, McCauley JW, Skehel JJ, Kerr IM. Interferon action--Sequence specificity of the ppp(A2'p)nA-dependent ribonuclease. Nature. 1981;289(5796):414–417. doi: 10.1038/289414a0. [DOI] [PubMed] [Google Scholar]
- 20.Kimmig P, et al. The unfolded protein response in fission yeast modulates stability of select mRNAs to maintain protein homeostasis. eLife. 2012;1:e00048. doi: 10.7554/eLife.00048. [DOI] [PMC free article] [PubMed] [Google Scholar]
- 21.Aragón T, et al. Messenger RNA targeting to endoplasmic reticulum stress signalling sites. Nature. 2009;457(7230):736–740. doi: 10.1038/nature07641. [DOI] [PMC free article] [PubMed] [Google Scholar]
- 22.Brennan-Laun SE, Ezelle HJ, Li XL, Hassel BA. RNase-L control of cellular mRNAs: Roles in biologic functions and mechanisms of substrate targeting. J Interferon Cytokine Res. 2014;34(4):275–288. doi: 10.1089/jir.2013.0147. [DOI] [PMC free article] [PubMed] [Google Scholar]
- 23.Floyd-Smith G, Slattery E, Lengyel P. Interferon action: RNA cleavage pattern of a (2′-5′)oligoadenylate--dependent endonuclease. Science. 1981;212(4498):1030–1032. doi: 10.1126/science.6165080. [DOI] [PubMed] [Google Scholar]
- 24.Wang X, Tanaka Hall TM. Structural basis for recognition of AU-rich element RNA by the HuD protein. Nat Struct Biol. 2001;8(2):141–145. doi: 10.1038/84131. [DOI] [PubMed] [Google Scholar]
- 25.Subramanian A, et al. Gene set enrichment analysis: A knowledge-based approach for interpreting genome-wide expression profiles. Proc Natl Acad Sci USA. 2005;102(43):15545–15550. doi: 10.1073/pnas.0506580102. [DOI] [PMC free article] [PubMed] [Google Scholar]
- 26.Brown GR, et al. Gene: A gene-centered information resource at NCBI. Nucleic Acids Res. 2015;43(Database issue):D36–D42. doi: 10.1093/nar/gku1055. [DOI] [PMC free article] [PubMed] [Google Scholar]
- 27.Huang W, Sherman BT, Lempicki RA. Bioinformatics enrichment tools: Paths toward the comprehensive functional analysis of large gene lists. Nucleic Acids Res. 2009;37(1):1–13. doi: 10.1093/nar/gkn923. [DOI] [PMC free article] [PubMed] [Google Scholar]
- 28.Valastyan S, Weinberg RA. Roles for microRNAs in the regulation of cell adhesion molecules. J Cell Sci. 2011;124(Pt 7):999–1006. doi: 10.1242/jcs.081513. [DOI] [PMC free article] [PubMed] [Google Scholar]
- 29.Zaragosi LE, et al. Small RNA sequencing reveals miR-642a-3p as a novel adipocyte-specific microRNA and miR-30 as a key regulator of human adipogenesis. Genome Biol. 2011;12(7):R64. doi: 10.1186/gb-2011-12-7-r64. [DOI] [PMC free article] [PubMed] [Google Scholar]
- 30.Filios SR, et al. MicroRNA-200 is induced by thioredoxin-interacting protein and regulates Zeb1 protein signaling and beta cell apoptosis. J Biol Chem. 2014;289(52):36275–36283. doi: 10.1074/jbc.M114.592360. [DOI] [PMC free article] [PubMed] [Google Scholar]
- 31.Bracken CP, et al. Genome-wide identification of miR-200 targets reveals a regulatory network controlling cell invasion. EMBO J. 2014;33(18):2040–2056. doi: 10.15252/embj.201488641. [DOI] [PMC free article] [PubMed] [Google Scholar]
- 32.Al-Haj L, Blackshear PJ, Khabar KS. Regulation of p21/CIP1/WAF-1 mediated cell-cycle arrest by RNase L and tristetraprolin, and involvement of AU-rich elements. Nucleic Acids Res. 2012;40(16):7739–7752. doi: 10.1093/nar/gks545. [DOI] [PMC free article] [PubMed] [Google Scholar]
- 33.Madsen BE, et al. Germline mutation in RNASEL predicts increased risk of head and neck, uterine cervix and breast cancer. PLoS One. 2008;3(6):e2492. doi: 10.1371/journal.pone.0002492. [DOI] [PMC free article] [PubMed] [Google Scholar]
- 34.Salehzada T, et al. Endoribonuclease L (RNase L) regulates the myogenic and adipogenic potential of myogenic cells. PLoS One. 2009;4(10):e7563. doi: 10.1371/journal.pone.0007563. [DOI] [PMC free article] [PubMed] [Google Scholar]
- 35.Lewis BP, Burge CB, Bartel DP. Conserved seed pairing, often flanked by adenosines, indicates that thousands of human genes are microRNA targets. Cell. 2005;120(1):15–20. doi: 10.1016/j.cell.2004.12.035. [DOI] [PubMed] [Google Scholar]
- 36.Donovan J, Whitney G, Rath S, Korennykh A. Structural mechanism of sensing long dsRNA via a noncatalytic domain in human oligoadenylate synthetase 3. Proc Natl Acad Sci USA. 2015;112(13):3949–3954. doi: 10.1073/pnas.1419409112. [DOI] [PMC free article] [PubMed] [Google Scholar]
- 37.Han Y, Whitney G, Donovan J, Korennykh A. Innate immune messenger 2-5A tethers human RNase L into active high-order complexes. Cell Reports. 2012;2(4):902–913. doi: 10.1016/j.celrep.2012.09.004. [DOI] [PubMed] [Google Scholar]
- 38.Gao P, et al. Structure-function analysis of STING activation by c[G(2′,5′)pA(3′,5′)p] and targeting by antiviral DMXAA. Cell. 2013;154(4):748–762. doi: 10.1016/j.cell.2013.07.023. [DOI] [PMC free article] [PubMed] [Google Scholar]
- 39.Lim YW, et al. Metagenomics and metatranscriptomics: Windows on CF-associated viral and microbial communities. J Cyst Fibros. 2013;12(2):154–164. doi: 10.1016/j.jcf.2012.07.009. [DOI] [PMC free article] [PubMed] [Google Scholar]
- 40.Sun M, et al. Global analysis of eukaryotic mRNA degradation reveals Xrn1-dependent buffering of transcript levels. Mol Cell. 2013;52(1):52–62. doi: 10.1016/j.molcel.2013.09.010. [DOI] [PubMed] [Google Scholar]
- 41.Gerstberger S, Hafner M, Tuschl T. A census of human RNA-binding proteins. Nat Rev Genet. 2014;15(12):829–845. doi: 10.1038/nrg3813. [DOI] [PMC free article] [PubMed] [Google Scholar]
- 42.Wang Y, et al. Chemotherapy-induced miRNA-29c/catenin-δ signaling suppresses metastasis in gastric cancer. Cancer Res. 2015;75(7):1332–1344. doi: 10.1158/0008-5472.CAN-14-0787. [DOI] [PubMed] [Google Scholar]
- 43.Kong D, et al. miR-200 regulates PDGF-D-mediated epithelial-mesenchymal transition, adhesion, and invasion of prostate cancer cells. Stem Cells. 2009;27(8):1712–1721. doi: 10.1002/stem.101. [DOI] [PMC free article] [PubMed] [Google Scholar]
- 44.Meng X, et al. Knockdown of BAG3 induces epithelial-mesenchymal transition in thyroid cancer cells through ZEB1 activation. Cell Death Dis. 2014;5:e1092. doi: 10.1038/cddis.2014.32. [DOI] [PMC free article] [PubMed] [Google Scholar]
- 45.Hollien J, et al. Regulated Ire1-dependent decay of messenger RNAs in mammalian cells. J Cell Biol. 2009;186(3):323–331. doi: 10.1083/jcb.200903014. [DOI] [PMC free article] [PubMed] [Google Scholar]
- 46.Gusho E, et al. Murine AKAP7 has a 2′,5′-phosphodiesterase domain that can complement an inactive murine coronavirus ns2 gene. MBio. 2014;5(4):e01312–e01314. doi: 10.1128/mBio.01312-14. [DOI] [PMC free article] [PubMed] [Google Scholar]
- 47.Jing Q, et al. Involvement of microRNA in AU-rich element-mediated mRNA instability. Cell. 2005;120(5):623–634. doi: 10.1016/j.cell.2004.12.038. [DOI] [PubMed] [Google Scholar]
- 48.Kim D, et al. TopHat2: Accurate alignment of transcriptomes in the presence of insertions, deletions and gene fusions. Genome Biol. 2013;14(4):R36. doi: 10.1186/gb-2013-14-4-r36. [DOI] [PMC free article] [PubMed] [Google Scholar]
- 49.Anders S, Pyl PT, Huber W. HTSeq--A Python framework to work with high-throughput sequencing data. Bioinformatics. 2015;31(2):166–169. doi: 10.1093/bioinformatics/btu638. [DOI] [PMC free article] [PubMed] [Google Scholar]
- 50.Robinson JT, et al. Integrative genomics viewer. Nat Biotechnol. 2011;29(1):24–26. doi: 10.1038/nbt.1754. [DOI] [PMC free article] [PubMed] [Google Scholar]
Associated Data
This section collects any data citations, data availability statements, or supplementary materials included in this article.


