Significance
Making social decisions requires evaluation of benefits and costs to self and others. Long associated with emotion and vigilance, neurons in primate amygdala also signal reward and punishment as well as information about the faces and eyes of others. Here we show that neurons in the basolateral amygdala signal the value of rewards for self and others when monkeys make social decisions. These value-mirroring neurons reflected monkeys’ tendency to make prosocial decisions on a momentary as well as long-term basis. We also found that delivering the social peptide oxytocin into basolateral amygdala enhances both prosocial tendencies and attention to the recipients of prosocial decisions. Our findings endorse the amygdala as a critical neural nexus regulating social decisions.
Keywords: amygdala, social decision, value mirroring, oxytocin, hierarchical modeling
Abstract
Social decisions require evaluation of costs and benefits to oneself and others. Long associated with emotion and vigilance, the amygdala has recently been implicated in both decision-making and social behavior. The amygdala signals reward and punishment, as well as facial expressions and the gaze of others. Amygdala damage impairs social interactions, and the social neuropeptide oxytocin (OT) influences human social decisions, in part, by altering amygdala function. Here we show in monkeys playing a modified dictator game, in which one individual can donate or withhold rewards from another, that basolateral amygdala (BLA) neurons signaled social preferences both across trials and across days. BLA neurons mirrored the value of rewards delivered to self and others when monkeys were free to choose but not when the computer made choices for them. We also found that focal infusion of OT unilaterally into BLA weakly but significantly increased both the frequency of prosocial decisions and attention to recipients for context-specific prosocial decisions, endorsing the hypothesis that OT regulates social behavior, in part, via amygdala neuromodulation. Our findings demonstrate both neurophysiological and neuroendocrinological connections between primate amygdala and social decisions.
How we treat others impacts not only their well-being but our own. Human society depends on cooperation, charity, and altruism, as well as institutions to regulate selfish biases. In humans, these behaviors involve perspective-taking, empathy, and theory of mind (1, 2), and the rudiments of these capacities appear to mediate complex social behavior in animals (3). Recent research has sketched a rough outline of the neural circuits that contribute to complex social behavior (4, 5). These comprise a set of domain-general brain areas, including the ventromedial prefrontal cortex and ventral striatum, that process information about reward and punishment and contribute to decision-making, and a set of specialized areas, including the temporoparietal junction and medial prefrontal cortex, that process specifically social information (4, 6). How social and nonsocial signals in these circuits are integrated to mediate decisions with respect to others remains imperfectly understood, in part, due to the indirect nature of hemodynamic signals measured in human neuroimaging experiments that constitute the bulk of this research. Recent advances in the development of neurophysiological and neuropharmacological models of social decision-making, however, permit more direct inquiry into the neural mechanisms mediating other-regarding behavior (7–11).
The amygdala, especially the basolateral division (BLA), has been implicated in both decision-making and social perception, inviting the possibility that it contributes to decision-making with respect to others (12–17). This set of nuclei is well known for contributions to emotional experience and expression, especially fear. More recent studies demonstrate activity in BLA tracks the value of rewards and punishments (18), predicts risky financial decisions (19), reflects internal motivational goals (20), and correlates with vigilance and attention (21). BLA also signals social information, such as facial expressions and the direction of gaze, and has been implicated in theory of mind and emotional empathy (22–26). Notably, oxytocin (OT), a neurohypophysial hormone that modulates many social behaviors (27), appears to do so via the amygdala in humans and nonhuman primates (28–30). Intranasal OT reliably modulates hemodynamic activity in the amygdala in healthy humans (28, 29, 31), children with autism (32), and rhesus macaques (30). These changes in amygdala activity are related to social cognition. These observations invite the hypothesis that BLA directly mediates decision-making with respect to others (24). How neurons in BLA respond during social decisions, however, remains unknown.
Here, we examine this hypothesis using a modified dictator game, which we previously used to probe social information signaling by neurons in the anterior cingulate and orbitofrontal cortices (7) and the impact of inhaling OT on social decision-making (33). We previously reported that the preference to allocate reward to the other monkey is enhanced by greater familiarity between the two animals, and is abolished if the recipient is replaced with a juice collection bottle (34). We also reported that reward withholding is reduced when actor monkeys are dominant toward recipients, and the variability and the degree of preferences often depend on the identity of the recipients (34). We show, to our knowledge for the first time, that BLA neurons respond during social decisions, these responses signal the value of rewards chosen for self and others using a similar coding scheme, and these signals are correlated with social preferences. We further show that unilateral infusion of OT into BLA increases both the frequency of prosocial decisions and attention paid to the recipients of prosocial decisions. Together, these findings directly implicate the amygdala in social decision-making and constrain models of its computational role in the decision process.
Results
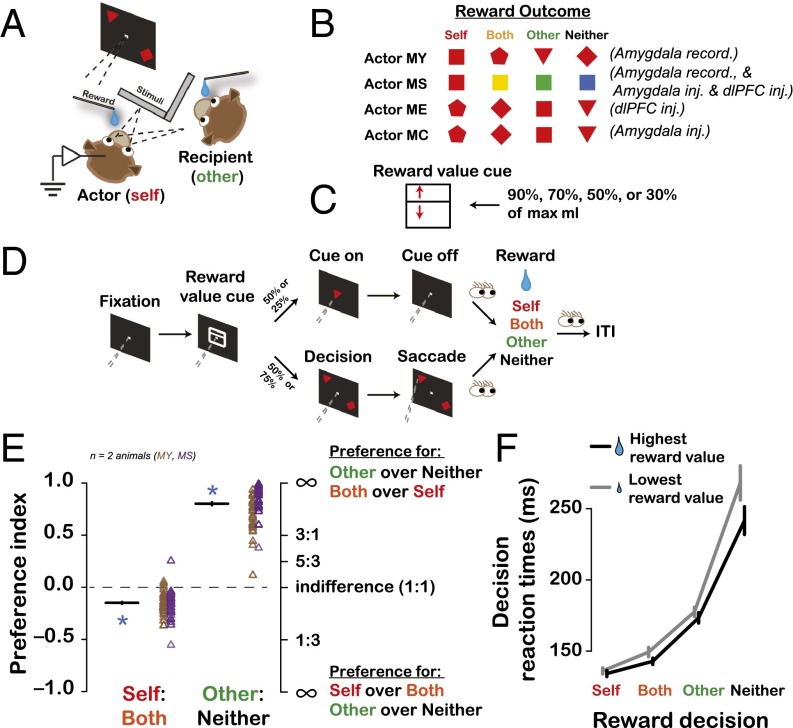
To test the role of the primate amygdala in decision-making with respect to others, we recorded extracellular activity from 150 BLA neurons while rhesus macaques (Macaca mulatta) made decisions resulting in juice rewards to self, a recipient monkey present in the same room, both animals, or neither (7, 33, 34) (Fig. 1 A–D).
Fig. 1.
Experimental setup and behavior. (A) Experimental setup. (B) Stimulus–reward outcome mappings for reward delivered to actor (Self), recipient (Other), both (Both), or no one (Neither). (C) Reward value cue used to indicate juice amount at stake for each trial (D). The position of the horizontal bisecting line (red arrow) specified one of the four percentages of maximum reward. (D) Task structure for decision and cued trials. Dashed gray lines show the angle of the actor’s gaze. Eye cartoons indicate times at which the actor could look around without any task demand. ITI, intertrial interval. (E) Behavioral preferences index [mean (horizontal lines) ± SEM (vertical lines) across two actor animals] as a function of reward outcome contrasts. Data points show the biases for individual sessions separately color-coded for MY and MS. The actors strongly preferred Other over Neither decision, but preferred Self over Both decision (asterisks; both P < 0.0001, one-sample t test, n = 150). MY and MS showed a comparable antisocial preference in the Self vs. Both trials (P = 0.34, t test), whereas MS showed stronger prosocial preference in the Other vs. Neither trials (P < 0.0001). (F) Decision RTs (mean of session medians ± SEM) differed across decision types [F(3,1052) = 175.95, P < 0.0001] and reward value [highest vs. lowest, F(1,1052) = 5.79, P = 0.02].
Summary of Behavior.
Prosocial behavior is defined as voluntary behavior that benefits another individual, and includes helping, sharing, donating, and cooperation (35–37). Consistent with prior studies (7, 33, 34), monkeys strongly preferred to deliver rewards to the recipient (Other) over no one (Neither), a prosocial preference (Fig. 1E; Fig. S1). By contrast, monkeys preferred to deliver rewards to themselves (Self) over both themselves and the recipient (Both), possibly reflecting the tendency for monkeys to compete for fluids in the home colony (7, 33, 34). Preference for Self over Both but Other over Neither militates against the possibility that actors’ choices merely reflect the visual and auditory salience of another monkey drinking juice. Our prior findings that actors are more prosocial toward both more familiar and socially subordinate recipients (34), as in humans (38), and show no preferences when the recipient is replaced by a juice collection bottle, validates our task as an assay of social decision-making. Actors often looked at the recipient after making a decision (Fig. S2), consistent with vicarious reinforcement (34), a process mediating empathy (39). Actors looked at the recipient more often after delivering higher-value rewards compared with lower-value rewards (Fig. S2). Finally, decision reaction times (RTs) varied with both who was chosen to receive the reward and its magnitude (Fig. 1F).
Fig. S1.
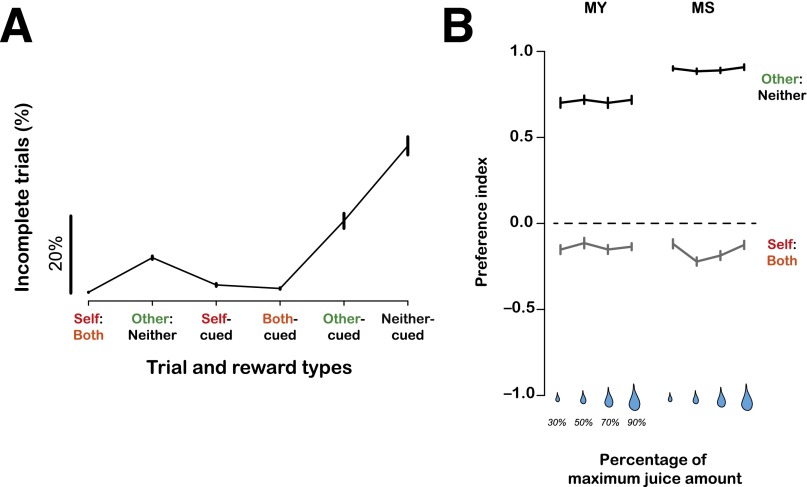
Behavioral performance and stability of social preferences. (A) Percentages of incomplete trials (mean ± SEM) during the social reward–allocation task. Shown are aborted (incomplete) trials across all trial types. A trial was considered incomplete if the animals failed to choose a target on decision trials or failed to initiate or maintain fixation after cue onset on cued trials. Such trials were not included in the main analysis. (B) Stable behavioral preference indices across different reward values at stake. Preference indices are plotted as a function of four different juice sizes (% of max possible on a given session) for actor MY and MS.
Fig. S2.
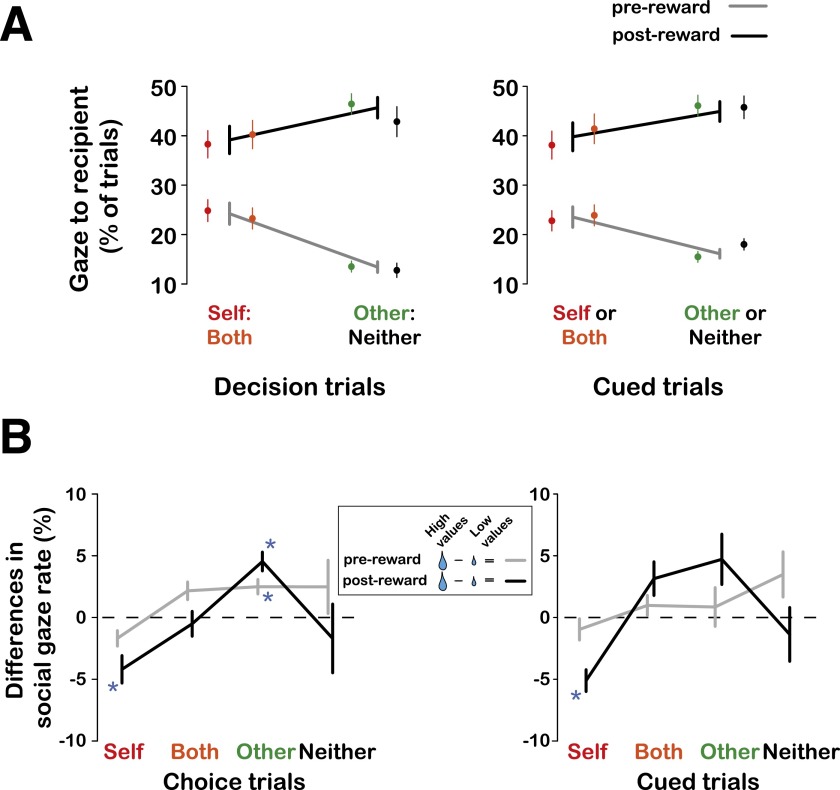
Overall social gaze behavior. (A) Shown are the proportions of social gaze (mean ± SEM) calculated before reward delivery (gray) and following reward onset (black) for decision trials (Left) and cued trials (Right) for Self:Both and Other:Neither contexts. Also shown are the data points separately for each decision (in corresponding colors as the x-axis label). Two-way ANOVA with decision context (Self:Both, Other:Neither) and epoch (prereward, postreward epoch) as factors (combined across decision and cued trial types) showed a significant main effect of the epoch [F(1,596) = 123.17, P < 0.0001] and a significant interaction of context and epoch [F(1,596) = 16.63, P < 0.0001]. Therefore, the extent of social gaze varied as a function of the reward context and the period with respect to the reward delivery. (B) Differences in gaze shifts (mean ± SEM) directed toward the recipient on high (70%, 90% of max) compared with low (30%, 50%) reward value trials, separately for the gaze shifts prereward and postreward. Asterisks show significant differences from zero (P < Bonferroni-corrected α at 0.05, one-sample t test).
Value-Mirroring by BLA Neurons.
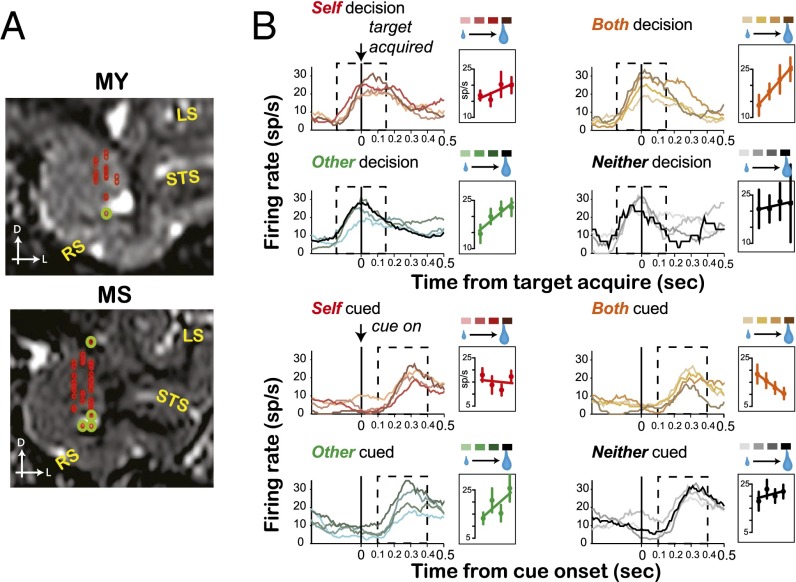
We explored how BLA neurons encode the value of rewards for another individual compared with how they encode the value of rewards for oneself (Fig. 2A). Fig. 2B shows an example neuron with activity aligned to the time of decision. This neuron increased firing when the actor monkey made a decision in all contexts. Surprisingly, when we separated neuronal activity by reward value, we found a key difference between conditions in which a live agent was chosen as the recipient of reward (Self, Other, Both) and those in which no live agent received a reward (Neither). Mean firing rates scaled positively with reward value similarly across Self, Both, and Other decisions (all P < 0.03, bootstrap test) but not for Neither decisions (P = 0.27). By contrast, we did not observe common reward tuning on cued trials, when actors could not choose whom to reward (Fig. 2B). Notably, this neuron showed different value tuning profiles in decision and cued trials (compare in Fig. 2B, Upper and Lower), suggesting that value coding depends on whether the monkey uses the information to guide action.
Fig. 2.
Neuronal activity in BLA. (A) Recording sites from MY and MS projected onto representative slices (n = 75 each from MY and MS). The locations with green circles show the locations that appear outside of BLA on these representative slices. (B, Upper) Peristimulus time histograms (PSTHs) of the neuronal activity (sp/s) of a single BLA neuron aligned to target acquire. (Lower) PSTHs of the same neuron on cued trials, aligned on the time of cue onset. On cued trials, the reward value scaling was not grouped by whether a live agent received the reward or not (only significant for Both-cued and Other-cued activity and in opposite directions; both P < 0.02).
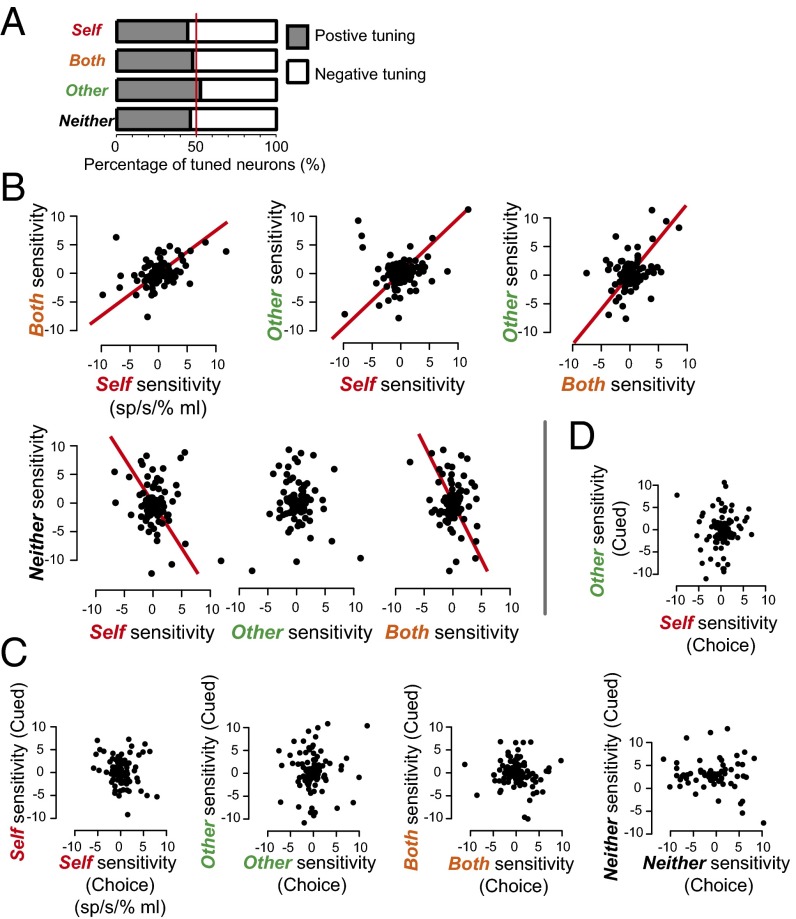
To quantify how BLA neurons encode reward value for self and others, we used a GLM with reward value (30%, 50%, 70%, and 90%) and trial type (decision and cued) for trials resulting in Self, Both, Other, or Neither reward outcomes. Across all 150 cells, 18% of neurons showed significant (P < 0.05, permutation test) value tuning for Self, 25% for Other, 16% for Both, and 18% for Neither rewards. The percentages of neurons showing either positive or negative tuning were comparable across all reward types (all comparisons, P > 0.09, single-sample proportion test; Fig. 3A), similar to what has been reported previously in BLA (40). We found significant correlations for reward sensitivities (β) between Self reward and Both reward (r = 0.36, P < 0.001, Pearson’s correlation; Fig. 3B), which is perhaps not surprising given that the actor monkey received a reward in both conditions. Remarkably, reward value sensitivities for Self and Other (r = 0.22, P = 0.01) and for Other and Both were also strongly and positively correlated with one another (r = 0.38, P < 0.001; Fig. 3B), despite the fact that actors received rewards following Self or Both decisions but not following Other decisions. There were also significant but negative correlations between Self and Neither reward value sensitivities (r = −0.21, P = 0.02) and Both and Neither reward value sensitivities (r = −0.21, P = 0.029), potentially reflecting an opponent coding scheme for received (Self and Both) and discarded (Neither) rewards. Other and Neither reward value sensitivities were not correlated (r = −0.06, P = 0.55), despite the fact that these outcomes were both associated with the actor receiving no reward.
Fig. 3.
The population of BLA neurons commonly signals the values associated with rewards chosen for self and others. (A) Proportions of BLA neurons that are either positively or negatively tuned to increasing reward values collapsed across decision contexts. (B) Reward value sensitivities (changes in the firing rates per changes in the proportion of juice amounts at stake; sp/s/% max mL) are plotted for different reward outcomes. (C) Reward value sensitivities are plotted for decision and cued trials within each reward outcome separately for decision and cued trials. In both B and C, the solid red lines through the data points show significant linear regressions in each monkey. (D) Reward value sensitivities for Self decision trials are plotted against those for Other cued trials (same format as in B and C).
Correlated reward value coding may be driven simply by the salience of juice delivery itself. However, we found no correlations for value tuning between decision trials and cued trials for any of the reward outcomes, an operational control for the salience of observable visual and auditory consequences of juice delivery to the actor, recipient, or both monkeys (all r < 0.15, P > 0.12, Pearson’s correlation; Fig. 3C). Likewise, none of the correlations were significant during the cue offset epoch on cued trials (i.e., an analogous epoch to the target acquisition epoch on decision trials; Fig. S3). We next tested whether value- mirroring is specific to decisions by examining the correlation between value sensitivities on Self decision and Other cued trials (Fig. 3C). Value sensitivities were correlated on Self decision and Other decision trials (statistics above; Fig. 3B) but not on Self decision and Other cued trials (r = 0.09, P = 0.36; Fig. 3D). The specificity of value mirroring for decision trials (also see the single neuron example in Fig. 2B) further militates against the notion that common value representations in BLA are entirely driven by the salience of reward delivery itself or sensory feedback from juice consumption by the actor or recipient. Instead, our findings indicate that value mirroring in BLA requires motivation and active task engagement associated with making decisions.
Fig. S3.
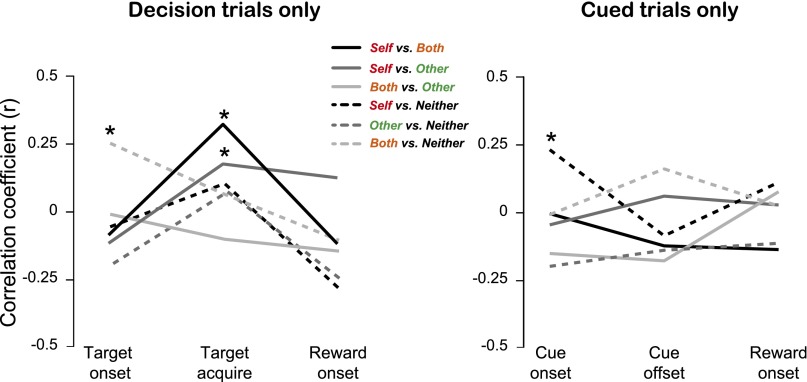
Value correlations across different task epochs based on GLM ran separately for decision and cued trials. In the case of decision trials, significant correlations emerged between Self and Both reward outcomes (r = 0.32, P < 0.001) and Self and Other reward outcomes (r = 0.05, P = 0.05) during the epoch centered on target acquisition, as well as between Both and Neither reward outcomes during the epoch centered on target onset (r = 0.26, P = 0.04, Pearson’s correlation). For cued trials, we observed a significant correlation between reward-value sensitivities for Self and Neither reward outcomes during the epoch centered on cue onset (r = 0.23, P = 0.03), but no correlations emerged during the epoch centered on cue offset. For both decision and cued trials, value sensitivities for each reward outcome were not correlated during the epoch centered on reward onset.
To examine the time course of correlations between value sensitivities for different reward outcomes, we performed an additional GLM from different epochs within a trial, separately for each trial type (Fig. S3). The target acquisition epoch reflected value mirroring more clearly than other epochs. Value-mirroring signals in BLA thus occur on a time scale consistent with the process of commitment to a decision or forecasting its outcome.
If BLA contributes to social decisions by computing reward values for self and others using a common coding scheme, then BLA activity should be correlated with prosocial decisions. We constructed a running logistic regression over time based on spike counts to see whether we could detect whether monkeys would make or made prosocial decisions (Both or Other) combined across the two decision contexts (Materials and Methods). At target onset, the relationship between spiking activity and the likelihood of making a prosocial decision remained at chance (Fig. 4A). By contrast, from the time immediately following the decision to well after the delivery of reward, the activity of more neurons than would be predicted by chance signaled the likelihood of making a prosocial decision (P < 0.001, single-sample proportion test; Fig. 4A). These analyses show that a subset of BLA neurons with value-mirroring activity signal prosocial decisions on a local time scale. However, when we repeated the same analysis for each context separately, the proportion of neurons with significant correlations did not reach significance for either context for any period, possibly due to insufficient statistical power.
Fig. 4.
Neuronal activity in BLA is correlated with social decisions. (A) Time course of decision signaling, with activity separately aligned to the onset of targets (Left), the acquisition of a choice target (Center), and the onset of reward (Right). Results stem from a sliding-window logistic regression against the type of decision for that trial. Prosocial decisions were those resulting in Other or Both rewards, and antisocial decisions were those resulting in Self or Neither rewards. Plotted are the percent of neurons for which the decision term in the regression reached statistical significance for each 400-ms window centered on the time point indicated in the abscissa. (B) The relationship between the behavioral preference indices and the neuronal preference indices. Each data point represents the neuronal preference index of a neuron and the behavioral preference index from the session in which the neuronal data were collected. Shown are the two high reward value conditions (70%, 90% of max mL) for Self:Both (Left) and Other:Neither (Right) decisions. Data points that lie precisely at the extremities (−1 and 1) are jittered for the display. Outcomes of a linear regression are indicated on the plots.
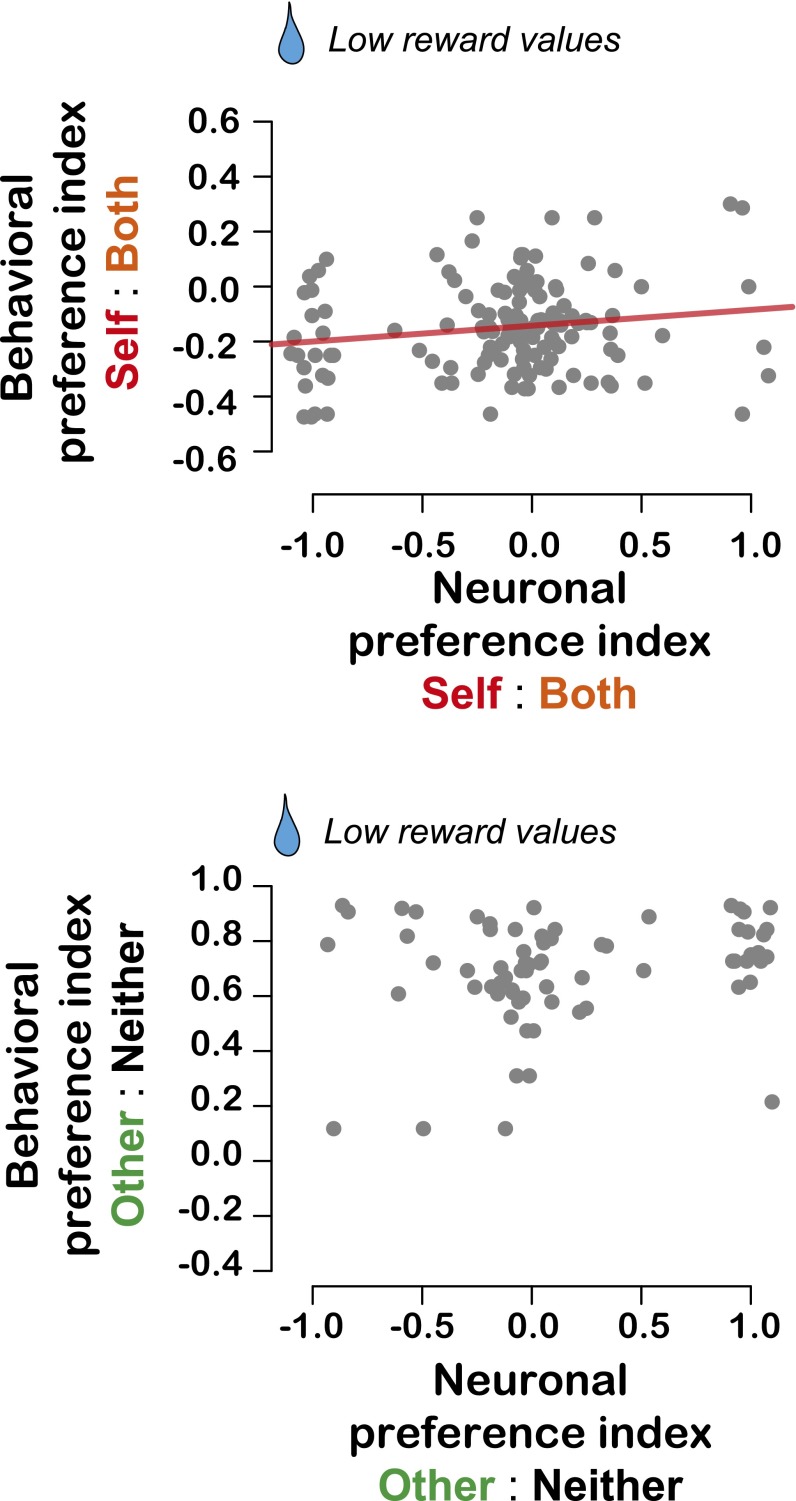
To test whether BLA signals were also correlated with longer-term social preferences, we examined the relationship between session-to-session decision indices and similar indices constructed from neuronal firing rates across sessions (Materials and Methods). We found that BLA neuron activity was significantly, albeit weakly, correlated with prosocial tendencies for Self and Both decisions at all reward values (high value: r = 0.18, P = 0.04; low value: r = 0.17, P = 0.04, Pearson’s correlation; Fig. 4B; Fig. S4) as well as for Other and Neither decisions at high reward values (r = 0.29, P = 0.01; Fig. 4B) but not low-reward values (r = 0.19, P = 0.12; Fig. S4). Thus, neuronal activity in a subset of BLA neurons (more in Figs. S5 and S6) is correlated with social decisions at both short and long timescales.
Fig. S4.
Relationships between neuronal preference indices and behavioral preference indices for the lower reward values (30% and 50% of max mL) for Self:Both (Upper) and Other:Neither (Lower) decisions. Data points lying precisely at the extremities (−1 and 1) are jittered for display. We found a weak but significant relationship for predicting prosocial decisions in the Self:Both context for the low reward values (P = 0.04, r = 0.17, linear regression). However, we did not observe any relationships for the low reward values in the Other:Neither context (P = 0.12, r = 0.19).
Fig. S5.
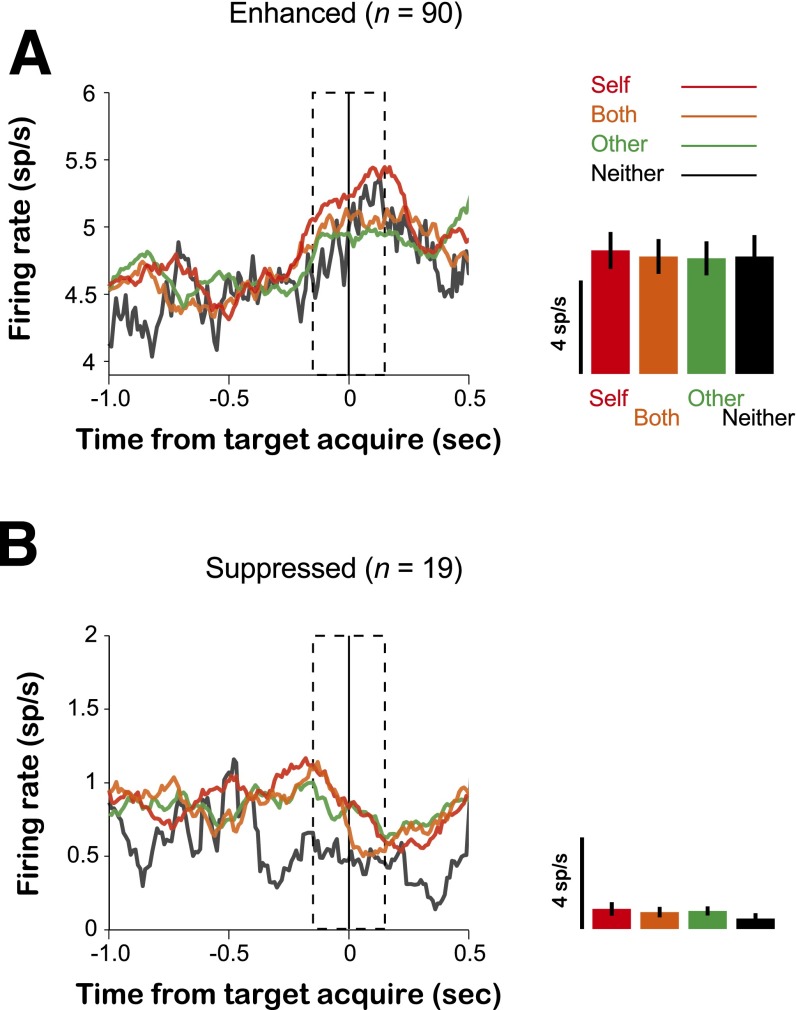
Population-averaged PSTHs are shown separately for the neurons that (A) enhanced (n = 90) and (B) suppressed (n = 19) firing rates around the time of each decision. We classified firing-rate modulations as enhanced if the changes in mean firing rates around the time of each decision exceeded at least 2× SEM relative to the 300-ms interval leading up the first fixation (baseline epoch). Similarly, we classified firing-rate modulations as suppressed if the changes in mean firing rates around the time of each decision diminished at least 2× SEM relative to the baseline. The dotted regions in the PSTHs indicate the epoch used to calculate firing rates around the time of decision. Bar graphs (Right) show the mean and SEM from these intervals. Red traces and bars: Self decision; orange: Both decision; green: Other decision; and black: Neither decision.
Fig. S6.
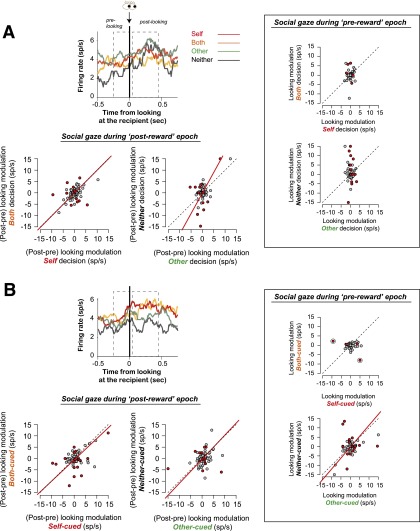
Neuronal activity around the time of social gaze directed to the face region of the recipient following reward delivery. We examined BLA neuron activity when monkeys looked at the recipient monkey by comparing the modulation due to social gaze based on the difference between the activity just before looking and the activity following the time of looking. For the postreward epoch, we isolated looking-specific activity by subtracting the activity leading up to the time of gaze detection from the activity immediately following the social gaze. Overall, the modulation associated with looking behavior was well correlated between prosocial and antisocial decisions in each context (A) (Self:Both, P < 0.0001, r = 0.42; Other:Neither, P < 0.0001, r = 0.52; Pearson’s correlation). We found a similar pattern for cued trials (B) (both P < 0.0001, P < 0.005, r = 0.40, r = 0.25, respectively). Overall, 33% of BLA neurons showed a significant difference in gaze-related modulations across different reward outcomes and trial types (red data points; P < 0.05 by bootstrap test). By contrast, when we examined activity related to social gaze during the prereward epoch (i.e., after the decision but before the reward), we did not observe these correlations (A, Right Insets) (Self:Both, P = 0.58, r = 0.06; Other:Neither, P = 0.18, r = –0.16; Pearson’s correlation). On cued trials during the prereward epoch (i.e., after the cue offset but before the reward) (B, Right Insets), the activity associated with Both cued and Self cued was not correlated (P = 0.10, r = 0.18; the two circled data points were excluded from the statistics because they entirely drove the correlation), but the activity associated with Other cued and Neither cued was correlated (P < 0.005, r = 0.30, Pearson’s correlation). During the prereward epoch, overall 25% showed a significant difference in the gaze-related modulations across different reward outcomes and trial types (red data points; P < 0.05 by bootstrap test).
To properly move from characterization of individual neurons to population inferences, we make use of a hierarchical Bayesian approach. Hierarchical models have the advantage of “borrowing” statistical strength across units, both regularizing fits in cases of limited data and leading to robust inferences of population statistics. Moreover, by treating both population and individual variability within a single Bayesian model, we avoid problems with multiple comparisons and a proliferation of models fit to subsets of the data. Our modeling results recapitulate and strengthen our findings, endorsing the same conclusions made from characterizing individual neurons more directly (Figs. S7–S9).
Fig. S7.
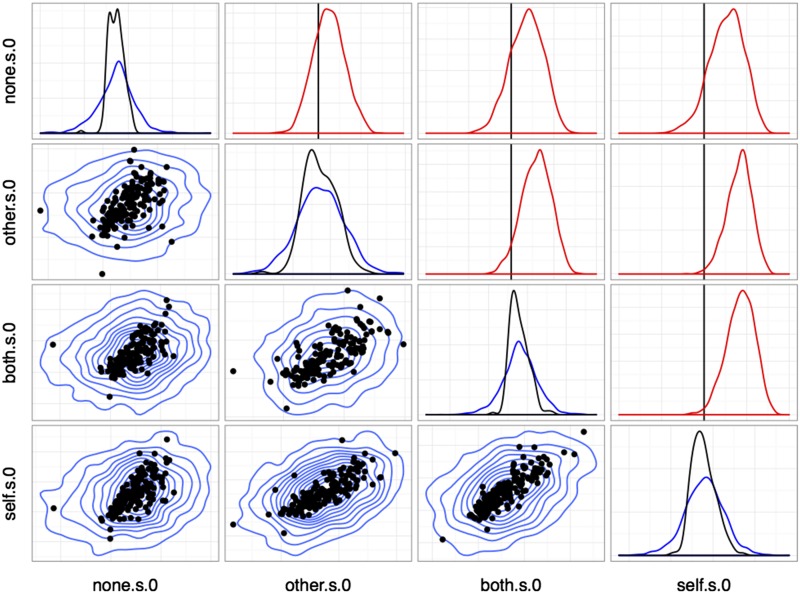
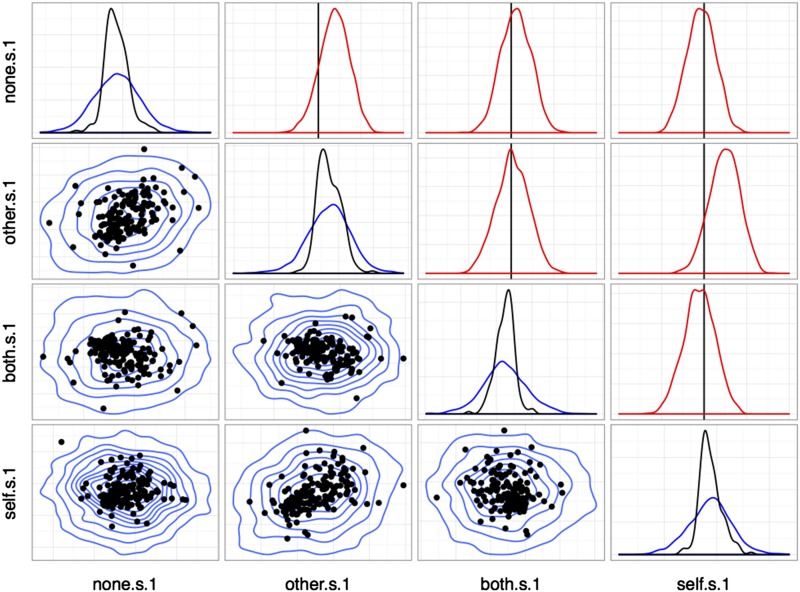
Correlations between reward sensitivities to distinct outcomes (choice). Plots in the lower triangle show point estimates for individual units (medians; black) and population posterior densities (blue) for pairs of regression effects. Diagonal plots show marginal densities for unit point estimates (black) and population (blue). Plots in the upper triangle show posterior densities for elements of the population correlation matrix between variables (red). The vertical line (black) marks correlation coefficient 0. Variable names take the form <outcome>[.s].<cue> with <outcome> the reward type, .s indicating a sensitivity parameter, and <cued ≥ 0 for choice trials and 1 for cued trials.
Fig. S9.
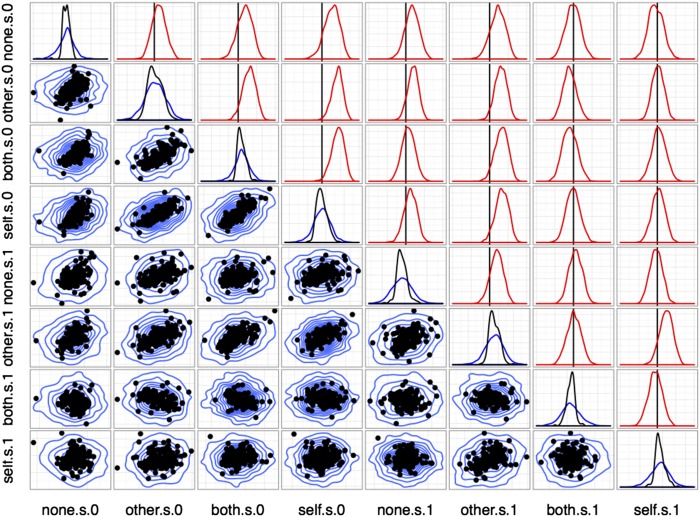
Correlations between sensitivities (all trial types). Conventions as in Fig. S7.
Unilateral OT Infusion into BLA Increases Prosocial Decisions.
OT is a well-known modulator of social behavior, and several imaging studies in humans and monkeys have implicated the amygdala in this process (28–31, 41–45). Inhaled OT increases OT concentration in the central nervous system and enhances both prosocial preferences and social attention in rhesus macaques (33). Recently, it has been demonstrated that OT administration modulates hemodynamic activity in the amygdala in rhesus macaques (30), and it has been hypothesized that the primate amygdala may express presynaptic OT receptors (46). If reward value-mirroring by the amygdala is critical for prosocial behavior, we reasoned that directly increasing OT levels in the amygdala would increase the likelihood that monkeys would make prosocial decisions.
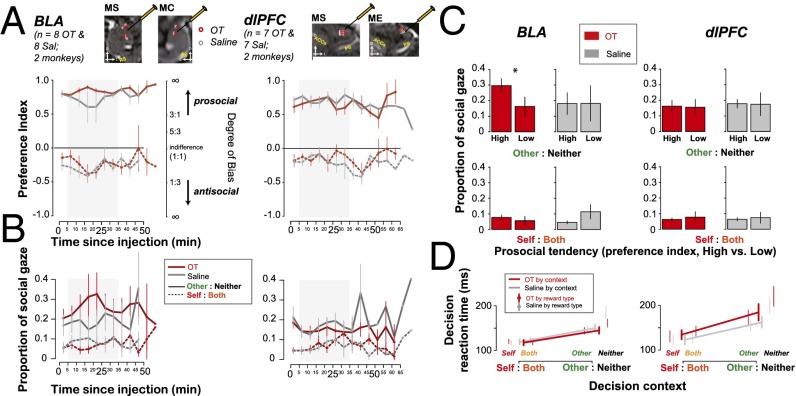
To test this hypothesis, we focally and unilaterally injected OT (2 μL, 5 ng/nL) or saline (2 μL, vehicle) into locations in BLA where we had observed value-mirroring activity (Materials and Methods and Fig. 5). As a control, we focally injected OT or saline into the dorsolateral prefrontal cortex (dlPFC) (Fig. 5), a cortical area in which OT receptors have not been localized in macaques. Relative to vehicle, OT infusion into BLA, but not dlPFC, increased the frequency of prosocial decisions [treatment: BLA, F(1,24) = 4.44, P < 0.05; dlPFC, F(1,20) = 0.01, P = 0.92]. Because the effects of OT injection into BLA were mainly observed in the first half of the session (median ± SD trial duration: 54 ± 12 min; Fig. 5A), we focus on the 30-min time window beginning 5 min into the completion of each injection hereafter [first 30 min: BLA, F(1,24) = 4.77, P = 0.04 vs. after 30 min: F(1,24) = 0.02, P = 0.88; dlPFC, F(1,20) = 0.01, P = 0.93 vs. F(1,18) = 0.43, P = 0.52]. Crucially, there was no interaction between treatment and monkey [treatment × subject: F(1,24) = 1.61, P = 0.22], although we did not have enough power to detect significance in each monkey separately [four sessions each; treatment: MS: F(1,12) = 4.08, P = 0.07; MC: F(1,12) = 0.78, P = 0.40]. We did not see any significant changes in prosocial decision-making following OT injections into dlPFC (Fig. 5A). For both BLA and dlPFC injections, we did not find significant effects when each reward context was considered independently [BLA treatment: F(1,12) = 2.95, P = 0.11 for Self:Both, F(1,12) = 2.00, P = 0.18 for Other:Neither; dlPFC treatment: F(1,10) = 0.20, P = 0.67 for Self:Both and for Other:Neither]. We also found no reward context interaction in either BLA or dlPFC [treatment × context: F(1,24), F(1,20) < 0.71, P > 0.41].
Fig. 5.
Infusing OT into the value-mirroring sites in BLA promotes prosocial decisions. (Upper) Projected injection sites for OT (red) and saline (gray) (jittered for visibility). (A) The time courses of social preference index (mean ± SEM) in 5-min bins following the local infusion of OT (red) or saline (gray) into BLA (Left) or dlPFC (Right). The solid and dashed lines show Other:Neither context and Self:Both context, respectively. The shaded region shows the 30-min window. (B) The time courses of social gaze (proportions per session in mean ± SEM) following the infusion of OT or saline into BLA or dlPFC. Same format as in A. (C) Proportion of social gaze as a function of high vs. low prosocial sessions (median split on the preference indices) for BLA OT, BLA saline, dlPFC OT, and dlPFC saline injection. Asterisk indicates a significant modulatory relationship among BLA OT injection, high vs. low prosocial preferences, and corresponding social gaze proportions. (D) Decision RTs (mean of the session medians ± SEM) following OT or saline into BLA or dlPFC. Also shown are the individual RT means with SEM across individual decision types.
Our prior studies found that systemic OT inhalation increases social gaze as well (33). Here, unilateral OT injection into BLA did not directly enhance overall social gaze (Fig. 5B) [treatment: F(1,24) = 0.20, P = 0.66; treatment × subject: F(1,24) = 3.73, P = 0.07]. Likewise, OT injections into dlPFC did not evoke any effects on social gaze [treatment: F(1,20) = 0.11, P = 0.75; treatment × subject: F(1,20) = 0.04, P = 0.85] (Fig. 5B, Right). Neither did we find any significant effects on social gaze when each reward context was considered independently [BLA treatment: F(1,12) < 0.43, P > 0.52 for Self:Both and Other:Neither; dlPFC treatment: F(1,10) < 0.15, P > 0.71 for Self:Both and Other:Neither] nor any reward context interaction in either BLA or dlPFC [treatment × context: F(1,24), F(1,20) < 0.62, P > 0.44].
In prior work, we found that actors were more likely to look at recipients after making a prosocial choice (7, 33, 34), inviting the possibility that OT injections into BLA may influence social gaze indirectly by altering social preferences. To test this idea, we performed a median-split analysis by segregating days associated with stronger vs. weaker prosocial preferences and then examined the frequency of social gaze separately for each dataset. On those days when actors expressed stronger prosocial preferences on Other:Neither trials following OT injections into BLA, they were also more likely to look at the recipient (P = 0.02, permutation test; Fig. 5C). We did not observe this relationship on Self:Both trials following OT injections into BLA, nor any effects on Other:Neither or Self:Both trials following OT injections into dlPFC (all P > 0.22, Fig. 5C). Thus, OT injections into BLA selectively enhanced social gaze when these injections were more effective at promoting prosocial behavior, potentially reflecting better signaling of neurons expressing OT receptors or more reliable receptor binding (47).
Finally, OT injections into both BLA and dlPFC did not alter decision RTs [treatment: F(1,24), F(1,20) < 1.99, P > 0.17; treatment × subject: F(1,24), F(1,20) < 1.37, P > 0.26] (Fig. 5D), suggesting that the behavioral effects of OT are not simply driven by enhanced arousal or salience. Although the effects were small following our unilateral injections, our findings invite the hypothesis that OT enhances prosocial behavior, as well as social attention, in part, by modulating the activity of BLA neurons that encode the value of rewards chosen for self and others.
Discussion
The concept of action-mirroring has been hypothesized to be central to social cognition (48), and neurons specialized for action mirroring have been described in parietal and premotor cortices (49). Our findings demonstrate that neurons in BLA mirror the value of rewards for self and others and, moreover, these signals are correlated with prosocial decisions, thus extending the concept of mirroring to social decision-making. Using the same paradigm, we previously showed that neurons in the anterior cingulate gyrus (ACCg) respond when actor monkeys choose to reward both self and others (7). Although the responses of ACCg neurons predict how prosocial an animal is across sessions, they do not signal the value of rewards chosen for self and others (7). Distinct social reward signals observed in ACCg and BLA suggest different, potentially hierarchically layered, computational roles for these areas. One possibility is that ACCg may compute signals relevant for assigning credit or agency to the recipients of rewards (50) or shared experience (51, 52), whereas the amygdala may compute reward prediction or outcome signals relevant for making decisions (53, 54) or learning (18, 55).
Importantly, value-mirroring was not observed when the same rewards were delivered to actor or recipient by a computer, in the absence of active decisions; it was also not observed when actors chose not to distribute reward to a live agent (Neither condition). Such value-mirroring for decisions that only impact live social agents has interesting implications. Neurons in BLA appear to categorize social events as similar as long as there is a live agent involved (Self, Other, or Both), and do so only during active decision-making, with all its attendant motivational, emotional, and attentional components (17, 21, 24, 56, 57). The amygdala has been implicated in the integration of motivation and emotion (12), and our findings suggest contexts in which a live social agent is relevant engage these integrative processes. The integration of emotional and motivational signals during social interactions may serve to compute signals representing the value of rewards for self and others using a common scaling function observed here.
BLA has elaborate and reciprocal connections with prefrontal cortex (58) and projects to the nucleus accumbens in the ventral striatum (59, 60), endorsing a role for the amygdala in shaping how these circuits process the value of rewards during decision-making. We speculate that mirroring of reward values for self and others by BLA serves to adjust the gain of neuronal signals mediating social decisions in the brain. Grouping reward values for self and others in a common currency might be fundamental to empathic understanding of the experiences of others—whether they are cooperators, defectors, donors, or beneficiaries—and may underlie the capacity for the richness of social behaviors expressed in humans and other primates.
Numerous studies have found that inhaling OT alters hemodynamic activity in the human amygdala (28, 29, 31), but no prior studies have demonstrated that OT-selective processing within the amygdala actively promotes prosocial behavior in human or nonhuman primates. Here we found that unilateral infusion of OT into sites in BLA where value-mirroring neuronal activity was observed weakly but significantly modulates prosocial behavior, but that OT injections in dlPFC do not. Notably, when OT infusion was more effective at promoting prosocial behavior it also increased attention to the recipient of prosocial choices, thus implicating value-mirroring by BLA neurons in social attention as well as social reward. Understanding how OT alters the activity of value-mirroring neurons during ongoing social behavior may reveal a source of individual differences in OT-mediated social behaviors such as empathy and social gaze, with important implications for use of OT as treatments for disorders like autism and schizophrenia, in which these functions are compromised.
Value-mirroring may be an efficient means of computing information about the experiences of others using a neural code built on self-experience. Despite this computational efficiency, however, mirroring generates information that is fundamentally ambiguous with respect to agency. Nevertheless, this coding scheme may offer advantages as well. The combination of neurons that signal information about self and others on a common scale and neurons that differentially signal self- or other-specific information (7–9, 11) may implement a highly sophisticated mechanism both for distinguishing agency and conveying information about others from the perspective of oneself. The presence of value-mirroring activity in the primate amygdala is particularly noteworthy given that this set of nuclei is a key node for signaling emotional experience (21). Value-mirroring by BLA neurons thus may be a core mechanism subserving emotional empathy. By contrast, social reward neurons in ACCg (a part of the medial prefrontal network) that encode the reward outcome experienced by others (either exclusively or concurrently with self-rewards) (7) may be specialized for mediating cognitive empathy or theory of mind (22, 61, 62).
Materials and Methods
General and Behavioral Procedures.
All procedures were approved by the Duke University Institutional Animal Care and Use Committee and were conducted in compliance with the Public Health Service’s Guide for the Care and Use of Laboratory Animals. See SI Materials and Methods for the details on behavioral, recording, and microinjection procedures.
Data Analysis.
See SI Materials and Methods for the behavioral analyses. We computed spike rates associated with each decision during the 300-ms window centered around the time of decision registration (i.e., target acquisition) on decision trials. We computed cue-related spike rates during the 300-ms window (from 100 to 400 ms relative to cue onset). The time course of BLA population around the time of decisions, separately by enhanced and suppressed cell types, is shown in Fig. S5. For the analyses aligned on target onset (for both decision and cued trials), we used the epoch between 50 and 150 ms from the target onset. Finally, we calculated spike rates during the reward epoch from 50 to 400 ms relative to the onset of reward delivery. We used the spike rates from these epochs for all of our GLM-based analyses (see below). We also computed spike rates used for social gaze analysis from 50 to 450 ms aligned to the time of social gaze detection (i.e., eye positions entered into the social gaze window) during either the prereward epoch or postreward epoch. To isolate social gaze-related activity during the postreward epoch, we subtracted the activity leading up to 250 ms before the time of the gaze from the activity associated after the social gaze. The time course of an example BLA neuron around the time of social gaze, as well as the comparisons of gaze-related activity across different reward outcomes in individual cells, are shown in Fig. S6.
We defined a value sensitivity of firing rates to different reward values for each reward outcome as a change in firing rates as a function of different reward values (i.e., slope, sp/s/% max) in each neuron. Overall, a total of 100 cells (67%) and 102 cells (68%) showed value-dependent modulations in any of decision and cued trials, respectively, with a minimum of 55% of variance-explained (r2, linear regression) for at least one decision or cue type being considered.
We generated three separate GLM (Eq. 1) of firing rate, based on Poisson distribution using a log link function (denoted as Firing Ratepoisson). To compare across reward outcomes, we fit models for each reward outcome (Self, Both, Other, and Neither) individually. The full GLM examined the variance in firing rates due to the type of trial (decision or cued) and the reward size (expressed as percentages of the maximum reward value; 30–90%).
| [1] |
β1 and β2 signify the coefficients for reward size and trial type, and β0 signifies a constant or noise term. Each neuron was considered separately. We used the built-in MATLAB function glmfit with settings for a Poisson distribution and a log link function. Firing rates were drawn from a 300-ms time window centered on the time in which information about the reward outcome was first signaled. We then correlated the reward-size β-values (β1) of each neuron across reward outcomes (Fig. 3B). The statistics reported in Results were based on a Pearson’s correlation. However, because these β-values depend on firing rate, we then carried out a type-II linear regression to construct the regression line (gmregress in MATLAB). We generated a second GLM (Eq. 2) to compare responses to increasing reward sizes depending on the type of trial (decision or cued) within reward outcomes (Fig. 3C).
| [2] |
β1 signifies the coefficients for reward size and β0 a constant or noise term. Each neuron was considered separately. The firing rate data, including the time windows used, were also identical to that of the first GLM. Within each reward outcome, we then correlated the reward size β-values (β1) between trial types. This GLM was also used for examining the correlations across different epochs separately for trial types. The procedure was identical to that of the second GLM, except that additional epochs of firing-rate data were considered.
We carried out a logistic regression to test the ability of neurons to discriminate between prosocial (Both or Other) and antisocial (Self or Neither) decisions (Fig. 4A). To examine the time course, we obtained spike counts using 400-ms sliding windows, with a step size of 100 ms. Given that there are variable delays between task events on each trial, we used three separate alignments of activity: target onset, target acquisition, and reward delivery onset. For each alignment and for each neuron, we assigned Both rewards and Other rewards to 1 (prosocial), and Self rewards and Neither rewards to 0 (antisocial), and then regressed these values within each time window using glmfit with settings for a binomial distribution and a logit link function. Within each time window, we then calculated the percent of fitted neurons for which the decision term was significant (P < 0.05).
To test the effect of injecting OT or saline into either BLA or dlPFC, we carried out an analysis of variance, with treatment (OT or saline), context (Self:Both or Other:Neither), and subjects [MS or (ME or MC)] as factors.
SI Materials and Methods
Behavioral and Recording Procedures.
All experiments were carried out in a dimly lit room to ensure visibility of actor and recipient monkeys. The monkeys sat in primate chairs (Crist) facing 60-Hz LCD displays, 100 cm from one another at a 45° angle (Fig. 1A). Both actor and recipient monkeys were head-restrained during the experiments. Visual stimuli were presented on the LCD display. MATLAB (Math Works) with Psychtoolbox (63) was used to control behavioral paradigms and collect eye position data. Horizontal and vertical eye positions were sampled at 1,000 Hz using an infrared eye monitor camera system (SR Research Eyelink). A solenoid valve controlled the delivery of the fluid reward. Four male actor monkeys (MY, MS, ME, and MC) and one female recipient monkey participated in this study. All animals that participated in the study were unrelated and were not cage-mates. Animals were housed in a colony with 10 other male rhesus macaques, some of which were pair-housed. All of the male monkeys resided in this colony room, and the one female monkey resided in an adjacent colony room with other females.
Each monkey had his/her own monitor, which displayed identical visual stimuli. Both the actor and recipient monkeys had their own tube from which juice drops were delivered. To prevent monkeys from forming secondary associations of solenoid valve clicks or the sound of the recipient drinking the juice reward with respect to different reward types, the solenoid valves that delivered the juice rewards were placed in another room and white noise was also played in the background. Experimenters were unable to hear solenoids anywhere inside the recording room. Critically, a separate solenoid (also placed in another room) was designated for the Neither condition in which neither monkey was rewarded; it produced clicks, but delivered no fluid. Our control of the acoustic environment explicitly rules out a simple explanation that secondary associations drive the reward value-mirroring in the amygdala.
We determined face region of the recipient, with respect to the gaze angle of the actors (horizontal and vertical eye positions) empirically before the experiments. We computed the frequency with which actors looked at recipients from number of gaze shifts to the recipient’s face (±8.5° from the center of the face) (7, 33, 34). We used a large window to capture gaze shifts that were brief in duration and large in magnitude and often directed at varying depths (e.g., eyes and mouth).
Single-unit recordings were made from BLA in two actor monkeys (MY and MS) while each was engaged in the dictator game with a recipient monkey on 230 ± 12 (mean ± SD) decision trials and 160 ± 14 cued trials per recording session. Animals MY, ME, and MC participated in the neuropharmacological experiments (see below). The recording sites were in or near the basolateral complex (Fig. 2A). Monkeys performed the task to obtain drops of cherry-flavored juice. Actors began a trial by shifting gaze (±2.5°) to a central stimulus (0.5° × 0.5°), and maintaining fixation (200 ms). The reward value at stake on each trial was cued by the position of a horizontal bisecting line (200 ms), indicating the percentage of the maximum possible volume. The maximum juice amount per trial was set for each session (1.50 ± 0.45 mL of cherry-flavored juice [median ± SD]), and the animals could receive 90%, 70%, 50%, or 30% of the maximum amount in each trial, which was signaled by the reward value cue before any other task-related information. Following a 300-ms delay, decision and cued trials were presented at equal probabilities for MY and 75% (decision) and 25% (cued) of trials for MS, ME, and MC, randomly interleaved. On decision trials, two visual targets (4° × 4°) appeared at two random locations 7° eccentric in the opposite hemifield. Actors shifted gaze to one target (±2.5°) to indicate a decision. On cued trials, actors simply maintained fixation while a cue appeared centrally (500 ms for MY, ME, and MC; 300 ms for MS). Reward onset was followed by a variable delay (0, 300, or 500 ms) from the time of either making a decision or cue offset. Actors were free of any task requirement and thus free to look around during this delay (prereward epoch) and for 1 s after reward delivery (postreward epoch). Reward delivery was followed by an intertrial interval of 300 ms. A trial was considered incomplete if the monkey failed to choose a target on decision trials or to maintain fixation after cue onset on cued trials. We did not include such trials in the analysis. The monkeys performed the task well, as evidenced by a high percentage of correct trials even on trials in which they did not receive juice reinforcement (Fig. S1A).
All recordings were made using tungsten electrodes (FHC). We lowered single electrodes using a hydraulic microdrive system (Kopf Instruments). We isolated single-unit waveforms and collected action potentials using a 16-channel recording system (Plexon). To guide the placement of recording tracks and localize recording sites, we acquired structural MRIs (3T, 1-mm slices) of each actor’s brain. We made detailed localizations using an Osirix viewer. In addition to MRI guidance, we confirmed that electrodes were in the amygdala by listening to gray matter-associated and white matter-associated sounds while lowering the electrodes. Once we isolated any amygdala neurons, we confirmed their stability and recorded the activity without any selection criterion other than their anatomical locations.
Microinjection Procedure.
We carried out the focal microinjections of OT or saline into BLA or dlPFC in the actors MS, ME, and MC. We first identified the amygdala by conducting a set of preliminary recording from BLA in MS, ME, and MC guided by structural MR images. We performed local injections using a Hamilton microsyringe (Hamilton). In each session, we injected either 2 μL of OT (5 ng/nL of OT powder in saline; Sigma) or 2 μL saline vehicle into BLA or dlPFC (see Fig. 5A for injection sites). We carried out all injections unilaterally in each animal (contralateral to the location of the recipient; Fig. 1A), and we strictly alternated the OT and saline sessions, separated by at least 1 d (median 2 ± 1.4 d). Additionally, we performed all OT and saline injections in one region (either BLA or dlPFC) before moving onto the second region. To minimize tissue damage, we performed injections at a rate of 0.2 μL/min. The animals performed 593 ± 46 (median ± SEM) trials per session in BLA, and 486 ± 50 trials per sessions in dlPFC.
Behavioral Analyses.
We constructed decision preference indices as contrast ratios (Eq. S1) (7, 33, 34).
| [S1] |
RA and RB were the frequency of making particular decisions. For Self:Both trials, RA and RB were number of decisions to reward Both and Self, respectively. For Other:Neither trials, RA and RB were number of decisions to reward Other and Neither, respectively. Indices therefore ranged from –1 to 1, with 1 corresponding to always choosing a prosocial outcome. An index of −1 corresponds to the opposite, always choosing not to deliver reward to the other monkey (i.e., antisocial). Values of 0 indicated indifference. For constructing the neuronal preferences, we simply substituted the decision frequency with neuronal firing rates associated with making specific decisions within individual cells. Reaction times, the time from the onset of decisions to movement onset, were computed using a 20 °/s velocity threshold criterion (7, 33, 34).
SI Results
Aborted Trials During the Social Reward-Allocation Task.
Actor monkeys aborted trials at very low rates even when they chose between two options resulting in no rewards to themselves (Fig. S1A); critically, they also aborted trials substantially less often when a cue signaled rewards to the recipient compared with rewards to no one (P < 0.0001, paired t test; Fig. S1A). Consistent with our previous observations (7, 33, 34), these differences in “error” rates demonstrate that actors understood the key difference between the visual stimuli associated with rewards delivered to another monkey and to no one, and this conclusion is endorsed by prior observations that prosocial preferences vary with degree of familiarity and dominance relationships between actors and recipients (34).
Reward Value-Dependent Social Attention Is Specific to Active Decision-Making.
Actors looked at the recipient more often after delivering larger compared with smaller rewards during both the prereward and postreward epochs (Fig. S2B). These effects were neither merely driven by the fact that the recipient was the only animal receiving the juice nor by greater saliency associated with the recipient drinking a larger juice drop, because these differences were absent on cued trials, in which the same rewards were delivered and same drinking actions produced (Fig. S2B). Furthermore, actors looked at the recipient less often after choosing Self rewards and after Self-cued trials during postreward epochs but not during prereward epochs, possibly reflecting anticipation for drinking larger juice rewards (Fig. S2B). Thus, actors looked at the recipient more on high-reward trials only following decisions to deliver rewards to the recipient.
Correlated Neuronal Activity Across Decision Types During Social Gaze in BLA.
Given the importance of BLA in processing eyes and faces (64–67), we examined whether neuronal activity associated with social gaze during the prereward and postreward epochs also showed evidence of mirroring. Social gaze-related neuronal activity (i.e., sensitivity to where the actors are looking) was correlated across different reward outcomes during the postreward epoch (Fig. S6). However, such correlations were largely absent during the prereward epoch (Fig. S6), suggesting that mere observation of the recipient alone did not drive these correlations. One possibility is that neuronal activity associated with looking at the recipient himself may underlie the reward value-mirroring observed in these cells. To test this idea, we examined the correlations in neuronal activity across different reward outcomes using only those trials on which actor monkeys did not look at the recipient [percent of trials per cell: 52 ± 3% (mean ± SEM)]. Again, we found a correlation for Self and Both decisions (r = 0.62, P < 0.0001, Pearson’s correlation), as well as Self and Other decisions (r = 0.45, P < 0.0001), but no relationships for all other comparisons (|r| < 0.24, P > 0.16). These findings indicate that reward value-mirroring and social gaze-mirroring independently contribute to the response properties of BLA neurons.
SI Modeling Results: Hierarchical Models of Spike Counts
Reproducibility.
Modeling and analysis code related to this supplement (including the generation of this document) is publically available at https://github.com/jmxpearson/chang_et_al_2015. This link also contains the experimental data.
Model.
Here, we model spike counts in the time window of interest as drawn from a Poisson distribution:
| [S2] |
with Ni the spike count on trial i; c(i), o(i), and u(i) the cuing (free choice vs. cued), outcome (Neither, Other, Both, Self), and unit for that trial; and Ri the reward on the trial (coded as a percent of maximum).
More specifically, regression coefficients for each unit are drawn from a (population-level) multivariate t distribution with mean μ and covariance Σ. We use a t distribution both because the empirical distribution of coefficients is leptokurtic (high peaked and heavy tailed) and because estimation using the t is more robust to the presence of outliers.
We use a Cholesky factorization for the covariance matrix, with T a diagonal matrix of variable scale parameters and L a lower triangular matrix with LKJCorr prior (section 50.1 of the Stan Reference Manual, mc-stan.org/documentation/, v.2.8.0 and references therein); i.e., the correlation matrix C = LL⊤. For the degrees of freedom ν and scales τj, we use weakly informative half-Cauchy (restricted to the positive half plane) priors.
Given this model, we are particularly interested in inferring μ and Σ, the mean and covariance of the population of cells from which our experimental sample was drawn.
Simulation.
We used the modeling language Stan to perform Markov Chain Monte Carlo sampling. Our simulation comprised eight chains run for 1,000 samples each, half of which were discarded as burn-in, for a total of 2,000 samples. Both Rˆ and effective sample sizes for the simulation were consistent with efficient sampling. Postprocessing was performed by means of the rstan library for R.
Results.
Results from the model above are shown in Figs. S7 and S8. Baseline firing rates are strongly correlated across all conditions, whereas covariance among reward sensitivities differs between cued and uncued (choice) trial types. As Fig. S7 shows, estimates of the population distribution based on the observed single units give strong evidence for positive correlations between outcome pairs (Other, Both), (Other, Self), and (Both, Self), with the correlations involving (None, Self) is weak or centered around 0. By contrast, in Fig. S8, correlations among unit sensitivities in cued trials are mostly nonexistent, with only weak evidence for correlation between outcomes Other and Self. Finally, Fig. S9 shows the full correlation plot for all reward sensitivities across both conditions. In addition to containing the information in Figs. S7 and S8, this plot shows evidence for weak positive correlations between Other (cued) and Self, Both, and Other (choice). Note especially that correlations between None and Other outcomes are in all cases weaker, with substantial posterior mass around 0 correlation.
Fig. S8.
Correlations between sensitivities to distinct outcomes (cued). Conventions are as in Fig. S7.
Predicting Prosocial Choices.
In addition to characterizing firing rates in response to different reward outcomes, we also asked whether firing rates in single units predicted upcoming choice [binarized as prosocial (Both, Other) or antisocial (None, Self)]; to do so, we used a cross-validation approach in which we partitioned the data (spike counts in the target acquire epoch) for each cell, using 80% of the data for training and the remaining 20% for test. We then repeated this process five times, each time holding out a distinct subset of the training data (fivefold cross-validation). This process then yielded five measures of a model’s predictive performance, allowing us to estimate a mean and SD per unit.
We modeled the observed pro/antisocial outcome of each trial as a penalized logistic regression using the R package glmnet:
| [S3] |
with p the probability of a prosocial choice and n the observed spike count in the epoch of interest on that trial.
Our model used an L1 (absolute value) penalty on the coefficient β1, with the area under the curve (AUC) of the receiver operating characteristic as the measure of model accuracy. We considered a unit significantly predictive of choice behavior when both its mean AUC differed significantly from 0.5 (one-tailed t test, df = 4) and its β1 coefficient remained nonzero in the model (the first of these conditions requires the model to perform better than chance, the second that the model with spike counts included outperforms the baseline model (a constant p) on held-out data). We excluded any unit with fewer than 100 trials, and found that 28 of 152 cells, or 18%, significantly predicted upcoming choice.
Acknowledgments
This work was supported by National Institute for Mental Health R00-MH099093 (to S.W.C.C.); Simons Foundation 304935 (to M.P.); R01-MH095894 (to M.L.P., S.W.C.C., and A.V.U.); T32 Postdoctoral Training Grant (to K.T.); Department of Defense Grant W81XWH-11-1-0584 (to M.L.P. and S.W.C.C.); National Institute for Environmental Health Sciences Big Data to Knowledge Career Award K01-ES-025442-01 (to J.M.P.); JSPS Postdoctoral Fellowships for Research Abroad (to K.T.); and the Uehara Memorial Foundation (K.T.).
Footnotes
The authors declare no conflict of interest.
This article is a PNAS Direct Submission.
This article contains supporting information online at www.pnas.org/lookup/suppl/doi:10.1073/pnas.1514761112/-/DCSupplemental.
References
- 1.Singer T, et al. Empathic neural responses are modulated by the perceived fairness of others. Nature. 2006;439(7075):466–469. doi: 10.1038/nature04271. [DOI] [PMC free article] [PubMed] [Google Scholar]
- 2.Fehr E, Fischbacher U. The nature of human altruism. Nature. 2003;425(6960):785–791. doi: 10.1038/nature02043. [DOI] [PubMed] [Google Scholar]
- 3.de Waal FBM. Putting the altruism back into altruism: The evolution of empathy. Annu Rev Psychol. 2008;59:279–300. doi: 10.1146/annurev.psych.59.103006.093625. [DOI] [PubMed] [Google Scholar]
- 4.Behrens TEJ, Hunt LT, Rushworth MFS. The computation of social behavior. Science. 2009;324(5931):1160–1164. doi: 10.1126/science.1169694. [DOI] [PubMed] [Google Scholar]
- 5.Chang SWC, et al. Neuroethology of primate social behavior. Proc Natl Acad Sci USA. 2013;110(Suppl 2):10387–10394. doi: 10.1073/pnas.1301213110. [DOI] [PMC free article] [PubMed] [Google Scholar]
- 6.Carter RM, Bowling DL, Reeck C, Huettel SA. A distinct role of the temporal–parietal junction in predicting socially guided decisions. Science. 2012;337(6090):109–111. doi: 10.1126/science.1219681. [DOI] [PMC free article] [PubMed] [Google Scholar]
- 7.Chang SWC, Gariépy JF, Platt ML. Neuronal reference frames for social decisions in primate frontal cortex. Nat Neurosci. 2013;16(2):243–250. doi: 10.1038/nn.3287. [DOI] [PMC free article] [PubMed] [Google Scholar]
- 8.Yoshida K, Saito N, Iriki A, Isoda M. Representation of others’ action by neurons in monkey medial frontal cortex. Curr Biol. 2011;21(3):249–253. doi: 10.1016/j.cub.2011.01.004. [DOI] [PubMed] [Google Scholar]
- 9.Azzi JCB, Sirigu A, Duhamel JR. Modulation of value representation by social context in the primate orbitofrontal cortex. Proc Natl Acad Sci USA. 2012;109(6):2126–2131. doi: 10.1073/pnas.1111715109. [DOI] [PMC free article] [PubMed] [Google Scholar]
- 10.Haroush K, Williams ZM. Neuronal prediction of opponent’s behavior during cooperative social interchange in primates. Cell. 2015;160(6):1233–1245. doi: 10.1016/j.cell.2015.01.045. [DOI] [PMC free article] [PubMed] [Google Scholar]
- 11.Báez-Mendoza R, Harris CJ, Schultz W. Activity of striatal neurons reflects social action and own reward. Proc Natl Acad Sci USA. 2013;110(41):16634–16639. doi: 10.1073/pnas.1211342110. [DOI] [PMC free article] [PubMed] [Google Scholar]
- 12.Cardinal RN, Parkinson JA, Hall J, Everitt BJ. Emotion and motivation: The role of the amygdala, ventral striatum, and prefrontal cortex. Neurosci Biobehav Rev. 2002;26(3):321–352. doi: 10.1016/s0149-7634(02)00007-6. [DOI] [PubMed] [Google Scholar]
- 13.Gallagher M, Chiba AA. The amygdala and emotion. Curr Opin Neurobiol. 1996;6(2):221–227. doi: 10.1016/s0959-4388(96)80076-6. [DOI] [PubMed] [Google Scholar]
- 14.Kluver H, Bucy PC. Preliminary analysis of functions of the temporal lobes in monkeys. Arch Neurol Psychiatry. 1939;42(6):979–1000. doi: 10.1176/jnp.9.4.606. [DOI] [PubMed] [Google Scholar]
- 15.LeDoux JE. Emotion circuits in the brain. Annu Rev Neurosci. 2000;23(1):155–184. doi: 10.1146/annurev.neuro.23.1.155. [DOI] [PubMed] [Google Scholar]
- 16.Morris JS, et al. A differential neural response in the human amygdala to fearful and happy facial expressions. Nature. 1996;383(6603):812–815. doi: 10.1038/383812a0. [DOI] [PubMed] [Google Scholar]
- 17.Phelps EA. Emotion and cognition: Insights from studies of the human amygdala. Annu Rev Psychol. 2006;57:27–53. doi: 10.1146/annurev.psych.56.091103.070234. [DOI] [PubMed] [Google Scholar]
- 18.Paton JJ, Belova MA, Morrison SE, Salzman CD. The primate amygdala represents the positive and negative value of visual stimuli during learning. Nature. 2006;439(7078):865–870. doi: 10.1038/nature04490. [DOI] [PMC free article] [PubMed] [Google Scholar]
- 19.De Martino B, Camerer CF, Adolphs R. Amygdala damage eliminates monetary loss aversion. Proc Natl Acad Sci USA. 2010;107(8):3788–3792. doi: 10.1073/pnas.0910230107. [DOI] [PMC free article] [PubMed] [Google Scholar]
- 20.Hernádi I, Grabenhorst F, Schultz W. Planning activity for internally generated reward goals in monkey amygdala neurons. Nat Neurosci. 2015;18(3):461–469. doi: 10.1038/nn.3925. [DOI] [PMC free article] [PubMed] [Google Scholar]
- 21.Davis M, Whalen PJ. The amygdala: Vigilance and emotion. Mol Psychiatry. 2001;6(1):13–34. doi: 10.1038/sj.mp.4000812. [DOI] [PubMed] [Google Scholar]
- 22.Gallagher HL, Frith CD. Functional imaging of ‘theory of mind’. Trends Cogn Sci. 2003;7(2):77–83. doi: 10.1016/s1364-6613(02)00025-6. [DOI] [PubMed] [Google Scholar]
- 23.Mars RB, Sallet J, Neubert FX, Rushworth MFS. Connectivity profiles reveal the relationship between brain areas for social cognition in human and monkey temporoparietal cortex. Proc Natl Acad Sci USA. 2013;110(26):10806–10811. doi: 10.1073/pnas.1302956110. [DOI] [PMC free article] [PubMed] [Google Scholar]
- 24.Adolphs R. What does the amygdala contribute to social cognition? Ann N Y Acad Sci. 2010;1191(1):42–61. doi: 10.1111/j.1749-6632.2010.05445.x. [DOI] [PMC free article] [PubMed] [Google Scholar]
- 25.Mosher CP, Zimmerman PE, Gothard KM. Neurons in the monkey amygdala detect eye contact during naturalistic social interactions. Curr Biol. 2014;24(20):2459–2464. doi: 10.1016/j.cub.2014.08.063. [DOI] [PMC free article] [PubMed] [Google Scholar]
- 26.Gothard KM, Battaglia FP, Erickson CA, Spitler KM, Amaral DG. Neural responses to facial expression and face identity in the monkey amygdala. J Neurophysiol. 2007;97(2):1671–1683. doi: 10.1152/jn.00714.2006. [DOI] [PubMed] [Google Scholar]
- 27.Donaldson ZR, Young LJ. Oxytocin, vasopressin, and the neurogenetics of sociality. Science. 2008;322(5903):900–904. doi: 10.1126/science.1158668. [DOI] [PubMed] [Google Scholar]
- 28.Kirsch P, et al. Oxytocin modulates neural circuitry for social cognition and fear in humans. J Neurosci. 2005;25(49):11489–11493. doi: 10.1523/JNEUROSCI.3984-05.2005. [DOI] [PMC free article] [PubMed] [Google Scholar]
- 29.Petrovic P, Kalisch R, Singer T, Dolan RJ. Oxytocin attenuates affective evaluations of conditioned faces and amygdala activity. J Neurosci. 2008;28(26):6607–6615. doi: 10.1523/JNEUROSCI.4572-07.2008. [DOI] [PMC free article] [PubMed] [Google Scholar]
- 30.Liu N, et al. Oxytocin modulates fMRI responses to facial expression in macaques. Proc Natl Acad Sci USA. 2015;112(24):E3123–E3130. doi: 10.1073/pnas.1508097112. [DOI] [PMC free article] [PubMed] [Google Scholar]
- 31.Gamer M, Zurowski B, Büchel C. Different amygdala subregions mediate valence-related and attentional effects of oxytocin in humans. Proc Natl Acad Sci USA. 2010;107(20):9400–9405. doi: 10.1073/pnas.1000985107. [DOI] [PMC free article] [PubMed] [Google Scholar]
- 32.Gordon I, et al. Oxytocin enhances brain function in children with autism. Proc Natl Acad Sci USA. 2013;110(52):20953–20958. doi: 10.1073/pnas.1312857110. [DOI] [PMC free article] [PubMed] [Google Scholar]
- 33.Chang SWC, Barter JW, Ebitz RB, Watson KK, Platt ML. Inhaled oxytocin amplifies both vicarious reinforcement and self reinforcement in rhesus macaques (Macaca mulatta) Proc Natl Acad Sci USA. 2012;109(3):959–964. doi: 10.1073/pnas.1114621109. [DOI] [PMC free article] [PubMed] [Google Scholar]
- 34.Chang SWC, Winecoff AA, Platt ML. Vicarious reinforcement in rhesus macaques (macaca mulatta) Front Neurosci. 2011;5:27. doi: 10.3389/fnins.2011.00027. [DOI] [PMC free article] [PubMed] [Google Scholar]
- 35.Damon W, Lerner RM, Eisenberg N, editors. Handbook of Child Psychology. Vol. 3: Social, Emotional, and Personality Development. 6th Ed Wiley; Hoboken, NJ: 2006. [Google Scholar]
- 36.Brief AP, Motowidlo SJ. Prosocial organizational behaviors. Acad Manage Rev. 1986;11(4):710–725. [Google Scholar]
- 37.Penner LA, Dovidio JF, Piliavin JA, Schroeder DA. Prosocial behavior: Multilevel perspectives. Annu Rev Psychol. 2005;56:365–392. doi: 10.1146/annurev.psych.56.091103.070141. [DOI] [PubMed] [Google Scholar]
- 38.Batson CD, Powell AA. Handbook of Psychology. Part 3: Social Psychology. Wiley; New York: 2003. Altruism and prosocial behavior; pp. 463–484. [Google Scholar]
- 39.Bandura A, Ross D, Ross SA. Vicarious reinforcement and imitative learning. J Abnorm Psychol. 1963;67:601–607. doi: 10.1037/h0045550. [DOI] [PubMed] [Google Scholar]
- 40.Peck CJ, Lau B, Salzman CD. The primate amygdala combines information about space and value. Nat Neurosci. 2013;16(3):340–348. doi: 10.1038/nn.3328. [DOI] [PMC free article] [PubMed] [Google Scholar]
- 41.Domes G, et al. Oxytocin attenuates amygdala responses to emotional faces regardless of valence. Biol Psychiatry. 2007;62(10):1187–1190. doi: 10.1016/j.biopsych.2007.03.025. [DOI] [PubMed] [Google Scholar]
- 42.Riem MME, et al. Oxytocin modulates amygdala, insula, and inferior frontal gyrus responses to infant crying: A randomized controlled trial. Biol Psychiatry. 2011;70(3):291–297. doi: 10.1016/j.biopsych.2011.02.006. [DOI] [PubMed] [Google Scholar]
- 43.Labuschagne I, et al. Oxytocin attenuates amygdala reactivity to fear in generalized social anxiety disorder. Neuropsychopharmacology. 2010;35(12):2403–2413. doi: 10.1038/npp.2010.123. [DOI] [PMC free article] [PubMed] [Google Scholar]
- 44.Domes G, et al. Effects of intranasal oxytocin on emotional face processing in women. Psychoneuroendocrinology. 2010;35(1):83–93. doi: 10.1016/j.psyneuen.2009.06.016. [DOI] [PubMed] [Google Scholar]
- 45.Lischke A, et al. Oxytocin increases amygdala reactivity to threatening scenes in females. Psychoneuroendocrinology. 2012;37(9):1431–1438. doi: 10.1016/j.psyneuen.2012.01.011. [DOI] [PubMed] [Google Scholar]
- 46.Freeman SM, Inoue K, Smith AL, Goodman MM, Young LJ. The neuroanatomical distribution of oxytocin receptor binding and mRNA in the male rhesus macaque (Macaca mulatta) Psychoneuroendocrinology. 2014;45:128–141. doi: 10.1016/j.psyneuen.2014.03.023. [DOI] [PMC free article] [PubMed] [Google Scholar]
- 47.Owen SF, et al. Oxytocin enhances hippocampal spike transmission by modulating fast-spiking interneurons. Nature. 2013;500(7463):458–462. doi: 10.1038/nature12330. [DOI] [PMC free article] [PubMed] [Google Scholar]
- 48.Gallese V, Keysers C, Rizzolatti G. A unifying view of the basis of social cognition. Trends Cogn Sci. 2004;8(9):396–403. doi: 10.1016/j.tics.2004.07.002. [DOI] [PubMed] [Google Scholar]
- 49.Rizzolatti G, Craighero L. The mirror-neuron system. Annu Rev Neurosci. 2004;27(1):169–192. doi: 10.1146/annurev.neuro.27.070203.144230. [DOI] [PubMed] [Google Scholar]
- 50.Tomlin D, et al. Agent-specific responses in the cingulate cortex during economic exchanges. Science. 2006;312(5776):1047–1050. doi: 10.1126/science.1125596. [DOI] [PubMed] [Google Scholar]
- 51.Mitchell JP, Macrae CN, Banaji MR. Dissociable medial prefrontal contributions to judgments of similar and dissimilar others. Neuron. 2006;50(4):655–663. doi: 10.1016/j.neuron.2006.03.040. [DOI] [PubMed] [Google Scholar]
- 52.Singer T, et al. Empathy for pain involves the affective but not sensory components of pain. Science. 2004;303(5661):1157–1162. doi: 10.1126/science.1093535. [DOI] [PubMed] [Google Scholar]
- 53.McClure SM, York MK, Montague PR. The neural substrates of reward processing in humans: The modern role of FMRI. Neuroscientist. 2004;10(3):260–268. doi: 10.1177/1073858404263526. [DOI] [PubMed] [Google Scholar]
- 54.O’Doherty JP. Reward representations and reward-related learning in the human brain: insights from neuroimaging. Curr Opin Neurobiol. 2004;14(6):769–776. doi: 10.1016/j.conb.2004.10.016. [DOI] [PubMed] [Google Scholar]
- 55.Morrison SE, Salzman CD. Re-valuing the amygdala. Curr Opin Neurobiol. 2010;20(2):221–230. doi: 10.1016/j.conb.2010.02.007. [DOI] [PMC free article] [PubMed] [Google Scholar]
- 56.Amaral DG. The amygdala, social behavior, and danger detection. Ann N Y Acad Sci. 2003;1000(1):337–347. doi: 10.1196/annals.1280.015. [DOI] [PubMed] [Google Scholar]
- 57.Baxter MG, Murray EA. The amygdala and reward. Nat Rev Neurosci. 2002;3(7):563–573. doi: 10.1038/nrn875. [DOI] [PubMed] [Google Scholar]
- 58.Carmichael ST, Price JL. Limbic connections of the orbital and medial prefrontal cortex in macaque monkeys. J Comp Neurol. 1995;363(4):615–641. doi: 10.1002/cne.903630408. [DOI] [PubMed] [Google Scholar]
- 59.Fudge JL, Kunishio K, Walsh P, Richard C, Haber SN. Amygdaloid projections to ventromedial striatal subterritories in the primate. Neuroscience. 2002;110(2):257–275. doi: 10.1016/s0306-4522(01)00546-2. [DOI] [PubMed] [Google Scholar]
- 60.Russchen FT, Bakst I, Amaral DG, Price JL. The amygdalostriatal projections in the monkey. An anterograde tracing study. Brain Res. 1985;329(1-2):241–257. doi: 10.1016/0006-8993(85)90530-x. [DOI] [PubMed] [Google Scholar]
- 61.Decety J, Jackson PL. A social-neuroscience perspective on empathy. Curr Dir Psychol Sci. 2006;15(2):54–58. [Google Scholar]
- 62.Engen HG, Singer T. Empathy circuits. Curr Opin Neurobiol. 2013;23(2):275–282. doi: 10.1016/j.conb.2012.11.003. [DOI] [PubMed] [Google Scholar]
- 63.Brainard DH. The Psychophysics Toolbox. Spat Vis. 1997;10(4):433–436. [PubMed] [Google Scholar]
- 64.Kawashima R, et al. The human amygdala plays an important role in gaze monitoring: A PET study. Brain. 1999;122(4):779–783. doi: 10.1093/brain/122.4.779. [DOI] [PubMed] [Google Scholar]
- 65.Adolphs R, et al. A mechanism for impaired fear recognition after amygdala damage. Nature. 2005;433(7021):68–72. doi: 10.1038/nature03086. [DOI] [PubMed] [Google Scholar]
- 66.Whalen PJ, et al. Masked presentations of emotional facial expressions modulate amygdala activity without explicit knowledge. J Neurosci. 1998;18(1):411–418. doi: 10.1523/JNEUROSCI.18-01-00411.1998. [DOI] [PMC free article] [PubMed] [Google Scholar]
- 67.Hoffman KL, Gothard KM, Schmid MC, Logothetis NK. Facial-expression and gaze-selective responses in the monkey amygdala. Curr Biol. 2007;17(9):766–772. doi: 10.1016/j.cub.2007.03.040. [DOI] [PubMed] [Google Scholar]


