Significance
We use high spatiotemporal resolution single-molecule microscopy to directly visualize the structural transitions underlying each step of the molecular motor kinesin-1 at physiological stepping rates. Our results identify a one-head–bound intermediate in the stepping cycle that is initiated by ATP binding and is terminated by ATP hydrolysis. These results supersede previous functional studies because they identify the transitions that must occur to produce a step as opposed to transitions that may occur if the motor is studied under controlled conditions. We thus show that kinesin utilizes a two-step powerstroke mechanism to walk at maximum velocity. The single-molecule methods developed here are broadly applicable for resolving protein conformational changes as small as 2 nm with millisecond temporal resolution.
Keywords: kinesin, iSCAT, microscopy, structural kinetics, structure–function
Abstract
To dissect the kinetics of structural transitions underlying the stepping cycle of kinesin-1 at physiological ATP, we used interferometric scattering microscopy to track the position of gold nanoparticles attached to individual motor domains in processively stepping dimers. Labeled heads resided stably at positions 16.4 nm apart, corresponding to a microtubule-bound state, and at a previously unseen intermediate position, corresponding to a tethered state. The chemical transitions underlying these structural transitions were identified by varying nucleotide conditions and carrying out parallel stopped-flow kinetics assays. At saturating ATP, kinesin-1 spends half of each stepping cycle with one head bound, specifying a structural state for each of two rate-limiting transitions. Analysis of stepping kinetics in varying nucleotides shows that ATP binding is required to properly enter the one-head–bound state, and hydrolysis is necessary to exit it at a physiological rate. These transitions differ from the standard model in which ATP binding drives full docking of the flexible neck linker domain of the motor. Thus, this work defines a consensus sequence of mechanochemical transitions that can be used to understand functional diversity across the kinesin superfamily.
Kinesin-1 is a motor protein that steps processively toward microtubule plus-ends, tracking single protofilaments and hydrolyzing one ATP molecule per step (1–6). Step sizes corresponding to the tubulin dimer spacing of 8.2 nm are observed when the molecule is labeled by its C-terminal tail (7–10) and to a two-dimer spacing of 16.4 nm when a single motor domain is labeled (4, 11, 12), consistent with the motor walking in a hand-over-hand fashion. Kinesin has served as an important model system for advancing single-molecule techniques (7–10) and is clinically relevant for its role in neurodegenerative diseases (13), making dissection of its step a popular ongoing target of study.
Despite decades of work, many essential components of the mechanochemical cycle remain disputed, including (i) how much time kinesin-1 spends in a one-head–bound (1HB) state when stepping at physiological ATP concentrations, (ii) whether the motor waits for ATP in a 1HB or two-heads–bound (2HB) state, and (iii) whether ATP hydrolysis occurs before or after tethered head attachment (4, 11, 14–20). These questions are important because they are fundamental to the mechanism by which kinesins harness nucleotide-dependent structural changes to generate mechanical force in a manner optimized for their specific cellular tasks. Addressing these questions requires characterizing a transient 1HB state in the stepping cycle in which the unattached head is located between successive binding sites on the microtubule. This 1HB intermediate is associated with the force-generating powerstroke of the motor and underlies the detachment pathway that limits motor processivity. Optical trapping (7, 19, 21, 22) and single-molecule tracking studies (4, 8–11) have failed to detect this 1HB state during stepping. Single-molecule fluorescence approaches have detected a 1HB intermediate at limiting ATP concentrations (11, 12, 14, 15), but apart from one study that used autocorrelation analysis to detect a 3-ms intermediate (17), the 1HB state has been undetectable at physiological ATP concentrations.
Single-molecule microscopy is a powerful tool for studying the kinetics of structural changes in macromolecules (23). Tracking steps and potential substeps for kinesin-1 at saturating ATP has until now been hampered by the high stepping rates of the motor (up to 100 s−1), which necessitates high frame rates, and the small step size (8.2 nm), which necessitates high spatial precision (7). Here, we apply interferometric scattering microscopy (iSCAT), a recently established single-molecule tool with high spatiotemporal resolution (24–27) to directly visualize the structural changes underlying kinesin stepping. By labeling one motor domain in a dimeric motor, we detect a 1HB intermediate state in which the tethered head resides over the bound head for half the duration of the stepping cycle at saturating ATP. We further show that at physiological stepping rates, ATP binding is required to enter this 1HB state and that ATP hydrolysis is required to exit it. This work leads to a significant revision of the sequence and kinetics of mechanochemical transitions that make up the kinesin-1 stepping cycle and provides a framework for understanding functional diversity across the kinesin superfamily.
Results
High-Resolution Single-Molecule Microscopy Reveals an Intermediate in the Stepping Cycle at Saturating ATP.
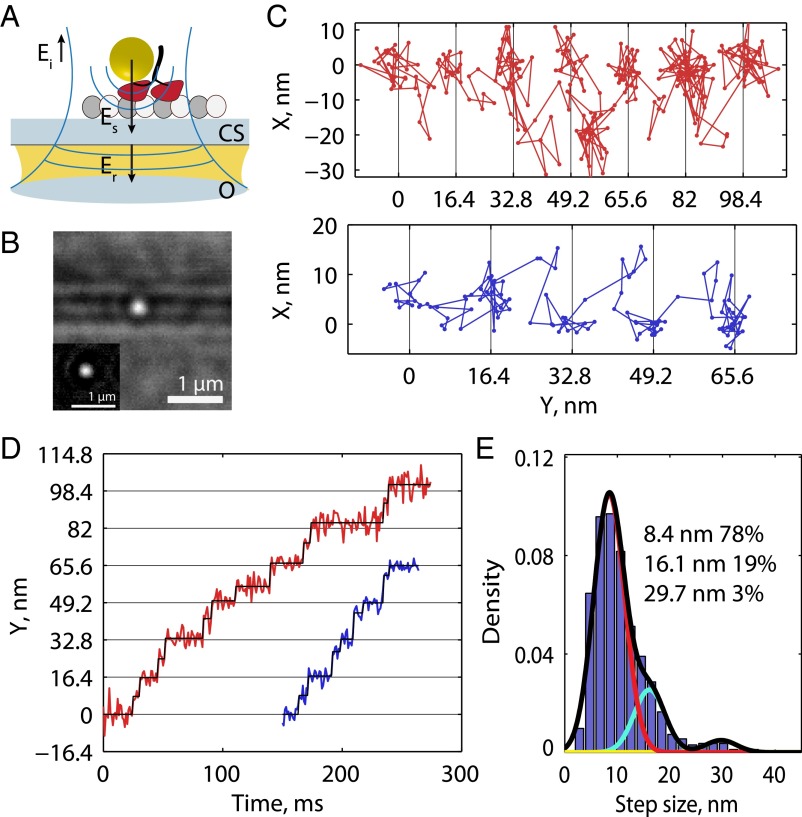
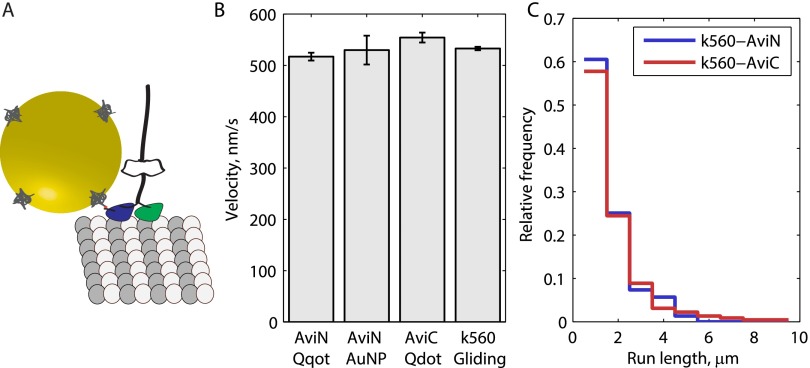
We directly observed the stepping cycle of kinesin-1 at saturating ATP by performing in vitro single-molecule assays using iSCAT microscopy (25–27) (Fig. 1 A and B). Drosophila kinesin-1 (K560) was fused to an N-terminal AviTag and conjugated to a 30-nm streptavidin-coated gold nanoparticle. This conjugation strategy allowed us to maintain the wild-type sequence for the motor domain and had no measurable effect on either the velocity or run length (Fig. S1). Microtubules were attached to a glass coverslip, and the position of the nanoparticles carried by single kinesin motor domains was tracked with subdiffraction-limited precision using established methods (4, 25, 28). The high spatiotemporal resolution of iSCAT enabled tracking at saturating ATP such that stepping kinetics could be recorded for kinesins moving under physiological conditions.
Fig. 1.
Kinesin substeps at saturating ATP. (A) Schematic of the experimental set up. The incident field (Ei) is provided through an objective (O), and the fields reflected (Er) off the coverslip (CS) and scattered (Es) by a gold nanoparticle are collected by the same objective. (B) Raw image of a 30-nm gold nanoparticle (in focus) on a motor walking along a microtubule (out of focus) at 1,000 frames per second. (Inset) The isolated point-spread function after background subtraction. (C) Example traces in XY space at 1,000 frames per second and 1 mM ATP. (D) Same traces as in C represented as position along the microtubule axis versus time, showing clear evidence of substeps. (E) Histogram of positive-step sizes at 1,000 frames per second at 1 mM ATP including a Gaussian mixture-model fit. Individual fit components are shown in color, and mixture fit (sum of components) is shown in black. Step-size distributions for lower frame rates are shown in Fig. S3.
Fig. S1.
Velocity and run-length controls for N-terminal biotinylation via AviTag. (A) To-scale schematic of K560-AviN motor with 30-nm gold nanoparticle attached through biotin–streptavidin. (B) Velocity measurements for K560 show negligible change for various probes and assay styles. K560 average velocity weighted by run length was 517.1 ± 7.6 nm/s (SEM; n = 299) when labeled at the N terminus with a Qdot, 529.8 ± 28.1 nm/s (n = 27) when labeled at the N terminus with a 30-nm gold nanoparticle, 554.2 ± 9.7 nm/s (n = 225) when labeled at the C terminus with a Qdot, and 532.9 ± 3.4 nm/s (n = 279) when unlabeled and measured in a gliding assay. (C) Normalized histograms of run lengths measured for N- and C-terminal Qdot-labeled motors. Distributions are seen to almost perfectly overlap, save for a lengthened tail for the C-terminal labeled motor, showing that N-terminal labeling does not affect processivity. Both K560-AviN (1.09 ± 0.94 µm, mean ± SD; n = 299) and K560-AviC (1.34 ± 1.47 µm, mean ± SD; n = 225) are well estimated by exponential distributions.
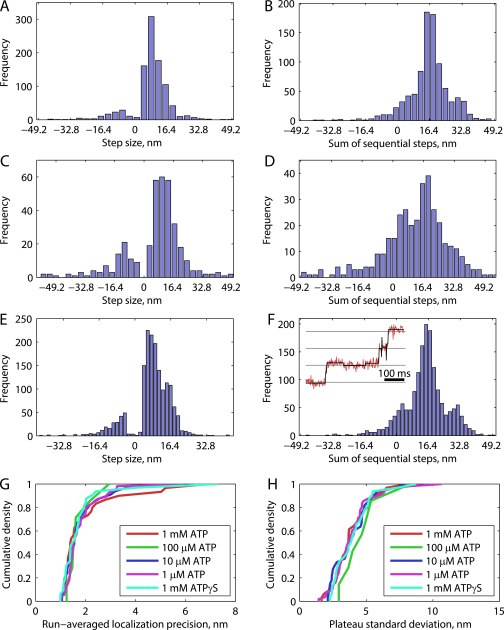
At 1,000 frames per second, gold nanoparticles on moving kinesins were localized with a run-wise average precision, defined as the error of the Gaussian fit to the point-spread function averaged over a processive run, of 1.9 ± 0.4 nm (SEM for n = 31 processive runs; Fig. S2G). To extract steps, the motor position along the microtubule axis was analyzed using a model-free t test-based algorithm (29), and 982 total steps were detected. The plateau SD, calculated through pairwise differences with outliers removed (Materials and Methods and Fig. S2H) was 3.8 ± 0.3 nm. This base noise level enabled identification of substeps beyond the 16.4-nm steps that have been detected previously (Fig. 1 C and D) (4, 11, 12). Because 16.4 nm represents a complete mechanochemical cycle for one head, we interpret the substep position as a stable mechanochemical intermediate with the labeled head unbound and positioned partway between successive microtubule-binding sites. Accordingly, sequential steps were seen to add up to 16.4 nm (Fig. S2). A Gaussian mixture model was fit to the distribution of positive step sizes, and the principle component (78%) had a mean ± SD of 8.4 ± 3.0 nm, approximately half the distance between successive binding sites for a single head (Fig. 1E). Larger components were found with means 16.1 and 29.7 nm, likely corresponding to missed substeps.
Fig. S2.
Model-free fitting to 1,000-frames-per-second data at various ATP concentrations. All step finding was carried out using the tDetector algorithm. (A, C, and E) Histograms of measured steps for 1 mM ATP (948 steps, 31 runs) (A), 100 µM ATP (364 steps, 7 runs) (C), and 10 µM ATP (1,634 steps, 33 runs) (E). Modes here are seen to be smaller than 16.4 nm. (B, D, and F) Sums of sequential step sizes for 1 mM (B), 100 µM (D), and 10 µM (F), respectively, show clear modes at 16.4 nm. (F, Inset) An example raw trace at 10 µM ATP with tDetector fit (horizontal lines at 16.4-nm spacing). The tDetector algorithm is expected to have a 5% false-positive rate, which likely explains the apparent backsteps, and the longer plateaus at low [ATP] are expected to generate more false positives. The peak at 0 nm for the sum of sequential steps is consistent with resolution of false backsteps back to the plateau. (G) Cumulative density functions for localization precision, obtained as the error on the Gaussian fit to the point-spread function at each frame and averaged over entire processive runs. A precision of 1.9 ± 0.4 nm (SEM) was obtained for 1 mM, 1.8 ± 0.2 nm for 100 µM, 1.8 ± 0.1 nm for 10 µM, 1.8 ± 0.1 nm (n = 55 runs) for 1 µM, and 1.8 ± 0.2 nm (n = 32 runs) for 1 mM ATPγS. (H) Cumulative density functions for plateau SD, calculated from pairwise differences in position along the microtubule axis for a processive run and corrected for outliers (>3 SD units). A plateau SD of 3.8 ± 0.3 nm was obtained for 1 mM, 4.8 ± 0.7 nm for 100 µM, 3.9 ± 0.3 nm for 10 µM, 4.0 ± 0.2 nm for 1 µM, and 4.0 ± 0.3 nm for 1 mM ATPγS.
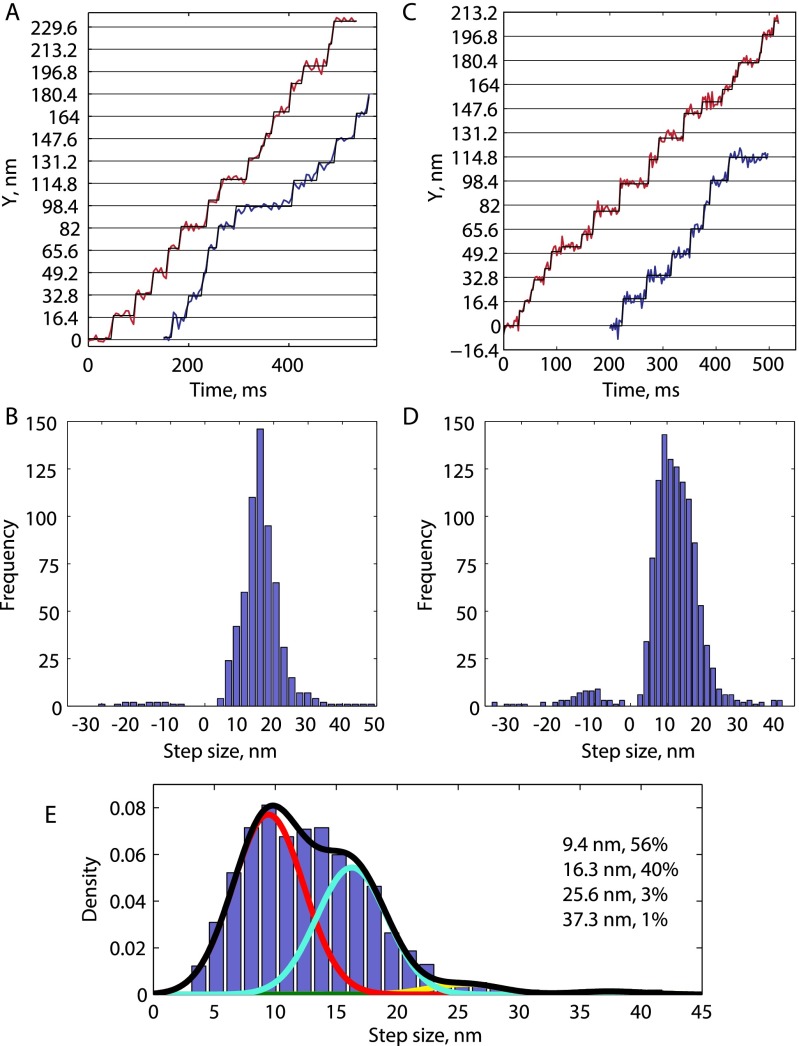
For verification, we repeated the experiment at 200 frames per second and achieved an average precision of 3.9 ± 0.3 nm and plateau SD of 5.3 ± 0.3 nm for n = 26 processive runs. Under these conditions, the mean positive step size was 16.4 ± 0.2 nm (SEM, 636 steps; Fig. S3), consistent with previous tracking studies that used lower ATP concentrations to slow the stepping rate (4, 11). We carried out step-finding analysis on simulated steps generated with experimental signal-to-noise matching both this and previous studies and validated that substeps are only consistently detected with high frame rates and low plateau SDs (Fig. S4).
Fig. S3.
Model-free fitting of K560-AviN tracks at saturating ATP and lower frames rates. Example traces in A and population histogram in B show data for saturating ATP and 200 frames per second. The mean of positive step sizes is 16.4 ± 0.2 nm, showing that no substeps are detected. Here, 636 steps are collected from 36 processive runs. A run-wise localization precision of 3.9 ± 0.3 nm and a plateau SD of 5.3 ± 0.3 nm were achieved. Example traces in C and population histogram in D are at saturating ATP and 400 frames per second. Here, 1,155 steps were collected from 30 processive runs. A run-wise localization precision of 3.1 ± 0.3 nm and a plateau SD of 4.6 ± 0.3 nm were achieved. Because the population mode is much less than 16.4 nm, a Gaussian mixture model was fit to the positive steps (E); 56% of steps were centered on a mode at 9.4 nm, and 40% of steps centered around 16.3 nm. Substeps are thus only measured in ∼35% of instances here, versus approximate 67% at 1,000 frames per second (Fig. 1E).
Fig. S4.
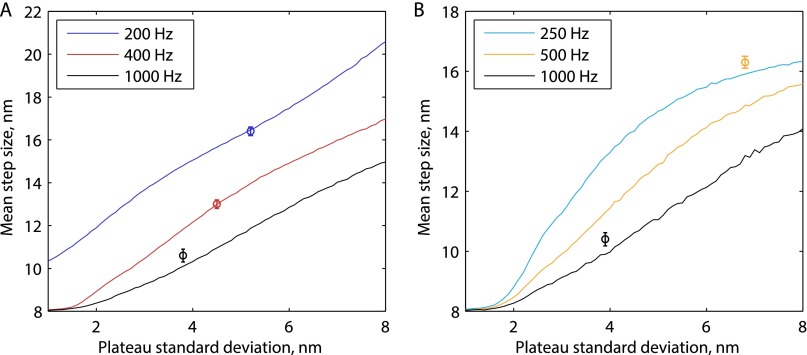
Substep simulations at varying spatiotemporal resolution. Artificial 8.2-nm steps were generated at 1 mM ATP (A) and 10 µM ATP (B) by drawing exponential random numbers using experimental values for 1HB and 2HB dwell times. The artificial steps were corrupted with Gaussian noise to produce a desired plateau SD and then were fit using the tDetector algorithm (see SI Text for details). Mean positive step sizes from experiments are plotted as a function of their plateau SD at different sampling rates (single points with SEM error bars). As can be seen, at lower spatiotemporal resolution, the substeps are missed and a 16-nm mean step size is detected. In contrast, at high spatiotemporal resolution, most of the substeps are detected and the mean step size approaches the correct 8.2 nm. The orange data point in B shows experimental values reported by Toprak et al. (11) at 10 µM ATP and 500 frames per second, and comparison with the blue and orange lines explains why substeps may have been missed in that study. It is also noteworthy that the step-finding algorithm used in that study requires the approximate number of steps in the given trace as an input parameter, biasing it against the detection of a mixture of steps and substeps.
Kinesin Spends Equal Fractions of Time with 1HB and 2HB at Saturating ATP.
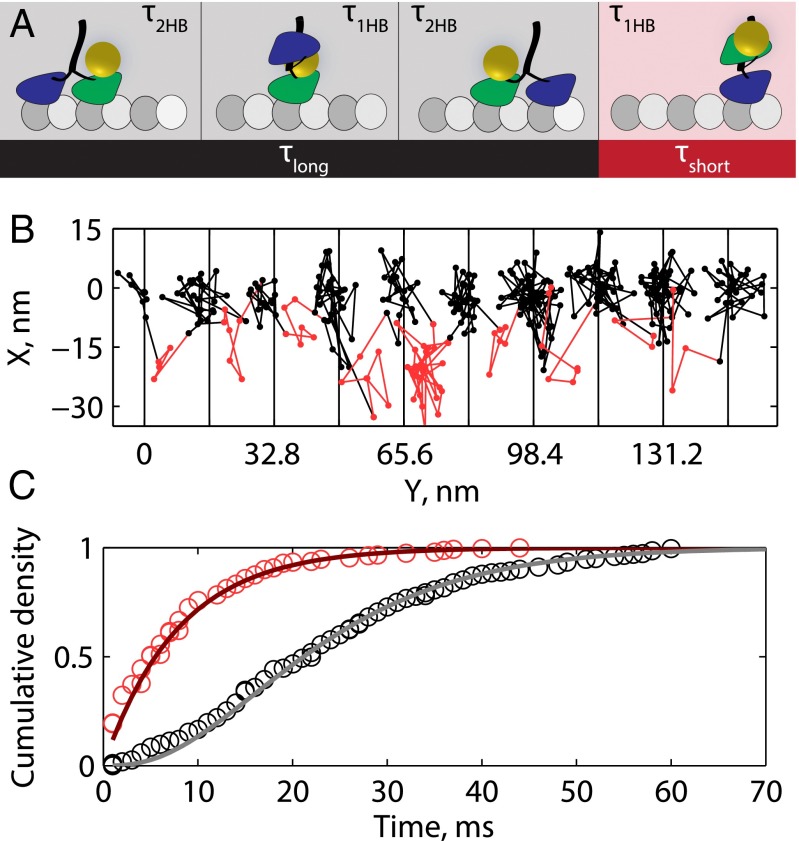
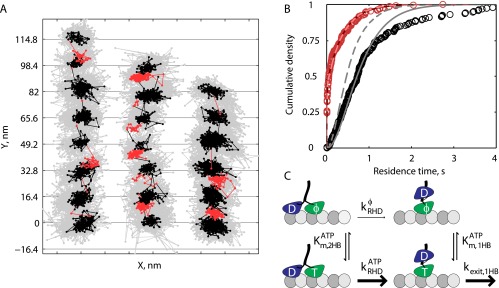
The precision achieved when tracking at 1,000 frames per second enabled kinetic analysis of the dwell times preceding each substep. The stepping cycle for each head involves detaching from the microtubule and reattaching to the next microtubule-binding site 16.4 nm away. Hence, the mechanochemical cycle can be broken down into two mechanical states: a 2HB state in which both motor domains are positioned on microtubule-binding sites and a 1HB state in which one motor domain is bound to the microtubule and the other is positioned partway between adjacent microtubule-binding sites. Because only one motor domain is labeled, the durations of the two measured states are asymmetric—the time that the labeled head is bound to the microtubule includes the entire stepping cycle (1HB plus 2HB) of the unlabeled head plus the 2HB duration of the labeled head, whereas the second state measures only the 1HB duration of the labeled head. We therefore divide the two-step cycle that generates each 16.4-nm translocation of the gold nanoparticle into τlong, the waiting time preceding the first substep, and τshort, the waiting time preceding the second substep (Fig. 2A).
Fig. 2.
Mechanical transitions in the kinesin stepping cycle. (A) Schematic of two-step cycle with one head labeled, which generates a total 16.4-nm translocation of the motor. Each long plateau duration includes two 2HB states and one 1HB state, and each short plateau duration includes one 1HB state. (B) Example trace at saturating ATP with τlong colored black and τshort colored red. (C) Cumulative density functions for a population of n = 223 τlong and n = 239 τshort measurements. Solid lines show an exponential distribution generated from the mean of τshort (χ2 = 6.1, P = 0.73, df = 9) and a gamma function with shape parameter 3 generated from the mean of τlong (χ2 = 9.8, P = 0.28, df = 8). For investigation into substep plateau standard deviations, see Fig. S6.
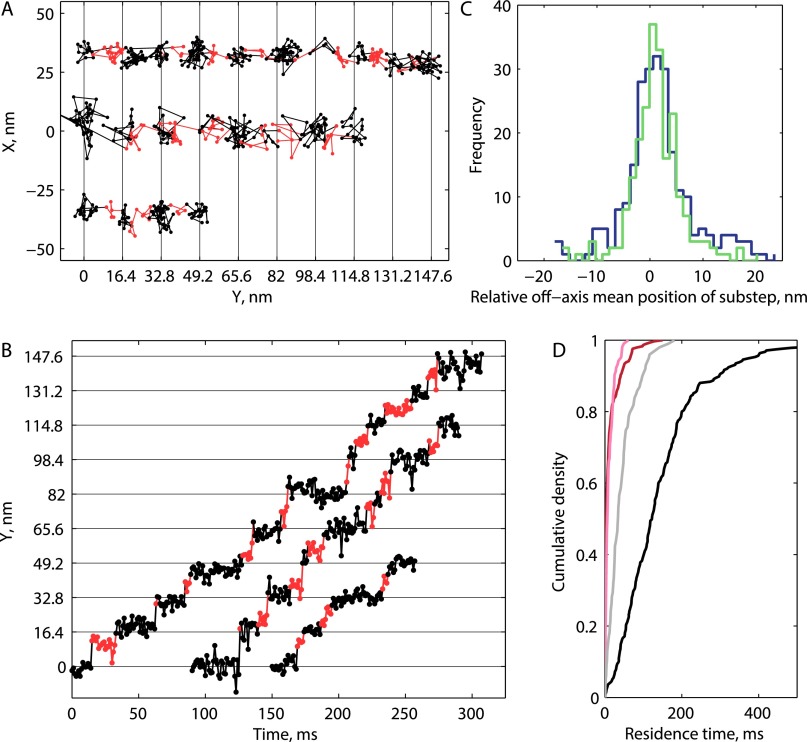
To preserve the phase of alternating substeps along processive runs, a two-state hidden Markov model (HMM) was designed and the Viterbi algorithm was used to return the most likely sequence of states in a given run (23, 30). Each 16.4-nm translocation was thereby divided into τlong and τshort. An example trace with τlong and τshort indexed by black and red coloring, respectively, is shown in Fig. 2B (additional traces in Fig. S5). In most cases, there was no mean displacement in the off-axis position between long and short plateaus (Fig. S5). The distributions for n = 223 τlong measurements and n = 239 τshort measurements from 27 traces are shown in Fig. 2C. τshort follows an exponential distribution (red line in Fig. 2C), consistent with it containing one rate-limiting step, whereas τlong follows a gamma distribution with shape parameter 3 (gray line in Fig. 2C), consistent with it containing three similar rate-limiting steps. Using population means, we found that τ1HB = τshort was 8.0 ± 0.5 ms and was 7.8 ± 0.5 ms, or that kinesin spends approximately equal durations in each mechanical state. The sum of these state durations (15.8 ms) matches the total cycle time calculated from the weighted mean velocity of all of the traces of 530.6 ± 28.1 nm s−1 (Fig. S1), or 15.5 ± 0.8 ms per 8.2-nm step.
Fig. S5.
Additional HMM fitting data. (A and B) Three example traces at 1 mM ATP with τlong (black) and τshort (red) indexed by color in XY space (A) and time versus position along the microtubule axis (B). The state space constructed for the HMM requires entry into a τshort before entering the next τlong, so in instances where substeps are missed, a single point from an adjacent plateau is taken as the τshort that best fits the data. (C) Distribution of displacements perpendicular to the microtubule for each τshort plateau relative to the mean position in the preceding τlong plateau for every detected step at 1 mM ATP (blue) and 1 µM ATP (green). Most substeps had no associated perpendicular displacement, means ± SD are 1.0 ± 6.2 nm (n = 239) for 1 mM and 0.6 ± 4.4 nm (n = 217) for 1 µM. A rightward (positive) bias might be expected given that the NL docks on the right side of the motor domain when viewed from above, but that result is not prominent. The perpendicular displacement should vary depending on which protofilament the motor is walking on, which cannot be controlled experimentally, and thus a lateral bias of the tethered head is not rigorously ruled out by the data. (D) The cumulative density functions for the entire population of τshort (pink for 100 µM; red for 10 µM) and τlong (gray for 100 µM; black for 10 µM) phases, showing relatively constant τshort and τlong that vary with ATP.
Fig. S6.
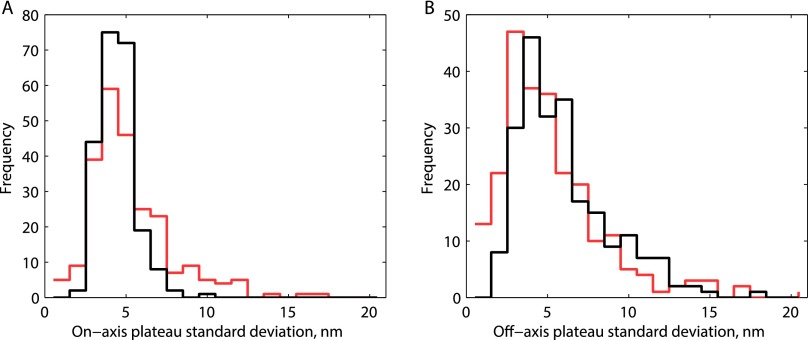
Comparison of apparent flexibility of bound versus tethered heads at 1 mM ATP. For each τlong or τshort plateau called by the HMM algorithm, the SD parallel and perpendicular to the microtubule axis was calculated. Increased diffusional excursions of the tethered head are expected to increase the positional SD for the short plateaus. (A) Distributions of SDs in the dimension parallel to the microtubule for τlong (black; 4.0 ± 0.1 nm, mean± SEM; n = 223) and τshort (red; 4.8 ± 0.2 nm, mean± SEM; n = 239) plateaus. (B) Distribution of SDs in the dimension perpendicular to the microtubule for τlong (black; 5.5 ± 0.2 nm; n = 223) and τshort (red; 4.8 ± 0.2 nm, mean ± SEM; n = 239) plateaus. Thus, an increase is observed for the on-axis displacements but not for the off-axis displacements, and in both cases, the differences are small.
Kinesin Waits for ATP with 2HB.
To address the question of where the rear head is positioned during the ATP-waiting state, we repeated the 1,000 frames per second tracking assay at reduced ATP concentrations. We justified use of the HMM for fitting step durations by first showing that substeps are still detected in reduced ATP using the model-free step-finding algorithm (Fig. S2). τlong and τshort were measured as before, with the hypothesis that both plateau durations would increase if the motor waits for ATP in the 1HB state, whereas only τlong would increase if the motor waits for ATP in the 2HB state (Fig. 2A). As shown in Fig. 3 A–C, τlong was significantly extended at 10 and 100 µM ATP, whereas τshort was unaffected, consistent with kinesin waiting for ATP in the 2HB state. The plateau durations were decomposed into the 1HB and 2HB durations using τ1HB = τshort and as previously (Fig. 2A), and τ1HB and τ2HB were plotted as a function of ATP (Fig. 3D). τ1HB showed a weak dependence on ATP concentration, whereas the ATP dependence of τ2HB was well fit by a Michaelis–Menton model with a fit of 40.7 µM, in agreement with the ATP dependence of kinesin-1 velocity and ATPase reported previously (2, 31, 32).
Fig. 3.
Kinesin waits for ATP in the 2HB state. (A and B) Example traces in XY space at 100 µM (A) and 10 µM ATP (B) taken at 1,000 frames per second, with τlong indicated in black and τshort indicated in red. (C) The same traces shown as position along microtubule versus time. (D) Population measurements for the duration kinesin spends in the 1HB (red) and 2HB (blue) states at different ATP concentrations. Error bars represent SEM (n = 233/239, n = 99/103, and n = 275/289 for τlong/τshort in 1 mM, 100 µM, and 10 µM, respectively), and the black line is a weighted fit to the Michaelis–Menton equation plus offset with = 40.7 ± 8.1 µM (fit weighted by inverse SEM, 95% confidence intervals).
At very low (1 µM) ATP concentrations, where ATP waiting dominates the step duration, a mixture of 1HB and 2HB ATP-waiting states was observed (Fig. S7A). These results were well described by a model (SI Text) in which the motor, when forced to wait long times for the arrival of ATP, transitions from a 2HB to a 1HB ATP-waiting state at a rate of 1.9 s−1 (Fig. S7B). The best fit to the heterogeneous τshort and τshort data were achieved by incorporating different ATP affinities in the 2HB and 1HB states, with fit values =39 µM and =23 µM. The 2HB ATP affinity closely matches the value measured at higher ATP (Fig. 3D), whereas the 1HB ATP affinity is consistent with a model in which pulling the neck linker (NL) backward reduces the ATP affinity of the front head.
Fig. S7.
Rear-head detachment at very low ATP concentration. (A) Example traces at 1 µM ATP and 1,000 frames per second, including instances of both short and long substeps; x-axis tick marks represent 15 nm. All data are shown in gray, and 5-ms median boxcar-filtered data are shown in black (τlong) and red (τshort). Down-sampled data were used for HMM analysis. In some cases, multiple long substeps in series were seen (middle trace), and in other cases, a series of short substeps was observed (second half of the right trace), but there was no consistent behavior, and questions of hysteresis were not pursued further. (B) At 1 µM ATP, the cumulative density function of n = 217 measurements of τshort (red circles) followed a biexponential, whereas n = 185 measurements of τlong (black circles) followed a gamma distribution with a noninteger shape parameter. A simple kinetic model, shown in C, was constructed to describe these data. An analytical expression of the model was fit to the τshort data, and full mechanochemical cycle simulations were performed using the fit parameters (see SI Text for full model and simulation details). Overlaid in B are cumulative density functions of simulated steps using best-fit parameters to a kinetic model using only a single Km (pink and gray dashed lines for τshort and τlong, respectively) and separate Km values for the 1HB and 2HB ATP waiting (dark red and gray solid lines for τshort and τlong, respectively). The parameter set that best describes the data are = 23 µM, = 39 µM, and = 1.9 s−1.
Kinesin Hydrolyzes ATP with 1HB.
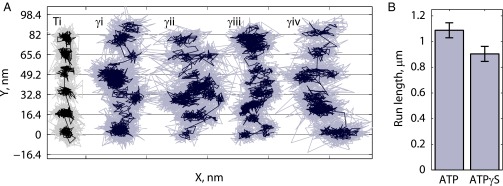
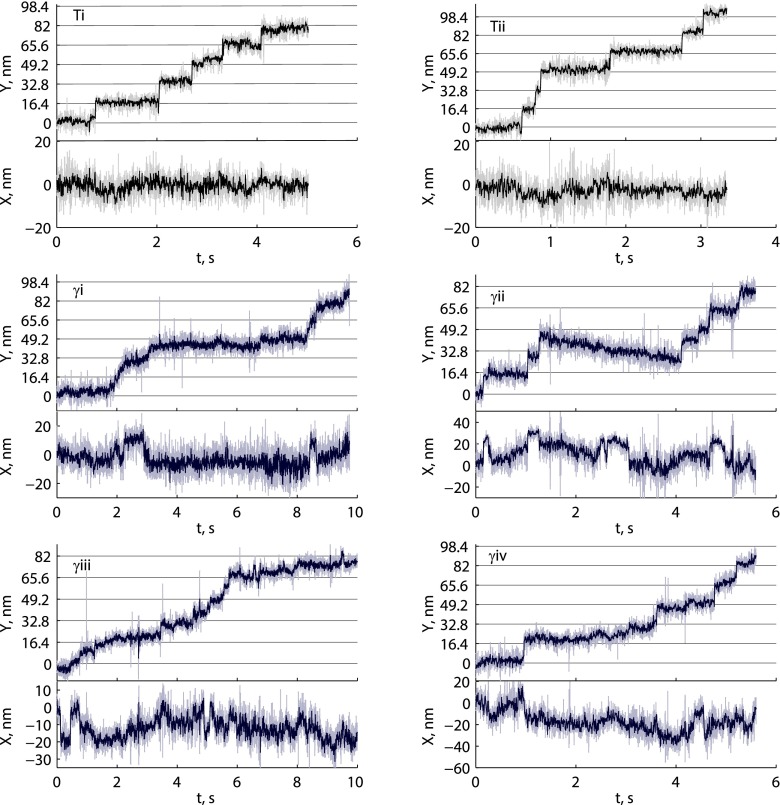
After defining that the transition from the 2HB to the 1HB state principally occurs after ATP binding, we set out to determine whether completion of the 16.4-nm step, which is marked by the return to the 2HB state, occurs before or after ATP hydrolysis. Single-molecule tracking assays were repeated at 1,000 frames per second using saturating concentrations of ATPγS, a slowly hydrolyzable ATP analog (19, 31, 33). Motor velocity at 1 mM ATPγS was 13.6 ± 1.0 nm s−1 (SEM; n = 33 runs), roughly equal to the velocity for 1 µM ATP (13.3 ± 0.8 nm s−1; n = 36 runs). The localization precision in ATPγS was also comparable to 1 µM ATP (1.8 ± 0.1 nm and 1.8 ± 0.2 nm, respectively). If hydrolysis occurs in the 2HB state, as might be expected if nucleotide binding was sufficient to dock the NL and enable binding of the tethered head (33, 34), the motor should reside overwhelmingly at microtubule-binding sites 16.4 nm apart and appear very similar to the 1 µM ATP traces. Surprisingly, the opposite was observed, as exemplified in Fig. 4A (time courses in Fig. S8)—the motor took highly variable steps, changes in position along the microtubule axis were gradual rather than sudden, and movements perpendicular to the microtubule axis without a simultaneous step along the microtubule were common. This behavior suggests that during the key transition that follows ATP binding by the bound head but precedes hydrolysis, the second head is in a tethered 1HB state that is flexible and can sample multiple positions.
Fig. 4.
High-resolution tracking of kinesin in saturating ATPγS. (A) Four representative traces showing the irregular stepping patterns observed in ATPγS (γi-γiv, blue) along with one trace in 1 µM ATP at left (Ti, black) for comparison; x-axis tick marks represent 50 nm. Traces γi and γiii are 10 s long, and traces Ti, γii, and γiv are 5–6 s long. All data (1,000 frames per second) are shown in lighter color, and the 5-ms median boxcar filter of data is shown in darker color. Multiple distinct positions were measured per 16.4-nm translocation, in contrast to the expectation that the motor would reside overwhelmingly on microtubule binding-site positions if hydrolysis occurred with 2HB. For further analysis of traces, see Fig. S8. (B) Run-length measurements for Qdot-labeled K560-AviN in saturating ATP (n = 299) and ATPγS (n = 283).
Fig. S8.
Tracking data in saturating ATPγS at 1,000 frames per second. Here Y corresponds to positions along the microtubule axis, and X corresponds to the position perpendicular to the microtubule axis. Traces Ti and Tii are 1 µM ATP traces, shown for reference. Trace γi-iv correspond to the XY traces in Fig. 4A. The steps in ATPγS starkly contrast steps in 1 µM, where relatively sudden 16.4-nm steps were observed. In ATPγS, there are gradual movements in Y, as well as apparent steps smaller than 16.4 nm. The X position shows switching between discrete positions that do not always synchronize with movements in the Y position, which is only possible if the labeled head is free. Note the difference in X-scaling between examples.
We next examined processivity in ATPγS . If hydrolysis can occur in either a 1HB or 2HB state, then run length should increase in ATPγS because the tethered head would have a much greater chance to bind before the bound head hydrolyzes its nucleotide and enters a vulnerable 1HB posthydrolysis state (19). The opposite was observed—in single-molecule Qdot-tracking experiments, run lengths were slightly shorter in saturating ATPγS than in saturating ATP (Fig. 4B).
Independent Measurement of a Long 1HB State by Stopped-Flow.
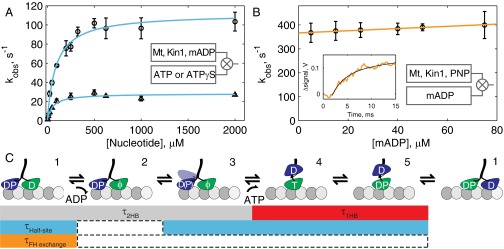
The results at saturating ATP (Fig. 2) show that kinesin spends approximately half of each step in a 1HB state, starkly contrasting current models based on step measurements from optical trapping (21, 22). To confirm the single-molecule results, as well as to help constrain rate-limiting steps in the mechanochemical cycle, we carried out ensemble biochemistry experiments using stopped-flow spectrofluorometry. Half-site ADP release experiments were first performed by flushing varying ATP concentrations against microtubule-bound dimer motors incubated in 2′(3′)-O-(N-methylanthraniloyl)adenosine 5′-diphosphate (mADP). The maximal ATP half-site release rate, which includes all states from ATP binding to mADP release, was 112 s−1 (Fig. 5A), in agreement with literature values (33, 35, 36). Next, to estimate the mADP release rate, we measured mADP-exchange kinetics in the front head when motors are locked onto microtubules in a 2HB state with adenylyl imidodiphosphate (AMP-PNP) (14, 15, 37, 38). By performing linear regression to the mADP dependence of kobs, we estimate a mADP off-rate of 367 s−1 (Fig. 5B). Comparison of this mADP off-rate with the maximal ATP half-site release rate (see block diagram in Fig. 5C) yields a purely biochemical calculation of the 1HB state duration of 6.3 ms, in good agreement with the 8.0 ms from single-molecule measurements.
Fig. 5.
Ensemble biochemistry and mechanochemical cycle for kinesin. (A) Nucleotide half-site release kinetics with Michaelis–Menten fit for ATP (circles; Km = 90.4 ± 20.6 µM, Vmax = 111.7 ± 8.8 s−1) and ATPγS (triangles; Km = 55.4 ± 22.1 µM, Vmax = 28.7 ± 2.7 s−1). (B) Front-head mADP-exchange kinetics under strain in AMP-PNP–locked motor–microtubule complexes. Linear fit (R2 = 0.98) to kobs = kon[mADP] + koff yields koff = 367 ± 4 s−1 and kon = 0.46 ± 0.08 µM−1 s−1. (Inset) Example stopped-flow transient at 75 µM mADP with fit to biexponential. All error bars are SEM, and all fits are weighted by inverse SEM. (C) Mechanochemical cycle of kinesin-1 in saturating ATP, with the block diagram showing the sequence of states measured in the single-molecule and ensemble experiments. The 2HB duration involves ADP release from the front head (1→2), followed by a transition to the 2HB ATP-waiting state (2→3), which we tentatively define as detachment of the rear head to a weak-binding intermediate with no associated displacement but possibly involving phosphate release. Binding of ATP (3→4) marks the transition to the 1HB state and is followed by ATP hydrolysis (4→5) and tethered head attachment (5→1) to return to the 2HB state. In the half-site mADP-release experiment, the motor starts in an ATP-waiting state similar to 3 (see Fig. S9 for further details) and completes the entire cycle, save for the final transition back into the ATP-waiting state (2→3). The mADP off-rate in the front head-exchange experiment directly measures 1→2. Calculation of rates by subtraction, made visible by comparing rows in the block diagram, yields an independent estimate of 6.3-ms 1HB duration at saturating ATP from biochemical experiments, in agreement with the 8.0-ms estimate from the single-molecule data.
Finally, to better understand the divergent stepping behavior in ATPγS, half-site mADP release experiments were repeated using ATPγS. A maximal rate of 28.7 s−1 was measured (Fig. 5A), consistent with previous measurements (33). Interestingly, this rate was ∼20-fold higher than the 1.35 s−1 single-molecule stepping rate in ATPγS, indicating that significant off-pathway events such as side steps must be available from state 4. This rate was also fourfold slower than the ATP half-site rate and twofold slower than the stepping rate in ATP, indicating that a 1HB exit without hydrolysis is kinetically inconsistent with the measured stepping rate.
SI Text
Image Analysis, Trace Preparation, and Step Finding for Gold Nanoparticle Tracking.
Images were collected using custom LabVIEW software (National Instruments), and a background subtraction of all static scatters was performed in MATLAB (MathWorks) as previously described (24, 25). Isolated point-spread functions were fit using FIESTA (28) to return subdiffraction limited measurements of nanoparticle X and Y position over time. Localization precision was determined by the error of this fitting. Traces were split into linear sections if microtubules were not fully linear to start and rotated to minimize the SD in the direction perpendicular to the track. The resulting position data along the microtubule axis was used for step finding. The plateau SD, estimated using pair wise differences, was used as the best estimator of the inherent experimental noise in the traces:
where x is a vector of length N that represents the position data along the microtubule axis. To account for relatively fast steps that separated plateau regions, iterative pairwise-difference outlier removal was used (removing pairwise differences greater than 3σ from the mean; see supplemental materials in ref. 29 for further details).
For the model-free analysis used for building step size distributions, a t test based step-finding algorithm was used [tDetector; described in detail by Chen et al. (29)]. Given an input time series of length N, the algorithm essentially performs N-1 (for each possible partitioning of the data) two-sample t tests and then declares a new step at the index yielding the most significant difference of means, thus creating two new plateaus (if none of the t tests were significant, then no step is declared). This process is repeated on each new plateau until no new statistically significant steps can be added.
For estimating durations of alternating long and short plateau regions, a two-state HHM was used. The nanoparticle was modeled as a Gaussian emitter with true positions set at intervals of 8.2 nm and SDs set by the measured plateau SD. An emission matrix E was constructed using these step and substep positions, and the 16.4-nm multiples were allowed to “breathe” up to 2 nm from the rigid register:
Here, L represents a whole-trace translation that was applied to align the register with the experimental data. This value was found by rounding each point in the experimental data to the nearest integral multiple of 16.4 and selecting the value of L that minimized root-mean-square error (RMSE) between the rounded data and the unmodified data. Each of the n-by-16.4-nm full-step positions were then individually translated up to 2 nm in either direction, , based off of minimizing the RMSE between the true and rounded data. This “breathing” helped account for inherent experimental error in position detection as well as any possible stage drift, and minimized any overestimation of the substep durations. A transition matrix was constructed to only allow transitions to the next 8.2-nm multiple or to remain in the same position. The emission matrix, transition matrix, and experimental data were used as input to the Viterbi algorithm (30), which returned the most likely sequence of hidden states. Points of state transition were used to call boundaries of long and short phases. Not all traces used in the tDetector traces were amenable to fitting (about 30% rejected), either because of backsteps, areas of high error, or anything else that led to a loss in register of the major 16.4-nm spacing.
Kinetic Model and Simulations for 1 µM ATP Data.
The empirical cumulative density function of τshort at 1 µM was fit using the following kinetic scheme, with , the first-order rate constant for ATP binding in the 2HB state at 1 µM ATP, and , the nucleotide-independent rear-head detachment rate as free parameters:
Here, from the mean of τshort at saturating ATP (assumes is infinitely fast), , and (here, is the maximal stepping rate of 64.6 s−1 from single-molecule results). This model assumes that dominates , such that the two-step process collapses to a single exponential. Initially, and were set to be equal, and the values for the free parameters that minimized RMSE with the empirical curve were chosen. Artificial steps were then simulated by drawing exponential random variables for each mechanochemical transition with means set at the experimentally measured or fit value. Summation of the transitions into 1HB or 2HB was set as a competition between drawn values of and :
where was set to 1 ms, and was set to 6.8 ms based on single-molecule measurements of compared with the half-site release rate in ATP; 10,000 total steps were generated. Finally, was set to be every even-indexed value of , and was set to be the sum of two sequential draws of plus the draw of in between them.
For the second round of fitting, the 1HB and 2HB ATP-waiting times were not forced to be equal, which resulted in three free parameters: , , and . An arbitrary value was assigned to , the entire process of fitting to the analytical curve and simulation was repeated, and the RMSE between the simulated and the empirical data for was calculated. This was repeated for many values of , and the parameter set that minimized RMSE for the data were chosen. All simulation and fitting work was performed in MATLAB.
Substep Simulations and Step Finding.
Substep simulations were performed to verify model-free step-finding results and to test the spatial and temporal resolution necessary to resolve substeps of designed duration. Values of were generated as exponential random numbers with a mean of 8 ms. Values of were generated as a sum of three exponential random values, each with a mean of 8 ms for the 1 mM ATP case, and with one 8 ms and two with 8 ms plus the calculated ATP-waiting time for the 10 µM ATP case. Distance values starting at 0 nm were generated at a specified frame rate, and a Gaussian random number with mean 0 and a specified SD was added at each time point. When the summed time since the last event exceeded the current random value of , 8.2 nm was added to the distance vector. The clock was then reset, and distance values were generated with white noise until the sum time exceeded the current random value for , at which point, 8.2 nm was added to the distance vector. This process was repeated for 1,000,000 points in the distance vector. Step finding with the tDetector algorithm was then performed on the distance vector, and the mean step size was reported.
Discussion
In the standard model of the kinesin hydrolysis cycle, ATP binding drives NL docking, swinging the tethered head forward toward the next binding site (34, 39, 40). Optical trapping studies visualize discrete 8.2-nm steps, and previous single-molecule tracking studies visualized 16.4-nm steps without substeps, which together suggest that kinesin spends the vast majority of time with both heads centered at microtubule-binding sites at saturating ATP (4, 11, 21, 22). The single-molecule tracking data presented here conflicts with the current consensus in three ways: (i) at saturating ATP, kinesin-1 spends half of each cycle with one head unbound and positioned between microtubule-binding sites; (ii) ATP binding occurs when kinesin is in a state resembling a 2HB state; and (iii) ATP binding alone is insufficient to complete the powerstroke under normal conditions. Overall, these data motivate a new way of thinking about how kinesin-1 takes steps and help resolve a number of conflicting reports in the literature.
Detection of Substeps at Saturating ATP.
By using iSCAT and gold nanoparticle labeling, we were able to detect substeps across a range of ATP concentrations that were not detected in previous N-terminal head-tracking experiments (4, 11, 12). Substep detection requires low positional variance in the plateau regions relative to the size of the substep, as well as sufficient temporal resolution to capture the fast intermediate plateau (τshort) that separates longer plateaus (τlong). We show through simulations that substeps generated using the signal-to-noise achieved in this study can be properly detected by a step-finding algorithm, whereas substeps generated with a signal-to-noise corresponding to the best available resolution from fluorescence experiments (11) or with reduced frame rates are missed and only 16.4-nm steps are detected (Fig. S4).
Optical trapping studies with C-terminal labeled motors, which have the highest spatiotemporal resolution to date, have ruled out intermediate positions between 8-nm steps having durations longer than 30 µs (21, 22). Substeps were also not detected in high-resolution C-terminal tracking experiments under zero load (8–10). One way to reconcile these studies with the substep measured here is to posit that the position of the coiled-coil is determined by the bound head when the motor is in the 1HB state and the front head when the motor is in the 2HB state. Additionally, Guydosh and Block showed that forces as low as 0.4 pN applied to a single labeled head are sufficient to fully extend a tethered intermediate either forward or backward, providing an explanation as to why the substeps observed here are not seen under load (12).
To support our single-molecule measurement of a 8.0-ms duration substep, we independently estimated the duration of the 1HB state by ensemble biochemistry techniques and obtained an estimate of 6.3 ms. A similar 1HB state with a duration of 3 ms at saturating ATP was identified by Verbrugge et al. using autocorrelation analysis of FRET fluctuations (17). We attribute the different durations to the differing experimental approaches and different constructs used (N-terminal AviTag-tagged Drosophila wild-type versus Cys-modified human kinesin-1). It was recently shown that for Cys-lite kinesin-1 constructs, the force-velocity profile and the ability to take backsteps under hindering loads differ significantly from wild type (41), suggesting possible deviations in the mechanochemical cycle.
The Conformation of the ATP-Waiting State Varies with [ATP].
There is disagreement in the literature of whether the trailing head detaches before ATP binds to the front head or whether ATP binds in the 2HB state, followed by trailing head detachment. Interhead strain in the 2HB state is thought to slow binding of ATP to the front head and accelerate detachment of the trailing head (21, 42–46), leading to a model in which the trailing head detaches before ATP binds to the leading head. In support of this model, single-molecule fluorescence studies have found that the fraction of time the motor spends in a 1HB state falls with increasing ATP concentrations (14, 15). In contrast, single-molecule tracking studies with a probe on one head (4, 11) and biochemical measurements of the reversal of ATP hydrolysis in dimeric kinesin (18) suggest a model in which ATP binding occurs when the motor is predominantly in a 2HB state. This question is important because a 1HB ATP-waiting state implies a ratchet-like mechanism in which the tethered head diffuses freely until its forward conformation is stabilized by ATP binding and NL docking. In contrast, a 2HB ATP-waiting state implies a powerstroke-like mechanism in which detachment of the trailing head is triggered by a conformational change in the leading head that occurs when its NL is pulled backward to accommodate the 2HB state and presumably unable to dock.
We found that at ATP concentrations down to 10 µM, the ATP-waiting state was clearly identified as having both motor domains positioned on or above microtubule-binding sites (Fig. 3C). Thus, under normal conditions, ATP binding precedes complete detachment of the trailing head. However, at 1 µM ATP, where the motor steps at ∼2 s−1, we measured both short- and long-lived 1HB states (Fig. S7). The data were well fit by a model in which kinesin can transition to a 1HB ATP-waiting state at a rate of 1.9 s−1. Our data provide a mechanism to explain why single-molecule FRET and fluorescence polarization studies observe a 1HB waiting state at low nucleotide concentrations but not at saturating ATP (14, 15), whereas it is still possible to detect 16-nm steps even at low ATP (4, 11). A noteworthy implication of a 2HB ATP-waiting state is that kinesin’s first step, characterized by colliding with a microtubule while having ADP in both heads and subsequently releasing one, is unique from all steps that follow it (Fig. S9). Thus, in any experiment where the ATP-waiting state is preformed by incubation in low nucleotide concentrations, an ensemble of first steps alone will be measured, meaning the results may not be representative of the normal stepping cycle.
Fig. S9.
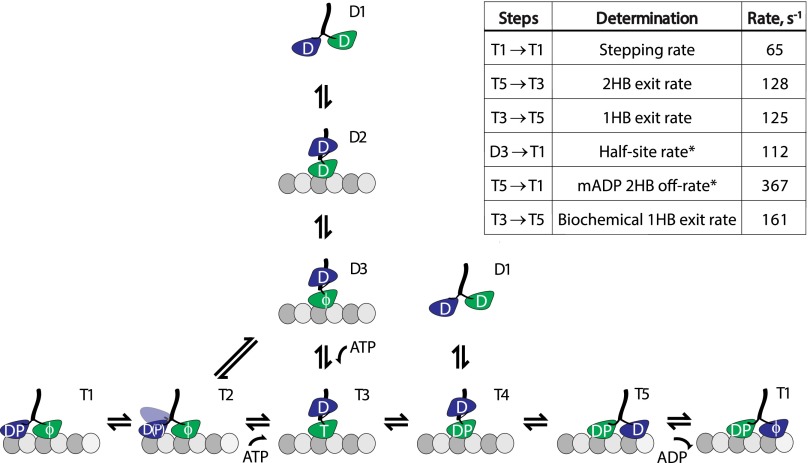
Full-microtubule interaction diagram for kinesin-1. Kinesin’s first step involves landing and ADP release (D1→D3), followed by ATP binding and exit from the 1HB state (T3→T5). Each subsequent step follows the T1→T5 pathway, with a 2HB ATP-waiting state (T2). Processivity is regulated at state T4, where a race occurs between detachment in the bound head (D1) versus attachment in the tethered head (T5). Nucleotide-independent rear-head detachment, observed in the current work only at very low ATP concentrations, follows T2→D3. It should be noted that in the half-site release experiment (Fig. 5A), ATP binding follows states D3→T3, whereas the normal stepping cycle at saturating ATP follows T2→T3. However, both transitions are expected to be very fast at saturating ATP. The inset chart tabulates rates measured in the current work. Asterisk signifies that T5→T1 involves mADP rather than unlabeled ADP release in those measurements. The biochemical T3→T5 1HB exit rate is calculated by subtracting the 2HB mADP off-rate from the half-site mADP-release rate; this process provides an independent determination of the 1HB duration to compare with the value measured in the single-molecule experiments.
Hydrolysis Accelerates Completion of the Powerstroke.
Another debated issue is whether hydrolysis occurs before or after the tethered head binds to the next binding site on the microtubule. Forced unbinding, fluorescence polarization microscopy, and single-molecule FRET studies with the nonhydrolyzable ATP analog AMP-PNP all show that hydrolysis is not required for the motor to enter a 2HB state (14, 15, 33, 37, 47). However, in stopped-flow experiments, AMP-PNP and ATPγS in wild-type motors and ATP in a hydrolysis mutant all trigger release of ADP from a tethered intermediate at a rate of about 30 s−1 (Fig. 5A) (20, 33). This rate is fourfold slower than the release rate measured using ATP (Fig. 5A) (33) and is twofold slower than the stepping rate (Fig. S1), strongly suggesting that under physiological conditions, hydrolysis occurs before tethered head attachment. Milic and coworkers recently showed that processivity under assisting load is not increased in ATPγS but is increased by adding phosphate to the media, in support of ATP hydrolysis occurring before tethered head attachment (19, 41). We extend that result by showing that in a zero-load assay the run length in ATPγS is not higher than the run length in ATP (Fig. 4B), and we further show that the position of the motor domain while waiting to hydrolyze ATPγS is not predominately localized on microtubule-binding sites like it is while waiting for ATP (Fig. 4A).
Our results are most consistent with a two-step model of the powerstroke in which ATP binding only partially docks the NL and hydrolysis completes docking to accelerate tethered head attachment (19, 41, 48). This model contrasts with the conventional model of ATP binding driving full NL docking (34, 39). Structural support for the conformational changes that enable NL docking upon ATP binding, either by clamshell-like closure of the “nucleotide cleft” and the associated opening of the “docking cleft” via rotation of the N-terminal subdomain (49) or by reorientation of switch I/II and P-loop subdomains (50), come from comparisons of the no-nucleotide structure to the ADP-aluminum fluoride (ADP-AlFx) structure. If the ADP⋅AlFx structures actually represent the ADP⋅Pi state (19, 51, 52) rather than the ATP state [which is further supported by the low tethered head resolution from cryo-EM in AMP-PNP (53)], our data are in full agreement with these structural analyses. A two-step powerstroke is also consistent with the N-terminal strand forming a bundle with the NL that stabilizes its forward-biased state (54, 55); our data suggest that neck-cover bundle formation at a rate necessary to match physiological stepping rates requires hydrolysis.
Rate-Limiting Steps in the Hydrolysis Cycle.
Randomness measurements from optical trapping experiments suggest that there are two rate-limiting steps in the hydrolysis cycle at saturating ATP (2). The finding here that the 1HB and 2HB states are of approximately equal duration at saturating ATP is consistent with there being one rate-limiting step in each. Our data enable us to define the sequence of mechanochemical transitions that make up the ATP hydrolysis cycle and to constrain the rate-limiting steps (Fig. 5C). The duration the motor spends in the 1HB state comprises the time it takes for ATP hydrolysis plus the time it takes for tethered head attachment. As τ1HB follows an exponential distribution (Fig. 2C), one of these rates is expected to dominate. Burst hydrolysis rates ranging from 50 s−1 to over 500 s−1 have been reported from acid-quench experiments on kinesin-1 (20, 56, 57); hence, this parameter is not tightly constrained by the literature. The measured 1HB time sets a lower limit of 125 s−1 for the hydrolysis rate, but the rate of tethered head attachment is unknown. The question of whether ATP or ADP⋅Pi is the predominant species in the bound head during the 1HB state is important because the duration of the 1HB ADP⋅Pi state is expected to determine processivity (19, 41), and it is reasonable to expect that this parameter is tuned differently in noncanonical kinesins that carry out different cellular tasks than kinesin-1 (45).
Candidates for the rate-limiting step in the 2HB state include ADP release by the tethered head, the transition to the ATP-waiting state, and ATP binding (Fig. 5C). Direct measurements of the mADP off-rate here (Fig. 5B) and in previous studies (57) support this rate being very fast. ATP binding is also expected to be very fast at saturating ATP. Hence, the rate-limiting step in the 2HB state is the transition into the 2HB ATP-waiting state (state 2→3 in Fig. 5C). Based on our data, this transition involves the trailing head entering a weakly bound state that is centered on the trailing tubulin-binding site and the front head becoming competent to bind ATP. This transition likely involves phosphate release by the trailing head, and the ability of the front head to bind ATP may result from relief of interhead tension, but these details go beyond our current data.
In the cell, the high velocity, stall force, and processivity of kinesin-1 contribute to its ability to traffic cargo toward the periphery. The mechanochemical cycle defined here by real-time observation of conformational changes in processive kinesin-1 dimers helps to explain the mechanism underlying these distinct biophysical properties. Other processive motors such as dynein and myosin-V couple their chemical and mechanical transitions in different ways than kinesin, and it is expected that kinesins having different intracellular roles will use different mechanochemical tuning. Application of the methods established here to the diverse kinesin superfamily and other protein machines will further our understanding of how cells tune their moving parts.
Materials and Methods
Protein Preparation.
The K560-AviN construct was made by adding the biotin ligase consensus sequence (AviTag) GLNDIFEAQKIEWH (Avidity) as well as two glycine residues for flexibility directly after the start codon in Drosophila kinesin-1 truncated at amino acid 560. A C-terminal 6× His tag was also inserted directly before the stop codon. For the K560-AviC construct, the AviTag was placed directly upstream of the 6× His tag, and the two glycine residues were placed upstream rather than downstream of the AviTag. All insertions were carried out using Q5 site-directed mutagenesis (New England Biosciences). Motors were expressed polycistronically with BirA biotin ligase (Avidity), in BL21(DE3) (New England Biosciences), and 0.5 mM biotin was added to the LB media at induction. Affinity chromatography and buffer exchange were carried out as descried previously (46). Final motor concentration was measured by absorbance at 280 nm. Biotinylation efficiency was tested using a colorimetric 4′-hydroxyazobenzene-2-carboxylic acid (HABA) assay (Sigma) and found to have a maximum of 0.2 biotin per kinesin head, which minimizes the probability of kinesin dimers with biotin on both heads.
Single-Molecule Experiments.
Single-molecule in vitro experiments were carried out using a custom-built iSCAT microscope (25, 26). Coverslips were washed thoroughly with deionized (DI) water, then incubated in 1% Hellmanex III (Helma), washed with methanol and again with DI water, and blown dry. Taxol-stabilized microtubules, prepared as in ref. 46, were immobilized on the glass surface by first introducing 0.2 mg/mL casein, then adsorbing a rigor (Switch I) mutant of full-length Drosophila kinesin-1 (R210A) to the surface, and finally introducing microtubules, which bound strongly and irreversibly to the rigor mutant (20). Imaging solution contained 0.5 mg/mL casein, 10 µM taxol, 20 mM glucose, 20 µg/mL glucose oxidase, 8 µg/mL catalase, 0.2 mg/mL BSA, 1:200 β-mercaptoethanol, and nucleotide in BRB80 (80 mM Pipes, 1 mM EGTA, 1 mM MgCl2; pH 6.8). Biotinylated motors were incubated with streptavidin-coated 30-nm gold nanoparticles (BBI Solutions) on ice for 30 min at a final concentration of 300 pM of each in the imaging solution and added directly to the flow cell. For 1 µM ATP and 1 mM ATPγS experiments, 1,200 pM motor to 300 pM 30-nm gold were used. Motor concentrations by absorbance represent an extreme upper limit of the concentration of active, biotinylated motors, and the single-molecule landing rate showed a linear relationship up to 6:1 motor-to-gold ratio, justifying the use of these molar ratios with the expectation of only one motor per nanoparticle. In some cases, AMP-PNP was used to first lock the motors onto the immobilized microtubules before switching to ATP to maximize the number of observable motile events. In the 200- and 400-frames-per-second traces, microtubules were adhered to the surface by short treatment (<30 s) with 0.5% glutaraldehyde. This method was less effective at stabilizing microtubules and most likely explains the increase in plateau SD.
For controls and run-length measurements, Qdots (Q565 Qdots; Life Technologies) were used instead of gold nanoparticles. Motors and Qdots were incubated at a final concentration of 100 pM each, and flow cell construction and microtubule immobilization were identical. Qdot imaging was performed with a Nikon TE2000 inverted microscope set up for total internal reflection using an 80 mW Argon laser (Spectra Physics). Movies were recorded using a Cascade 512 EMCCD camera (Roper Scientific) and MetaVue software (Molecular Devices) at 10 frames per second. Qdot positions were determined by Gaussian fitting to moving point-spread functions using FIESTA software (28). Velocity was calculated by linear fitting to the distance over time trajectories. Traces with obviously curved trajectories were not included, and a threshold of four points (400 ms) was set as the minimum for deciding whether or not a tracked object represented a processive run. Run length was determined by the total distance traveled. For ATPγS, run lengths below the minimum average measurement for ATP, 212 nm, were excluded. Velocity for a population was calculated as a weighted average using run lengths, because longer runs produced more confident linear fits:
where L and V represent run length and velocity, respectively, and N represents the number of traces obtained. All experiments were performed at 22–23 °C.
Ensemble Biochemistry.
All stopped-flow experiments were performed on an Applied Photophysics SX20 spectrofluorometer at 22–23 °C. Data acquisition and fitting were performed in Pro-Data SX software (Applied Photophysics). For the nucleotide half-site experiments, one syringe was filled with 2 µM microtubules, 10 µM taxol, 500 nM mADP, and 200–400 nM biotinylated K560-AviN in BRB80 buffer. This mixture created a motor–microtubule complex with 1HB to the microtubule in the apo state and the second head free and containing mADP (1). The second syringe was filled with ATP or ATPγS in BRB80. All concentrations shown in Fig. 5 show final nucleotide concentrations after mixing the contents of the two syringes. Excitation was set to 356 nm for the mADP nucleotide, and 450-nm emission was collected using an HQ480SP emission filter. An integration time of 1 ms was set for the photomultiplier tube. The fluorescence transient generated upon mixing was fit with a double exponential in the range of 1–500 ms, and the faster rate constant was reported. Each nucleotide concentration was measured three to five times, and the mean and inverse SEM were used to perform a weighted fit to the equation
with and as free parameters.
For the front-head nucleotide-exchange experiment, one syringe was filled with 7.5 µM microtubules, 10 µM taxol, 100 µM AMP-PNP, and 1 mM k406 in BRB80. The dimeric k406 construct, D. melanogaster kinesin-1 truncated at amino acid 406, was used because it could be prepared at higher concentration and also produced cleaner fluorescence transients. This mixture created a motor–microtubule complex with two heads bound, the rear head with AMP-PNP and the front head in the apo state (38). The second syringe was filled with varying mADP in BRB80. Excitation was set to 280 nm to measure FRET between tryptophan residues in the front head and mADP nucleotides (18). An integration time of 200 µs was set for the photomultiplier tube. The fluorescence transient generated upon mixing was fit with a double exponential in the range of 1.6–100 ms (lower bound was adjusted ±0.4 ms to account for the dead time on a per-trace basis; see Fig. 5B, Inset for example), and the faster rate constant was reported. Each mADP concentration was measured four to six times, and the mean and inverse SEM were used to perform a weighted fit to the equation
with and as free parameters.
For details on image analysis, trace preparation, step-finding algorithms, simulations and modeling, see SI Text.
Acknowledgments
We thank David Arginteanu for his help with protein preparation and purification, the laboratory of Randy Schekman for providing plasmids, and John Fricks and members of W.O.H.’s laboratory for helpful discussions. This work was funded by NIH Grant R01 GM076476 (to W.O.H.) and a European Research Council starting grant (NanoScope) (to P.K.). J.O.A. was supported by a scholarship from Consejo Nacional de Ciencia y Tecnología (Scholar 213546), and J.A. was supported by Marie Curie Fellowship 330215.
Footnotes
The authors declare no conflict of interest.
This article is a PNAS Direct Submission.
This article contains supporting information online at www.pnas.org/lookup/suppl/doi:10.1073/pnas.1517638112/-/DCSupplemental.
References
- 1.Hackney DD. Evidence for alternating head catalysis by kinesin during microtubule-stimulated ATP hydrolysis. Proc Natl Acad Sci USA. 1994;91(15):6865–6869. doi: 10.1073/pnas.91.15.6865. [DOI] [PMC free article] [PubMed] [Google Scholar]
- 2.Schnitzer MJ, Block SM. Kinesin hydrolyses one ATP per 8-nm step. Nature. 1997;388(6640):386–390. doi: 10.1038/41111. [DOI] [PubMed] [Google Scholar]
- 3.Coy DL, Wagenbach M, Howard J. Kinesin takes one 8-nm step for each ATP that it hydrolyzes. J Biol Chem. 1999;274(6):3667–3671. doi: 10.1074/jbc.274.6.3667. [DOI] [PubMed] [Google Scholar]
- 4.Yildiz A, Tomishige M, Vale RD, Selvin PR. Kinesin walks hand-over-hand. Science. 2004;303(5658):676–678. doi: 10.1126/science.1093753. [DOI] [PubMed] [Google Scholar]
- 5.Vale RD, Reese TS, Sheetz MP. Identification of a novel force-generating protein, kinesin, involved in microtubule-based motility. Cell. 1985;42(1):39–50. doi: 10.1016/s0092-8674(85)80099-4. [DOI] [PMC free article] [PubMed] [Google Scholar]
- 6.Ray S, Meyhöfer E, Milligan RA, Howard J. Kinesin follows the microtubule’s protofilament axis. J Cell Biol. 1993;121(5):1083–1093. doi: 10.1083/jcb.121.5.1083. [DOI] [PMC free article] [PubMed] [Google Scholar]
- 7.Svoboda K, Schmidt CF, Schnapp BJ, Block SM. Direct observation of kinesin stepping by optical trapping interferometry. Nature. 1993;365(6448):721–727. doi: 10.1038/365721a0. [DOI] [PubMed] [Google Scholar]
- 8.Schneider R, Glaser T, Berndt M, Diez S. Using a quartz paraboloid for versatile wide-field TIR microscopy with sub-nanometer localization accuracy. Opt Express. 2013;21(3):3523–3539. doi: 10.1364/OE.21.003523. [DOI] [PubMed] [Google Scholar]
- 9.Nan X, Sims PA, Xie XS. Organelle tracking in a living cell with microsecond time resolution and nanometer spatial precision. Chemphyschem. 2008;9(5):707–712. doi: 10.1002/cphc.200700839. [DOI] [PubMed] [Google Scholar]
- 10.Cappello G, Badoual M, Ott A, Prost J, Busoni L. Kinesin motion in the absence of external forces characterized by interference total internal reflection microscopy. Phys Rev E Stat Nonlin Soft Matter Phys. 2003;68(2 Pt 1):021907. doi: 10.1103/PhysRevE.68.021907. [DOI] [PubMed] [Google Scholar]
- 11.Toprak E, Yildiz A, Hoffman MT, Rosenfeld SS, Selvin PR. Why kinesin is so processive. Proc Natl Acad Sci USA. 2009;106(31):12717–12722. doi: 10.1073/pnas.0808396106. [DOI] [PMC free article] [PubMed] [Google Scholar]
- 12.Guydosh NR, Block SM. Direct observation of the binding state of the kinesin head to the microtubule. Nature. 2009;461(7260):125–128. doi: 10.1038/nature08259. [DOI] [PMC free article] [PubMed] [Google Scholar]
- 13.Reid E, et al. A kinesin heavy chain (KIF5A) mutation in hereditary spastic paraplegia (SPG10) Am J Hum Genet. 2002;71(5):1189–1194. doi: 10.1086/344210. [DOI] [PMC free article] [PubMed] [Google Scholar]
- 14.Mori T, Vale RD, Tomishige M. How kinesin waits between steps. Nature. 2007;450(7170):750–754. doi: 10.1038/nature06346. [DOI] [PubMed] [Google Scholar]
- 15.Asenjo AB, Sosa H. A mobile kinesin-head intermediate during the ATP-waiting state. Proc Natl Acad Sci USA. 2009;106(14):5657–5662. doi: 10.1073/pnas.0808355106. [DOI] [PMC free article] [PubMed] [Google Scholar]
- 16.Alonso MC, et al. An ATP gate controls tubulin binding by the tethered head of kinesin-1. Science. 2007;316(5821):120–123. doi: 10.1126/science.1136985. [DOI] [PMC free article] [PubMed] [Google Scholar]
- 17.Verbrugge S, Lansky Z, Peterman EJG. Kinesin’s step dissected with single-motor FRET. Proc Natl Acad Sci USA. 2009;106(42):17741–17746. doi: 10.1073/pnas.0905177106. [DOI] [PMC free article] [PubMed] [Google Scholar]
- 18.Hackney DD. The tethered motor domain of a kinesin-microtubule complex catalyzes reversible synthesis of bound ATP. Proc Natl Acad Sci USA. 2005;102(51):18338–18343. doi: 10.1073/pnas.0505288102. [DOI] [PMC free article] [PubMed] [Google Scholar]
- 19.Milic B, Andreasson JOL, Hancock WO, Block SM. Kinesin processivity is gated by phosphate release. Proc Natl Acad Sci USA. 2014;111(39):14136–14140. doi: 10.1073/pnas.1410943111. [DOI] [PMC free article] [PubMed] [Google Scholar]
- 20.Farrell CM, Mackey AT, Klumpp LM, Gilbert SP. The role of ATP hydrolysis for kinesin processivity. J Biol Chem. 2002;277(19):17079–17087. doi: 10.1074/jbc.M108793200. [DOI] [PubMed] [Google Scholar]
- 21.Block SM. Kinesin motor mechanics: Binding, stepping, tracking, gating, and limping. Biophys J. 2007;92(9):2986–2995. doi: 10.1529/biophysj.106.100677. [DOI] [PMC free article] [PubMed] [Google Scholar]
- 22.Carter NJ, Cross RA. Mechanics of the kinesin step. Nature. 2005;435(7040):308–312. doi: 10.1038/nature03528. [DOI] [PubMed] [Google Scholar]
- 23.Müllner FE, Syed S, Selvin PR, Sigworth FJ. Improved hidden Markov models for molecular motors, part 1: Basic theory. Biophys J. 2010;99(11):3684–3695. doi: 10.1016/j.bpj.2010.09.067. [DOI] [PMC free article] [PubMed] [Google Scholar]
- 24.Kukura P, et al. High-speed nanoscopic tracking of the position and orientation of a single virus. Nat Methods. 2009;6(12):923–927. doi: 10.1038/nmeth.1395. [DOI] [PubMed] [Google Scholar]
- 25.Ortega-Arroyo J, Kukura P. Interferometric scattering microscopy (iSCAT): New frontiers in ultrafast and ultrasensitive optical microscopy. Phys Chem Chem Phys. 2012;14(45):15625–15636. doi: 10.1039/c2cp41013c. [DOI] [PubMed] [Google Scholar]
- 26.Ortega Arroyo J, et al. Label-free, all-optical detection, imaging, and tracking of a single protein. Nano Lett. 2014;14(4):2065–2070. doi: 10.1021/nl500234t. [DOI] [PMC free article] [PubMed] [Google Scholar]
- 27.Andrecka J, et al. Structural dynamics of myosin 5 during processive motion revealed by interferometric scattering microscopy. Elife. 2015;4:e05413. doi: 10.7554/eLife.05413. [DOI] [PMC free article] [PubMed] [Google Scholar]
- 28.Ruhnow F, Zwicker D, Diez S. Tracking single particles and elongated filaments with nanometer precision. Biophys J. 2011;100(11):2820–2828. doi: 10.1016/j.bpj.2011.04.023. [DOI] [PMC free article] [PubMed] [Google Scholar]
- 29.Chen Y, Deffenbaugh NC, Anderson CT, Hancock WO. Molecular counting by photobleaching in protein complexes with many subunits: Best practices and application to the cellulose synthesis complex. Mol Biol Cell. 2014;25(22):3630–3642. doi: 10.1091/mbc.E14-06-1146. [DOI] [PMC free article] [PubMed] [Google Scholar]
- 30.Viterbi A. Error bounds for convolutional codes and an asymptotically optimum decoding algorithm. IEEE Trans Inf Theory. 1967;13(2):260–269. [Google Scholar]
- 31.Cohn SA, Ingold AL, Scholey JM. Quantitative analysis of sea urchin egg kinesin-driven microtubule motility. J Biol Chem. 1989;264(8):4290–4297. [PubMed] [Google Scholar]
- 32.Huang TG, Hackney DD. Drosophila kinesin minimal motor domain expressed in Escherichia coli. Purification and kinetic characterization. J Biol Chem. 1994;269(23):16493–16501. [PubMed] [Google Scholar]
- 33.Ma YZ, Taylor EW. Interacting head mechanism of microtubule-kinesin ATPase. J Biol Chem. 1997;272(2):724–730. doi: 10.1074/jbc.272.2.724. [DOI] [PubMed] [Google Scholar]
- 34.Rice S, et al. A structural change in the kinesin motor protein that drives motility. Nature. 1999;402(6763):778–784. doi: 10.1038/45483. [DOI] [PubMed] [Google Scholar]
- 35.Brendza KM, Sontag CA, Saxton WM, Gilbert SP. A kinesin mutation that uncouples motor domains and desensitizes the gamma-phosphate sensor. J Biol Chem. 2000;275(29):22187–22195. doi: 10.1074/jbc.M001124200. [DOI] [PMC free article] [PubMed] [Google Scholar]
- 36.Hackney DD. Pathway of ADP-stimulated ADP release and dissociation of tethered kinesin from microtubules. Implications for the extent of processivity. Biochemistry. 2002;41(13):4437–4446. doi: 10.1021/bi0159229. [DOI] [PubMed] [Google Scholar]
- 37.Asenjo AB, Krohn N, Sosa H. Configuration of the two kinesin motor domains during ATP hydrolysis. Nat Struct Biol. 2003;10(10):836–842. doi: 10.1038/nsb984. [DOI] [PubMed] [Google Scholar]
- 38.Chen G-Y, Arginteanu DFJ, Hancock WO. Processivity of the kinesin-2 KIF3A results from rear head gating and not front head gating. J Biol Chem. 2015;290(16):10274–10294. doi: 10.1074/jbc.M114.628032. [DOI] [PMC free article] [PubMed] [Google Scholar]
- 39.Rice S, et al. Thermodynamic properties of the kinesin neck-region docking to the catalytic core. Biophys J. 2003;84(3):1844–1854. doi: 10.1016/S0006-3495(03)74992-3. [DOI] [PMC free article] [PubMed] [Google Scholar]
- 40.Vale RD, Milligan RA. The way things move: Looking under the hood of molecular motor proteins. Science. 2000;288(5463):88–95. doi: 10.1126/science.288.5463.88. [DOI] [PubMed] [Google Scholar]
- 41.Andreasson JO, et al. Examining kinesin processivity within a general gating framework. eLife. 2015;4:e07403. doi: 10.7554/eLife.07403. [DOI] [PMC free article] [PubMed] [Google Scholar]
- 42.Rosenfeld SS, Fordyce PM, Jefferson GM, King PH, Block SM. Stepping and stretching. How kinesin uses internal strain to walk processively. J Biol Chem. 2003;278(20):18550–18556. doi: 10.1074/jbc.M300849200. [DOI] [PMC free article] [PubMed] [Google Scholar]
- 43.Klumpp LM, Hoenger A, Gilbert SP. Kinesin’s second step. Proc Natl Acad Sci USA. 2004;101(10):3444–3449. doi: 10.1073/pnas.0307691101. [DOI] [PMC free article] [PubMed] [Google Scholar]
- 44.Hancock WO, Howard J. Kinesin’s processivity results from mechanical and chemical coordination between the ATP hydrolysis cycles of the two motor domains. Proc Natl Acad Sci USA. 1999;96(23):13147–13152. doi: 10.1073/pnas.96.23.13147. [DOI] [PMC free article] [PubMed] [Google Scholar]
- 45.Muthukrishnan G, Zhang Y, Shastry S, Hancock WO. The processivity of kinesin-2 motors suggests diminished front-head gating. Curr Biol. 2009;19(5):442–447. doi: 10.1016/j.cub.2009.01.058. [DOI] [PMC free article] [PubMed] [Google Scholar]
- 46.Shastry S, Hancock WO. Interhead tension determines processivity across diverse N-terminal kinesins. Proc Natl Acad Sci USA. 2011;108(39):16253–16258. doi: 10.1073/pnas.1102628108. [DOI] [PMC free article] [PubMed] [Google Scholar]
- 47.Uemura S, et al. Kinesin-microtubule binding depends on both nucleotide state and loading direction. Proc Natl Acad Sci USA. 2002;99(9):5977–5981. doi: 10.1073/pnas.092546199. [DOI] [PMC free article] [PubMed] [Google Scholar]
- 48.Rosenfeld SS, Jefferson GM, King PH. ATP reorients the neck linker of kinesin in two sequential steps. J Biol Chem. 2001;276(43):40167–40174. doi: 10.1074/jbc.M103899200. [DOI] [PubMed] [Google Scholar]
- 49.Shang Z, et al. High-resolution structures of kinesin on microtubules provide a basis for nucleotide-gated force-generation. eLife. 2014;3:1–27. doi: 10.7554/eLife.04686. [DOI] [PMC free article] [PubMed] [Google Scholar]
- 50.Cao L, et al. The structure of apo-kinesin bound to tubulin links the nucleotide cycle to movement. Nat Commun. 2014;5(5364):5364. doi: 10.1038/ncomms6364. [DOI] [PubMed] [Google Scholar]
- 51.Phan BC, Cheung P, Stafford WF, Reisler E. Complexes of myosin subfragment-1 with adenosine diphosphate and phosphate analogs: Probes of active site and protein conformation. Biophys Chem. 1996;59(3):341–349. doi: 10.1016/0301-4622(95)00127-1. [DOI] [PubMed] [Google Scholar]
- 52.Fisher AJ, et al. X-ray structures of the myosin motor domain of Dictyostelium discoideum complexed with MgADP.BeFx and MgADP.AlF4- Biochemistry. 1995;34(28):8960–8972. doi: 10.1021/bi00028a004. [DOI] [PubMed] [Google Scholar]
- 53.Sindelar CV, Downing KH. An atomic-level mechanism for activation of the kinesin molecular motors. Proc Natl Acad Sci USA. 2010;107(9):4111–4116. doi: 10.1073/pnas.0911208107. [DOI] [PMC free article] [PubMed] [Google Scholar]
- 54.Khalil AS, et al. Kinesin’s cover-neck bundle folds forward to generate force. Proc Natl Acad Sci USA. 2008;105(49):19247–19252. doi: 10.1073/pnas.0805147105. [DOI] [PMC free article] [PubMed] [Google Scholar]
- 55.Hwang W, Lang MJ, Karplus M. Force generation in kinesin hinges on cover-neck bundle formation. Structure. 2008;16(1):62–71. doi: 10.1016/j.str.2007.11.008. [DOI] [PubMed] [Google Scholar]
- 56.Ma Y-Z, Taylor EW. Kinetic mechanism of a monomeric kinesin construct. J Biol Chem. 1997;272(2):717–723. doi: 10.1074/jbc.272.2.717. [DOI] [PubMed] [Google Scholar]
- 57.Auerbach SD, Johnson KA. Alternating site ATPase pathway of rat conventional kinesin. J Biol Chem. 2005;280(44):37048–37060. doi: 10.1074/jbc.M502984200. [DOI] [PubMed] [Google Scholar]


