Significance
A key remaining frontier in our understanding of biological systems is the “dark proteome”—that is, the regions of proteins where molecular conformation is completely unknown. We systematically surveyed these regions, finding that nearly half of the proteome in eukaryotes is dark and that, surprisingly, most of the darkness cannot be accounted for. We also found that the dark proteome has unexpected features, including an association with secretory tissues, disulfide bonding, low evolutionary conservation, and very few known interactions with other proteins. This work will help future research shed light on the remaining dark proteome, thus revealing molecular processes of life that are currently unknown.
Keywords: structure prediction, protein disorder, transmembrane proteins, secreted proteins, unknown unknowns
Abstract
We surveyed the “dark” proteome–that is, regions of proteins never observed by experimental structure determination and inaccessible to homology modeling. For 546,000 Swiss-Prot proteins, we found that 44–54% of the proteome in eukaryotes and viruses was dark, compared with only ∼14% in archaea and bacteria. Surprisingly, most of the dark proteome could not be accounted for by conventional explanations, such as intrinsic disorder or transmembrane regions. Nearly half of the dark proteome comprised dark proteins, in which the entire sequence lacked similarity to any known structure. Dark proteins fulfill a wide variety of functions, but a subset showed distinct and largely unexpected features, such as association with secretion, specific tissues, the endoplasmic reticulum, disulfide bonding, and proteolytic cleavage. Dark proteins also had short sequence length, low evolutionary reuse, and few known interactions with other proteins. These results suggest new research directions in structural and computational biology.
The Protein Data Bank (PDB) (1) of experimentally determined macromolecular structures recently surpassed 110,000 entries—a landmark in understanding the molecular machinery of life. Structure determination lags far behind DNA sequencing, but high-throughput computational modeling (2, 3) can leverage the PDB to provide accurate structural predictions for a large fraction of protein sequences. Thus, structural data now scale with sequencing, providing a wealth of detail about molecular functions.
Previous studies have surveyed all sequence and structure data to characterize the “protein universe” [i.e., all proteins from all organisms (4–8)]; from such surveys, we know much of the proteome comprises evolutionarily conserved domains matching relatively few 3D folds (4, 5). These surveys have focused on the “known” and on extrapolating progress toward complete knowledge of all folds in the protein universe. Such studies have guided structural genomics initiatives aimed at determining at least one PDB structure for each distinct fold (8–10).
Our work focuses on the structurally “unknown” (i.e., the fraction of the proteome with no detectable similarity to any PDB structure). We call this fraction the “dark proteome”; we believe that studying the dark proteome will clarify future research directions, as studies of dark matter have done in physics (11).
The analogy to dark matter has inspired surveys of other “unknown” properties of proteins; for example, Levitt (6) examined “orphan” protein sequences that do not match to known sequence profiles, which he termed the “dark matter of the protein universe,” and Taylor et al. (12) investigated the “dark matter of protein fold space” (i.e., theoretically plausible folds that have not been observed in native proteins). The same analogy has been used in studies of so-called “junk DNA” (13), which revealed a “hidden layer” of noncoding RNAs (14). Could surveying the dark proteome also reveal undiscovered biological systems?
In fact, discoveries have already resulted from studying regions of unknown structure, namely, intrinsically disordered regions. Long known to confound structure determination (15)—thus forming part of the dark proteome—disorder was largely ignored until recently (16) and yet is now known to play key functional roles, especially in eukaryotes (17). In addition, there is a second type of region that often has unknown structure and is associated with specific biological functions, namely, transmembrane segments (18). Thus, both disorder and transmembrane regions are “known unknowns” (i.e., we know that they are often “dark”). Could the dark proteome contain “unknown unknowns” (i.e., regions with specific functions that confound structure determination and that we are unaware of)?
To address this question, we need to map the dark proteome (i.e., determine all protein regions that cannot be modeled onto any PDB structure). Most available modeling datasets—collected in the Protein Model Portal (PMP) (2)—are not well suited because they aim for breadth of coverage, typically providing only a few PDB matches per protein. Mapping the dark proteome requires depth of coverage, such as the survey of Khafizov et al. (8). (Unfortunately, however, Khafizov et al. used only a few model organisms.) We recently announced Aquaria (19), which provides a median of 35 sequence-to-structure alignments for each Swiss-Prot sequence, a depth of structural data not available from other resources.
In this work, we used Aquaria to survey the dark proteome in unprecedented depth. We found most of the dark proteome cannot be readily accounted for and shows unexpected features.
Results and Discussion
Mapping the Dark Proteome.
We based our survey on 546,000 Swiss-Prot sequences (20). Although smaller than other databases [e.g., TrEMBL (21), which has >50 million sequences], Swiss-Prot is meticulously curated; each entry has many annotations and a high likelihood that it represents a native protein.
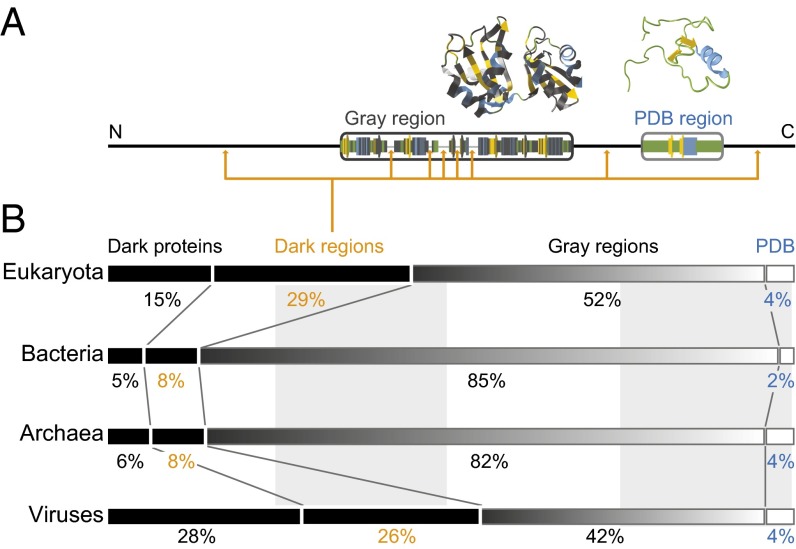
Fig. 1A shows how we mapped the dark proteome: for each Swiss-Prot sequence, each residue was categorized as “not dark” if it was aligned to a PDB entry in Aquaria (19) and as “dark” otherwise (SI Methods). This definition partly underestimates the dark proteome, because Aquaria includes very remote homologies [found using HHblits (22)] and uses all PDB entries, including low-quality structures from electron microscopy (EM) or NMR spectroscopy. We deliberately chose this stringent definition of “darkness,” so we can be confident that the dark proteome has completely unknown structure.
Fig. 1.
Mapping the dark proteome. (A) For all proteins in Swiss-Prot, each residue was classified into one of four categories: (i) PDB regions—residues exactly matched to a PDB entry in Aquaria; (ii) gray regions—residues aligned to at least one PDB entry in Aquaria but always with amino acid substitutions (dark gray); (iii) dark regions—residues with no matching PDB entry in Aquaria; and (iv) dark proteins, where a single dark region spans the entire sequence. (B) We then calculated the total fraction of residues in each of the above four categories for all proteins in eukaryotes, bacteria, archaea, and viruses. The dark proteome (i.e., the fraction of residues in dark proteins or dark regions) varies from 13% (bacteria) to 54% (viruses).
Most dark residues occurred in contiguous “dark regions” (Fig. 1); on average, eukaryotic proteins contained eight dark regions, many very short. In many cases, a single dark region covered the entire sequence; we call these “dark proteins” (Fig. 1B). Most nondark residues also occurred in continuous regions: some, called “PDB regions,” exactly matched to a PDB entry—these residues accounted for only 2–4% of all Swiss-Prot residues (Fig. 1B). The remaining nondark residues occurred in “gray regions” (Fig. 1B), where 3D structure could be predicted based on similarity to at least one PDB entry.
We found that the dark proteome (i.e., the fraction of residues in dark proteins or dark regions) for archaea and bacteria was strikingly small (13–14%; Fig. 1B), implying that structural knowledge for these organisms approaches a level of completeness. In contrast, in eukaryotes and viruses, about half (44–54%) of the proteome was dark (Fig. 1B). Of the total dark proteome, nearly half (34–52%) comprised dark proteins.
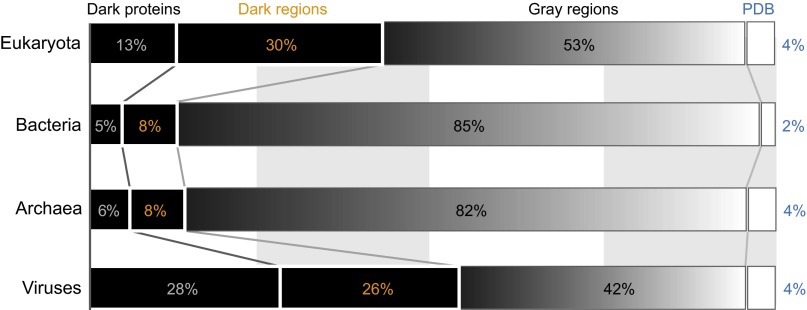
We repeated the above analysis using an even more stringent definition for darkness—combining PMP (2) and Aquaria (SI Methods)—but this had little effect (Fig. S1).
Fig. S1.
A more stringent definition of the dark proteome. Similar distributions are plotted as for Fig. 1B but using a more stringent definition of darkness (Defining Darkness More Stringently) that excludes any residue matching a structure in either Aquaria or PMP (2). The only change is a very slight reduction in darkness for eukaryotes.
We also calculated a darkness score for each protein, defined as the percentage of dark residues (Dataset S1). Thus, dark proteins have 100% darkness, whereas proteins with 0% darkness are those where the entire sequence is detectably similar to one or more PDB entries. The distribution of darkness scores was strongly bimodal; most proteins had either low or 100% darkness (density plots in Fig. 2A and Figs. S2A and S3). For brevity in this work, we use the term “nondark proteins” to refer to those with <100% darkness (noting that a small fraction had high darkness scores).
Fig. 2.
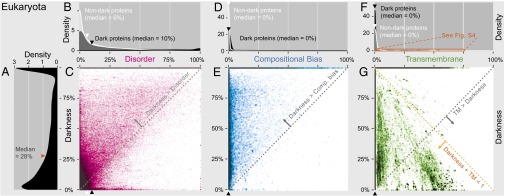
Darkness vs. disorder, compositional bias, and transmembrane fraction for 178,692 eukaryotic proteins. Overall, these three factors explain only a small part of the dark proteome. Corresponding plots for bacteria, archaea, and viruses are in Fig. S3. In each 2D plot, dark proteins cluster on the line at darkness = 100%. Density plots A, B, D, and F are shown in more detail in Fig. S2. (A) The distribution of darkness was bimodal: 50% of proteins had ≤28% dark residues; 20% had 100% darkness. (B) The distribution of disorder was also bimodal: 50% of dark proteins had ≤10% disordered residues, whereas 4% had 100% disorder; for nondark proteins, 50% had ≤6% disorder, whereas 1% had 100% disorder. Median disorder was much less than median darkness (28%), implying that most of the dark proteome was not disordered. (C) Two-dimensional plot shows that darkness > disorder for most proteins (dotted line), implying that most disordered residues were dark and many dark residues were not disordered. (D) Compositional bias was 0% in most proteins and slightly more prevalent in dark proteins. (E) Two-dimensional plot shows that darkness > compositional bias for most proteins (dotted line), implying that most compositionally biased residues were dark and many dark residues were not compositionally biased. (F) Most dark proteins had no transmembrane residues (see Fig. S4 for details). (G) Two-dimensional plot shows that darkness > transmembrane fraction for many proteins (gray dotted line), implying that many dark residues were not transmembrane. Most proteins occur in the region where darkness + transmembrane ≤ 1 (orange dotted line), implying that dark and transmembrane regions were mostly disjoint.
Fig. S2.
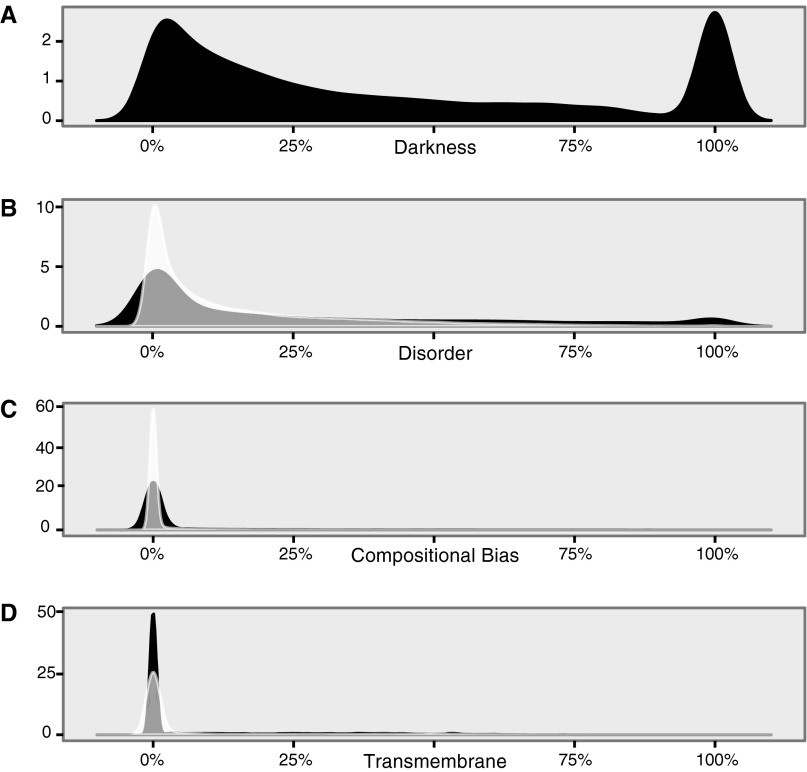
On interpreting the density plots in this work. This figure shows the full range for the density plots from Fig. 2, for darkness (A), disorder (B), compositional bias (C), and transmembrane fraction (D) in eukaryotes. Because peaks occur at 0% and 100%, the kernel density method used to create these plots places some of the density <0% and >100%, which could not be shown in Fig. 2 and Fig. S3. For all density plots in this work, the density values (y axis) have been scaled, so that the total area under the curve equals 1. The density values therefore depend on the range of values on the x axis and will be large when x values have a small range (as shown here, where 0 ≤ x ≤ 1) and small when x values have a large range (e.g., Fig. 4B, where 0 ≤ x ≤ 150). See Density Plots for further details.
Fig. S3.
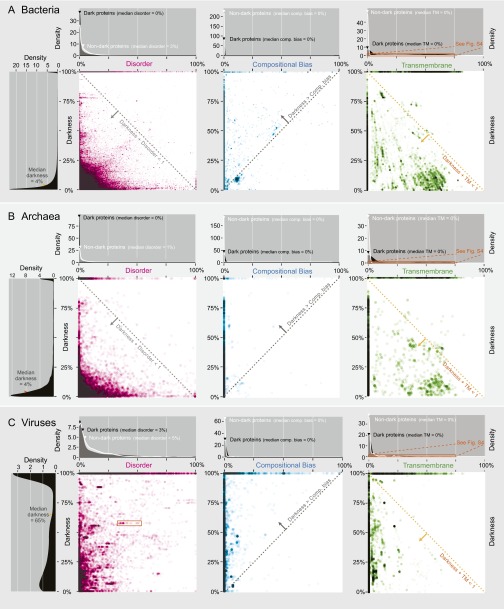
Darkness vs. disorder, compositional bias, and transmembrane fraction in bacteria, archaea, and viruses. This figure shows equivalent plots to those in Fig. 2 (see the legend of Fig. 2 for details on each part). (A) For 331,559 bacterial proteins, the distribution of darkness was bimodal: 50% of proteins had ≤4% dark residues; 7% had 100% darkness. The disorder distribution shows that, surprisingly, dark proteins had lower median disorder (0%) than nondark proteins (3%). The 2D plot of disorder vs. darkness is distinctly different from in eukaryotes (Fig. 2C); most proteins occur in the region where darkness + disorder ≤ 1 (dotted line), implying that dark and disordered regions were mostly disjoint. The plots for compositional bias and transmembrane fraction are similar to eukaryotes (Fig. 2 E–G), implying that: most dark proteins had no compositional bias and no transmembrane regions; most compositionally biased residues were dark but most dark residues were not compositionally biased; and dark and transmembrane regions were mostly disjoint. (B) For 19,270 archaeal proteins, the distribution of darkness was bimodal: 50% of proteins had ≤4% dark residues; 8% had 100% darkness. The disorder distribution shows that, surprisingly, dark proteins had lower median disorder (0%) than nondark proteins (1%). The 2D plot of disorder vs. darkness is similar to bacteria, implying that dark and disordered regions were mostly disjoint. The plots for compositional bias and transmembrane fraction are similar to bacteria and eukaryotes (Fig. 2 E–G), implying that: most dark proteins had no compositional bias and no transmembrane regions; most compositionally biased residues were dark but most dark residues were not compositionally biased; and dark and transmembrane regions were mostly disjoint. (C) For 16,479 viral proteins, the distribution of darkness was more evenly distributed than in archaea, bacteria, or eukaryotes: 50% of proteins had ≤65% darkness; 44% had 100% darkness. The disorder distribution shows that, surprisingly, dark proteins had lower median disorder (3%) than nondark proteins (5%). The 2D plot of disorder vs. darkness is distinctly different from eukaryotes (Fig. 2C), bacteria, and archaea; the almost random distribution implies that darkness had almost no relationship to disorder in viruses. The orange rectangle indicates a group of viral proteins regularly spaced along the horizontal direction, a pattern reoccurring several times on the plot; these are proteins from strains of the same virus that vary in the number of disordered residues. The relatively frequent occurrence of this pattern is consistent with the hypothesis that variation in disordered regions is a key aspect of viral strategies to hijack cell regulation (39). The plots for compositional bias and transmembrane fraction are similar to archaea, bacteria, and eukaryotes (Fig. 2 E–G) implying that: most dark proteins had no compositional bias and no transmembrane regions; most compositionally biased residues were dark but most dark residues were not compositionally biased; and dark and transmembrane regions were mostly disjoint.
Dark Proteome Is Mostly Not Disordered.
Intrinsically disordered regions are believed to account for much of the dark proteome, especially in eukaryotes (15). To explore this hypothesis, for each protein we calculated the percentage of residues predicted to be disordered [using IUPred (23); SI Methods]. Viewing these disorder and darkness scores on a 2D scatter plot, we see that darkness was greater than disorder for almost all eukaryotic proteins (most proteins above the diagonal in Fig. 2C), implying that many dark residues were not disordered. In this 2D plot, dark proteins are difficult to resolve because they cluster on a line at the top; thus, we made density plots comparing the disorder distribution for dark vs. nondark proteins (Fig. 2B). Surprisingly, most dark proteins had low disorder (median, 10% disorder), not greatly different from nondark proteins (median, 6% disorder); because both of these medians were less than half of the median darkness score (28%; Fig. 2A), this finding implies that most of the dark proteome in eukaryotes was not disordered.
In bacteria, archaea, and viruses, nondark proteins, surprisingly, had higher median disorder than dark proteins (Fig. S3). However, the median darkness was always higher still, implying that in these organisms as well, much of the dark proteome was not disordered.
For eukaryotic proteins, the pattern seen in the 2D plot (Fig. 2C) also implies that, as expected, most disordered residues were dark. However, a fraction of proteins occur below the diagonal, implying that many disordered residues were not dark. In the corresponding plots for bacteria, archaea, and viruses, this fraction is even larger (Fig. S3), implying that as much as half of all disordered residues were not dark. Many of our colleagues found this last result confusing, often because the distinction between disorder and darkness was unclear. Thus, to clarify: disordered regions are those with evidence of structural heterogeneity (23)—but some become well structured in particular contexts (e.g., most of the 536 Swiss-Prot proteins with 100% disorder and 0% darkness were ribosomal and are presumably well structured within the ribosomal complex). To clarify darkness: these are regions that do not match any PDB entry—but some PDB entries are highly disordered [often these are from EM or NMR (24)], and any sequence aligned to a PDB entry was classified as “not dark” using our stringent definition, because some structural information is known.
Dark Proteome Is Mostly Not Compositionally Biased.
Compositional bias is also known to confound structure determination (25). To explore this idea, for each protein we calculated the percentage of compositionally biased residues (SI Methods). Viewing these compositional bias and darkness scores on 2D scatter plots, we see that darkness was greater than compositional bias for almost all proteins (Fig. 2E and Fig. S3), implying that, as expected, most compositionally biased residues were dark. Together with the density plots for compositional bias (Fig. 2D and Fig. S3), it is clear that most dark residues were not compositionally biased and that most dark proteins had very low compositional bias.
Dark Proteome Is Mostly Not Transmembrane.
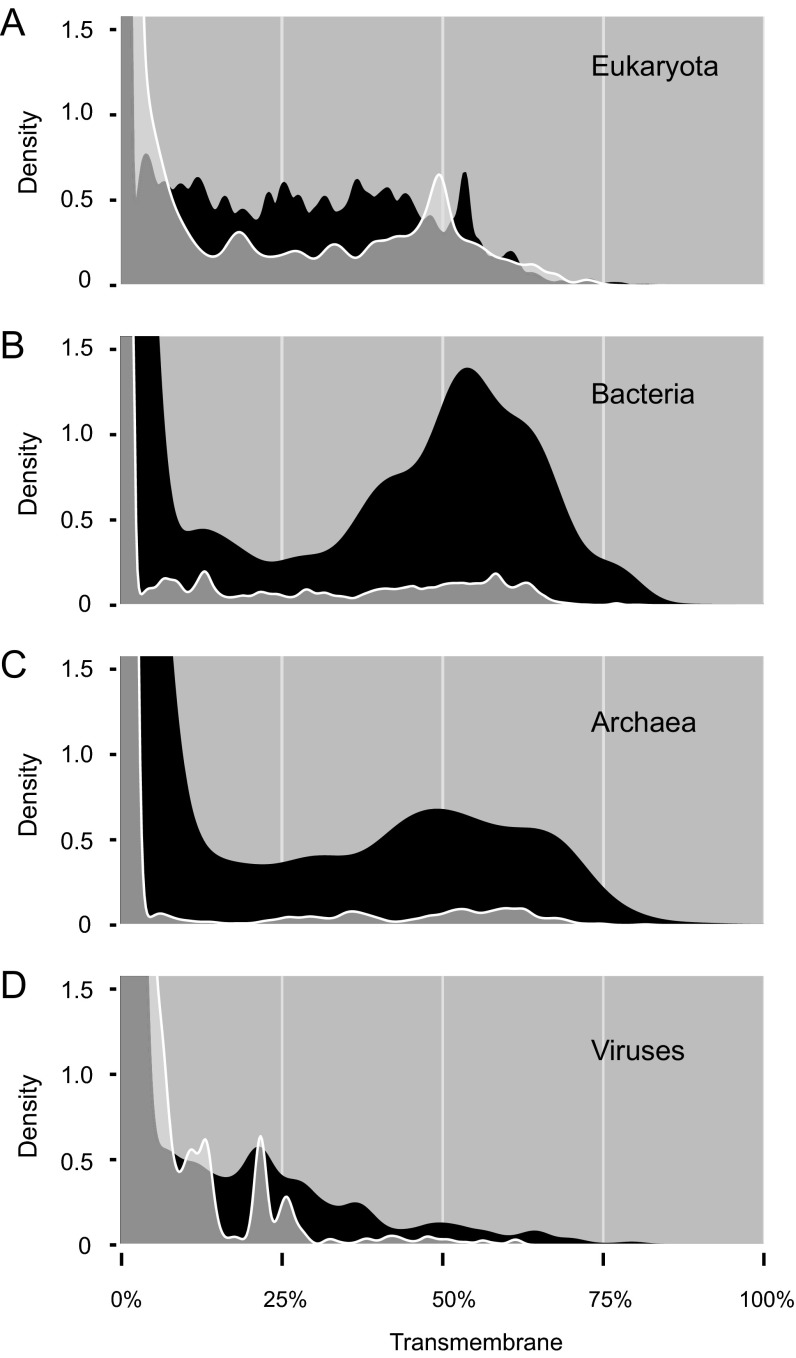
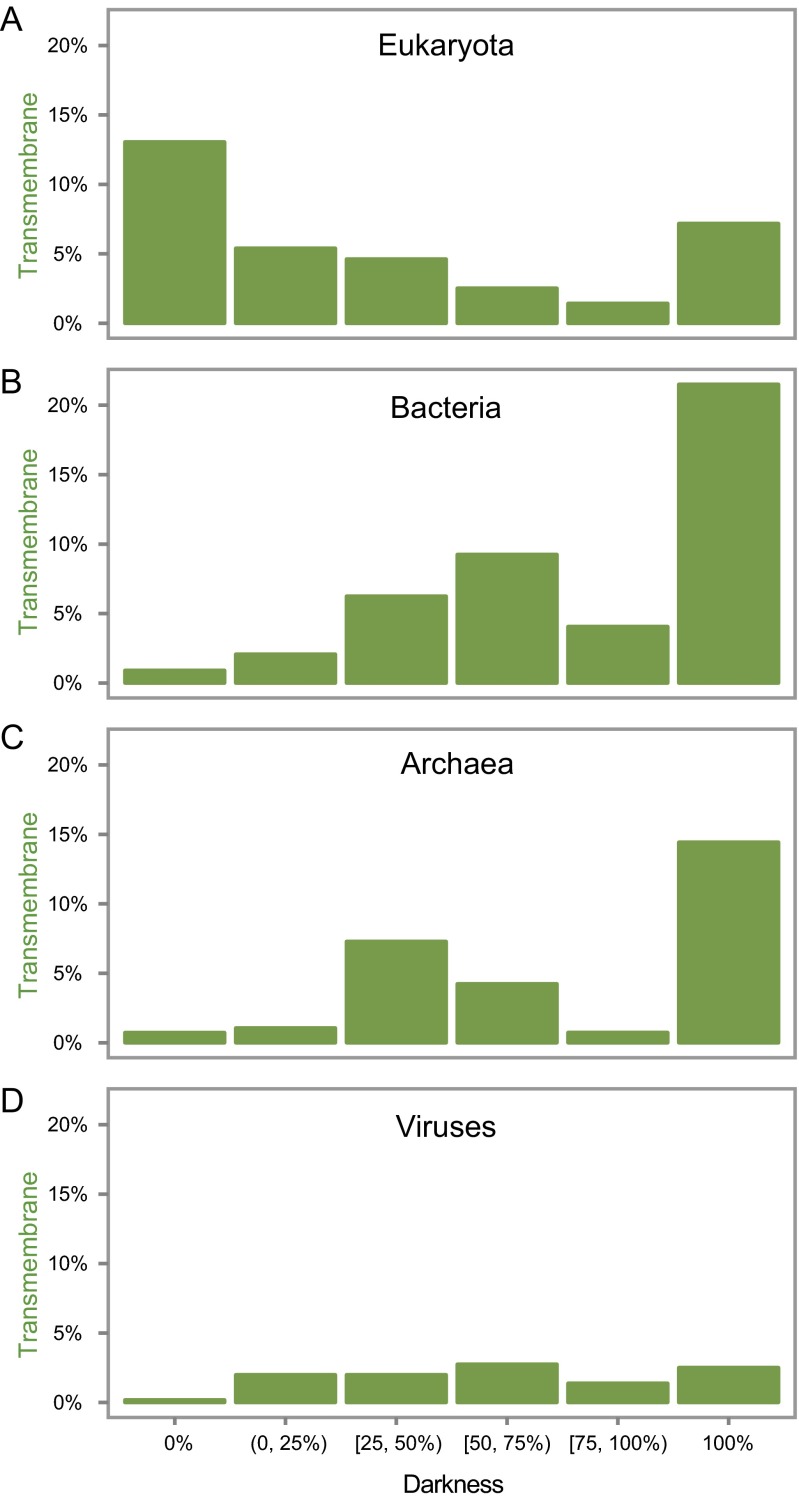
Transmembrane regions are also known to confound structure determination (15, 18). To explore this concept, for each protein we calculated the percentage of transmembrane residues (SI Methods). Viewing these transmembrane and darkness scores on 2D scatter plots, we see that a surprisingly large fraction of transmembrane residues were not dark (Fig. 2G and Fig. S3). From the transmembrane density plots (Fig. 2F and Fig. S3), we also see that most dark proteins had no transmembrane residues; zooming into these plots shows (as expected) that dark proteins were strongly overrepresented among integral transmembrane proteins in bacteria and archaea but (unexpectedly) not so in eukaryotes and viruses (Fig. S4). Also unexpected was that the transmembrane fraction tended to decrease with increasing darkness in eukaryotes and, across all organisms, was unexpectedly low in proteins with 75% ≤ darkness < 100% (Fig. S5). These results suggest that knowledge of eukaryotic transmembrane protein structures may be more complete than commonly believed, thanks to an ongoing focus on membrane protein structures (26). Alternatively, these results may suggest that the methods used to predict transmembrane regions in this work progressively fail with increasing darkness [i.e., there may be transmembrane regions that are currently undetectable via PROF (27), PROFTMB (28), and other similar methods].
Fig. S4.
Zoomed-in transmembrane distributions for dark vs. nondark proteins. (A) Zoomed-in view of Fig. 2F comparing the fraction of transmembrane residues found in dark and nondark eukaryotic proteins. A slightly higher proportion of dark proteins have >10% transmembrane residues, although interestingly a larger fraction of nondark proteins have ∼50% transmembrane residues. (B) Zoomed-in view of the transmembrane density plot in Fig. S3A comparing dark and nondark bacterial proteins. A much larger proportion of dark proteins have >10% transmembrane residues, with a pronounced peak at ∼55%. (C) Zoomed-in view of the transmembrane density plot in Fig. S3B comparing dark and nondark archaeal proteins. A much larger proportion of dark proteins have >10% transmembrane residues, with a broad peak at ∼45–60%. (D) Zoomed-in view of the transmembrane density plot in Fig. S3C comparing dark and nondark viral proteins. Overall, only a slightly higher proportion of dark proteins have >10% transmembrane residues, and the density of both dark and nondark proteins is much lower in this range than for eukaryotes, bacteria, or archaea.
Fig. S5.
Transmembrane fraction vs. darkness. In each histogram, proteins have been binned into six groups according to their darkness score (darkness = 0%, 0% < darkness < 25%, 25% ≤ darkness < 50%, 50% ≤ darkness < 75%, 75% ≤ darkness < 100%, and darkness = 100%). We then calculated the average fraction of transmembrane residues across all proteins in each bin. (A) Surprisingly, for eukaryotic proteins, the largest fraction of transmembrane residues was seen for proteins with 0% darkness, and the fraction tended to decrease with increasing darkness, although rising somewhat for dark proteins (100% darkness). (B) Bacterial proteins show nearly the opposite behavior: the smallest fraction of transmembrane residues was seen for proteins with 0% darkness and the largest for proteins with 100% darkness. Interestingly, however, there was a dip in transmembrane fraction for proteins with 75% ≤ darkness < 100%. (C) Archaeal proteins show a similar overall pattern to bacteria: the transmembrane fraction tended to increase with increasing darkness, although there as a dip in transmembrane fraction for proteins with 50% ≤ darkness < 100%. (D) Overall, viral proteins have much lower transmembrane fraction and relatively little dependency on darkness.
Dark Proteins Are Mostly Unknown Unknowns.
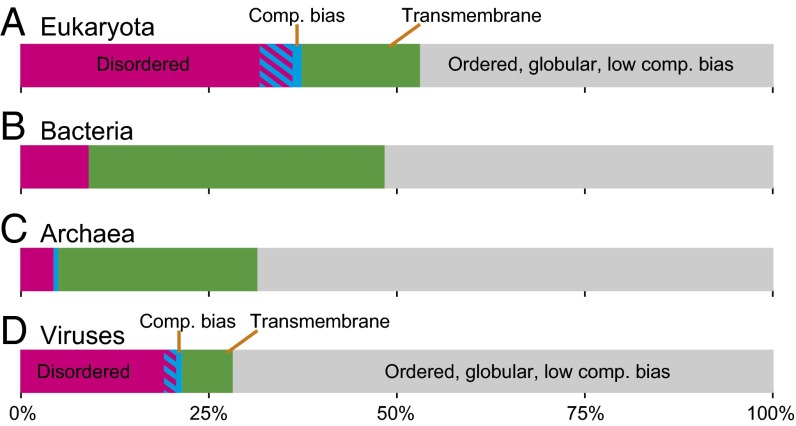
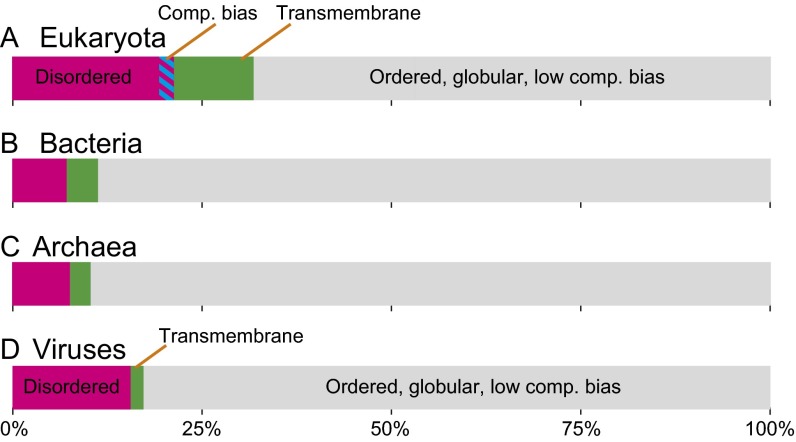
To determine the fraction of dark proteins that could be accounted for by a combination of disorder, transmembrane regions, or compositional bias, we categorized each protein as having either a “high” (≥25%) or “low” (<25%) value for each score (Fig. 3). Most of the known unknown (colored fraction) is accounted for by disorder in eukaryotes and viruses and by transmembrane regions in bacteria and archaea (consistent with Figs. S4 and S5). However, a surprisingly large fraction of dark proteins (45–70%) were unknown unknowns (gray fraction) in that they cannot be easily accounted for by these conventional explanations (Fig. 3). This fraction was largest for viral dark proteins, possibly because of their rapid mutation rates (29), which would tend to increase darkness by undermining the sequence-based structure prediction used in this work (2, 19).
Fig. 3.
Known vs. unknown dark proteins. Each linear diagram (38) shows known dark proteins [i.e., those with ≥25% of residues disordered (magenta), compositionally biased (blue), transmembrane (green), or both disordered and compositionally biased (stripes)]. The remaining fraction (gray) are unknown unknowns (i.e., dark proteins predominately ordered, globular, and low in compositional bias). (A) In eukaryotes, high disorder accounted for most of the known dark proteins. Most dark proteins with high compositional bias were also highly disordered. (B and C) In bacteria and archaea, highly transmembrane proteins accounted for most of the known dark proteins (consistent with Figs. S4 and S5). (D) Viruses had the largest unknown unknown fraction and, like eukaryotes, had a large fraction of highly disordered dark proteins.
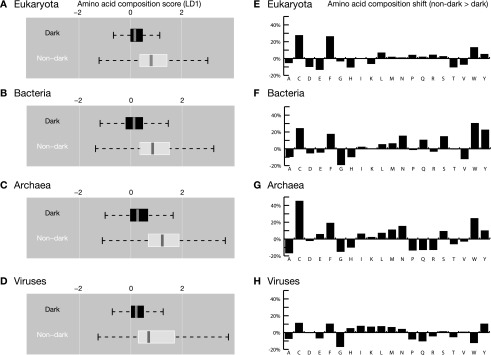
To further characterize unknown dark proteins, we next compared them to nondark proteins that were also ordered, globular, and had low compositional bias (i.e., Fig. S6, gray fraction). We found highly significant differences in amino acid composition across all organisms (Fig. S7), suggesting that these dark proteins have distinct functional roles or subcellular locations (30, 31). The largest difference seen was a ∼25% increase in cysteine in dark proteins, consistent with greater prevalence of disulfide bonds (Functions of Dark Proteins). The next largest differences were increases in both phenylalanine and tryptophan; these amino acids have also been reported to be most increased in transmembrane vs. nontransmembrane proteins (30). This result is consistent with greater prevalence of dark proteins in the range ∼10% < transmembrane < 25% (especially in bacteria and archaea; Fig. S4) but, partly surprising, because most dark proteins have no transmembrane residues (Fig. 2F and Fig. S3); a possible explanation could be undetected transmembrane regions (Dark Proteome Is Mostly Not Transmembrane).
Fig. S6.
Disorder, compositional bias, and transmembrane fraction for nondark proteins. Each linear diagram (38) shows the fraction of nondark proteins with ≥25% of residues disordered (magenta), compositionally biased (blue), transmembrane (green), or both disordered and compositionally biased (stripes). The remaining fractions (gray) are nondark proteins predominately ordered, globular, and low in compositional bias; in Fig. S7, these proteins are compared with the corresponding dark proteins (gray fractions in Fig. 3). The figure shows data from eukaryotes (A), bacteria (B), archaea (C), and viruses (D). Note that in eukaryotic nondark proteins (A), the difference in gray fraction compared with dark proteins (Fig. 3A) is smaller than may be expected.
Fig. S7.
Amino acid composition in dark vs. nondark proteins. (A–D) We used linear discriminant analysis to examine differences in amino acid composition for dark and nondark proteins that were ordered, globular, and low in compositional bias (i.e., proteins corresponding to the gray regions in Fig. 3 and Fig. S6). In all cases, we found highly significant differences (Welch t test, P < 10−15) along the first linear discriminant coefficient (LD1). On each box plot, the thick central vertical bar indicates the median value; the shaded region shows the interquartile range (estimated span of 50% of data); dotted lines show the interdecile range (estimated span of 99.3% of data). (E–H) Averaged across all organisms, the largest difference in amino acid composition was seen for cysteine, which increased by 25% (from 1.71 to 2.13% composition) in dark proteins; this finding is consistent with the observation that disulfide bonds, cysteine frameworks, and disulfide-rich knottins are overrepresented in dark proteins (Fig. 6). The next two largest differences were seen for phenylalanine and tryptophan, which increased in dark proteins by an average of 18% and 14%, respectively; these are reported to be the most increased amino acids in transmembrane vs. nontransmembrane proteins (30).
Shorter Sequence Length.
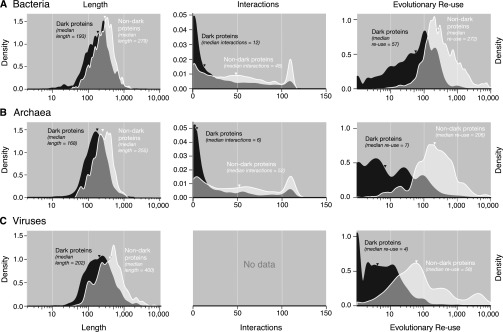
Very short or long sequence length sometimes confounds structure determination (32). We found that dark proteins had 26–50% shorter median length (Fig. 4A and Fig. S8) and 16% had a length of <50 aa or a length of >700 aa, compared with 11% of nondark proteins. So, extreme length may explain some dark proteins but not most.
Fig. 4.
Length, interactions, and evolutionary reuse for dark vs. nondark eukaryotic proteins. In each case, dark proteins had significantly lower values overall compared with nondark proteins (signed Kolmogorov–Smirnov test, P ≪ 10−4). Corresponding plots for bacteria, archaea, and viruses are in Fig. S8. (A) Dark proteins had shorter sequence length (median of 140 fewer amino acids, or 37% shorter). (B) Dark proteins had fewer interactions with other proteins. Note that the small peaks at ∼110 interactions arise from ribosomal proteins. (C) Dark proteins had lower evolutionary reuse. In A and C, note that to interpret the y axes values as true density scores, x values must be transformed using log base 10 (i.e., 100 becomes 2, etc.).
Fig. S8.
Length, interactions, and evolutionary reuse for dark vs. nondark proteins from bacteria, archaea, and viruses. In each case, dark proteins had significantly lower values overall compared with nondark proteins (signed Kolmogorov–Smirnov test, P ≪ 10−4). (A) For bacteria, dark proteins had shorter sequence length (median of 86 fewer amino acids, or 31% shorter), fewer interactions with other proteins, and lower evolutionary reuse. (B) For archaea, dark proteins had shorter sequence length (median of 87 fewer amino acids, or 34% shorter), fewer interactions with other proteins, and lower evolutionary reuse. The differences between dark and nondark archaeal proteins were generally greater than for bacteria. (C) For viruses, dark proteins had shorter sequence length (median of 198 fewer amino acids, or 50% shorter) and lower evolutionary reuse. The evolutionary reuse scores were much lower than for eukaryotes, bacteria, and archaea. No protein–protein interaction data were available for viruses in the resource used in this study (33). Note that the small peaks at ∼110 interactions arise from ribosomal proteins. Note also that, for the length and evolutionary reuse plots, to interpret the y axes values as true density scores, the x values must be transformed using log base 10 (so 100 becomes 2, etc.).
Because dark proteins are shorter, their abundance is underestimated in Fig. 1, which is based on the fraction of dark residues. The fractions for dark proteins were 20% for eukaryotes, 7% for bacteria, 8% for archaea, 44% for viruses, and 13% for all Swiss-Prot proteins.
Fewer Known Protein–Protein Interactions.
For each protein, we used STRING (33) to count how many other proteins it interacts with. We found that dark proteins had surprisingly few known interactions (Fig. 4B and Fig. S8). Although this observation may arise because dark proteins are not as well studied, the finding is, nonetheless, somewhat surprising because STRING aggregates multiple types of evidence, including high-throughput “omics” experiments and inference via homology.
Lower Evolutionary Reuse.
For each protein, we calculated how frequently any part of its sequence has been reused across all other known proteins (SI Methods). Dark proteins were reused much less frequently than nondark proteins (Fig. 4C and Fig. S8), suggesting that dark proteins may be newly evolved proteins or rare proteins adapted to specific functional niches. This result was partly expected, given how darkness was defined and given the progress of structural genomics in targeting large protein families with unknown structure (8). Low evolutionary reuse also partly explains why dark proteins have few known interactions (Fig. 4B and Fig. S8), because many interactions are inferred by homology (33).
Subcellular Location of Dark Proteins.
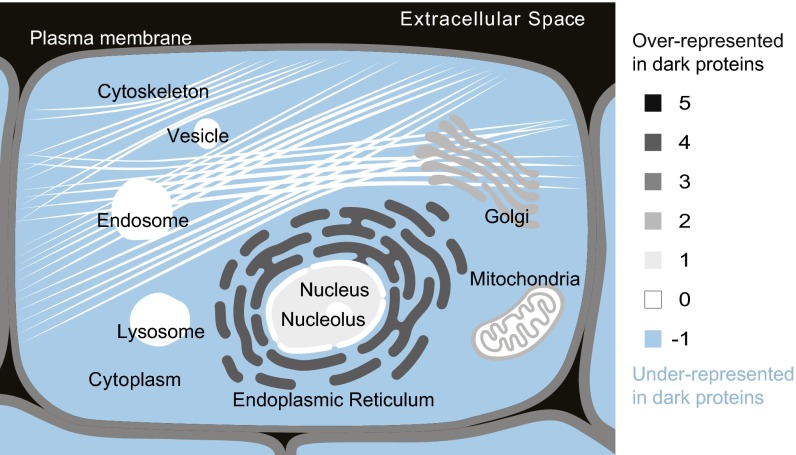
For each protein, we used UniProt annotations to determine its subcellular location; these data were missing for 44% of eukaryotic dark proteins compared with 29% of nondark proteins, consistent with lower evolutionary reuse (because location is often inferred via homology). These location data were used in an enrichment analysis (SI Methods) finding that, unexpectedly, eukaryotic dark proteins were most strongly overrepresented in the extracellular space, followed by the endoplasmic reticulum (Fig. 5). This observation partly explains why dark proteins had few interactions (Fig. 4C and Fig. S8); compared with intracellular proteins, secreted proteins are often “autonomous,” fulfilling their functions via fewer interactions with other proteins. Interestingly, the only subcellular location where dark proteins were underrepresented was the cytoplasm (Fig. 5), and the only tissue where they were underrepresented was red blood cells (Fig. 6), which are mostly cytoplasm; this finding suggests that knowledge of cytoplasmic protein structures approaches a level of completeness—similar to bacterial and archaeal proteins (Fig. 1), most of which are also cytoplasmic.
Fig. 5.
Cellular locations over- and underrepresented in dark proteins. Pooling annotations for all eukaryotic proteins, we determined which subcellular compartments were enriched in dark proteins; these proteins were most strongly overrepresented in the extracellular space, followed by the endoplasmic reticulum and then the plasma membrane. Dark proteins were underrepresented among cytoplasmic proteins.
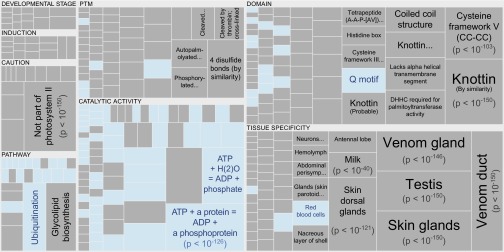
Fig. 6.
Functional annotations over- or underrepresented in dark proteins. Pooling annotations for all eukaryotic proteins, we used enrichment analysis to find biological functions associated with dark proteins (Dataset S2). The tree map shows all over- and underrepresented annotations (dark gray and blue, respectively) in eight functional categories; cell area indicates annotation significance [scaled to –log10(P), using the adjusted P value from Fisher’s exact test]. Dark proteins were overrepresented in many specific secretory tissues and underrepresented only in three “tissue” annotations: “Red blood cells,” “Ubiquitous,” and “Widely expressed” (text not shown). Dark proteins were also overrepresented in cysteine-rich domains and disulfide bonds (of all dark proteins with annotated posttranslational modifications, 16% had disulfide bonds compared with 6.4% for nondark proteins). Dark proteins were underrepresented in many “Catalytic site” and “Pathway” annotations, where inference often requires similarity to a PDB structure.
Functions of Dark Proteins.
For each protein, we extracted functional descriptions from the UniProt “CC” annotation; the median length of text in this field was 47% shorter for dark proteins, indicating that less is known about them (again, consistent with lower evolutionary reuse). The resulting set of 242,064 distinct functional annotation terms was used in an enrichment analysis (SI Methods), finding that only 2,098 were underrepresented in dark proteins, whereas 3,566 were overrepresented (Dataset S2). This finding implies that, overall, dark proteins fulfill a wide variety of functions, but, nevertheless, a subset have distinct biological functions.
Eukaryotic dark proteins were overrepresented in specific secretory tissues and exterior environments (Fig. 6), consistent with the result that many were secreted (Fig. 5). Eukaryotic dark proteins were also overrepresented in disulfide-rich domains and in disulfide bonds (Fig. 6 and Dataset S2), consistent with increased cysteine (Fig. S7). Additionally, eukaryotic dark proteins were overrepresented in cleavage and other posttranslational modifications known to prepare proteins for harsh environments and to confound experimental structure determination (Fig. 6).
Coding Potential.
The unexpected features of dark proteins may raise the following question: Are they really proteins? Indeed, some overrepresented Swiss-Prot annotations suggest that a fraction of dark proteins are noncoding (Dataset S2); to examine this, we calculated a coding potential score for each human protein [using CPC (34); SI Methods]. We found that, of the 4,403 human dark proteins, 2 were likely noncoding and 48 were weakly noncoding; thus, noncoding accounted for only ∼1% of dark proteins. By comparison, of the 15,806 human nondark proteins, ∼0.14% were noncoding or weak noncoding. Thus, as expected, only a very small fraction of Swiss-Prot entries are likely noncoding; although this fraction was enhanced in human dark proteins, it seems likely that most dark proteins really are proteins.
Implications.
Mapping the dark proteome has revealed many unexpected features; however, more analyses remain to be done—for example, examining physiochemical properties also known to confound structure determination [e.g., isoelectric point, hydrophobicity, or irregular secondary structure (32)]. Thus, we provide our data for use by others (Dataset S1). In this work, we focused primarily on dark proteins, which account for ∼42% of the dark proteome (Fig. 1); dark regions account for the remaining 58%.
Several insights can be gained from the dark protein features revealed in this work. (i) The observation that most dark proteins had low disorder (and many highly disordered proteins are not dark) helps clarify the distinction between darkness and disorder; this clarification in turn will help further studies into protein intrinsic disorder. (ii) The observation that transmembrane regions were rare among proteins with 75% ≤ darkness < 100% (especially in eukaryotes) may indicate the existence of transmembrane regions undetected by current prediction methods. (iii) The observation that many dark proteins are secreted and posttranslationally modified may help focus development of experimental and bioinformatics methods to better manage such cases. (iv) The combination of low evolutionary reuse (Fig. 4B and Fig. S8) with high occurrence of disulfide bonds is a signature, suggesting that many dark proteins are newly evolved folds (35) exploring the dark matter of protein folding space (12).
Mostly, however, dark proteins are a mystery; in addition to unknown structure, many have unknown location, unknown function, and no known interactions with other proteins. This is partly accounted for by low evolutionary reuse and by expression in specific tissues and developmental stages. Ultimately, many dark proteins are simply not as well studied as nondark proteins; this work will contribute by highlighting them for subsequent experimental and bioinformatics studies, which may reveal further unknown unknowns.
Future Perspectives.
The dark proteome is a moving target, changing as the PDB grows. However, as sequence databases grow at much faster rates, will the dark proteome expand or contract? The current work cannot answer this directly, but earlier surveys have concluded that the number of folds is ≲10,000 (36), suggesting that the dark proteome will eventually contract if improvements in detection methods [e.g., HHblits (22)] keep pace with the rate of new sequence families. However, those surveys used databases (PDB, Swiss-Prot, etc.) with historical bias toward model organisms; newer experimental approaches are reducing this bias [e.g., structural genomics (8), DNA sequencing of environmental samples (37)]. A recent survey of 8 million protein sequences by Levitt (6) concluded that, eventually, the number of folds may increase linearly with sequences. However, uncertainty in this conclusion arose because ∼22% of the proteins surveyed were “uncharacterized” (i.e., orphans not matching any known sequence family); many of these uncharacterized proteins may arise from errors in predicting genes from whole genomes.
In the current survey of half a million carefully curated Swiss-Prot sequences, we found that ∼13% are dark proteins; although some of these dark proteins were not orphans (just hard to determine folds), most were, as evidenced by low evolutionary reuse scores. Although we used a very different approach from Levitt (6) (a focus on structure versus sequence and very different methods, thresholds, and cutoff values), both of our studies are in broad agreement. Thus, our results suggest that many of the uncharacterized orphan sequences reported by Levitt (or the dark matter of the protein universe) are indeed real proteins; this possibility strengthens the suggestion that folds will eventually increase linearly with sequences (6) and implies that dark proteins may remain a sizeable and irreducible feature of the protein universe.
SI Methods
Mapping Darkness.
For each Swiss-Prot protein, each residue was categorized as “not dark” if it met either of the following criteria (Fig. 1A): if the residue was aligned onto the “ATOM” record of any PDB entry (1) in the corresponding Aquaria (19) matching structures entry (e.g., aquaria.ws/P04637.json) (criterion A); or if the residue was aligned onto a PDB entry in the corresponding UniProt entry (e.g., www.uniprot.org/uniprot/P04637.txt) (criterion B).
All other residues were categorized as “dark.” We then calculated a “darkness” score (D) for each protein using
For most proteins, darkness depends on criterion A and hence on the criteria Aquaria uses to decide when a given sequence-to-structure alignment is of sufficient quality to infer that the sequence is likely to adopt a structure similar to that PDB entry. An advantage of using Aquaria for this task is that it is derived from a systematic, all-against-all comparison of Swiss-Prot and PDB sequences; it also uses HHblits (22), an iterative method that compares hidden Markov models (HMMs) of sequences and structures, and gave the best combination of speed and reliable detection for structural templates compared with around 70 competing methods (bit.ly/hhblits-casp9 and bit.ly/hhblits-casp10). In PSSH2, Aquaria’s underlying database of “Protein Sequence-to-Structure Homologies,” alignments are only included if they have an HHblits E value of ≤10−10, which is estimated to correspond to a false-positive rate ≤1%, precision ≥70%, and recall ≤84% (19).
Including criterion B above decreased the total fraction of all dark residues in Swiss-Prot by only 0.2%; mostly, this finding is accounted for by a small fraction of very short and very long sequence-to-structure alignments missed by PSSH2 (19). In addition, the information contained in UniProt entries sometimes overestimates the region that is matched by PDB entries, including some residues that do not actually appear in the 3D structure—this overestimation has the effect of slightly underestimating darkness.
Although this definition of darkness is straightforward, it has the limitation that it does not distinguish between strong and weak matches to PDB structures; in addition, we use all PDB structures, including those derived from low-resolution crystallography studies, EM, or NMR spectroscopy. Thus, we do not distinguish weak sequence matches to low-resolution structures from strong matches to very reliable structures—both cases are considered equally nondark. In Fig. 1B and Fig. S1, this issue is symbolically indicated by the white-to-black gradient in gray regions, which is suggestive of the variation in the quality of structural knowledge for these regions.
Note that Aquaria alignments are generated by first aligning each Swiss-Prot sequence onto the PDB “SEQRES” records (i.e., the actual peptides used in the experiments underlying each PDB entry). As a second step, we align the SEQRES records onto the PDB ATOM records; thus, in cases where a region of sequence is always missing in the ATOM records of all related PDB entries (e.g., loop regions where electron density is always missing because of large disorder), these residues will be counted as dark.
Unfortunately, a different standard practice is used in NMR-derived structures; when a region lacks experimental data, coordinates for all atoms are still calculated and included in the ATOM records, resulting in highly disordered regions. Thus, these regions are considered not dark in this work, thus again slightly underestimating darkness.
Note that this definition of darkness is a stringent one, in that it underestimates darkness, or equivalently overestimates the state of structural knowledge for the proteome. We deliberately chose such a stringent definition because it gives more confidence that the dark regions and dark proteins identified are truly dark, which suits the goals of the current work.
Most dark residues occurred within contiguous dark regions (Fig. 1); when these are conserved across many other proteins, we call them “dark domains.” In some cases, a single dark region covers the entire sequence—we call these dark proteins (Fig. 1B). In this work, we focus primarily on characterizing dark proteins.
Defining Darkness More Stringently.
To test the robustness of our results, and ensure that our conclusions do not rely solely on Aquaria and HHblits, we also calculated a modified darkness score (DPMP) by augmenting the above definition of a not-dark residue to include the following case: if the residue occurs in any “twilight” or “safe” zone model in the PMP (2) (e.g., www.proteinmodelportal.org/query/up/P04637) (criterion C).
The models in PMP are aggregated from a range of modeling resources and hence have been calculated by a variety of different methods. We excluded PMP models annotated as having very low quality (“midnight” zone), because many of these are expected to be inaccurate or to have the wrong fold.
Using this more stringent criterion for defining the dark proteome, we saw very little difference in the overall distribution of dark regions and proteins across various groups of organisms (Fig. S1 compared with Fig. 1). The key difference we saw was in higher eukaryotes such as human, where dark proteins reduced from 22% to 11%; similarly, dark proteins in mouse reduced from 18% to 9%. This finding suggests that several of the databases that PMP draws from have a bias toward modeling proteins from higher eukaryotes.
Databases and Biases.
This work is based on Swiss-Prot (20), a manually annotated database of nonredundant protein sequences from 13,110 organisms. Swiss-Prot has a bias toward well-studied proteins from model organisms; however, this database is one of the most reliable resources available for defining a set of proteins whose existence is supported by experimental evidence. Using Swiss-Prot partly addresses the possibility that dark proteins may actually be unrecognized long noncoding RNA or may arise from pseudogenes. Although using Swiss-Prot reduces this likelihood, we did see evidence for a small number of such cases (Dataset S2 and Results and Discussion, Coding Potential). The PDB (1) also has a similar bias toward model organisms, although recently this bias is reduced somewhat by structural genomics initiatives (10). The effect of bias in the PDB is further reduced by the systematic modeling approach in Aquaria, which extends structure information to all detectibly related sequences in Swiss-Prot. Ultimately, these biases need to be taken into consideration in interpreting the results obtained in this work; essentially, the results document the fraction of well-described protein sequences that can be mapped onto any of the known 3D structures. If this approach was extended to include a broader set of proteins and organisms, such as TrEMBL (20), the distributions would be expected to change—most likely, the dark proteome would increase.
The dark proteome datasets used in this work (Datasets S1 and S2) were complied from Aquaria, PDB, Swiss-Prot, and PMP in October 2014; thus, the datasets do not reflect structure and sequence entries deposited since then. We plan to provide periodically updated versions of these datasets via the online resource (darkproteins.org). Although many database entries change with each update, over the 3 y that we have studied the dark proteome we have observed that the key results reported in this work have not changed, as would be expected because the results are supported by rather large sample sizes and have correspondingly small P values.
Density Plots.
The density plots in Figs. 2 and 4 and Figs. S2–S4 and S8 were created using Gaussian kernel density estimations (40), as implemented in the “stat_density” and “stat_density2d” functions of the “ggplot2” package in R and using default parameters. In these plots, the total proportion of proteins within a specific range on the x axis can be determined from the area under the curve in that range, divided by the area across the full range. This procedure enables direct comparison of the relative frequencies for dark and nondark proteins on each plot. However, in some cases, the density plots can be misleading, because different kernel bandwidths produce different plots; for example, Fig. 2F shows that dark proteins have a very high but narrower peak at x = 0 (corresponding to 0% transmembrane residues), whereas the corresponding peak for nondark proteins is about half the height but broader. However, using other kernels and bandwidths for the same data gives very similar sized peaks at x = 0.
Note that for the density plots in Fig. 2 and Fig. S3, the strongest peaks occur close to x = 0%, and occasionally secondary peaks occur at x = 100% (e.g., Fig. 2A). Both of these situations slightly complicate the interpretation of the area under the curve, because the kernel density method used places some of the area at x < 0% and some at x > 100%: a range of values that we could not include in Fig. 2 and Fig. S3. To make this issue clear, in Fig. S2, we have replotted the four density plots from Fig. 2 but showing the full range of values. However, this minor complication does not detract from the key observation in the density plots in Fig. 2 and Fig. S3, namely, that the majority of density lies close to x = 0%.
For all density plots in this work, the density values (y axis) are scaled so that the total area under the curve equals 1—as a result, the density values depends on the range of values on the x axis. Therefore, plots that have a small range of x values, such as Fig. S2 (which ranges from x = 0 to x = 1), will have relatively large density values (in this case, up to 60). By contrast, plots with a large range of x values, such as Fig. 4B (which ranges from x = 0 to x = 150), will have relatively small density values (in this case, up to 0.04).
Note that some of the calculated scores were missing for a small number of proteins, primarily because of database version issues. These proteins were excluded in all density and 2D plots used in this work, thus slightly reducing the number of proteins in those plots to 18,999 (archaea), 326,945 (bacteria), 175,646 (eukaryotes), 16,316 (viruses), and 537,906 (all organisms).
Kolmogorov–Smirnov Tests.
In most of the distributions obtained in this work (e.g., Figs. 2 and 4 and Figs. S2–S4 and S8), very clear differences were seen between dark and nondark proteins. With the rather large sample sizes used in this study, almost all statistical comparisons would result in very small P values, even for small differences. For this reason, in most cases, we report only differences in median values, and we calculated P values only when it was important to explicitly state that a given difference was significant.
To calculate these P values, we used permutations based on a one-sided Kolmogorov–Smirnov test, because most of the distributions were obviously very different from Gaussian. For each permutation, we randomly relabeled proteins as dark and nondark, while keeping the same ratio (dark/nondark) as in the original data; the dark and nondark distributions were then compared by calculating a (signed) Kolmogorov–Smirnov D value. In total, we did 9,999 permutations with each dataset—in all cases, the D values obtained with the original (unpermuted) data were much larger than that obtained for any of the permutations. We therefore concluded that these differences were significant at P ≪ 10−4.
Disorder.
For each protein, a disorder score was calculated from IUPred (23), one of the most widely used methods for predicting disorder. Residues were defined as disordered if they had an IUPred score ≥0.5.
Intrinsic disorder in proteins is a complex and poorly understood phenomenon; in addition to IUPred, many other prediction methods have been developed focusing on a range of different aspects of disorder (41, 42). It would certainly be of interest to compare darkness with disorder predictions from a range of methods; however, such a detailed comparison of this single property was beyond the scope of this work.
Compositional Bias.
For each Swiss-Prot protein a compositional bias score was calculated by pooling all residues annotated as compositionally biased in the “Features” section of the corresponding UniProt entry; this number was then divided by the total number of amino acids. UniProt does not annotate compositional bias occurring within known protein domains, so this method partly underestimates the total compositional bias; however, this effect will be less among dark proteins, because of their lower evolutionary reuse (Fig. 4C and Fig. S8).
A wide range of methods have been developed to measure compositional bias, and it would certainly be of interest to compare these methods against darkness; however, such a detailed comparison of this single property was beyond the scope of this work.
Transmembrane.
A transmembrane score was calculated for each protein by pooling all residues annotated as either intra- or transmembrane in the “Features” section of the corresponding UniProt entry; this number was then divided by the total number of residues. Most of these UniProt annotations derive from machine-learning methods (www.uniprot.org/help/transmem) that are believed to predict transmembrane regions with >95% accuracy (27). As a control, we also calculated a second set of transmembrane values by running systematic predictions for all Swiss-Prot sequences with PROF (27) and PROFTMB (28), which predict transmembrane helices and β-barrels, respectively. Using these values, the replotted density and scatterplots gave essentially identical patterns to those obtained using UniProt annotations (i.e., were the same as Fig. 2G and Fig. S3) and also had the same median values (i.e., zero transmembrane residues for both dark and nondark proteins in eukaryotes, bacteria, archaea, and viruses).
Two-Dimensional Plots.
There was a wide variety in the number of points in each 2D plot (Fig. 2 and Fig. S3), from ∼17,000 in viruses to ∼330,000 in bacteria. Thus, for each plot, we manually adjusted the point size and transparency to reveal the 2D distribution as clearly as possible. These adjustments should be taken into account when comparing different plots.
Linear Diagrams.
To determine the fraction of dark proteins that could be accounted for by a combination of disorder, transmembrane regions, or compositional bias, we categorized each protein as having either a high (≥25%) or low (<25%) value for each of the corresponding scores. These results are displayed in Fig. 3 as linear diagrams (38), which can show categorical combinations (similar to Euler diagrams); for example, in eukaryotes and viruses, a visible fraction of proteins had both ≥25% disorder and ≥25% compositional bias. A much smaller fraction of proteins (≪1%) had both ≥25% disorder and ≥25% transmembrane fraction; however, this was too small to represent in Fig. 3. For brevity, the fraction of proteins with <25% for each of these properties is referred to as ordered, globular, and low in compositional bias.
Obviously, many important details will be obscured by the use of such a simplistic categorization based on an arbitrary threshold (25%). Nonetheless, this approach enabled us to create a visualization that gives clear insight into the size of the unknown unknown (Fig. 3).
Linear Discriminant Analysis.
We compared the amino acid compositions for various categories of dark and nondark proteins (Fig. S7). For these analyses, we excluded all proteins with ≥25% disorder, compositional bias, or transmembrane fraction. Thus, the remaining proteins were ordered, globular, and not compositionally biased (i.e., gray fractions in Fig. 3 and Fig. S6). An amino acid composition vector for each protein was then calculated by first counting the number of each type of amino acid and then dividing by the total number of residues per protein; we excluded proteins with a total of less than 20 residues. We used the “lda” function in the “MASS” package for R to produce a linear discriminant score (LD1) for each protein, shown as boxplots (Fig. S7 A–D). Because the LD1 score variances were substantially unequal in the two groups, a two-sided Welch t test was used to assess the significance of the differences in amino acid composition.
For this dataset, we also calculated median composition vectors for dark and nondark proteins ( and , respectively, for the ith amino acid). We then calculated the relative differences in median composition between these two classes of proteins (shown in Fig. S7 E–H) using
Interaction Partners.
For each protein, we counted the number of known interactions in STRING (33) that have a quality score 700 or greater (e.g., bit.ly/1x0D8k6); this method retrieves only interactions that are considered to be of high confidence. The lower number of interactions seen for dark proteins is quite striking (Fig. 4C and Fig. S8)—at first it may seem that this observation arises simply because dark proteins have not been as well studied; however, STRING’s annotation process aggregates multiple types of evidence for interactions, primarily high-throughput experimental studies, as well as text mining, and in some cases, interaction is inferred via homology. This process would reduce potential study bias. Each of the interaction profiles (Fig. 4C and Fig. S8) also shows a prominent peak at around 100–120 interactions; primarily, this finding arises from the ribosome complex, a common and well-studied feature for which STRING provides interaction information across many organisms (33). Note that using STRING’s high confidence threshold (700), lack of known interactions does not necessarily imply that a protein has no interactions. Note also that we did not calculate the profile of interaction partners for viral proteins because STRING provides no information for them.
Evolutionary Reuse.
For each Swiss-Prot protein, we calculated a score that assesses the frequency with which any part of that sequence is reused in UniProt. To reduce the effect of database biases, this score was based on an HHblits (22) search of each Swiss-Prot sequence against UniProt20, a database of 4.8 million nonredundant UniProt sequence clusters in which the highest pairwise sequence identity between clusters was 20%, while also requiring almost full-length alignability (i.e., >80% coverage of the consensus sequence) (43). Thus, each member of a UniProt20 cluster generally has the same set of domains in the same order. The HHblits searches were run using default input parameter values (n = 2 iterations), except that more hits than usual were reported (setting B and Z parameters both to give 10,000 maximal reported UniProt20 matches). The evolutionary reuse score was set to be the number of UniProt20 matches with an expected value ≤10−10. In a very small number of cases, HHblits found no matches, because the UniProt20 database was slightly older than the Swiss-Prot database used, and hence some Swiss-Prot sequences were not included. In these cases, we set the evolutionary reuse score to 1.
The evolutionary reuse score is a measure of conservation; for each sequence, it counts (nonredundantly) how many times a remotely similar sequence pattern has been reused in any UniProt20 sequence cluster. Because each combination of sequence domains will generally count as a separate UniProt20 cluster, the reuse score will often be a large number.
Annotation Enrichment.
For each Swiss-Prot protein, we extracted a set of annotations from the “Description” field of the corresponding UniProt entry. To compare the annotations from sets of dark and nondark proteins, we used Fisher’s exact test (two-tailed) to identify annotations that were either over- or underrepresented in dark proteins. We applied the Benjamini–Hochberg false-discovery correction (44) with α, the fraction of false positives considered acceptable, set to 1%, and accepting only annotations with an adjusted P value of ≤1%, calculated via:
where P is from Fisher’s test, Min[a,b] is the smallest of the two values, n is the total of number of annotations in the set, and k is the rank of the largest P value that satisfies the false-discovery criteria. This approach was then repeatedly applied to compare dark and nondark proteins across various sets of organisms [e.g., one analysis compared all annotations from all eukaryotic proteins (Fig. 6), and a separate analysis compared annotations from all bacterial proteins (Dataset S2)]. The P values in Fig. 6 have been adjusted, as described above. The enrichment results are available in Dataset S2.
Tree Maps.
From the eukaryotic enrichment analysis results, we selected eight subcategories judged to be most informative and visualized them (Fig. 6) using a tree map (45); the removed subcategories included those with relatively few results—or results with relatively high adjusted P values—as well as subcategories such as “Similarity,” which only give information about groups of very similar proteins and the specific functions they perform; although interesting, these specific annotations do not reveal more general properties of dark proteins. In Fig. 6, the results were displayed using the D3 zoomable tree map library (bost.ocks.org/mike/treemap); some annotation terms have also been reworded to improve readability. The complete enrichment results, including original Swiss-Prot wording for annotation terms, are available in Dataset S2.
Cell Map.
Subcellular locations for each protein were determined from annotations in the corresponding UniProt entry. These annotations are often ambiguous; for example, sometimes one protein occurs in two or more distinct locations. We developed a scheme for combining the annotations from 178,692 eukaryotic proteins into a simple score for each location, which was then mapped onto a cell image, providing a concise visual summary of dark protein location (Fig. 5). In this scheme, we calculated a darkness score (Dc) for each distinct subcellular compartment (c) shown in Fig. 5, using
where the sum (i) is taken over all overrepresented (si = 1) or underrepresented (si = −1) annotations (Annotation Enrichment) associated with that compartment, and is the adjusted P value for each annotation. The parameter ni gives the number of distinct compartments mentioned in that annotation; in most cases, ni = 1, but ni was set to 2, for example, when a protein is annotated as cycling between the nucleus and cytoplasm. A scaled darkness score () was then calculated using
where Dmax indicates the largest unscaled darkness score across all compartments. In this analysis, we ignored cases where the UniProt annotation did not define specific locations (e.g., this excludes proteins annotated only as “single-pass transmembrane” because we have no information about the specific membranes in which the proteins occur). The scaled darkness score was then used to color regions in a scalable vector graphic (SVG) representation of a eukaryotic cell (Fig. 5), using a JavaScript framework that we developed for the COMPARTMENTS tool (46).
Coding Potential Calculation.
For each of the 20,209 human Swiss-Prot proteins, the UniProt ID was used to look up the corresponding Ensembl (Version 76) transcript IDs using the R package biomaRt (47); in cases where no hits were found, we used the UniProt IDs to search for Ensembl transcript IDs and National Center for Biotechnology Information (NCBI) sequence IDs. cDNA sequences were downloaded from Ensembl or NCBI where appropriate. Each cDNA sequence was then assessed for coding potential using CPC: the “Coding Potential Calculator” (34). The coding potential for each protein was calculated as the mean CPC score for all related transcript sequences. The final mean CPC score was interpreted as follows: ≤ −1 indicates noncoding; <0 indicates weak noncoding; >0 indicates weak coding; and ≥1 indicates coding.
Conclusions
The dark proteome is a key remaining frontier in the understanding of biological systems. This work will help focus future structural genomics and computational biology efforts to shed light on the remaining dark proteome, thus revealing currently unknown molecular processes of life.
Methods
In each subsection of Results and Discussion, we briefly outline the bioinformatics methods used to derive the presented results. SI Methods gives further details on how we derived the scores used in the work (darkness, disorder, coding potential, etc.), the statistics used to analyze the scores, and the density plots, 2D plots, linear diagrams, cell map, and tree maps used to visualize the scores. This work is accompanied by an online resource (darkproteins.org) that provides periodically updated versions of Datasets S1 and S2, and provides facilities to interactively explore these data.
Supplementary Material
Acknowledgments
We thank Drs. David James, Lars Juhl Jensen, Glenn F. King, William John Wilson, and Justin Cooper-White for helpful discussions. This work was supported by Commonwealth Scientific and Industrial Research Organisation’s Office of the Chief Executive Science Leader program and Computational and Simulation Sciences platform, as well as the Alexander von Humboldt Foundation, and the Fundação para a Ciência e Tecnologia.
Footnotes
The authors declare no conflict of interest.
Data deposition: This work is accompanied by an online resource (darkproteins.org) that provides periodically updated versions of Datasets S1 and S2, and provides facilities to interactively explore these data.
This article is a PNAS Direct Submission.
This article contains supporting information online at www.pnas.org/lookup/suppl/doi:10.1073/pnas.1508380112/-/DCSupplemental.
References
- 1.Berman HM, et al. The Protein Data Bank. Nucleic Acids Res. 2000;28(1):235–242. doi: 10.1093/nar/28.1.235. [DOI] [PMC free article] [PubMed] [Google Scholar]
- 2.Haas J, et al. The Protein Model Portal--A comprehensive resource for protein structure and model information. Database (Oxford) 2013;2013:bat031. doi: 10.1093/database/bat031. [DOI] [PMC free article] [PubMed] [Google Scholar]
- 3.Petrey D, et al. Template-based prediction of protein function. Curr Opin Struct Biol. 2015;32:33–38. doi: 10.1016/j.sbi.2015.01.007. [DOI] [PMC free article] [PubMed] [Google Scholar]
- 4.Chothia C. Proteins. One thousand families for the molecular biologist. Nature. 1992;357(6379):543–544. doi: 10.1038/357543a0. [DOI] [PubMed] [Google Scholar]
- 5.Holm L, Sander C. Mapping the protein universe. Science. 1996;273(5275):595–603. doi: 10.1126/science.273.5275.595. [DOI] [PubMed] [Google Scholar]
- 6.Levitt M. Nature of the protein universe. Proc Natl Acad Sci USA. 2009;106(27):11079–11084. doi: 10.1073/pnas.0905029106. [DOI] [PMC free article] [PubMed] [Google Scholar]
- 7.Nepomnyachiy S, Ben-Tal N, Kolodny R. Global view of the protein universe. Proc Natl Acad Sci USA. 2014;111(32):11691–11696. doi: 10.1073/pnas.1403395111. [DOI] [PMC free article] [PubMed] [Google Scholar]
- 8.Khafizov K, Madrid-Aliste C, Almo SC, Fiser A. Trends in structural coverage of the protein universe and the impact of the Protein Structure Initiative. Proc Natl Acad Sci USA. 2014;111(10):3733–3738. doi: 10.1073/pnas.1321614111. [DOI] [PMC free article] [PubMed] [Google Scholar]
- 9.Burley SK, et al. Structural genomics: Beyond the human genome project. Nat Genet. 1999;23(2):151–157. doi: 10.1038/13783. [DOI] [PubMed] [Google Scholar]
- 10.Marsden RL, Lewis TA, Orengo CA. Towards a comprehensive structural coverage of completed genomes: A structural genomics viewpoint. BMC Bioinformatics. 2007;8:86. doi: 10.1186/1471-2105-8-86. [DOI] [PMC free article] [PubMed] [Google Scholar]
- 11.Bertone G, Hooper D, Silk J. Particle dark matter: Evidence, candidates and constraints. Phys Rep. 2005;405(5-6):279–390. [Google Scholar]
- 12.Taylor WR, Chelliah V, Hollup SM, MacDonald JT, Jonassen I. Probing the “dark matter” of protein fold space. Structure. 2009;17(9):1244–1252. doi: 10.1016/j.str.2009.07.012. [DOI] [PubMed] [Google Scholar]
- 13.Travis J. Biological Dark Matter: Newfound RNA suggests a hidden complexity inside cells. Sci News. 2002;161(2):24–25. [Google Scholar]
- 14.Mattick JS. Challenging the dogma: The hidden layer of non-protein-coding RNAs in complex organisms. BioEssays. 2003;25(10):930–939. doi: 10.1002/bies.10332. [DOI] [PubMed] [Google Scholar]
- 15.Oldfield CJ, et al. Utilization of protein intrinsic disorder knowledge in structural proteomics. Biochim Biophys Acta. 2013;1834(2):487–498. doi: 10.1016/j.bbapap.2012.12.003. [DOI] [PMC free article] [PubMed] [Google Scholar]
- 16.Dunker AK, et al. Intrinsically disordered protein. J Mol Graph Model. 2001;19(1):26–59. doi: 10.1016/s1093-3263(00)00138-8. [DOI] [PubMed] [Google Scholar]
- 17.Oldfield CJ, Dunker AK. Intrinsically disordered proteins and intrinsically disordered protein regions. Annu Rev Biochem. 2014;83:553–584. doi: 10.1146/annurev-biochem-072711-164947. [DOI] [PubMed] [Google Scholar]
- 18.Carpenter EP, Beis K, Cameron AD, Iwata S. Overcoming the challenges of membrane protein crystallography. Curr Opin Struct Biol. 2008;18(5):581–586. doi: 10.1016/j.sbi.2008.07.001. [DOI] [PMC free article] [PubMed] [Google Scholar]
- 19.O’Donoghue SI, et al. Aquaria: Simplifying discovery and insight from protein structures. Nat Methods. 2015;12(2):98–99. doi: 10.1038/nmeth.3258. [DOI] [PubMed] [Google Scholar]
- 20.UniProt Consortium Activities at the Universal Protein Resource (UniProt) Nucleic Acids Res. 2014;42(Database issue):D191–D198. doi: 10.1093/nar/gkt1140. [DOI] [PMC free article] [PubMed] [Google Scholar]
- 21.Bairoch A, Apweiler R. The SWISS-PROT protein sequence database and its supplement TrEMBL in 2000. Nucleic Acids Res. 2000;28(1):45–48. doi: 10.1093/nar/28.1.45. [DOI] [PMC free article] [PubMed] [Google Scholar]
- 22.Remmert M, Biegert A, Hauser A, Söding J. HHblits: Lightning-fast iterative protein sequence searching by HMM-HMM alignment. Nat Methods. 2012;9(2):173–175. doi: 10.1038/nmeth.1818. [DOI] [PubMed] [Google Scholar]
- 23.Dosztányi Z, Csizmok V, Tompa P, Simon I. IUPred: Web server for the prediction of intrinsically unstructured regions of proteins based on estimated energy content. Bioinformatics. 2005;21(16):3433–3434. doi: 10.1093/bioinformatics/bti541. [DOI] [PubMed] [Google Scholar]
- 24.Ota M, et al. An assignment of intrinsically disordered regions of proteins based on NMR structures. J Struct Biol. 2013;181(1):29–36. doi: 10.1016/j.jsb.2012.10.017. [DOI] [PMC free article] [PubMed] [Google Scholar]
- 25.Huntley MA, Golding GB. Simple sequences are rare in the Protein Data Bank. Proteins. 2002;48(1):134–140. doi: 10.1002/prot.10150. [DOI] [PubMed] [Google Scholar]
- 26.Punta M, et al. Structural genomics target selection for the New York consortium on membrane protein structure. J Struct Funct Genomics. 2009;10(4):255–268. doi: 10.1007/s10969-009-9071-1. [DOI] [PMC free article] [PubMed] [Google Scholar]
- 27.Rost B, Casadio R, Fariselli P, Sander C. Transmembrane helices predicted at 95% accuracy. Protein Sci. 1995;4(3):521–533. doi: 10.1002/pro.5560040318. [DOI] [PMC free article] [PubMed] [Google Scholar]
- 28.Bigelow H, Rost B. PROFtmb: A web server for predicting bacterial transmembrane beta barrel proteins. Nucleic Acids Res. 2006;34(Web Server issue):W186–W188. doi: 10.1093/nar/gkl262. [DOI] [PMC free article] [PubMed] [Google Scholar]
- 29.Drake JW, Charlesworth B, Charlesworth D, Crow JF. Rates of spontaneous mutation. Genetics. 1998;148(4):1667–1686. doi: 10.1093/genetics/148.4.1667. [DOI] [PMC free article] [PubMed] [Google Scholar]
- 30.Cedano J, Aloy P, Pérez-Pons JA, Querol E. Relation between amino acid composition and cellular location of proteins. J Mol Biol. 1997;266(3):594–600. doi: 10.1006/jmbi.1996.0804. [DOI] [PubMed] [Google Scholar]
- 31.Andrade MA, O’Donoghue SI, Rost B. Adaptation of protein surfaces to subcellular location. J Mol Biol. 1998;276(2):517–525. doi: 10.1006/jmbi.1997.1498. [DOI] [PubMed] [Google Scholar]
- 32.Slabinski L, et al. The challenge of protein structure determination--lessons from structural genomics. Protein Sci. 2007;16(11):2472–2482. doi: 10.1110/ps.073037907. [DOI] [PMC free article] [PubMed] [Google Scholar]
- 33.Franceschini A, et al. STRING v9.1: Protein-protein interaction networks, with increased coverage and integration. Nucleic Acids Res. 2013;41(Database issue):D808–D815. doi: 10.1093/nar/gks1094. [DOI] [PMC free article] [PubMed] [Google Scholar]
- 34.Kong L, et al. CPC: Assess the protein-coding potential of transcripts using sequence features and support vector machine. Nucleic Acids Res. 2007;35(Web Server issue):W345–W349. doi: 10.1093/nar/gkm391. [DOI] [PMC free article] [PubMed] [Google Scholar]
- 35.Edwards H, Abeln S, Deane CM. Exploring fold space preferences of new-born and ancient protein superfamilies. PLOS Comput Biol. 2013;9(11):e1003325. doi: 10.1371/journal.pcbi.1003325. [DOI] [PMC free article] [PubMed] [Google Scholar]
- 36.Koonin EV, Wolf YI, Karev GP. The structure of the protein universe and genome evolution. Nature. 2002;420(6912):218–223. doi: 10.1038/nature01256. [DOI] [PubMed] [Google Scholar]
- 37.Tringe SG, Rubin EM. Metagenomics: DNA sequencing of environmental samples. Nat Rev Genet. 2005;6(11):805–814. doi: 10.1038/nrg1709. [DOI] [PubMed] [Google Scholar]
- 38.Chapman P, Stapleton G, Rodgers P, Micallef L, Blake A. Visualizing Sets: An Empirical Comparison of Diagram Types. In: Dwyer T, Purchace H, Delaney A, editors. Visualizing Sets: An Empirical Comparison of Diagram Types. Springer; Berlin: 2014. pp. 146–160. [Google Scholar]
- 39.Davey NE, Travé G, Gibson TJ. How viruses hijack cell regulation. Trends Biochem Sci. 2011;36(3):159–169. doi: 10.1016/j.tibs.2010.10.002. [DOI] [PubMed] [Google Scholar]
- 40.Silverman BW. Density Estimation for Statistics and Data Analysis. Chapman and Hall; London: 1986. [Google Scholar]
- 41.Ward JJ, Sodhi JS, McGuffin LJ, Buxton BF, Jones DT. Prediction and functional analysis of native disorder in proteins from the three kingdoms of life. J Mol Biol. 2004;337(3):635–645. doi: 10.1016/j.jmb.2004.02.002. [DOI] [PubMed] [Google Scholar]
- 42.Schlessinger A, Punta M, Yachdav G, Kajan L, Rost B. Improved disorder prediction by combination of orthogonal approaches. PLoS One. 2009;4(2):e4433. doi: 10.1371/journal.pone.0004433. [DOI] [PMC free article] [PubMed] [Google Scholar]
- 43.Hauser M, Mayer CE, Söding J. kClust: Fast and sensitive clustering of large protein sequence databases. BMC Bioinformatics. 2013;14:248. doi: 10.1186/1471-2105-14-248. [DOI] [PMC free article] [PubMed] [Google Scholar]
- 44.Benjamini Y, Hochberg Y. Controlling the false discovery rate: A practical and powerful approach to multiple testing. J R Stat Soc Series B Stat Methodol. 1995;57(1):289–300. [Google Scholar]
- 45.Shneiderman B. Tree visualization with Tree-Maps: 2-D space-filling approach. ACM T Graphic. 1992;11(1):92–99. [Google Scholar]
- 46.Binder JX, et al. COMPARTMENTS: Unification and visualization of protein subcellular localization evidence. Database (Oxford) 2014;2014:bau012. doi: 10.1093/database/bau012. [DOI] [PMC free article] [PubMed] [Google Scholar]
- 47.Durinck S, Spellman PT, Birney E, Huber W. Mapping identifiers for the integration of genomic datasets with the R/Bioconductor package biomaRt. Nat Protoc. 2009;4(8):1184–1191. doi: 10.1038/nprot.2009.97. [DOI] [PMC free article] [PubMed] [Google Scholar]
Associated Data
This section collects any data citations, data availability statements, or supplementary materials included in this article.


