Significance
The cobra mutants of Arabidopsis, such as cob-6, have impaired growth associated with a defect in cellulose synthesis. Mutations in MEDIATOR16 (MED16) reduce the number of misregulated genes in cob-6 mutants and suppress the phenotypes. This observation implicates MED16 in transcriptional responses to cell wall defects. Ectopic expression of two pectin methylesterase inhibitors (PMEIs) identified in a suppressor screen partially suppressed the growth defect in the cob-6 mutant. The results confirm that the PMEIs have significant in vivo activity, and provide evidence that pectin esterification can modulate cell wall properties.
Keywords: cell wall, cellulose, freezing tolerance, pectin, transcription
Abstract
We performed a screen for genetic suppressors of cobra, an Arabidopsis mutant with defects in cellulose formation and an increased ratio of unesterified/esterified pectin. We identified a suppressor named mongoose1 (mon1) that suppressed the growth defects of cobra, partially restored cellulose levels, and restored the esterification ratio of pectin to wild-type levels. mon1 was mapped to the MEDIATOR16 (MED16) locus, a tail mediator subunit, also known as SENSITIVE TO FREEZING6 (SFR6). When separated from the cobra mutation, mutations in MED16 caused resistance to cellulose biosynthesis inhibitors, consistent with their ability to suppress the cobra cellulose deficiency. Transcriptome analysis revealed that a number of cell wall genes are misregulated in med16 mutants. Two of these genes encode pectin methylesterase inhibitors, which, when ectopically expressed, partially suppressed the cobra phenotype. This suggests that cellulose biosynthesis can be affected by the esterification levels of pectin, possibly through modifying cell wall integrity or the interaction of pectin and cellulose.
Cellulose, the backbone of the primary plant cell wall, supports a complex polysaccharide-rich network formed of hemicelluloses and pectin (1). Unlike other cell wall polymers, cellulose is synthesized at the plasma membrane by the cellulose synthase complex, which synthesizes multiple β-1,4 glucan chains that hydrogen-bond to form cellulose fibrils (2–5). The proposed catalytic components of the cellulose synthase complex in higher plants are the CESA proteins. The stoichiometry of the cellulose synthase complex, as well as the exact number of glucan chains in individual cellulose fibrils, is unclear (3, 6, 7). Additional proteins involved in some aspect of the cellulose formation process have been implicated by analysis of transcriptional networks (8, 9). The Arabidopsis COBRA gene was found to be involved in cell expansion (10), and has been proposed to participate in cellulose synthesis (11).
During cellulose biosynthesis, other cell wall components can potentially affect the formation of fibrils by interacting with the nascent glucan chains or microfibrils. For example, in an Arabidopsis mutant that lacks xyloglucan, thicker cellulose fibrils have been observed (12), supporting the idea that xyloglucan prevents cellulose microfibril aggregation (13). Primary cell walls are also rich in pectin, which can bind cellulose with similar affinity to xyloglucan (14) and, in Arabidopsis primary cell walls, up to 50% of the cellulose is in direct contact with pectin (15). Thus, it may be anticipated that mutations that affect the structure or amount of pectin and other noncellulosic polysaccharides may impact cell wall assembly.
The factors that regulate cell wall composition are gradually being revealed (16). Several NAC transcription factors have been identified that control cell wall thickness (17, 18), and specific MYB transcription factors are known to be regulators of secondary cell wall biosynthesis (19, 20). Recently, a large transcriptional network that regulates secondary cell wall biosynthesis was elucidated, identifying tens of transcription factors and their role in a complex regulatory network leading to organized secondary wall formation in xylem (21). It was recently discovered that disruption of the genes for MEDIATOR5a and 5b can suppress the growth defects of Arabidopsis ref8, a mutant defective in lignin biosynthesis (22).
The mediator transcriptional coactivator complex has been found to be a crucial component in promoting eukaryotic transcription, as it links transcription factor binding at promoters to the activity of RNA polymerase II (Pol II) (23). Mediator is a multisubunit protein complex comprising between 25 and 34 subunits depending on the species (24, 25), and plays a role in the transcription of both constitutively expressed and inducible genes (26). Mediator has been described as being organized into four submodules: the head, middle, tail, and kinase domains (27). The tail submodule is thought to associate directly with transcriptional activators and repressors and the head with Pol II (23). The Arabidopsis mediator complex was purified (28) and, in combination with subsequent bioinformatic analysis (25), 34 subunits were identified, a number of these specific to plants (29). In Arabidopsis, roles for Mediator subunits have been demonstrated in the transcriptional response to a number of biotic (30–32) and abiotic stress conditions (33, 34) as well as in plant development (35, 36).
To better understand the role of COBRA in cellulose synthesis, we identified six independent suppressors of the cob-6 allele, named mongoose1–6. The mongoose1 (mon1) mutation mapped to the MEDIATOR16 [SENSITIVE TO FREEZING6 (SFR6)/MED16] locus. Analysis of the effects of mutations in MED16 on transcription identified two pectin methylesterase inhibitors (PMEIs) that are regulated by MED16. Overexpression of these PMEIs causes partial suppression of cobra, suggesting that pectin esterification is a significant factor in cell wall integrity.
Results
Isolation of mongoose Mutations.
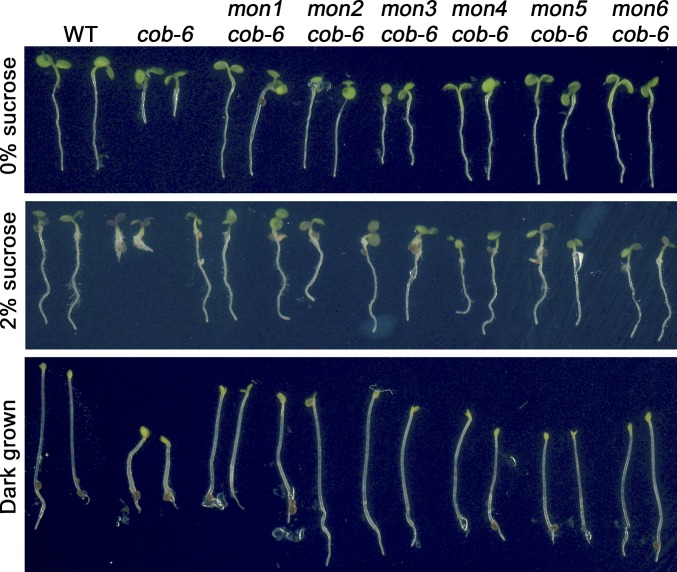
In an effort to understand the function of COBRA, we carried out a suppressor screen for restoration of root growth in plants homozygous for a cobra mutation. Because null mutations of COBRA are virtually sterile (37), we performed the screen using cob-6, a weak T-DNA allele that produces ∼10% of functional transcripts (38). Approximately 100,000 seeds of a cob-6 line were mutagenized with ethyl methanesulfonate (EMS), and seedlings were screened in the M2 generation. Six recessive cob-6 suppressors, mongoose1–6 (mon1–6), were identified (Fig. 1). Allelism tests revealed that the mon mutations represent six genes (Fig. S1). The cobra mutants are sensitive to increasing concentrations of sucrose (37), and all six suppressors restore normal growth of cob-6 on high sucrose concentrations as well as normal hypocotyl elongation in dark-grown seedlings (Fig. 1).
Fig. 1.
Phenotypes of the mongoose mutants. All mon lines are also homozygous for the cob-6 mutation.
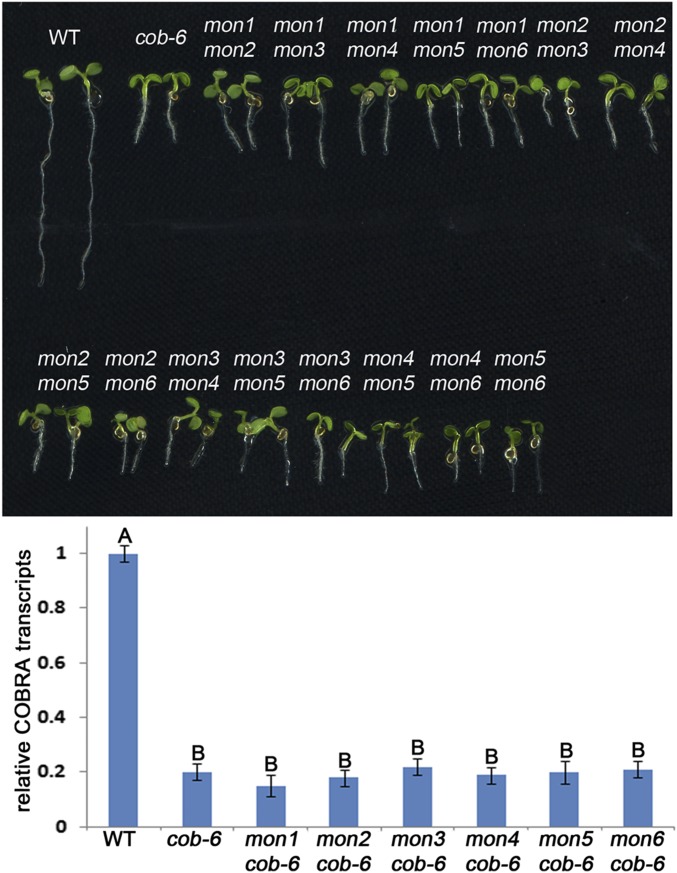
Fig. S1.
Allelism test and COBRA RNA levels in mon lines. (Upper) F1 progeny from crosses between the mon lines demonstrate six independent mutations in the six mon lines. (Lower) qRT-PCR analysis shows that COBRA transcript levels in all mon lines are similar to the levels in cob-6. Bars indicate means ± standard deviation. Letters above the bars indicate significant differences based on one-way ANOVA and Tukey's test, P < 0.05.
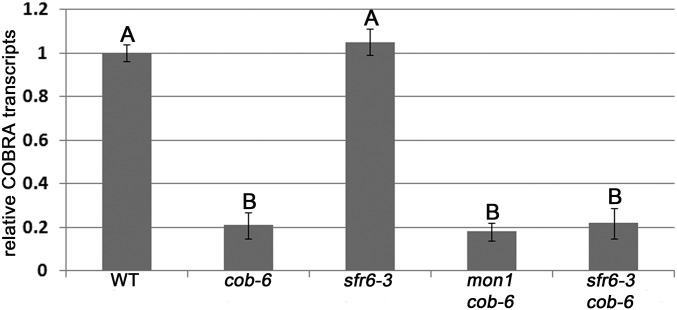
Previously described suppressors of the cob-6 mutation have been reported to act by increasing the transcript levels of cobra (39). In contrast, in all six mon lines, cobra transcript levels were similar to those in cob-6 (Fig. S1), implying that suppression in these lines is not due to increased accumulation of functional cobra transcripts.
Cellulose Characterization of mon1 cob-6.
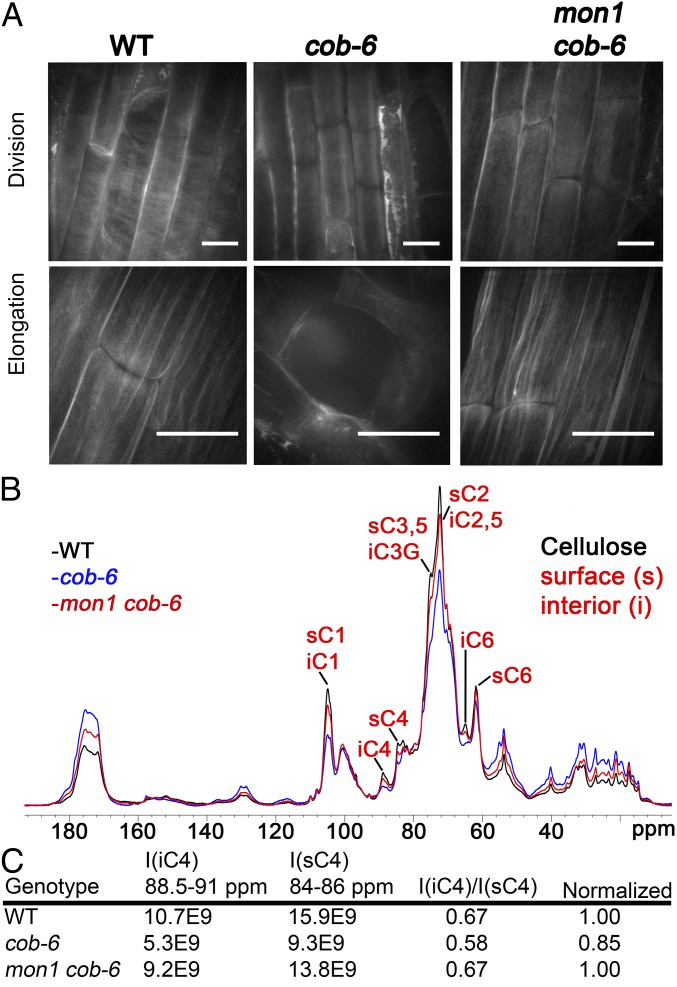
In addition to the growth phenotype, we assessed whether the cellulose defects caused by cob-6 were suppressed by mon-1. We analyzed the cellulose macrostructure and amounts in a line homozygous for mon1 and cob-6 (Fig. 2). Cellulose macrostructure was visualized using S4B staining (12). In cob-6, defects in cellulose macrostructure can be seen as early as in the division zone, at which point a fine network of thin fibrils can be seen in wild type. In cob-6 the network appears more diffuse than in wild type, and in addition there are patches of bright staining in cob-6 that are rarely observed in wild type. In mon1 cob-6 the staining looks similar to wild type, however with a less well defined pattern than in wild type. In mature wild-type root cells, cellulose fibrils can be clearly seen. The staining in cob-6 displays a higher variability between cells, with some cells exhibiting diagonal fibrils and some cells lacking stain completely. In mon1 cob-6, S4B staining of elongated cells in the root showed that the cellulose macrostructure was similar to wild type (Fig. 2A). Quantitative measurements of cellulose (Table 1) showed that there is an almost 50% reduction of cellulose in cob-6. The mon1 cob-6 lines showed a significant increase of cellulose levels compared with cob-6, albeit still below that of wild type (Table 1). The mon1 mutation also reversed changes in other polysaccharides in the cob-6 mutant, as indicated by changes in cell wall sugar composition of the mon1 cob-6 line (Table 1).
Fig. 2.
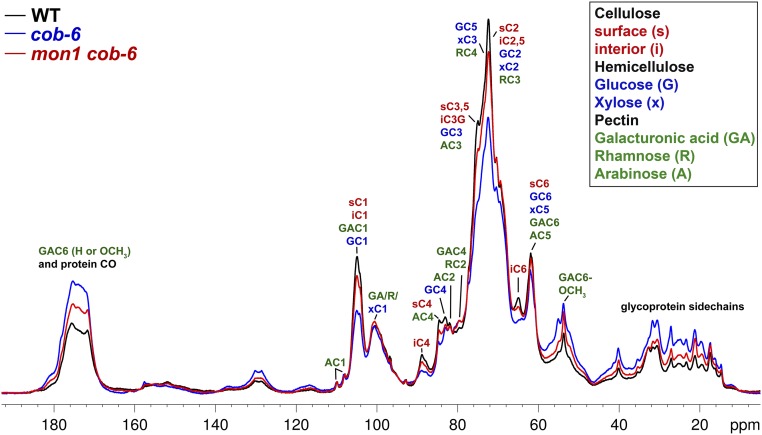
Cellulose macrostructure and amount in mon1 cob-6 mutant. (A) Cellulose in root cells stained with S4B. In cob-6, staining is reduced and less homogeneous, with some cells exhibiting almost a complete lack of fluorescence. Fibrils that can be detected are not as defined as in wild type, and are not as regularly oriented (Upper, cob-6). In mon1 cob-6, fibrils were similar to wild type, more so in elongated cells. (Scale bars, 15 μm.) (B) One-dimensional ssNMR analysis. Quantitative 13C direct polarization (DP)-MAS ssNMR spectra of wild-type, cob-6, and mon1 cob-6 cell walls. Additional annotation is shown in Fig. S8. (C) Relative intensities of interior and surface cellulose C4 signals from 13C DP-MAS spectra.
Table 1.
Monosaccharide and cellulose analysis
| Component | WT | cob-6 | mon1 cob-6 |
| Man | 6.2 ± 0.2A | 7.1 ± 0.2B | 6.5 ± 0.1A |
| Fuc | 4.1 ± 0.1A | 3.8 ± 0.2A | 4.2 ± 0.2A |
| Ara | 19.4 ± 0.6A | 37.5 ± 0.8B | 21.3 ± 0.3C |
| Glu | 9.8 ± 0.2A | 11.1 ± 0.2B | 10.0 ± 0.3A |
| Xyl | 20.9 ± 0.5A | 21.1 ± 0.4A | 20.5 ± 0.7A |
| Rha | 11.1 ± 0.3A | 11.4 ± 0.4A | 11.1 ± 0.3A |
| Gal | 45.8 ± 2.1A | 74.3 ± 4.2B | 50.1 ± 3.5A |
| Cellulose | 122 ± 3.2A | 65 ± 4.7B | 105 ± 2.4C |
Values are μg per mg of alcohol-insoluble residue. Superscripts represent statistical differences of P < 0.05 by two-way analysis of variance coupled to Tukey test. The high level of galactose (Gal) and arabinose (Ara) in cob-6 is due to the high level of pectin in the mutant.
Further analysis of the molecular structure of mon1 cob-6 cell walls compared with cob-6 and wild type was obtained using magic-angle-spinning (MAS) solid-state NMR (ssNMR) spectroscopy (Fig. 2C). We applied quantitative 13C ssNMR by direct polarization experiments using a long recycle delay. There were clear differences between wild type and cob-6 revealed in the 1D spectrum due to a significant reduction in cellulose and relative increase in pectin and glycoprotein. However, the 1D 13C spectrum of mon1 cob-6 resembles the wild-type spectrum, indicating a significant recovery of cellulose and decrease in pectin and glycoprotein. Furthermore, the ratio between the intensity of the interior C4 peak (iC4) and surface C4 peak (sC4) of cellulose was measured and, whereas cob-6 showed 15% lower crystallinity relative to wild type, mon1 cob-6 showed no difference relative to wild type (Fig. 2D). These results correlate with the cell wall analysis results (Table 1), and support the conclusion that suppression of cob-6 by mon1 involves restoration of cell wall composition and structure.
Mapping of mon1 to MED16/SFR6.
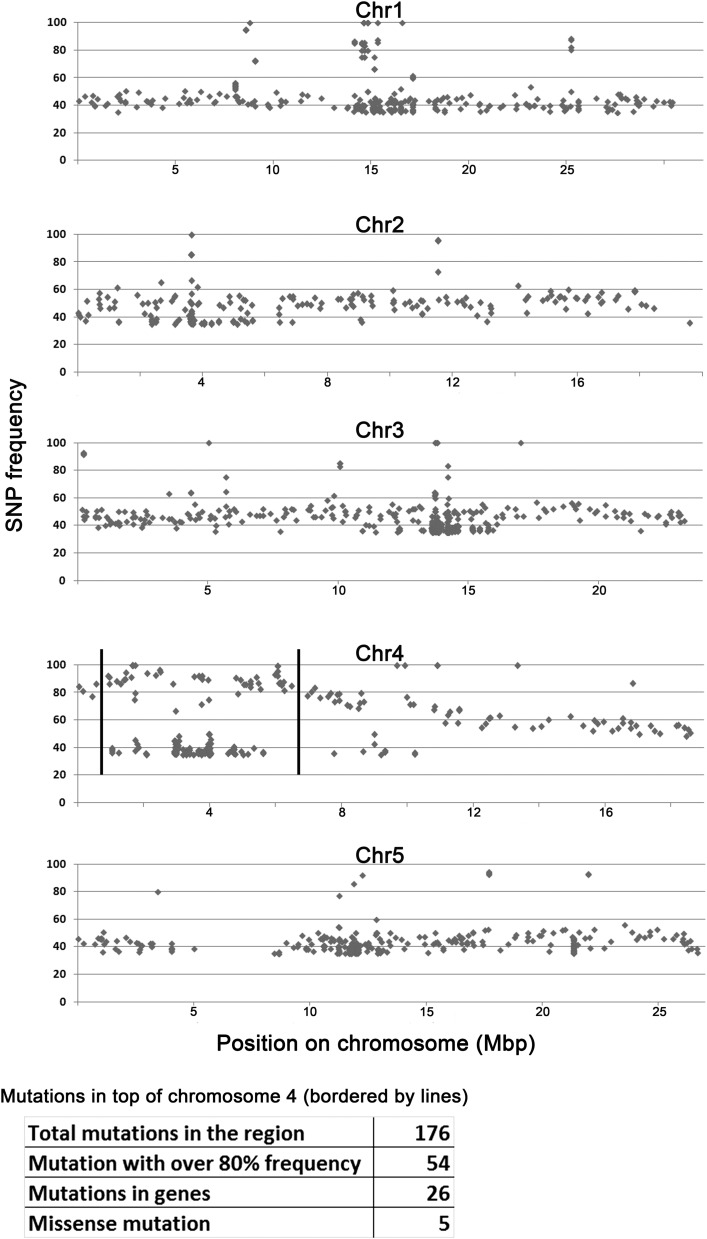
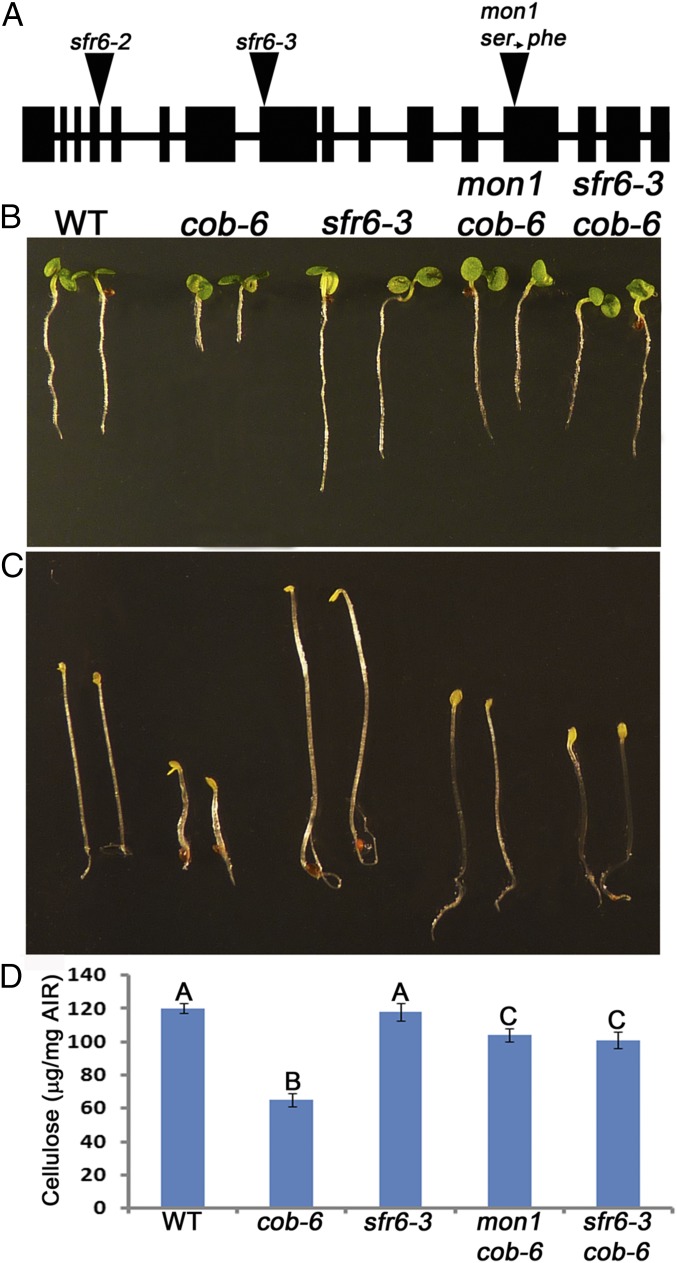
We used a bulk segregant approach with genomic DNA sequencing to identify the mon1 mutation (40). Two hundred segregants from a mon1 cob-6 line backcrossed to cob-6 were pooled for whole-genome sequencing. The analysis showed that the causative mutation was located on the upper arm of chromosome 4 (Fig. S2). In the region with single nucleotide polymorphism (SNP) frequencies over 80% there were 26 mutations in genes, but only 5 were missense mutations. One of the five candidate SNPs was a C-to-T mutation at position 5679 in AT4G04920, which leads to a serine-to-phenylalanine substitution at position 889 (Fig. 3A).
Fig. S2.
Genomic DNA sequence analysis for mon1. Two hundred F2 segregants from a mon1 cob-6 line backcrossed to cob-6 were pooled for whole-genome sequencing. To identify the region containing the causative mutation, we plotted the SNP frequencies (y axis). We identified the region of the causative mutation in the top arm of chromosome 4 (bordered by lines), and the table presents the statistics for this region. A point mutation in SFR6 with 95% SNP frequency was identified in this region.
Fig. 3.
Properties of med16 mutants. (A) Gene structure of AT4G04920 (MED16) showing T-DNA insertion sites and the mon1 mutation. (B and C) Growth phenotype of 7-d light-grown seedlings (B) and 5-d dark-grown hypocotyls (C) showing suppression of the cob-6 phenotype by mon1 and sfr6-3. (D) Cellulose measurement showing suppression of cob-6 cellulose deficiency. Values are means ± standard deviation. Letters above the bars indicate significant differences based on one-way ANOVA and Tukey's test, P < 0.05. AIR, alcohol-insoluble residue.
To test whether this was the causative mutation, we crossed cob-6 with a previously characterized T-DNA mutation in AT4G04920, sfr6-3. sfr6-3 cob-6 seedlings exhibited normal growth under light (Fig. 3B) and dark (Fig. 3C) conditions. Cellulose analysis (Fig. 3D) revealed that sfr6-3 cob-6 cellulose levels were similar to that in mon1 cob-6—significantly higher than cob-6 but lower than wild type. COBRA transcript levels in sfr6-3 cob-6 were the same as in cob-6 and mon1 cob-6 (Fig. S3). These results confirmed that the suppression in mon1 cob-6 is due to a mutation in AT4G04920.
Fig. S3.
COBRA suppression in cob-6 sfr6-3 is not due to restoration of COBRA transcript levels. qRT-PCR analysis shows that COBRA transcript levels in sfr6-3 cob-6 are the same as in cob-6 and mon1 cob-6. Bars indicate means ± standard deviation. Letters above the bars indicate significant differences based on one-way ANOVA and Tukey's test, P < 0.05.
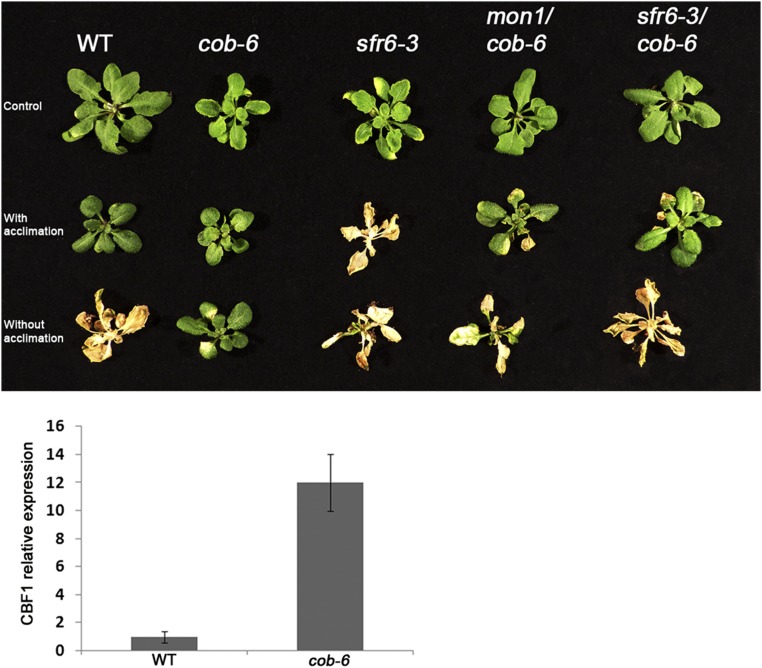
SFR6 was originally identified in a screen for plants that were sensitive to freezing after cold acclimation (41). sfr6-1 was mapped to AT4G04920, and additional T-DNA alleles, sfr6-2 and sfr6-3, were characterized (42). We performed freezing experiments for the different lines using acclimated and nonacclimated plants (Fig. S4). sfr6-3 was sensitive to freezing despite cold acclimation, as expected. With no cold acclimation, wild type was sensitive to freezing, as were sfr6-3, mon1 cob-6, and sfr6-3 cob-6. However, cob-6 was resistant to freezing, even when the plants were not acclimated (Fig. S4). We hypothesized that this might be due to altered expression of genes that respond to the cell wall damage of cob-6 that are also involved in cold acclimation. To test this, we analyzed the expression of CBF1, a transcription factor gene, known to be up-regulated during cold acclimation (43). The results showed that in cob-6 plants, CBF1 is up-regulated without cold acclimation (Fig. S4).
Fig. S4.
Freezing experiments. All lines were either cold-acclimated at 4 °C for 8 d (With acclimation) or directly (Without acclimation) transferred to −7 °C for 16 h. Photos were taken 5 d after the freezing treatments. cob-6 was found to be resistant to freezing, and qPCR showed that CBF1 expression is significantly higher in control cob-6 plants compared with wild type, suggesting that the cell wall damage in cob-6 triggers a stress response that likely confers freezing tolerance. Bars indicate means ± standard deviation.
Characterization of med16 Mutations as Suppressors of Cellulose Deficiency.
Seedlings of sfr6-3 are larger than wild type (Fig. 3), but there is no other obvious phenotype under normal growth conditions. However, sfr6 mutants were shown to be hypersensitive to freezing, as well as to osmotic stress (44). To test the response of sfr6-3 to perturbations in cellulose synthesis, we performed cellulose biosynthesis inhibitor assays (Table 2) using inhibitors with different effects on the cellulose synthase complex (45).
Table 2.
Mutations in MED16 cause resistance to cellulose biosynthesis inhibitors
| Growth inhibition | |||
| Line | Isoxaben, nM | DCB, nM | Indaziflam, pM |
| WT | 2.81 ± 0.21A | 102 ± 8A | 220 ± 10A |
| cob-6 | 0.53 ± 0.07B | 57 ± 2B | 167 ± 7B |
| sfr6-3 | 3.11 ± 0.15C | 138 ± 8C | 274 ± 11C |
| mon1 cob-6 | 2.58 ± 0.14D | 92 ± 5D | 198 ± 9D |
| sfr6-3 cob-6 | 2.51 ± 0.12D | 88 ± 7D | 191 ± 7D |
Root length of seedlings grown on vertically oriented agar plates with various concentrations of the inhibitors for 7 d was measured. GI50 is the concentration of drug that leads to 50% inhibition of root length relative to the growth of the line on agar without inhibitors. For statistical analysis, we performed ANOVA-coupled Tukey test on the raw data. The values are the means ± SE (n = 50).
To test the response to the different cellulose biosynthesis inhibitors, seedlings were grown on 1/2 Murashige and Skoog (MS) plates with increasing concentrations of the drugs for 7 d. For each line, 50 seedlings were measured and growth inhibition (GI50) was calculated. The results were similar for all three inhibitors (Table 2). cobra is hypersensitive to all of the inhibitors, although the response to isoxaben is more dramatic compared with dichlorobenzonitrile (DCB) and indaziflam. In contrast, sfr6-3 is significantly more resistant than wild type to all of the inhibitors. Although mon1 cob-6 and sfr6-3 cob-6 exhibit normal root length under control conditions or even when grown with 2% (wt/vol) sucrose, which enhances the cobra phenotype (Fig. 1), they were found to be more sensitive than wild type to the inhibitors, although still significantly more resistant than cob-6. The results in Table 2 demonstrate that the mutation in MED16 (sfr6-3) causes resistance to cellulose synthesis perturbation.
Analysis of the Effect of MED16 on Gene Regulation in the cobra Background.
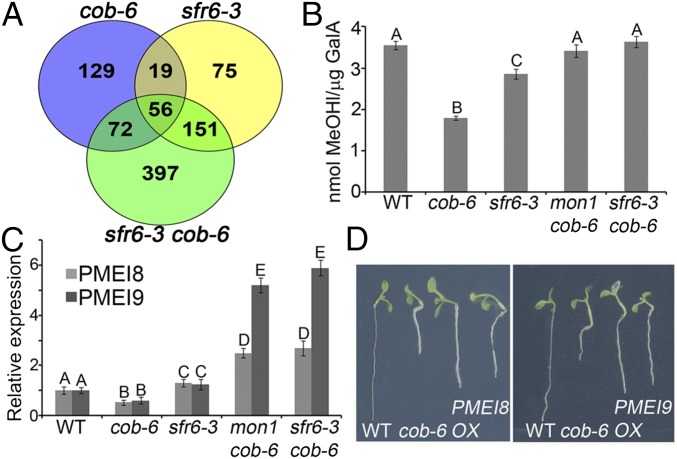
SFR6 was identified as MED16, a component of the MEDIATOR transcriptional coactivator complex (31), and is required for RNA polymerase II recruitment of genes regulated by the CBF transcription factor (34). More generally, MED16 has been shown to regulate expression of multiple genes associated with a variety of biological functions (31, 34). To identify potential targets of MED16 that are involved in cobra suppression, we performed RNA-sequencing (seq) analysis on 7-d-old seedlings of wild type, cob-6, sfr6-3, and sfr6-3 cob-6 (Fig. 4A, GEO accession no. GSE75199). Using a 1.5-fold difference in expression value with P < 0.05 as the cutoff parameter, we identified 277 misregulated genes in cob-6 (180 ↑, 97 ↓), 302 in sfr6-3 (29 ↑, 273 ↓), and 677 in sfr6-3 cob-6 (201 ↑, 476 ↓) (Fig. 4A). To have a broad look at the misregulated genes in the three mutants, we analyzed the data based on Gene Ontology (GO) annotation (Table S1). The largest difference was found to be in the signal transduction and DNA-dependent transcription classes, where, as expected, there is a larger portion of misregulated genes in these classes for sfr6-3 and sfr6-3 cob-6.
Fig. 4.
Increased transcription of pectin methylesterase inhibitors and the restoration of pectin esterification to wild-type levels in mon1 cob-6 and sfr6-3 cob-6. Bar graphs indicate means ± standard deviation. Letters above the bars indicate significant differences based on one-way ANOVA and Tukey's test, P < 0.05. (A) Venn diagram for RNA-seq analysis of cob-6, sfr6-3, and sfr6-3 cob-6 shows all genes that are up-regulated and down-regulated compared with wild type with 1.5-fold change or above. For further analysis, we looked at genes that are misexpressed between sfr6-3 cob-6 and cob-6, and identified 48 cell wall-related genes. (B) Pectin esterification levels in the different lines. Values were normalized to the total amount of galacturonic acid (Fig. S7A). (C) Steady-state mRNA levels of two pectin methylesterase inhibitor genes, AT3G17130 (PMEI8) and AT1G62770 (PMEI9), in various genotypes. (D) PMEI8 and PMEI9 were overexpressed (OX) in the cob-6 background. Ten independent lines were analyzed, all demonstrating partial suppression of the cob-6 phenotype.
Table S1.
GO classification of genes that exhibit altered expression (as % of all genes with altered expression)
| GO annotation | cob-6 | sfr6-3 | sfr6-3 cob-6 |
| Cell organization and biogenesis | 14.17 | 14.74 | 14.63 |
| Developmental processes | 17.24 | 14.74 | 17.04 |
| DNA or RNA metabolism | 1.15 | 0.36 | 1.76 |
| Electron transport or energy pathway | 7.29 | 6.11 | 5.30 |
| Other biological processes | 32.95 | 42.08 | 34.40 |
| Other cellular processes | 63.98 | 58.27 | 62.21 |
| Other metabolic processes | 58.24 | 53.59 | 58.84 |
| Protein metabolism | 11.11 | 11.87 | 15.11 |
| Response to biotic or abiotic stimulus | 32.18 | 36.69 | 31.19 |
| Response to stress | 42.14 | 42.80 | 34.24 |
| Signal transduction | 6.89 | 9.35 | 9.96 |
| Transcription, DNA-dependent | 6.89 | 9.35 | 12.54 |
| Transport | 26.82 | 23.02 | 22.02 |
| Unknown biological processes | 16.09 | 23.02 | 22.34 |
The numbers reflect the percentage of genes in the designated classification with altered expression.
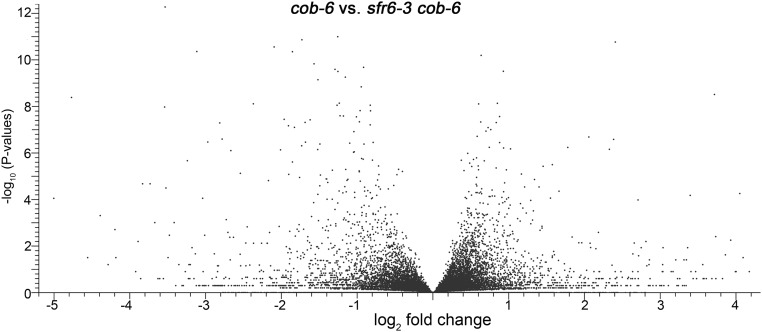
To learn more about the suppression mechanism, we focused on the comparison between cob-6 and sfr6-3 cob-6 (Fig. S5, GEO accession no. GSE75199 and Table S1). First, there are 148 genes that are misregulated in cob-6 and are not misregulated in sfr6-3 cob-6. It is difficult to evaluate the contribution of these genes to the cob-6 phenotype, because genes in this list are spread across cellular localization and function. To identify potential targets for further analysis, we raised the cutoff to twofold, keeping P < 0.05. The 20 most strongly misexpressed genes (10 highest and 10 lowest) were either unknown genes or genes with no obvious connection to cell wall biosynthesis. However, further down the list, 48 cell wall-related genes were differentially expressed twofold or greater between cob-6 and sfr6-3 cob-6 (14 ↑, 34 ↓). The largest subgroup within this list consisted of 11 genes involved in the modification of pectin. Characterization of other cellulose-deficient mutants has revealed that the pectin fraction is highly altered in response to reduction in cellulose (46), so we focused additional studies on this group.
Fig. S5.
Volcano plot comparing differences in gene expression between cob-6 and sfr6-3 cob-6. Data for this plot are in GEO accession no. GSE75199.
The Role of MED16 in Pectin Esterification.
Pectin is deposited in the apoplast in a highly esterified form, and esterification level decreases during development. Nonesterified pectin can form calcium bridges that affect its rigidity (47). The degree of pectin esterification was decreased in cob-6 compared with wild type (Fig. 4B). However, the degree of esterification in cob-6 mon1 or cob-6 srf6-3 was similar to wild type. This suggests that the suppression mechanism involves the restoration of pectin esterification, at least in part.
We identified 11 misregulated pectin-related genes in sfr6-3 cob-6 compared with cob-6: 4 pectin lyase-like, 2 pectin methylesterases (PMEs), and 5 PMEIs. We focused on the two most highly misexpressed PMEIs, AT3G17130 (PMEI8) and AT1G62770 (PMEI9).
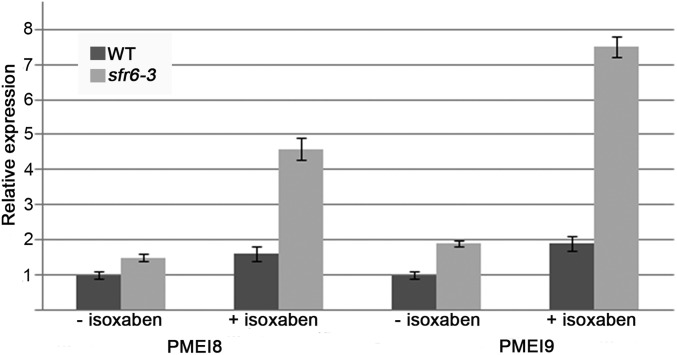
PMEIs can bind to PMEs and inhibit their activity, and have been shown to participate in growth control (48). PMEI8 is expressed at relatively low levels during development, whereas PMEI9 expression is higher in seedlings compared with the rest of the developmental stages [based on expression profiles from Genevestigator (49)]. We tested the expression of both PMEI8 and PMEI9 in the different lines using quantitative (q)RT-PCR (Fig. 4C). Consistent with the RNA-seq data, both PMEI8 and PMEI9 were up-regulated in mon1 cob-6 and sfr6-3 cob-6 compared with wild type (Fig. 4A), the PMEI9 increase being more striking. PMEI8 and PMEI9 expression was slightly reduced in cob-6 single mutants, and slightly higher in sfr6-3, but to a lesser extent. The differences in expression between sfr6-3 and mon1 cob-6 suggested that PMEI8 and PMEI9 expression is exaggerated when there are cell wall defects. To test this, we analyzed PMEI8 and PMEI9 expression in sfr6-3 after treatment with isoxaben. The results (Fig. S6) showed that, indeed, PMEI8 and PMEI9 are up-regulated significantly when sfr6-3 seedlings are treated with isoxaben, supporting the idea that regulation of PMEI8 by sfr6-3 is affected by an additional stress. To directly test the effect of these two PMEIs on the cob-6 phenotype, we expressed the genes under control of the 35S promoter in the cob-6 background (Fig. 4D). The results demonstrate that overexpression of PMEI8 or PMEI9 causes partial suppression of the cob-6 phenotype.
Fig. S6.
PMEI8 and PMEI9 are up-regulated in sfr6-3 when treated with isoxaben. Seedlings were grown with 1 nM isoxaben or with only DMSO (no isoxaben) for 7 d. PMEI8 and PMEI9 expression was analyzed using qRT PCR. Bars indicate means ± standard deviation.
Discussion
Isolation of cobra Suppressors.
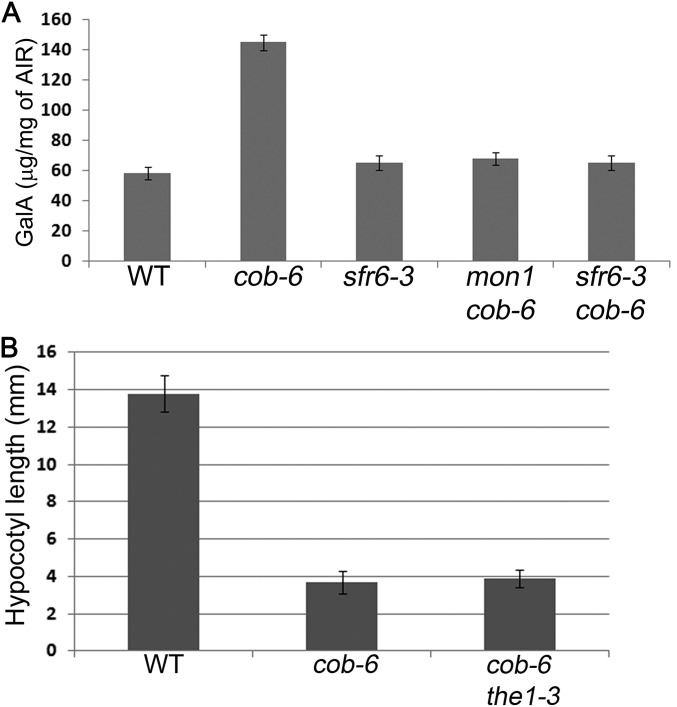
The phenotype of cobra mutants includes reduced growth and swollen organs that are associated with defects in cellulose synthesis and deposition (10, 37). Suppression of the swollen root phenotype, but not the root elongation defect, of a cobra mutant was observed in the IAA-Alanine Resistant 4 (iar4) mutant (50). The mechanism was suggested to be related to the role of auxin in regulating cell wall loosening (50). Another cellulose-deficient mutant, procuste, was suppressed by mutation in a receptor-like kinase, theseus1 (51). However, theseus1 does not suppress cobra (Fig. S7B), suggesting that not all cellulose deficiencies are equal.
Fig. S7.
Additional information about the various lines. (A) Galacturonic acid content in the different genotypes. (B) The theseus1 mutation does not suppress the cobra phenotype. Hypocotyl length was measured in dark-grown seedlings grown on 1/2MS medium without carbohydrate. n ≥ 20. Bars indicate means ± standard deviation.
Fig. S8.
Quantitative 13C DP-MAS ssNMR spectra of wild-type, cob-6, and mon1 cob-6 cell walls. This figure shows the same data as in Fig. 2 but provides additional assignments of selected carbons from noncellulosic components of the cell walls.
The relatively large number of cobra suppressors reported here raises the possibility that some or all of the mon mutations may be in a common pathway for what is obviously a dispensable function under laboratory conditions. Additional research will be required to characterize the functions of the other MONGOOSE genes, and to identify any other mutations that can be recovered by expanding the screen. Whatever the case, identification of med16 (sfr6/mon1) as a cob-6 suppressor contributes to our knowledge of the transcriptional regulation of genes involved in cell wall biosynthesis or remodeling.
mediator16 as a cobra Suppressor.
Mediator subunits, particularly those comprising the tail submodule, interact with transcription factors to control gene expression (52). However, no MED16-interacting transcription factors from plants have been identified to date. Lines carrying a mutation in MED16 (EMS line sfr6-1, T-DNA insertion lines sfr6-2, sfr6-3, and yid1) do not exhibit major phenotypic changes under normal conditions. sfr6 mutants are slightly larger than their wild-type counterparts at the seedling stage (Fig. 3) (42), and exhibit pale, chlorotic leaves (42, 53), which was recently found to be attributable to iron deficiency (53). The largest phenotypic differences observed between med16 mutants and wild-type plants are seen under abiotic and biotic stress conditions; med16 mutants are sensitive to freezing, osmotic stress, pathogen attack, and iron deficiency (42, 44, 53). RNA-seq data show that in sfr6-3, 302 genes are misregulated compared with wild type, whereas 677 genes are misregulated in an sfr6-3 cob-6 double mutant.
Based on expression data from Genevestigator (49), MED16 expression does not change dramatically under perturbation conditions. Due to its position in the yeast mediator complex, where Sin4 (a yeast MED16 homolog) links the so-called triad of tail subunits to the rest of the complex (54), it has been suggested that some of the phenotypes associated with loss of MED16 in Arabidopsis may be attributable to loss of other tail subunits that require MED16 to tether them to the complex (34).
Transcriptome analysis has been carried out previously for sfr6 using microarrays on 7- to 8-d-old seedlings (34). These studies had implicated MED16 as a factor in the transcriptional regulation of some aspects of cell wall biosynthesis or remodeling. Here we performed RNA-seq analysis on sfr6-3 as well as sfr6-3 cob-6. Three hundred and two genes are misregulated in sfr6-3, whereas 677 genes are misregulated in sfr6-3 cob-6. One hundred and forty-eight genes that are misregulated in cob-6 are not misregulated in sfr6-3 cob-6. It is not obvious whether this is a cause or an effect of the suppression of cob-6 by sfr6-3. It is possible that the elevation in cellulose levels in mon1 cob-6 causes suppression of the cob-6 phenotype. On the one hand it is possible that the cob-6 mutation triggers a cascade of gene expression changes that cause the phenotypes, and that a phenotypically important part of that cascade is blocked by the sfr6-3 mutation. Alternatively, the phenotypes might be caused directly by the loss of COBRA function in cob-6, the usual working assumption (37), and the sfr6-3 mutation suppresses those effects by altering expression of genes that encode compensating functions. Unfortunately, the large number of misregulated genes is a barrier to a simple explanation for the mechanistic basis for the suppression of cob-6 by mutations in MED16. However, the observation that ectopic constitutive expression of two MED16-regulated genes (PMEI8, PMEI9) causes partial suppression of the cob-6 phenotype suggests that a significant component of the suppression effect is via pectin modification.
Pectin Esterification and Freezing Tolerance.
Both pectin amounts and degree of esterification increase after cold acclimation (55). Therefore, the regulation of pectin content and degree of esterification that is partially mediated by MED16 might contribute to the established role of MED16 in freezing tolerance.
In cob-6 plants the pectin is highly nonesterified, and the plants are resistant to freezing (Fig. S4). However, CBF1 is up-regulated in cob-6 even when plants are not cold-acclimated. This fact is likely to be the most significant factor in the freezing tolerance of nonacclimated cob-6. Assuming that the primary effect of the cob-6 mutation is a defect in cellulose synthesis, the implication seems to be that altered cell wall structure can induce CBF1.
Pectin Esterification and Cellulose Biosynthesis.
We have shown that the pectin fraction in the cobra mutant is highly nonesterified (Fig. 4B). Introduction of PMEI8 and PMEI9 under control of the 35S promoter increases the amount of pectin esterification in the cob-6 mutant to essentially wild-type levels and partially suppresses the cobra phenotype. This effect runs counter to the notion that increased Ca2+-mediated cross-linking of nonesterified pectin may compensate for a defect in cellulose synthesis by strengthening the cell wall. Thus, it is unclear why increased nonesterified pectin partially suppressed the cobra phenotype. One possibility arises from the observation that changes in pectin esterification can trigger brassinosteroid signaling, resulting in cell wall remodeling (56). Perhaps such remodeling compensates for the cell wall defects in cobra mutants. Another, highly speculative, possibility is that pectin methylation may affect the binding of pectin to nascent cellulose microfibrils during cellulose synthesis. Pectin has been shown to bind cellulose (57). Perhaps methylated pectin is less disruptive or inhibitory to cellulose crystallization, a process that appears to be defective in the cobra mutants, or to some other aspect of cell wall assembly.
Materials and Methods
Arabidopsis ecotype Columbia was used for all experiments, and was grown as described (12). Seeds were mutagenized as described (35). The mon1 mutation was identified using bulk segregant analysis of 200 homozygous mon1 F2 segregants from a backcross to the cob-6 mutant (40). Freezing experiments were carried out as described (42). Spinning-disk confocal microscopy was as described (12). Uniformly 13C-labeled primary cell walls were prepared and analyzed by NMR (57, 58). Cellulose biosynthesis inhibitor assays (45) and monosaccharide and cellulose analyses were performed as previously described (59). Pectin esterification was measured as previously reported (60). More detailed materials and methods are available in SI Materials and Methods.
SI Materials and Methods
Growth Conditions.
Arabidopsis ecotype Columbia seeds and various mutant lines were sterilized and germinated on Murashige and Skoog (MS) plates (one-half-strength MS salts, 0.8% agar, and 0.05% Mes, pH 5.7). Seedlings were then grown vertically at 22 °C under continuous light for 5 d before being transferred to pots in a growth chamber at 22 °C under a 16-h light/8-h dark cycle.
EMS Mutagenesis.
The cob-6 mutant (SALK_051906) was mutagenized with ethyl methanesulfonate (EMS). The screen for increased root elongation was performed on vertically oriented 1/2MS plates with 2% (wt/vol) sucrose. Putative suppressors were transplanted into soil and genotyped to confirm homozygosis for the cob-6 mutation.
Mapping.
The mon1 line NS225, which was used for all experiments in this study, was backcrossed to cob-6. The F2 population was grown on vertical 1/2MS plates, and 200 seedlings with mon1 phenotype were pooled for a genomic DNA preparation. The genomic DNA was submitted to the Vincent J. Coates DNA-sequencing facility at the University of California, Berkeley, for library preparation and sequencing. The DNA was sequenced using one lane of 100-bp single-end reads on a HiSeq 2000 (Illumina). The reads were mapped onto a Col-0 reference genome [The Arabidopsis Information Resource (TAIR); https://www.arabidopsis.org], and putative SNPs were identified using Genome Workbench software (CLC bio). The SNP frequency was plotted based on chromosomal location (Fig. S2). The majority of random mutations should be segregating, resulting in ∼50% frequency. The causative mutation region is not segregating, because the 200 plants were selected based on suppression and therefore carry the mon1 mutation as a homozygote, resulting in ∼100% SNP frequency. In this region (top arm of chromosome 4) there were 176 SNPs, including 26 in coding regions. Five of them were missense mutations. To identify the causative mutation out of these five candidates, we crossed cob-6 to the corresponding T-DNA lines and assessed the double mutant phenotype.
qRT-PCR.
All qRT-PCR experiments were done with three biological replicates and two technical replicates per biological sample. Total RNA was extracted from homogenized tissue frozen in liquid nitrogen and digested with DNase (79254; Qiagen), and 1 μg RNA/20 μL reaction was used to generate first-strand cDNA using SuperScript II Reverse Transcriptase (Invitrogen) following the manufacturer’s protocol. For qRT-PCR experiments, cDNA was obtained as described above and 1 μL was used to analyze gene expression using SYBR GreenER qPCR SuperMix (Life Technologies) and the following PCR conditions: 50 °C for 2 min, 95 °C for 10 min, and 40 cycles of (95 °C for 15 s, 59 °C for 30 s, and 68 °C for 45 s), followed by a fluorescence reading. Ribosomal RNA 60S was amplified in parallel on each plate for normalization. “No template” controls and melting curves were examined to ensure against contamination and primer–dimer formation. The relative starting quantities of each gene were determined by the ΔΔCT method, as described (61).
RNA-Seq Analysis.
For RNA-seq experiments, seedlings were grown in 24 h light for 7 d on 1/2MS agar plates with no additional carbohydrates. RNA-seq was carried out using two biological replicate samples for wild type, cob-6, sfr6-3, and sfr6-3 cob-6, each sample consisting of ∼150 seedlings. All seedlings were grown together, with two different genotypes in one plate. RNA was extracted using an RNeasy Plant Mini Kit (74903; Qiagen) according to the manufacturer’s instructions. Library preparation and sequencing were performed at the Vincent J. Coates Genomics Sequencing Laboratory at the University of California, Berkeley. Analysis was done in CLC Genomics Workbench software and the annotated Arabidopsis genome version TAIR10. The trimmed paired reads were mapped to the CLC assembly using default parameters (minimum length of 0.9 and similarity of 0.8). Expression values were reported as RPKMs (reads per kilobase of exon model per million mapped reads). Differential expression analysis was done by CLC Genomics Workbench software using Empirical analysis of DGE test (details about the test can be found at www.clcsupport.com/clcgenomicsworkbench/current/index.php?manual=Empirical_analysis_DGE.html.
Freezing Experiments.
Freezing experiments were done based on ref. 42. Plants were grown for 3 wk, and then transferred directly to −7 °C for 16 h (nonacclimated) or after 8 d at 4 °C (acclimated). After the freezing treatment, plants were returned to normal growth conditions for 4 d before pictures were taken. Freezing experiments were performed three independent times, and each time seven plants from each genotype were tested.
Cellulose Biosynthesis Inhibitor Assays.
Cellulose biosynthesis inhibitor assays were performed as previously reported (45). Arabidopsis seedlings of wild type, cob-6, sfr6-3, mon1, and cob-6 sfr6-3 were grown vertically on 1/2MS plates with different concentrations of indaziflam (32096; Sigma; 0, 100, 250, 500, 1,000, and 2,500 pM), isoxaben (0, 0.1, 0.25, 0.5, 1, and 2.5 nM), or DCB (0, 25, 50, 100, 150, 250, and 400 nM). Root lengths of 50 7-d-old seedlings were measured manually using ImageJ software (NIH). The data were fitted using sigmoidal dose–response + Hill slope [y = min + ([max − min]/[1 + 10(logEC50-x)Hillslope])] using SigmaPlot. For statistical analysis, we performed ANOVA-coupled Tukey test on the raw data.
Confocal Microscopy.
Sterile seedlings were stained with S4B for 30 min as previously published (12). Seedlings were observed using a 100× 1.4 N.A. oil-immersion objective on a Leica SD6000 microscope attached to a Yokogawa CSU-X1 spinning-disk head with a 561-nm laser and controlled by MetaMorph software (Molecular Devices). Z series were recorded with a 200-nm step size and analyzed using ImageJ. Average projections of contiguous fields of view were stitched together using ImageJ.
Monosaccharide and Cellulose Analyses.
Monosaccharide and cellulose analyses were performed as previously described (59). Cellulose analysis was based on ref. 62. The alcohol-insoluble residue (AIR) fraction was prepared from 150 mg of seedling tissue. To remove starch, AIR fractions were treated with 0.5 μg α-amylase (A-6380; Sigma) and 22 μL Pullulanase M2 (Megazyme) for 16 h at 37 °C. The AIR preparation was treated with 1.45 mL 4% sulfuric acid shortly before heating (121 °C, 60 min). After cooling to room temperature, the reaction mixture was vortexed and a 1:50 dilution was used for HPLC analysis. Cellulose analysis was based on comparing hydrolysis with 4% sulfuric acid with 72% sulfuric acid. Cellulose (μg cellulose per mg tissue) was calculated by subtracting the amount of glucose from the 4% sulfuric acid from the amount of glucose from the 72% sulfuric acid. Released monosaccharides were analyzed using an ICS-3000 HPLC system (Thermo Fisher Scientific) equipped with a pulsed-amperometric detector. Samples were injected onto a 150 × 3-mm CarboPac PA20 column (Thermo Fisher Scientific) with a 50 × 3-mm guard column of the same material and eluted at 30 °C with 2 mM potassium hydroxide at a flow rate of 0.4 mL/min.
Cell Wall Structural Analysis by 13C MAS ssNMR.
For solid-state NMR (ssNMR) experiments, uniformly 13C-labeled primary cell walls were prepared as described previously (57). 13C ssNMR spectra were acquired on a 17.6-T (700 MHz 1H frequency) Bruker Avance spectrometer equipped with a 3.2-mm Efree triple-resonance magic-angle-spinning (MAS) probe from Bruker. The spectra were recorded at a 14-kHz MAS rate and a temperature of 280 K. 13C chemical shifts were referenced externally to adamantane signal at 38.48 ppm (58). 13C direct polarization (DP) experiments with a long recycle delay, 20 s, were used for quantitative measurements. Spectra were acquired with a 48-ms acquisition time, 83-kHz 1H SPINAL-64 decoupling (63), and a 5-µs pulse width on 13C. 13C chemical shifts were assigned based on reported literature assignments (57). The spectra obtained were processed and analyzed using Bruker TopSpin 3.2 software.
Pectin Esterification Assay.
Pectin esterification was measured as previously reported (60). One milligram of AIR material was incubated with 0.5 mL 0.25 M NaOH on a rocking platform. After 1 h, 0.5 mL 0.25 M HCl was added and 50 μL of this mixture was incubated with 90 μL 0.2 M phosphate buffer (pH 7.2), 50 μL water, and 10 μL alcohol oxidase (0.01 U/μL) at 30 °C for 10 min. Two hundred microliters of Purpald (5 mg/mL in 0.5 M NaOH) was then added and the mixture was vigorously shaken and incubated at 30 °C for 30 min. After addition of 600 μL water, the absorbances of the solutions were determined at 550 nm against a reagent blank and a standard curve of methanol in the range of 0–70 nmol. Pectin esterification was normalized based on the galacturonic acid amounts that were measured as part of the monosaccharide analysis (Monosaccharide and Cellulose Analyses).
Genes Misexpressed in cob-6, sfr6-3, and sfr6-3 cob-6.
GEO database accession no. GSE75199 contains the raw data of the RNA-seq experiments.
Acknowledgments
We thank Trevor Yeats, Tamara Vellosillo, Sam Coradetti, and Alex Schultink for helpful advice and for their comments on the manuscript. This work was supported by grants from the Energy Biosciences Institute (to C.R.S. and D.E.W.) and by the US Department of Agriculture National Institute of Food and Agriculture (Hatch Project CA-B-PLB-0077-H). N.S. was the recipient of Postdoctoral Award FI-434-2010 from the Binational Agricultural Research and Development Fund. This work used the Vincent J. Coates Genomics Sequencing Laboratory at the University of California, Berkeley, supported by NIH S10 Instrumentation Grants S10RR029668 and S10RR027303.
Footnotes
The authors declare no conflict of interest.
Data deposition: The data reported in this paper have been deposited in the Gene Expression Omnibus (GEO) database, www.ncbi.nlm.nih.gov/geo (accession no. GSE75199).
This article contains supporting information online at www.pnas.org/lookup/suppl/doi:10.1073/pnas.1521675112/-/DCSupplemental.
References
- 1.Somerville C, et al. Toward a systems approach to understanding plant cell walls. Science. 2004;306(5705):2206–2211. doi: 10.1126/science.1102765. [DOI] [PubMed] [Google Scholar]
- 2.Wallace IS, Somerville CR. A blueprint for cellulose biosynthesis, deposition, and regulation in plants. In: Fukuda H, editor. Plant Cell Wall Patterning and Cell Shape. Wiley, Hoboken, NJ; 2015. pp. 65–97. [Google Scholar]
- 3.McFarlane HE, Döring A, Persson S. The cell biology of cellulose synthesis. Annu Rev Plant Biol. 2014;65:69–94. doi: 10.1146/annurev-arplant-050213-040240. [DOI] [PubMed] [Google Scholar]
- 4.Li S, Bashline L, Lei L, Gu Y. Cellulose synthesis and its regulation. Arabidopsis Book. 2014;12:e0169. doi: 10.1199/tab.0169. [DOI] [PMC free article] [PubMed] [Google Scholar]
- 5.Kumar M, Turner S. Plant cellulose synthesis: CESA proteins crossing kingdoms. Phytochemistry. 2015;112:91–99. doi: 10.1016/j.phytochem.2014.07.009. [DOI] [PubMed] [Google Scholar]
- 6.Fernandes AN, et al. Nanostructure of cellulose microfibrils in spruce wood. Proc Natl Acad Sci USA. 2011;108(47):E1195–E1203. doi: 10.1073/pnas.1108942108. [DOI] [PMC free article] [PubMed] [Google Scholar]
- 7.Sethaphong L, et al. Tertiary model of a plant cellulose synthase. Proc Natl Acad Sci USA. 2013;110(18):7512–7517. doi: 10.1073/pnas.1301027110. [DOI] [PMC free article] [PubMed] [Google Scholar]
- 8.Gu Y, et al. Identification of a cellulose synthase-associated protein required for cellulose biosynthesis. Proc Natl Acad Sci USA. 2010;107(29):12866–12871. doi: 10.1073/pnas.1007092107. [DOI] [PMC free article] [PubMed] [Google Scholar]
- 9.Persson S, Wei H, Milne J, Page GP, Somerville CR. Identification of genes required for cellulose synthesis by regression analysis of public microarray data sets. Proc Natl Acad Sci USA. 2005;102(24):8633–8638. doi: 10.1073/pnas.0503392102. [DOI] [PMC free article] [PubMed] [Google Scholar]
- 10.Schindelman G, et al. COBRA encodes a putative GPI-anchored protein, which is polarly localized and necessary for oriented cell expansion in Arabidopsis. Genes Dev. 2001;15(9):1115–1127. doi: 10.1101/gad.879101. [DOI] [PMC free article] [PubMed] [Google Scholar]
- 11.Liu L, et al. Brittle Culm1, a COBRA-like protein, functions in cellulose assembly through binding cellulose microfibrils. PLoS Genet. 2013;9(8):e1003704. doi: 10.1371/journal.pgen.1003704. [DOI] [PMC free article] [PubMed] [Google Scholar]
- 12.Anderson CT, Carroll A, Akhmetova L, Somerville C. Real-time imaging of cellulose reorientation during cell wall expansion in Arabidopsis roots. Plant Physiol. 2010;152(2):787–796. doi: 10.1104/pp.109.150128. [DOI] [PMC free article] [PubMed] [Google Scholar]
- 13.Whitney SEC, Brigham JE, Darke AH, Reid JSG, Gidley MJ. In vitro assembly of cellulose/xyloglucan networks: Ultrastructural and molecular aspects. Plant J. 1995;8:491–504. [Google Scholar]
- 14.Zykwinska AW, Ralet MC, Garnier CD, Thibault JF. Evidence for in vitro binding of pectin side chains to cellulose. Plant Physiol. 2005;139(1):397–407. doi: 10.1104/pp.105.065912. [DOI] [PMC free article] [PubMed] [Google Scholar]
- 15.Wang T, Zabotina O, Hong M. Pectin-cellulose interactions in the Arabidopsis primary cell wall from two-dimensional magic-angle-spinning solid-state nuclear magnetic resonance. Biochemistry. 2012;51(49):9846–9856. doi: 10.1021/bi3015532. [DOI] [PubMed] [Google Scholar]
- 16.Zhong R, Ye ZH. Regulation of cell wall biosynthesis. Curr Opin Plant Biol. 2007;10(6):564–572. doi: 10.1016/j.pbi.2007.09.001. [DOI] [PubMed] [Google Scholar]
- 17.Mitsuda N, Seki M, Shinozaki K, Ohme-Takagi M. The NAC transcription factors NST1 and NST2 of Arabidopsis regulate secondary wall thickenings and are required for anther dehiscence. Plant Cell. 2005;17(11):2993–3006. doi: 10.1105/tpc.105.036004. [DOI] [PMC free article] [PubMed] [Google Scholar]
- 18.Zhong R, Demura T, Ye ZH. SND1, a NAC domain transcription factor, is a key regulator of secondary wall synthesis in fibers of Arabidopsis. Plant Cell. 2006;18(11):3158–3170. doi: 10.1105/tpc.106.047399. [DOI] [PMC free article] [PubMed] [Google Scholar]
- 19.Wang S, et al. Regulation of secondary cell wall biosynthesis by poplar R2R3 MYB transcription factor PtrMYB152 in Arabidopsis. Sci Rep. 2014;4:5054. doi: 10.1038/srep05054. [DOI] [PMC free article] [PubMed] [Google Scholar]
- 20.Yang C, et al. Arabidopsis MYB26/MALE STERILE35 regulates secondary thickening in the endothecium and is essential for anther dehiscence. Plant Cell. 2007;19(2):534–548. doi: 10.1105/tpc.106.046391. [DOI] [PMC free article] [PubMed] [Google Scholar]
- 21.Taylor-Teeples M, et al. An Arabidopsis gene regulatory network for secondary cell wall synthesis. Nature. 2015;517(7536):571–575. doi: 10.1038/nature14099. [DOI] [PMC free article] [PubMed] [Google Scholar]
- 22.Bonawitz ND, et al. Disruption of Mediator rescues the stunted growth of a lignin-deficient Arabidopsis mutant. Nature. 2014;509(7500):376–380. doi: 10.1038/nature13084. [DOI] [PubMed] [Google Scholar]
- 23.Kornberg RD. Mediator and the mechanism of transcriptional activation. Trends Biochem Sci. 2005;30(5):235–239. doi: 10.1016/j.tibs.2005.03.011. [DOI] [PubMed] [Google Scholar]
- 24.Björklund S, Gustafsson CM. The yeast Mediator complex and its regulation. Trends Biochem Sci. 2005;30(5):240–244. doi: 10.1016/j.tibs.2005.03.008. [DOI] [PubMed] [Google Scholar]
- 25.Bourbon HM. Comparative genomics supports a deep evolutionary origin for the large, four-module transcriptional Mediator complex. Nucleic Acids Res. 2008;36(12):3993–4008. doi: 10.1093/nar/gkn349. [DOI] [PMC free article] [PubMed] [Google Scholar]
- 26.Ansari SA, He Q, Morse RH. Mediator complex association with constitutively transcribed genes in yeast. Proc Natl Acad Sci USA. 2009;106(39):16734–16739. doi: 10.1073/pnas.0905103106. [DOI] [PMC free article] [PubMed] [Google Scholar]
- 27.Dotson MR, et al. Structural organization of yeast and mammalian Mediator complexes. Proc Natl Acad Sci USA. 2000;97(26):14307–14310. doi: 10.1073/pnas.260489497. [DOI] [PMC free article] [PubMed] [Google Scholar]
- 28.Bäckström S, Elfving N, Nilsson R, Wingsle G, Björklund S. Purification of a plant Mediator from Arabidopsis thaliana identifies PFT1 as the Med25 subunit. Mol Cell. 2007;26(5):717–729. doi: 10.1016/j.molcel.2007.05.007. [DOI] [PubMed] [Google Scholar]
- 29.Mathur S, Vyas S, Kapoor S, Tyagi AK. The Mediator complex in plants: Structure, phylogeny, and expression profiling of representative genes in a dicot (Arabidopsis) and a monocot (rice) during reproduction and abiotic stress. Plant Physiol. 2011;157(4):1609–1627. doi: 10.1104/pp.111.188300. [DOI] [PMC free article] [PubMed] [Google Scholar]
- 30.Kidd BN, et al. The Mediator complex subunit PFT1 is a key regulator of jasmonate-dependent defense in Arabidopsis. Plant Cell. 2009;21(8):2237–2252. doi: 10.1105/tpc.109.066910. [DOI] [PMC free article] [PubMed] [Google Scholar]
- 31.Wathugala DL, et al. The Mediator subunit SFR6/MED16 controls defence gene expression mediated by salicylic acid and jasmonate responsive pathways. New Phytol. 2012;195(1):217–230. doi: 10.1111/j.1469-8137.2012.04138.x. [DOI] [PubMed] [Google Scholar]
- 32.Zhang X, Wang C, Zhang Y, Sun Y, Mou Z. The Arabidopsis Mediator complex subunit16 positively regulates salicylate-mediated systemic acquired resistance and jasmonate/ethylene-induced defense pathways. Plant Cell. 2012;24(10):4294–4309. doi: 10.1105/tpc.112.103317. [DOI] [PMC free article] [PubMed] [Google Scholar]
- 33.Elfving N, et al. The Arabidopsis thaliana Med25 Mediator subunit integrates environmental cues to control plant development. Proc Natl Acad Sci USA. 2011;108(20):8245–8250. doi: 10.1073/pnas.1002981108. [DOI] [PMC free article] [PubMed] [Google Scholar]
- 34.Hemsley PA, et al. The Arabidopsis Mediator complex subunits MED16, MED14, and MED2 regulate Mediator and RNA polymerase II recruitment to CBF-responsive cold-regulated genes. Plant Cell. 2014;26(1):465–484. doi: 10.1105/tpc.113.117796. [DOI] [PMC free article] [PubMed] [Google Scholar]
- 35.Gillmor CS, et al. The MED12-MED13 module of Mediator regulates the timing of embryo patterning in Arabidopsis. Development. 2010;137(1):113–122. doi: 10.1242/dev.043174. [DOI] [PMC free article] [PubMed] [Google Scholar]
- 36.Zheng Z, Guan H, Leal F, Grey PH, Oppenheimer DG. Mediator subunit18 controls flowering time and floral organ identity in Arabidopsis. PLoS One. 2013;8(1):e53924. doi: 10.1371/journal.pone.0053924. [DOI] [PMC free article] [PubMed] [Google Scholar]
- 37.Roudier F, et al. COBRA, an Arabidopsis extracellular glycosyl-phosphatidyl inositol-anchored protein, specifically controls highly anisotropic expansion through its involvement in cellulose microfibril orientation. Plant Cell. 2005;17(6):1749–1763. doi: 10.1105/tpc.105.031732. [DOI] [PMC free article] [PubMed] [Google Scholar]
- 38.Ko JH, Kim JH, Jayanty SS, Howe GA, Han KH. Loss of function of COBRA, a determinant of oriented cell expansion, invokes cellular defence responses in Arabidopsis thaliana. J Exp Bot. 2006;57(12):2923–2936. doi: 10.1093/jxb/erl052. [DOI] [PubMed] [Google Scholar]
- 39.Xue W, et al. Paramutation-like interaction of T-DNA loci in Arabidopsis. PLoS One. 2012;7(12):e51651. doi: 10.1371/journal.pone.0051651. [DOI] [PMC free article] [PubMed] [Google Scholar]
- 40.Austin RS, et al. Next-generation mapping of Arabidopsis genes. Plant J. 2011;67(4):715–725. doi: 10.1111/j.1365-313X.2011.04619.x. [DOI] [PubMed] [Google Scholar]
- 41.McKown R, Kuroki G, Warren G. Cold responses of Arabidopsis mutants impaired in freezing tolerance. J Exp Bot. 1996;47(12):1919–1925. [Google Scholar]
- 42.Knight H, et al. Identification of SFR6, a key component in cold acclimation acting post-translationally on CBF function. Plant J. 2009;58(1):97–108. doi: 10.1111/j.1365-313X.2008.03763.x. [DOI] [PubMed] [Google Scholar]
- 43.Park S, et al. Regulation of the Arabidopsis CBF regulon by a complex low-temperature regulatory network. Plant J. 2015;82(2):193–207. doi: 10.1111/tpj.12796. [DOI] [PubMed] [Google Scholar]
- 44.Boyce JM, et al. The sfr6 mutant of Arabidopsis is defective in transcriptional activation via CBF/DREB1 and DREB2 and shows sensitivity to osmotic stress. Plant J. 2003;34(4):395–406. doi: 10.1046/j.1365-313x.2003.01734.x. [DOI] [PubMed] [Google Scholar]
- 45.Brabham C, et al. Indaziflam herbicidal action: A potent cellulose biosynthesis inhibitor. Plant Physiol. 2014;166(3):1177–1185. doi: 10.1104/pp.114.241950. [DOI] [PMC free article] [PubMed] [Google Scholar]
- 46.His I, Driouich A, Nicol F, Jauneau A, Höfte H. Altered pectin composition in primary cell walls of korrigan, a dwarf mutant of Arabidopsis deficient in a membrane-bound endo-1,4-beta-glucanase. Planta. 2001;212(3):348–358. doi: 10.1007/s004250000437. [DOI] [PubMed] [Google Scholar]
- 47.Harholt J, Suttangkakul A, Vibe Scheller H. Biosynthesis of pectin. Plant Physiol. 2010;153(2):384–395. doi: 10.1104/pp.110.156588. [DOI] [PMC free article] [PubMed] [Google Scholar]
- 48.Pelletier S, et al. A role for pectin de-methylesterification in a developmentally regulated growth acceleration in dark-grown Arabidopsis hypocotyls. New Phytol. 2010;188(3):726–739. doi: 10.1111/j.1469-8137.2010.03409.x. [DOI] [PubMed] [Google Scholar]
- 49.Hruz T, et al. Genevestigator v3: A reference expression database for the meta-analysis of transcriptomes. Adv Bioinformatics. 2008;2008:420747. doi: 10.1155/2008/420747. [DOI] [PMC free article] [PubMed] [Google Scholar]
- 50.Steinwand BJ, et al. Alterations in auxin homeostasis suppress defects in cell wall function. PLoS One. 2014;9(5):e98193. doi: 10.1371/journal.pone.0098193. [DOI] [PMC free article] [PubMed] [Google Scholar]
- 51.Hématy K, et al. A receptor-like kinase mediates the response of Arabidopsis cells to the inhibition of cellulose synthesis. Curr Biol. 2007;17(11):922–931. doi: 10.1016/j.cub.2007.05.018. [DOI] [PubMed] [Google Scholar]
- 52.Conaway RC, Conaway JW. Function and regulation of the Mediator complex. Curr Opin Genet Dev. 2011;21(2):225–230. doi: 10.1016/j.gde.2011.01.013. [DOI] [PMC free article] [PubMed] [Google Scholar]
- 53.Yang Y, et al. The Arabidopsis Mediator subunit MED16 regulates iron homeostasis by associating with EIN3/EIL1 through subunit MED25. Plant J. 2014;77(6):838–851. doi: 10.1111/tpj.12440. [DOI] [PubMed] [Google Scholar]
- 54.Kang JS, et al. The structural and functional organization of the yeast Mediator complex. J Biol Chem. 2001;276(45):42003–42010. doi: 10.1074/jbc.M105961200. [DOI] [PubMed] [Google Scholar]
- 55.Solecka D, Zebrowski J, Kacperska A. Are pectins involved in cold acclimation and de-acclimation of winter oil-seed rape plants? Ann Bot (Lond) 2008;101(4):521–530. doi: 10.1093/aob/mcm329. [DOI] [PMC free article] [PubMed] [Google Scholar]
- 56.Wolf S, et al. A receptor-like protein mediates the response to pectin modification by activating brassinosteroid signaling. Proc Natl Acad Sci USA. 2014;111(42):15261–15266. doi: 10.1073/pnas.1322979111. [DOI] [PMC free article] [PubMed] [Google Scholar]
- 57.Dick-Pérez M, et al. Structure and interactions of plant cell-wall polysaccharides by two- and three-dimensional magic-angle-spinning solid-state NMR. Biochemistry. 2011;50(6):989–1000. doi: 10.1021/bi101795q. [DOI] [PubMed] [Google Scholar]
- 58.Morcombe CR, Zilm KW. Chemical shift referencing in MAS solid state NMR. J Magn Reson. 2003;162(2):479–486. doi: 10.1016/s1090-7807(03)00082-x. [DOI] [PubMed] [Google Scholar]
- 59.Zhang Z, Khan NM, Nunez KM, Chess EK, Szabo CM. Complete monosaccharide analysis by high-performance anion-exchange chromatography with pulsed amperometric detection. Anal Chem. 2012;84(9):4104–4110. doi: 10.1021/ac300176z. [DOI] [PubMed] [Google Scholar]
- 60.Anthon GE, Barrett DM. Comparison of three colorimetric reagents in the determination of methanol with alcohol oxidase. Application to the assay of pectin methylesterase. J Agric Food Chem. 2004;52(12):3749–3753. doi: 10.1021/jf035284w. [DOI] [PubMed] [Google Scholar]
- 61.Hietala AM, Eikenes M, Kvaalen H, Solheim H, Fossdal CG. Multiplex real-time PCR for monitoring Heterobasidion annosum colonization in Norway spruce clones that differ in disease resistance. Appl Environ Microbiol. 2003;69(8):4413–4420. doi: 10.1128/AEM.69.8.4413-4420.2003. [DOI] [PMC free article] [PubMed] [Google Scholar]
- 62.Bauer S, Ibáñez AB. Rapid determination of cellulose. Biotechnol Bioeng. 2014;111(11):2355–2357. doi: 10.1002/bit.25276. [DOI] [PubMed] [Google Scholar]
- 63.Fung BM, Khitrin AK, Ermolaev K. An improved broadband decoupling sequence for liquid crystals and solids. J Magn Reson. 2000;142(1):97–101. doi: 10.1006/jmre.1999.1896. [DOI] [PubMed] [Google Scholar]


