

Significance
During meiosis, chromosomes exchange segments in a process of crossing-over. The crossover number is tightly regulated so that at least one crossover (but not many more) is formed per chromosome. The process of crossover homeostasis is thought to play a major role in this regulation by ensuring a stable crossover number even if the number of DNA breaks that initiate crossover formation varies. However, we found that, in maize, the crossover number changes with the number of DNA breaks, suggesting that different species exhibit different crossover control mechanisms. Plant breeders rely on recombination to create new combinations of alleles. Our data suggest that increasing recombination rates in plants may be accomplished by increasing the number of DNA breaks.
Keywords: meiosis, recombination, crossing-over, double-strand breaks, crossover homeostasis
Abstract
During meiotic recombination, double-strand breaks (DSBs) are formed in chromosomal DNA and then repaired as either crossovers (COs) or non–crossovers (NCOs). In most taxa, the number of DSBs vastly exceeds the number of COs. COs are required for generating genetic diversity in the progeny, as well as proper chromosome segregation. Their formation is tightly controlled so that there is at least one CO per pair of homologous chromosomes whereas the maximum number of COs per chromosome pair is fairly limited. One of the main mechanisms controlling the number of recombination events per meiosis is CO homeostasis, which maintains a stable CO number even when the DSB number is dramatically altered. The existence of CO homeostasis has been reported in several species, including mouse, yeast, and Caenorhabditis elegans. However, it is not known whether homeostasis exists in the same form in all species. In addition, the studies of homeostasis have been conducted using mutants and/or transgenic lines exhibiting fairly severe meiotic phenotypes, and it is unclear how important homeostasis is under normal physiological conditions. We found that, in maize, CO control is robust only to ensure one CO per chromosome pair. However, once this limit is reached, the CO number is linearly related to the DSB number. We propose that CO control is a multifaceted process whose different aspects have a varying degree of importance in different species.
Meiotic recombination creates genetic diversity by generating new allelic combinations in the progeny. In the first step of the recombination pathway, double-strand breaks (DSBs) are formed in chromosomal DNA by a topoisomerase-like protein, SPO11 (1). The DSBs are subsequently repaired in a process that involves several recombination proteins. First, the MRN complex, which includes MRE11, RAD50, and NBS1, resects the DSB ends, leading to formation of 3′ overhangs (2). The single-stranded DNAs created in this way are then coated by two recA-like proteins, RAD51 and DMC1. These proteins catalyze the invasion of homologous double-stranded DNA regions, resulting in single-end invasion (SEI) events (3). Eventually, DSBs are repaired as either crossovers (COs) or non–crossovers (NCOs). Besides generating genetic diversity, crossing-over creates physical connections between homologous chromosomes, which are essential for accurate segregation of the homologs during the first meiotic division. Defects in this process can lead to aneuploidy. Consequently, CO formation, including the number and distribution of COs, is under stringent control (4, 5).
To ensure proper segregation of chromosomes during anaphase I, at least one CO must be formed for each homolog pair (6). Failure to meet this requirement leads to chromosome missegregation. Consequently, nonexchange chromosomes are extremely rare in WT meiosis in most species, including maize (7). Even in Caenorhabditis elegans, which forms only one CO per bivalent, the rate of nonexchange chromosomes is less than 1% (8, 9). These observations led to the proposal of an obligate CO model, which posits that there must be a regulatory mechanism, called CO assurance, that ensures the formation of at least one obligate CO per bivalent (6).
In contrast to the lower limit, regulation of the upper limit of CO number per homolog pair is less understood. Both the number of COs and the spacing between them are affected by CO interference. Interference reduces the probability of two COs forming next to each other. Thus, it limits the number of COs and increases their spacing. The strength of interference diminishes with the distance along the chromosome. Not all COs are subject to interference, but data from numerous species, including budding yeast, mouse, and maize, show that only a small fraction of COs are independent of interference (10–13). In maize, ∼15% of COs belong to the noninterfering class (12).
Due to these constraints on CO number and placement, it is quite likely that the number of COs per bivalent is largely similar among eukaryotes although variation exists both between and within species (14–16). Major differences, however, have been observed among species with respect to the number of meiotic DSBs. In most cases, the number of DSBs far exceeds the number of COs (17, 18). For instance, in maize, nearly 500 DSBs lead to the formation of ∼20 COs (15, 19).
Mechanisms determining which DSBs result in COs or NCOs are poorly understood. CO rates are unlikely to be limited by the structural properties of chromosomes (20). Instead, they are controlled by an intricate regulatory mechanism influencing DSB fate. Mutating components of this mechanism can dramatically increase CO number (20, 21). In contrast, studies in budding yeast, C. elegans, and mouse have shown that CO numbers are not affected by DSB number, even if the variation in the number of DSBs is substantial (18, 22–24). This phenomenon is known as CO homeostasis (22). However, it is not known whether homeostasis operates in all species. In addition, the studies of homeostasis have been conducted using mutants and/or transgenic lines exhibiting fairly severe meiotic phenotypes, and it is unclear how important homeostasis is under normal physiological conditions.
To understand CO control, we examined the substantial intraspecies variation in CO and DSB numbers that exists in maize. Surprisingly, we found a strong correlation between the number of meiotic DSBs and the number of COs. Our data suggest that, whereas CO control in maize maintains CO assurance (i.e., ensures the presence of one obligate CO per bivalent), it does not operate beyond this limit. Instead, once the requirement for the obligate CO is met, the number of COs becomes proportional to the DSB number. We propose that the control of the CO number is a multifaceted process whose different aspects have a varying degree of importance in different species.
Results
Global CO Rate Varies Significantly Among Maize Inbreds.
To elucidate the mechanisms of CO control, we examined intraspecies variation in the number of COs in maize. Rather than use mutants that would push recombination to extreme levels, we decided to rely on natural genetic variation to remain within the physiological number of recombination events that can be tolerated by an organism over many generations. Maize exhibits high levels of intraspecies genome polymorphism, similar to the level of polymorphism between humans and chimpanzees (25). To capture this diversity, we used a set of 14 genetically diverse inbred lines. Twelve of the 14 lines belong to a group of maize inbreds that are parents of the nested association mapping (NAM) population (26) and are thought to represent over 85% of intraspecies allelic diversity in maize (27). In addition, we included the Mo17 inbred, a parent of the widely used B73 × Mo17 mapping population, and A344, an inbred used in many meiosis studies (19).
To survey CO numbers, we examined chiasmata, which are cytological manifestations of COs (28). Chiasmata were quantified at diakinesis because, at this stage, they are most conspicuous and easiest to count in maize. Bivalents have two distinct configurations at diakinesis: rod bivalents (Fig. S1A), which have a single chiasma, and ring bivalents, which have two chiasmata, one at each end (Fig. S1B).
Fig. S1.

Quantification of chiasmata in maize. Chiasmata were identified using a combination of chromosome spreading and 3D image reconstruction. (A) Typical morphology of a rod bivalent with a single chiasma at a chromosome end. (B) A ring bivalent with two chiasmata, one at each end. (C) A ring bivalent with three chiasmata, two terminal and one interstitial. (D) A bivalent with two terminal chiasmata and a chromosome twist. (E) A bivalent with two chiasmata located close to each other. (F) A bivalent with a poorly visible terminal chiasma that could make the bivalent be confused for two univalents. Chiasmata are indicated by green arrows. A chromosome twist is indicated by a purple arrow.
Unequivocal identification of chiasmata may occasionally be challenging because chromosome twists may be mistaken for chiasmata and nearby chiasmata may be difficult to distinguish from each other. To enhance the ability to correctly identify all COs, we devised an approach that combined 3D image reconstruction with chromosome spreading (Fig. S1). Three-dimensional image reconstruction allowed the differentiation between chromosome twists and bona fide chiasmata because homologous chromosome pairs could be clearly visualized at all different angles (Fig. S1D). To distinguish multiple chiasmata located very close together, we estimated the size of an individual chiasma (Fig. S1E). We found that, typically, they were about 1–2 μm in length, depending on the level of chromosome condensation (which was assessed by the total length of chromosomes in the cell). The chiasma length was consistent in any given cell, among cells at the same meiosis stage in any given inbred, and among inbreds. Consequently, we assumed that longer chiasma structures represented multiple chiasmata located next to each other. Blind tests were performed to validate the reliability and accuracy of this approach.
Our analysis revealed a substantial variation in chiasma numbers among the 14 maize inbreds (Fig. 1). The difference between the highest mean number of chiasmata per cell (19.4 in B97) and the lowest number (11.2 in CML228) was nearly 1.7-fold. The among-inbred differences were statistically significant (Table S1).
Fig. 1.

Variation in the mean number of chiasmata per cell in male meiocytes in a set of diverse maize inbreds. Each blue circle represents a chiasma count from a single meiocyte. Bars = ±SE. The coefficient of variation (C.V.) for chiasma data is indicated for each inbred line below the inbred name on the x axis.
Table S1.
Analysis of variance of the number of chiasmata per meiocyte among maize inbreds shown in Fig. 1
| Source of variation | Sum of squares | df | Mean sum of squares | F value |
| Between inbreds | 2,633 | 13 | 202.5 | 139.9* (P = 0.0001) |
| Error | 832.5 | 575 | 1.448 | |
| Total | 3,465 |
In addition to the mean chiasma number, there were also significant differences among the inbreds in the percentage of bivalents carrying one, two, or three chiasmata (Tables S2 and S3). In most inbreds, 10–20% of bivalents had single chiasma and between 80–88% of bivalents formed two chiasmata. On the extreme sides of the spectrum, in the B97 inbred, only ∼9% of bivalents formed a single chiasma (n = 630) whereas, in CML228, ∼87% of bivalents formed a single chiasma (n = 510). We never observed nonexchange chromosomes, even in CML228, indicating that CO assurance in maize operates with high efficiency. Interestingly, we found no obvious relationship between the mean number of chiasmata and the fraction of bivalents with specific chiasma numbers (Fig. 1 and Table S2). For example, Hp301 had the mean chiasma number lower than B97 (Fig. 1) but nearly threefold more bivalents with three chiasmata (Table S2). These data suggest that the distribution of COs among chromosomes varied independently of the overall CO number.
Table S2.
Percent of bivalents harboring one, two, and three chiasmata in male meiocytes at diakinesis
| Inbred | Total bivalents analyzed | % bivalents with one chiasma | % bivalents with two chiasmata | % bivalents with three chiasmata |
| A344 | 410 | 27.0 | 73.0 | 0.0 |
| B73 | 460 | 20.3 | 79.0 | 0.7 |
| B97 | 630 | 9.0 | 87.5 | 3.5 |
| CML69 | 440 | 17.5 | 82.5 | 0.0 |
| CML103 | 480 | 20.5 | 72.0 | 7.5 |
| CML228 | 510 | 87.0 | 13.0 | 0.0 |
| CML277 | 300 | 15.0 | 85.0 | 0.0 |
| CML322 | 240 | 21.0 | 79.0 | 0.0 |
| Hp301 | 340 | 26.0 | 63.6 | 10.4 |
| Ki11 | 480 | 16.0 | 84.0 | 0.0 |
| M162w | 220 | 31.0 | 69.0 | 0.0 |
| Mo17 | 460 | 14.0 | 86.0 | 0.0 |
| Mo18w | 580 | 40.8 | 57.6 | 1.6 |
| Oh43 | 340 | 15.5 | 84.5 | 0.0 |
| Mean | 25.8 | 72.6 | 1.7 |
Table S3.
Analyses of variance of the percentage of bivalents with one, two, and three chiasmata among maize inbreds shown in Table S2
| Sources of variation | Sum of squares | df | Mean sum of squares | F value |
| Bivalents with one chiasma | ||||
| Between inbreds | 2.4977E+05 | 13 | 1.9213+05 | 152.7* (P = 0.0001) |
| Error | 7.2364E+04 | 575 | 125.8 | |
| Total | 3.2213E+05 | |||
| Bivalents with two chiasmata | ||||
| Between inbreds | 2.4502E+05 | 13 | 1.8848E+04 | 131.7* (P = 0.0001) |
| Error | 8.2282E+04 | 575 | 143.1 | |
| Total | 3.2730E+05 | |||
| Bivalents with three chiasmata | ||||
| Between inbreds | 5,359 | 13 | 412.2 | 19.32* (P = 0.0001) |
| Error | 1.227E+04 | 575 | 21.34 | |
| Total | 1.7628E+04 |
The CO Rate Is Not Related to Synaptonemal Complex Length in Maize Inbreds.
In yeast and mouse, CO formation is strongly linked to progression of chromosome synapsis. Consequently, it has been suggested that the CO rate is closely related to the length of the synaptonemal complex (SC) (29–31). To examine weather this relationship also exists in maize, we measured the SC length in two inbreds, A344 and CML228, that substantially differ in their mean CO numbers (Fig. 1). To compare the SC lengths, we immunolocalized ZYP1, the central element of the SC. The measurements were conducted at pachytene (Fig. 2 A–C), when chromosomes are fully paired and synapsed. We found that, despite the large difference in CO numbers, the total SC length was not statistically different between the two inbreds (Fig. 2D).
Fig. 2.

Maize inbreds exhibiting substantial differences in chiasma number have similar synaptonemal complex (SC) length. (A–C) Immunolocalization of the ZYP1 protein to measure the SC length in maize. (A) Green, ZYP1 immunolocalization; red, DAPI-stained chromatin. (B) Green, ZYP1 immunolocalization. (C) Measurement of the SC length. The total length of synaptonemal complex in the nucleus was determined by tracing the extent of the ZYP1 protein (white) using the Distance Measurement tool in the softWoRx software. (Scale bar, 5 μm.) (D) Comparison of the SC length and chiasma number in the A344 and CML228 inbreds. Bars = ±SD.
CO Number in Maize Is Strongly Correlated with DSB Number.
To search for a source of the CO variation, we examined variation in DSB numbers. To do this analysis, we quantified foci formed on chromosomes by the RAD51 protein at midzygotene. The number of RAD51 foci in maize exhibits its peak at that when it is thought to represent the number of meiotic DSBs (19). RAD51 marks DNA breaks that are directed toward the homologous recombination type repair but not breaks repaired by nonhomologous end joining, if any exist during meiosis (3). However, the RAD51-marked DSBs are the only DNA breaks participating in the meiotic recombination pathway.
We focused the RAD51 analysis on six inbreds, A344, B73, B97, CML228, Mo17, and Mo18w, because they covered the entire spectrum of chiasma numbers found in our study.
Interestingly, we found substantial variation in RAD51 focus numbers among the six inbreds, ranging from 218 to 608 per meiocyte (Fig. 3 A–C and Table S4). Within inbreds, the variation in the number of RAD51 foci was higher than the variation in CO numbers (Figs. 1 and 3C), which is similar to the observations made in mouse and yeast (18, 22). We then used regression analysis to examine the relationship between the numbers of midzygotene RAD51 foci and the numbers of chiasmata. Surprisingly, we found that the correlation between these two variables was very strong (R2 = 0.96) (Fig. 3D), suggesting that the number of DSBs directly impacts the number of COs in maize.
Fig. 3.
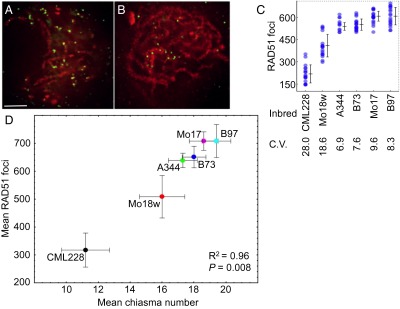
CO numbers vary coordinately with DSB number in maize. (A and B) Immunolocalization of RAD51 in zygotene meiocytes in B73 (A) and CML228 (B). Green, RAD51 immunolocalization; red, DAPI-stained chromatin. Images are flat projections of three consecutive Z sections out of a total of 80–90 Z sections through the entire nucleus. (Scale bar: 5 μm.) (C) Variation in the mean number of RAD51 foci per cell in male meiocytes at midzygotene. Each blue circle represents a RAD51 focus count from a single meiocyte. Darker color represents multiple cells that have similar RAD51 foci numbers. Bars = ±SE. C.V., coefficient of variation. (D) Comparison of chiasma numbers and the numbers of RAD51 foci in six maize inbred lines. Bars = ±SD.
Table S4.
Analysis of variance of DSB numbers among maize inbreds shown in Fig. 3C
| Sources of variation | Sum of squares | df | Mean sum of squares | F value |
| Between inbreds | 2.062E+06 | 5 | 412.8E+05 | 147.9* (P = 0.0001) |
| Error | 2.733E+05 | 98 | 2789 | |
| Total | 2.353E+06 |
Hybridization Affects CO Number Coordinately with DSB Number.
In addition to inbreds, we examined recombination rates in hybrids. It has been reported that, in maize, sequence heterogeneity between parental chromosomes shifts the CO/NCO balance toward COs (32). On the other hand, extreme sequence polymorphism, such as presence–absence variation (PAV), reduces recombination rates (33).
To examine whether interparental sequence polymorphism affects global CO numbers, we examined hybrids generated by crossing B73 to three inbreds: CML228, Mo17, and Mo18w. The three inbreds were selected to cover the whole spectrum of genetic distances between B73 and the other inbred lines used.
Contrary to expectations, we found no trend toward higher or lower CO rates in the hybrids relative to inbreds. B73 × CML228 exhibited 19.3 ± 0.18 (mean ± SE) chiasmata per meiocyte. B73 × Mo17 had 19.1 ± 0.2 whereas B73 × Mo18w had 16.2 ± 0.10. The chiasma numbers in B73 × CML228 and B73 × Mo17 were higher than the midparent whereas, in B73 × Mo18w, they were lower than the midparent. There was also no obvious relationship between the genetic distance between the parents (34) and the chiasma number in the hybrid.
To investigate whether interparental polymorphism affects the relationship between CO and DSB numbers, we examined midzygotene RAD51 foci in the B73 × CML228 hybrid. We found that they were in sync with the high number of COs in this hybrid (Fig. S2). Thus, the factor(s) responsible for the increase in recombination rates in B73 × CML228, compared with its parents, affect both DSBs and COs. Furthermore, this observation further supports the conclusion that CO numbers in maize are directly influenced by DSB numbers.
Fig. S2.

Distribution of RAD51 focus numbers per meiocyte in B73, CML228, and the B73 × CML228 hybrid at midzygotene. Each circle represents a single nucleus. The color gradation from lighter to darker represents a higher number of cells with the same focus number. Bars = ±SD.
H3K4me3 Patterns Do Not Show Strong Association with DSB Number in Maize.
Trimethylation of lysine 4 in the H3 histone (H3K4me3) is very strongly associated with the sites of meiotic recombination in mouse (35). In budding yeast, H3K4me3 has also been found near sites of recombination (36) although this colocalization may be coincidental, because both sites are usually present in promoters of genes (37). Consequently, we examined whether, in maize, the differences in DSB numbers are associated with differences in H3K4me3 patterns. We found that H3K4me3 staining was first visible at leptotene. The foci persisted, albeit at reduced numbers, throughout the end of prophase I (Fig. S3A). We analyzed H3K4me3 localization in detail in four inbreds (B73, B97, CML228, and Mo17) at the zygotene and pachytene stages. Although there were differences in the numbers of H3K4me3 focus numbers among inbreds (Table S5), this variation was not correlated with the mean DSB or chiasma numbers. Furthermore, colocalization of H3K4me3 and RAD51 in B73 showed that only about 15% of DSBs were associated with H3K4me3 sites (Fig. S3B). These data suggest that H3K4me3 is not a major predictor of the number of DSBs in maize. However, because only a small percentage of DSBs are repaired into COs, it is possible that the H3K4me3-marked DSB sites are more likely to become COs.
Fig. S3.

H3K4me3 localization is not a good predictor of meiotic recombination sites in maize. (A) Dynamics of H3K4me3 during meiosis in maize. H3K4me3 foci first appear during leptotene and persist throughout meiosis I. Green, H3K4me3 immunolocalization; red, DAPI-stained chromatin. (Scale bar: 5 μm.) (B) Colocalization of H3K4me3 and RAD51 at zygotene in the B73 inbred. Green, RAD51 immunolocalization; red, H3K4me3 immunolocalization; blue, DAPI-stained chromatin. (Scale bar: 5 μm.)
Table S5.
Mean numbers of H3K4me3 foci in male meiocytes in midzygotene
| Inbreds | No. of cells | Mean no. of H3K4me3 foci | SE |
| B73 | 10 | 1,486 | 135.7 |
| B97 | 10 | 1,893 | 126.8 |
| CML228 | 5 | 3,854 | 662.8 |
| Mo17 | 22 | 3,699 | 185.3 |
| Mean | 2,733 |
CO Distribution Along Chromosomes Is Mainly Related to CO Number per Bivalent.
We noticed that inbreds with different mean chiasma numbers also differed in chiasma distribution along chromosomes. For example, in B97, which has the highest mean CO number, most chiasmata were terminal whereas, in CML228, chiasmata were often proximal (Fig. 4A). Because previous studies indicated that the vast majority of COs in maize are subtelomeric (15), these observations prompted us to investigate the variation in chiasma position in more detail. To do this analysis, we measured the distance from the chromosome end to the nearest chiasma in six inbreds: A344, B73, B97, CML228, Mo17, and Mo18w. These inbreds covered the whole spectrum of the observed CO number variation. The mean distance varied substantially among the inbreds (Table 1). However, most of this variation could be attributed to the variation in the proportion of bivalents carrying single and multiple chiasmata. When only bivalents with the same chiasma numbers were considered, the mean distance from telomere to the nearest chiasma was similar in all inbreds (Table 1). Furthermore, there was no correlation between the mean CO number in an inbred and the mean telomere-to-nearest-chiasma distance when bivalents with the same chiasma numbers were considered (R2 = 0.06 for bivalents with single chiasmata and R2 = 0.09 for bivalents with two chiasmata). We also measured distances between adjacent chiasmata and found a similar pattern. Overall, these data show that bivalents with the same chiasma number exhibit similar chiasma distribution in all inbreds. Consequently, distribution of recombination patterns is likely governed by the same principle(s) in all inbreds. Furthermore, the fact that chiasmata in all six inbreds showed similar spatial distribution patterns relative to the telomere suggests that the inbreds did not exhibit major differences in chromosome condensation patterns or other structure-related properties that affect CO distribution (31, 38).
Fig. 4.

Maize inbreds exhibiting significant differences in CO number also differ in the strength of CO interference. (A) Bivalents in B97, Mo18w, and CML228 exhibiting differences in chiasma locations. (Scale bar: 5 μm.) (B) Correlation between the strength of CO interference and the mean chiasma number in maize inbreds. Bars = ±SD.
Table 1.
Chiasma distribution at diakinesis
| Inbred | Distance from telomere to nearest chiasma, μm | Distance between adjacent chiasmata, μm* | ||
| Mean | Bivalents with one chiasma | Bivalents with two chiasmata | ||
| A344 | 1.41 | 2.33 | 1.04 | 4.27 |
| B73 | 1.44 | 2.30 | 1.14 | 4.26 |
| B97 | 0.70 | 2.65 | 0.65 | 5.96 |
| CML228 | 1.82 | 2.48 | 1.01 | 4.64 |
| Mo17 | 1.32 | 2.98 | 1.02 | 5.30 |
| Mo18w | 1.71 | 2.62 | 1.23 | 4.66 |
| Mean | 1.40 | 2.56 | 1.01 | 4.84 |
In bivalents with two chiasmata.
We then explored CO interference as a potential mechanism controlling CO number. To do this analysis, we used the single-pathway gamma model to calculate the value of ν (nu), which is a measure of interference strength. Values of ν close to 1 indicate little or no interference whereas values of 10 and above indicate very strong interference. Our analysis did not try to differentiate between class I (interfering) and class II (noninterfering) COs. However, because the fraction of noninterfering COs is relatively small, this simplification is expected to result in a relatively small error. The interference analysis revealed large differences in CO interference strength among the six inbred lines (Fig. 4B). We found that ν decreased with the increase of the CO numbers and that the correlation between these two variables was strong (R2 = 0.84). This observation suggests that interference strength has a substantial influence on the number of COs in maize.
Discussion
CO control is thought to be achieved by the working of three mechanisms: CO homeostasis, interference, and assurance (6, 22). Together, these mechanisms result in the formation of at least one CO per homologous chromosome pair, while at the same time limiting the formation of multiple COs. This multilayered control likely acts to strike a balance between the maintenance of genome stability and ensuring proper segregation of chromosomes on the one hand and generation of genetic variability on the other hand.
The existence of CO homeostasis has been shown in mouse, C. elegans, and yeast. In mouse, CO numbers remained the same, with a 30% reduction or a 25% increase in the DSB number (18). In yeast, CO frequency changed relatively little even after lowering the DSB number by 80% (22). In C. elegans, it was found that a single DSB per chromosome was sufficient to generate the obligate CO (23, 24). Our data show that, in maize, CO control is robust only to maintain CO assurance. This conclusion is based on the fact that we did not observe chromosomes lacking chiasmata even in the CML228 inbred, which showed an overall CO number very close to the absolute minimum of 10. On the other hand, in inbreds with higher DSB numbers, we found a strong correlation between the DSB and CO numbers, suggesting lack of homeostatic control.
Another aspect of homeostasis is the increase of its strength, manifested by a decrease of the relative variability of the number of recombination marks, as the recombination pathway progresses. In mouse spermatocytes, the cell-to-cell variability decreases gradually from early (Rad51 and Dmc1 foci) to late (Mlh1 foci) recombination marks (18). Mlh1 foci in mouse oocytes and human spermatocytes also exhibit little variation in their numbers, indicating a progressive homeostatic control (39, 40). We observed a similar trend of less variability in the CO number than in the DSB number (Figs. 1 and 3C), suggesting that homeostasis in maize is not completely abolished. Interestingly, we also found that the cell-to-cell variability in the DSB numbers was proportionally larger in inbreds with fewer DSBs (coefficient of variation = 18% and 28% for Mo18w and CML228, respectively) than in inbreds with more DSBs (coefficient of variation of <10%) (Fig. 3C). We did not observe this trend in the case of COs (Fig. 1). These data suggest that only DSB number regulation, rather than regulation of the entire recombination pathway, is different between inbreds with high and low DSB numbers. They also indicate that, in inbreds with high DSB numbers, the progressive aspect of the homeostatic control may be weaker than in inbreds with fewer DSBs.
Recent data from yeast and C. elegans suggest existence of a negative feedback loop that allows formation of additional DSBs until the number of DSBs already formed is sufficient to ensure proper recombination and chromosome paring (41–43). Such a feedback loop may also operate in maize. We hypothesize that stronger homeostasis in inbreds with fewer DSBs may be caused by the low number of DSBs being insufficient in some cells to ensure proper chromosome pairing and synapsis (Fig. 5). In those cells, more DSBs may need to be generated by the feedback loop mechanism (41–43), which results in high cell-to-cell DSB number variability (see coefficient of variation in Fig. 3C) and triggers a stronger homeostatic response. The exact mechanistic underpinnings of the differences in DSB numbers among maize inbreds are not clear. These differences could be the result of varying SPO11 activity or perhaps activity of any accessory proteins that form the SPO11 complex or interact with it.
Fig. 5.

Model explaining how CO homeostasis functions in lines with low and high DSB number. In inbreds with low DSB numbers (Left), DSB distribution in some cells may not be sufficient to ensure proper chromosome pairing, which, in maize, is tightly linked to recombination (19). In these meiocytes, more DSBs are then generated until complete pairing is achieved, resulting in high cell-to-cell variability. In inbreds with high DSB numbers (Right), the distribution of the initially formed DSBs is already sufficient for proper pairing.
The strong correlation between the mean DSB and CO numbers in maize inbreds (R2 = 0.96) indicates that nearly all variation in CO numbers in maize can be explained by the variation in the DSB numbers. Nevertheless, the CO number is also affected by the strength of CO interference (R2 = 0.84) (Fig. 4C). However, if variation in the interference strength were solely responsible for the variation in CO numbers, one would not expect to observe a corresponding variation in DSB numbers among inbreds, unless DSBs were also subject to interference, which seems unlikely. There is evidence for existence of DSB interference, but its strength seems to be limited and effective over relatively short distances (44–46).
In C. elegans, establishment of higher order chromosome structure through activity of the condensin complex was shown to regulate the number and distribution of DSBs, which directly influences the CO number and distribution (38). A similar conclusion was reached in a recent study in mouse (47). In contrast, we did not find evidence for the CO numbers to be influenced by the establishment of the chromosome axis or affected by any obvious differences in the chromosome structure. Because our observations were made in a set of genetically diverse inbred lines, we believe that they represent a general phenomenon in maize.
Our data indicate that the extent of homeostasis in maize is different from that of yeast or mouse. A compelling explanation for our data would be that, even though all CO control mechanisms may be present in different species, each mechanism may exhibit a varying degree of importance in each species. In maize, homeostasis seems to be less important than in yeast or mouse, and also of a different nature. It is tempting to speculate why this phenomenon could be the case. Differences in CO control may reflect differences in how meiotic mechanisms operate in diverse taxa. They may also represent diversity in genome size, composition, or organization. It is also possible that reproductive biology differences could make some of the mechanisms involved in CO control more important and stringent in some species than others. For example, a higher CO number is beneficial for generating genetic variation, but it has been speculated that high recombination rates could lead to genome instability (48). Homeostasis could be a mechanism that stabilizes CO rates at a level that is low but just sufficient for error-free chromosome segregation in anaphase I. Fitness consequences of meiotic errors in maize could be smaller than in yeast or mouse, and the benefits of more COs could be greater, making efficient homeostasis less important. Future elucidation of the mechanistic basis of these differences will provide interesting insights into how they evolved.
Materials and Methods
Plant Material.
A set of 14 maize inbreds was used in this study. Twelve of them (B73, B97, CML69, CML103, CML228, CML277, CML322, Hp301, Ki11, Mo18w, M162w, and Oh43) belong to a group of diverse inbreds that are parents of the maize nested association mapping (NAM) population (26). This set was supplemented with two other inbred lines (Mo17 and A344) and three F1 hybrids (B73 × CML228, B73 × Mo17, and B73 × Mo18w). Plants were grown in a 1:1 Promix:calcined clay soil mix in a growth chamber, at a 31 °C day temperature and 22 °C night temperature and 12 h of light. The light intensity was maintained at 800 μmol/m2s.
Flower Fixation.
For chiasma analysis, entire tassels were fixed in Carnoy’s solution containing 3:1 ethanol:glacial acetic acid for 24 h. For immunofluorescence analyses, individual anthers were staged and fixed in paraformaldehyde as described previously (19).
Crossover Analysis.
To determine the CO number, we counted chiasmata in male meiocytes at the diakinesis stage of meiotic prophase I. For this experiment, we used a method that combines classical chromosome spreading with 3D image reconstruction. Meiocytes fixed in Carnoy’s solution were washed in citric acid buffer for 10 min and incubated in an enzyme mixture consisting of 2% (wt/vol)Onazuka R-10 cellulase, 1% mecerozyme, 1% cytohelicase, 4 mM citric acid, and 6 mM sodium citrate, pH 4.8, at room temperature for 60 min. Enzyme-digested anthers were transferred to a slide and macerated with a needle in a small drop of 95:5 (vol/vol) acetic acid:methanol solution. The solution containing meiocytes was dropped from a height of about 30 cm onto a glass slide for effective spreading. After subsequent air drying, chromosomes were cross-linked to the glass slides using UV light (1,200 J). Finally, the slides were stained with 500 μL of a 4,6-diamidino-2-phenylindole (DAPI) solution (1 μg⋅mL−1) and washed with 1× PBS for 10 min, three times. The slides were mounted in DABCO and sealed using nail polish.
A DeltaVision imaging workstation (Applied Precision) was used to generate three-dimensional stacks of Z sections that were taken every 0.15 µm across whole nuclei. The 3D image stacks were deconvolved and analyzed using softWoRx software (Applied Precision). Three-dimensional projections of image stacks were generated using the Volume Viewer tool to help visualize bivalents that were oriented along the z–y plane and to distinguish bona fide chiasmata from chromosome twists (Fig. 1). Chiasma numbers were counted manually by carefully analyzing each bivalent. Blind tests were performed to validate the results. ANOVA analyses were performed using StatPlus (AnalystSoft Inc.).
Immunofluorescence Microscopy.
Immunolocalization experiments were performed as previously described (19) using the following antibodies: rabbit anti-HsRAD51 (49) diluted 1:500, rabbit anti-HsH3K4me3 (ab8580; Abcam) diluted 1:500, and guinea pig anti-ZmZYP1 (50) diluted 1:50.
For quantification of RAD51 and H3K4me3 foci, softWoRx software (Applied Precision) was used. The fluorescence intensity threshold was set based on the background signal intensity. Foci were counted automatically. To discard false positives, foci were then counted manually through all Z sections of each cell. The SC length was measured using the Distance Measurement tool of softWoRx. Two independent measurements were taken for each cell.
CO Interference Strength Analysis.
To examine interference, we used the gamma model (51). In this model, the genetic distance x separating adjacent COs is drawn from the gamma distribution of density: ρ(x) = (2ν)ν xν-1 exp(−2νx)/Γ(v), where Γ(v) is the gamma function, x is the rate parameter, and ν is the shape parameter. To model their distribution, COs are placed starting at one end of the chromosome, but in such a way that the first CO is positioned randomly. The rate parameter was set to such a value that the mean density of COs was 2 per morgan. The shape parameter was fitted to the experimental data using the maximum likelihood framework. To do this analysis, we first constructed a list of all CO positions after normalizing to the total length of bivalents. This list was used to infer genetic distances. Then, the likelihood of each bivalent was calculated, taking into account the positions of the COs. Finally, we searched for the value of ν for which the likelihood of the whole dataset (equal to the product of the likelihoods of each bivalent) was maximized. The search was performed using hill climbing (52). Confidence intervals were obtained through resimulation. Specifically, the gamma model was used to simulate 1,000 independent datasets with the inferred best value of ν. Then, each dataset was fitted using the maximum likelihood approach, leading to as many values of ν as there were datasets. Finally, the values delimiting the lowest and highest 2.5% of the distribution were used to establish confidence intervals.
Acknowledgments
We thank Samantha Mainiero for helpful comments on the manuscript. This project was supported by National Science Foundation Grants DBI-0702454 and IOS-1025881 (to W.P.P.).
Footnotes
The authors declare no conflict of interest.
This article is a PNAS Direct Submission.
This article contains supporting information online at www.pnas.org/lookup/suppl/doi:10.1073/pnas.1514265112/-/DCSupplemental.
References
- 1.Keeney S, Giroux CN, Kleckner N. Meiosis-specific DNA double-strand breaks are catalyzed by Spo11, a member of a widely conserved protein family. Cell. 1997;88(3):375–384. doi: 10.1016/s0092-8674(00)81876-0. [DOI] [PubMed] [Google Scholar]
- 2.Borde V. The multiple roles of the Mre11 complex for meiotic recombination. Chromosome Res. 2007;15(5):551–563. doi: 10.1007/s10577-007-1147-9. [DOI] [PubMed] [Google Scholar]
- 3.Hunter N, Kleckner N. The single-end invasion: An asymmetric intermediate at the double-strand break to double-holliday junction transition of meiotic recombination. Cell. 2001;106(1):59–70. doi: 10.1016/s0092-8674(01)00430-5. [DOI] [PubMed] [Google Scholar]
- 4.Bishop DK, Zickler D. Early decision: Meiotic crossover interference prior to stable strand exchange and synapsis. Cell. 2004;117(1):9–15. doi: 10.1016/s0092-8674(04)00297-1. [DOI] [PubMed] [Google Scholar]
- 5.Börner GV, Kleckner N, Hunter N. Crossover/noncrossover differentiation, synaptonemal complex formation, and regulatory surveillance at the leptotene/zygotene transition of meiosis. Cell. 2004;117(1):29–45. doi: 10.1016/s0092-8674(04)00292-2. [DOI] [PubMed] [Google Scholar]
- 6.Jones GH, Franklin FC. Meiotic crossing-over: Obligation and interference. Cell. 2006;126(2):246–248. doi: 10.1016/j.cell.2006.07.010. [DOI] [PubMed] [Google Scholar]
- 7.Golubovskaya IN, Wang CJ, Timofejeva L, Cande WZ. Maize meiotic mutants with improper or non-homologous synapsis due to problems in pairing or synaptonemal complex formation. J Exp Bot. 2011;62(5):1533–1544. doi: 10.1093/jxb/erq292. [DOI] [PMC free article] [PubMed] [Google Scholar]
- 8.Dernburg AF, et al. Meiotic recombination in C. elegans initiates by a conserved mechanism and is dispensable for homologous chromosome synapsis. Cell. 1998;94(3):387–398. doi: 10.1016/s0092-8674(00)81481-6. [DOI] [PubMed] [Google Scholar]
- 9.Hillers KJ, Villeneuve AM. Chromosome-wide control of meiotic crossing over in C. elegans. Curr Biol. 2003;13(18):1641–1647. doi: 10.1016/j.cub.2003.08.026. [DOI] [PubMed] [Google Scholar]
- 10.Hollingsworth NM, Brill SJ. The Mus81 solution to resolution: Generating meiotic crossovers without Holliday junctions. Genes Dev. 2004;18(2):117–125. doi: 10.1101/gad.1165904. [DOI] [PMC free article] [PubMed] [Google Scholar]
- 11.Guillon H, Baudat F, Grey C, Liskay RM, de Massy B. Crossover and noncrossover pathways in mouse meiosis. Mol Cell. 2005;20(4):563–573. doi: 10.1016/j.molcel.2005.09.021. [DOI] [PubMed] [Google Scholar]
- 12.Falque M, Anderson LK, Stack SM, Gauthier F, Martin OC. Two types of meiotic crossovers coexist in maize. Plant Cell. 2009;21(12):3915–3925. doi: 10.1105/tpc.109.071514. [DOI] [PMC free article] [PubMed] [Google Scholar]
- 13.Higgins JD, Armstrong SJ, Franklin FC, Jones GH. The Arabidopsis MutS homolog AtMSH4 functions at an early step in recombination: Evidence for two classes of recombination in Arabidopsis. Genes Dev. 2004;18(20):2557–2570. doi: 10.1101/gad.317504. [DOI] [PMC free article] [PubMed] [Google Scholar]
- 14.Sanchez-Moran E, Armstrong SJ, Santos JL, Franklin FC, Jones GH. Variation in chiasma frequency among eight accessions of Arabidopsis thaliana. Genetics. 2002;162(3):1415–1422. doi: 10.1093/genetics/162.3.1415. [DOI] [PMC free article] [PubMed] [Google Scholar]
- 15.Anderson LK, et al. High-resolution crossover maps for each bivalent of Zea mays using recombination nodules. Genetics. 2003;165(2):849–865. doi: 10.1093/genetics/165.2.849. [DOI] [PMC free article] [PubMed] [Google Scholar]
- 16.Koehler KE, Cherry JP, Lynn A, Hunt PA, Hassold TJ. Genetic control of mammalian meiotic recombination. I. Variation in exchange frequencies among males from inbred mouse strains. Genetics. 2002;162(1):297–306. doi: 10.1093/genetics/162.1.297. [DOI] [PMC free article] [PubMed] [Google Scholar]
- 17.Baudat F, de Massy B. Regulating double-stranded DNA break repair towards crossover or non-crossover during mammalian meiosis. Chromosome Res. 2007;15(5):565–577. doi: 10.1007/s10577-007-1140-3. [DOI] [PubMed] [Google Scholar]
- 18.Cole F, et al. Homeostatic control of recombination is implemented progressively in mouse meiosis. Nat Cell Biol. 2012;14(4):424–430. doi: 10.1038/ncb2451. [DOI] [PMC free article] [PubMed] [Google Scholar]
- 19.Pawlowski WP, Golubovskaya IN, Cande WZ. Altered nuclear distribution of recombination protein RAD51 in maize mutants suggests the involvement of RAD51 in meiotic homology recognition. Plant Cell. 2003;15(8):1807–1816. doi: 10.1105/tpc.012898. [DOI] [PMC free article] [PubMed] [Google Scholar]
- 20.Crismani W, et al. FANCM limits meiotic crossovers. Science. 2012;336(6088):1588–1590. doi: 10.1126/science.1220381. [DOI] [PubMed] [Google Scholar]
- 21.Youds JL, Boulton SJ. The choice in meiosis: Defining the factors that influence crossover or non-crossover formation. J Cell Sci. 2011;124(Pt 4):501–513. doi: 10.1242/jcs.074427. [DOI] [PubMed] [Google Scholar]
- 22.Martini E, Diaz RL, Hunter N, Keeney S. Crossover homeostasis in yeast meiosis. Cell. 2006;126(2):285–295. doi: 10.1016/j.cell.2006.05.044. [DOI] [PMC free article] [PubMed] [Google Scholar]
- 23.Rosu S, Libuda DE, Villeneuve AM. Robust crossover assurance and regulated interhomolog access maintain meiotic crossover number. Science. 2011;334(6060):1286–1289. doi: 10.1126/science.1212424. [DOI] [PMC free article] [PubMed] [Google Scholar]
- 24.Yokoo R, et al. COSA-1 reveals robust homeostasis and separable licensing and reinforcement steps governing meiotic crossovers. Cell. 2012;149(1):75–87. doi: 10.1016/j.cell.2012.01.052. [DOI] [PMC free article] [PubMed] [Google Scholar]
- 25.Buckler ES, et al. The genetic architecture of maize flowering time. Science. 2009;325(5941):714–718. doi: 10.1126/science.1174276. [DOI] [PubMed] [Google Scholar]
- 26.McMullen MD, et al. Genetic properties of the maize nested association mapping population. Science. 2009;325(5941):737–740. doi: 10.1126/science.1174320. [DOI] [PubMed] [Google Scholar]
- 27.Liu K, et al. Genetic structure and diversity among maize inbred lines as inferred from DNA microsatellites. Genetics. 2003;165(4):2117–2128. doi: 10.1093/genetics/165.4.2117. [DOI] [PMC free article] [PubMed] [Google Scholar]
- 28.Creighton HB, McClintock B. A correlation of cytological and genetical crossing-over in Zea mays. Proc Natl Acad Sci USA. 1931;17(8):492–497. doi: 10.1073/pnas.17.8.492. [DOI] [PMC free article] [PubMed] [Google Scholar]
- 29.Froenicke L, Anderson LK, Wienberg J, Ashley T. Male mouse recombination maps for each autosome identified by chromosome painting. Am J Hum Genet. 2002;71(6):1353–1368. doi: 10.1086/344714. [DOI] [PMC free article] [PubMed] [Google Scholar]
- 30.Kleckner N, Storlazzi A, Zickler D. Coordinate variation in meiotic pachytene SC length and total crossover/chiasma frequency under conditions of constant DNA length. Trends Genet. 2003;19(11):623–628. doi: 10.1016/j.tig.2003.09.004. [DOI] [PubMed] [Google Scholar]
- 31.Giraut L, et al. Genome-wide crossover distribution in Arabidopsis thaliana meiosis reveals sex-specific patterns along chromosomes. PLoS Genet. 2011;7(11):e1002354. doi: 10.1371/journal.pgen.1002354. [DOI] [PMC free article] [PubMed] [Google Scholar]
- 32.Dooner HK. Extensive interallelic polymorphisms drive meiotic recombination into a crossover pathway. Plant Cell. 2002;14(5):1173–1183. doi: 10.1105/tpc.001271. [DOI] [PMC free article] [PubMed] [Google Scholar]
- 33.He L, Dooner HK. Haplotype structure strongly affects recombination in a maize genetic interval polymorphic for Helitron and retrotransposon insertions. Proc Natl Acad Sci USA. 2009;106(21):8410–8416. doi: 10.1073/pnas.0902972106. [DOI] [PMC free article] [PubMed] [Google Scholar]
- 34.Chia JM, et al. Maize HapMap2 identifies extant variation from a genome in flux. Nat Genet. 2012;44(7):803–807. doi: 10.1038/ng.2313. [DOI] [PubMed] [Google Scholar]
- 35.Smagulova F, et al. Genome-wide analysis reveals novel molecular features of mouse recombination hotspots. Nature. 2011;472(7343):375–378. doi: 10.1038/nature09869. [DOI] [PMC free article] [PubMed] [Google Scholar]
- 36.Borde V, et al. Histone H3 lysine 4 trimethylation marks meiotic recombination initiation sites. EMBO J. 2009;28(2):99–111. doi: 10.1038/emboj.2008.257. [DOI] [PMC free article] [PubMed] [Google Scholar]
- 37.Tischfield SE, Keeney S. Scale matters: The spatial correlation of yeast meiotic DNA breaks with histone H3 trimethylation is driven largely by independent colocalization at promoters. Cell Cycle. 2012;11(8):1496–1503. doi: 10.4161/cc.19733. [DOI] [PMC free article] [PubMed] [Google Scholar]
- 38.Mets DG, Meyer BJ. Condensins regulate meiotic DNA break distribution, thus crossover frequency, by controlling chromosome structure. Cell. 2009;139(1):73–86. doi: 10.1016/j.cell.2009.07.035. [DOI] [PMC free article] [PubMed] [Google Scholar]
- 39.de Boer E, Dietrich AJ, Höög C, Stam P, Heyting C. Meiotic interference among MLH1 foci requires neither an intact axial element structure nor full synapsis. J Cell Sci. 2007;120(Pt 5):731–736. doi: 10.1242/jcs.003186. [DOI] [PubMed] [Google Scholar]
- 40.Ferguson KA, Leung S, Jiang D, Ma S. Distribution of MLH1 foci and inter-focal distances in spermatocytes of infertile men. Hum Reprod. 2009;24(6):1313–1321. doi: 10.1093/humrep/dep021. [DOI] [PubMed] [Google Scholar]
- 41.Lao JP, et al. Meiotic crossover control by concerted action of Rad51-Dmc1 in homolog template bias and robust homeostatic regulation. PLoS Genet. 2013;9(12):e1003978. doi: 10.1371/journal.pgen.1003978. [DOI] [PMC free article] [PubMed] [Google Scholar]
- 42.Rosu S, et al. The C. elegans DSB-2 protein reveals a regulatory network that controls competence for meiotic DSB formation and promotes crossover assurance. PLoS Genet. 2013;9(8):e1003674. doi: 10.1371/journal.pgen.1003674. [DOI] [PMC free article] [PubMed] [Google Scholar]
- 43.Thacker D, Mohibullah N, Zhu X, Keeney S. Homologue engagement controls meiotic DNA break number and distribution. Nature. 2014;510(7504):241–246. doi: 10.1038/nature13120. [DOI] [PMC free article] [PubMed] [Google Scholar]
- 44.Berchowitz LE, Copenhaver GP. Genetic interference: Don’t stand so close to me. Curr Genomics. 2010;11(2):91–102. doi: 10.2174/138920210790886835. [DOI] [PMC free article] [PubMed] [Google Scholar]
- 45.Lhuissier FG, Offenberg HH, Wittich PE, Vischer NO, Heyting C. The mismatch repair protein MLH1 marks a subset of strongly interfering crossovers in tomato. Plant Cell. 2007;19(3):862–876. doi: 10.1105/tpc.106.049106. [DOI] [PMC free article] [PubMed] [Google Scholar]
- 46.Garcia V, Gray S, Allison RM, Cooper TJ, Neale MJ. Tel1(ATM)-mediated interference suppresses clustered meiotic double-strand-break formation. Nature. 2015;520(7545):114–118. doi: 10.1038/nature13993. [DOI] [PMC free article] [PubMed] [Google Scholar]
- 47.Baier B, Hunt P, Broman KW, Hassold T. Variation in genome-wide levels of meiotic recombination is established at the onset of prophase in mammalian males. PLoS Genet. 2014;10(1):e1004125. doi: 10.1371/journal.pgen.1004125. [DOI] [PMC free article] [PubMed] [Google Scholar]
- 48.Louis EJ, Borts RH. Meiotic recombination: Too much of a good thing? Curr Biol. 2003;13(24):R953–R955. doi: 10.1016/j.cub.2003.11.040. [DOI] [PubMed] [Google Scholar]
- 49.Terasawa M, Shinohara A, Hotta Y, Ogawa H, Ogawa T. Localization of RecA-like recombination proteins on chromosomes of the lily at various meiotic stages. Genes Dev. 1995;9(8):925–934. doi: 10.1101/gad.9.8.925. [DOI] [PubMed] [Google Scholar]
- 50.Pawlowski WP, et al. Maize AMEIOTIC1 is essential for multiple early meiotic processes and likely required for the initiation of meiosis. Proc Natl Acad Sci USA. 2009;106(9):3603–3608. doi: 10.1073/pnas.0810115106. [DOI] [PMC free article] [PubMed] [Google Scholar]
- 51.McPeek MS, Speed TP. Modeling interference in genetic recombination. Genetics. 1995;139(2):1031–1044. doi: 10.1093/genetics/139.2.1031. [DOI] [PMC free article] [PubMed] [Google Scholar]
- 52.Gauthier F, Martin OC, Falque M. CODA (crossover distribution analyzer): Quantitative characterization of crossover position patterns along chromosomes. BMC Bioinformatics. 2011;12:27. doi: 10.1186/1471-2105-12-27. [DOI] [PMC free article] [PubMed] [Google Scholar]