Abstract
Therapeutic hypothermia has been regarded as one of the most effective post-cardiac arrest (CA) treatments to improve survival and functional recovery. However, many clinical prognostic markers after resuscitation have become less reliable under hypothermia. In this study, we applied and compared two developed quantitative measures - information quantity (IQ) and sub-band IQ (SIQ) - to evaluate the accuracy of EEG markers on predicting cortical recovery under therapeutic hypothermia. A total of 14 rats under 9-min asphyxial-CA, leading to severe brain injury, were randomly divided into two groups: hypothermia (32°C-34°C) and normothermia (36.5–37.5°C) (n=7 per group). For each rat, EEG and temperature were continuously recorded for the first 15 hrs. EEG was then recorded for serial 30 mins at 24, 48 and 72 hrs. The neurologic deficit score was evaluated daily to assess the neurologic recovery. Early SIQ and IQ were both significantly correlated with the 72-hr NDS, when the rats remained comatose. Both IQ and SIQ were able to discriminate the animals with good and bad functional outcomes starting from 1 hr after resuscitation. There was no significant difference in 72-hr NDS results (hypothermia (median (25th, 75th), 65 (52, 67)) versus normothermia (53.5 (52.25, 66.75))) (p>0.05) due to the high mortality rate (5/14) with severe brain injury. Contrary to IQ recovery but similarly to NDS scores, the SIQ recovery was not significantly different between the hypothermia (0.66±0.04) and normothermia (0.64±0.04) groups (p>0.05). IQ could identify the presence of high-frequency oscillations during the recovery from severe brain injury. We demonstrated that while SIQ was able to provide additional sub-band EEG information related to the recovery of different brain functions, both early IQ and SIQ markers are able to accurately predict neurologic outcome after CA.
I. Introduction
Approximately 326,200 cases of death and disability are caused by cardiac arrest (CA) annually in the United States [1]. Only about 10.6% out-of-hospital patients survive CA, of whom 8.3% have good neurological outcome [1]. Therapeutic hypothermia has been recommended as one of the most effective neuroprotection methods and a standard treatment for post-CA patients to improve survival and functional outcome after resuscitation [1, 2]. However, the accuracy of some prognostic predictors for poor outcomes, such as the recovery of motor responses and biochemical markers, are challenged and less reliable under hypothermia [3]. Therefore, a study to re-evaluate the current prognostic markers for different degrees of brain injuries and recovery with therapeutic hypothermia is necessary.
Electroencephalography (EEG) has emerged as one of the most widely used reliable bed-side electrophysiological tools for prognostication. Due to the complicated and subjective analysis of raw EEG signals, a quantitative EEG (qEEG) method — information quantity (IQ) [4] was introduced, showing objective and reliable results in predicting neurological outcome and recovery after 7-min and 9-min axphyxial CA, leading to moderate or severe brain injury, respectively [5, 6]. However, IQ only determines the recovery pattern of gross EEG signals. Thus, an alternative method, sub-band IQ (SIQ), was developed to quantify the signal in 5 standard clinical frequency EEG bands of interest, excluding the high-frequency oscillation (HFO) (61-122 Hz). The qEEG recovery in the bands of interest, gamma (30-60 Hz), beta (16-30 Hz), alpha (8-15 Hz), theta (4-8 Hz), and delta (below 4 Hz) [7], are potentially related to the recovery of corresponding brain functions. Both IQ and SIQ were normalized to the baseline EEG and dead animals had a value of 0. Higher IQ or SIQ values have been proven to be associated with good neurological outcome after moderate CA [4, 7].
Here, we describe the calculation of early IQ-qEEG and SIQ-qEEG markers as a measure of neurologic outcome, and then compared their prediction value for neurologic outcome in rats that recovered from severe brain injury after 9-min CA with therapeutic hypothermia. Although SIQ and IQ were developed and validated in previous studies, their application to severe brain injury with therapeutic hypothermia has not been elucidated. We hypothesized that both IQ and 5-band SIQ qEEG markers would provide a reliable and detailed prognostic indicator after CA under therapeutic hypothermia, with the IQ marker providing additional information related to HFO activity.
II. Methods
A. Animals
Fourteen adult male Wistar rats (350±25 g) under 9-min asphyxial CA were randomly assigned to the hypothermia (33±1°C) or normothermia (37±0.5°C) groups (n=7 per group). The experiment protocols were approved by The Johns Hopkins University Animal Care and Use Committee.
B. Asphxial Cardiac Arrest and Hypothermia
The asphxial CA animal model was developed in our previous studies [5, 6]. Briefly, the rats were anesthetized with 1.0% halothane mixed with 50% oxygen and 50% nitrogen, delivered by mechanical ventilation. The femoral artery and vein were cannulated to administer drugs, monitor mean artery pressure (MAP) and obtain samples of arterial blood gases (ABG). After the 5-min baseline EEG recording, a 5-min washout period with 100% oxygen for 3 mins and room air for 2 mins was implemented to prevent an anesthetic effect on the EEG signals. The rats were paralyzed with vecuronium (2 mg/kg), delivered during the 2-min washout period by room air. Global asphyxia was induced by clamping the breathing circuit and stopping mechanical ventilation for 9 mins following the washout period. CA was defined as pulse pressure <10 mmHg. Immediately after the 9-min asphyxiation, cardiopulmonary resuscitation (CPR) was performed with effective ventilation, sternal chest compressions, 100% oxygen, epinephrine and NaHCO3 until the return of spontaneous circulation (ROSC) (MAP > 60mm Hg). The ABG was measured and monitored at 10, 20 and 40 mins after ROSC.
Hypothermia was initiated 45 mins after ROSC by external cooling using cold water and alcohol mist and an electric fan. The target core temperature of 33±1°C, measured by a temperature sensor (G2 E-mitter 870-0010-01, Mini Mitter, Sun River, OR), was achieved within 15 mins and was maintained for 12 hrs. At 13 hrs after ROSC, the animals were gradually re-warmed from 33°C to 37°C over 2 hrs. Normothermia was maintained after CPR at 36.5-37.5°C throughout the same time period as the hypothermia group. All animals were kept in a neonatal incubator at a temperature of 28°C in the first 24 hrs after ROSC [5].
C. EEG Recording and Data Analysis
A two channel EEG signal was recorded for 17 hrs from epidural electrodes (Plastic One, Roanoke, VA) implanted 1 week before the day of cardiac arrest, by WinDaq software at a sampling rate of 250 Hz on the first day of the experiment. Serial 30-min EEG recordings were carried out at 24, 48 and 72 hrs after ROSC. The artificial noise induced by animal movements, EMG, CPR etc, was visually detected and manually eliminated before the final data analysis.
In this study, we calculated the entropy-based IQ [4] and SIQ [7] in Matlab (MathWorks, Natick, MA) using our previously reported quantitative methods. In brief, Shannon entropy was calculated with a sliding temporal window technique (sliding window length ω=8s, sliding step Δ=8s, number of magnitude levels M=20), dividing the sampled EEG signals into equal-length windows. Second, 6 resolution decomposition coefficients, , where k=1,2,...r+1 representing the kth subband, were obtained by discrete wavelet transform (decomposition scale r=5) in each temporal window. Third, since the entropy is based on probability, we determined the statistical distribution of the wavelet coefficients within each time window. To calculate the probability, (m), of each coefficient, we introduced M bins, IM, such that each wavelet coefficient equals the union of IM bins, and calculated the occurrences of the coefficients found within each bin.
Next, the entropy formula was used to calculate the information content of the EEG signals. The difference between IQ (Eq.1) and SIQ (Eq.2) is that IQ is obtained from the probability function for all levels of sub-band decomposition, whereas SIQ is calculated from the separately estimated probabilistic distribution in each level of decomposition. Then, the final SIQ is obtained by averaging the SIQs of all five standard clinical sub-bands of interest. Finally, we compared the changes in these values with temperature intervention and the ability to predict neurologic outcome with IQ or SIQ in severe brain injury.
| (1) |
| (2) |
IQ and SIQ were normalized to the corresponding baseline values recorded before CA to allow comparison between the two temperature groups. IQ and SIQ were measured at 9 time intervals for both temperature groups: baseline (0-5 mins), CA period, 60-90 mins, 2-2.5 hrs, 3-3.5 hrs, 4-4.5 hrs, 5-5.5 hrs, 24 hrs, 48 hrs and 72 hrs.
D. Neurological Evaluation
A neurological deficit scale (NDS) score with a range of 0 (worst) to 80 (best) was used to evaluate the neurologic function of rats. The NDS examination was carried out by a trained examiner blinded to temperature groups. NDS was determined at 15 hrs on the day of CA and then repeated at 24, 48 and 72 hrs after ROSC [5]. Good neurologic outcome was predefined as animals with 72-hr NDS ≥ 60 and bad neurologic outcome as animals with 72-hr NDS < 60 [6].
E. Statistical Methods
The results of parametric tests (IQ, SIQ, temperature, ABG results) were reported as mean±S.E.M. and the non-parametric test results (NDS) were presented as median (25th-75th interquartile). All statistics were conducted using SPSS (IBM SPSS Statistics, version 22, Armonk, NY). “Aggregate IQ or SIQ” represent the signal analyzed over the 72-hr experimental period. Parametric tests consisted of univariate analyses to test for the differences in IQ or SIQ between temperature groups. The Mann-Whitney test was performed to test for the differences in rank order based NDS. Bivariate analyses with Pearson correlation were used to reveal the association between IQ or SIQ and 72-hr NDS. A level of p < 0.05 was considered significant.
III. Results
A. Temperature Recording, ABG Testing, and NDS Analysis
All fourteen rats’ core temperature was well controlled. The target temperatures were successfully achieved and maintained. All rats were moved to a neonatal incubator at normothermia in the first 24 hrs after ROSC. No significant differences were found in ABG values (pH, HCO3-, PCO2, PO2) at baseline, 10, 20 and 40 min after ROSC between the temperature groups (Data not shown). Although 72-hr NDS was slightly improved in the hypothermia group (median (25th, 75th), 65 (52, 67)) compared to the normothermia group (53.5 (52.25, 66.75)), no statistically significant difference was found (p>0.05), which may be due to the high mortality rate (3/7 in normothermia and 2/7 in hypothermia) resulting in an increased variability in the results.
B. Quantitative EEG (qEEG) Analysis
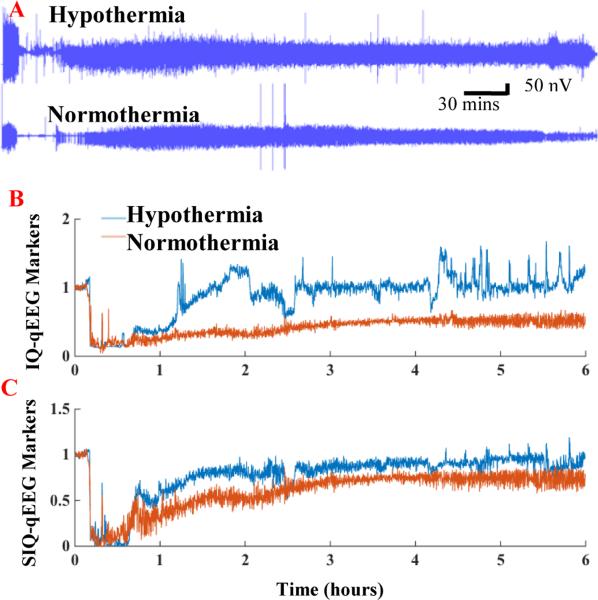
The raw EEG signals directly extracted from Windaq (Fig. 1A) were converted to IQ- (Fig. 1B) and SIQ- qEEG markers (Fig. 1C). Both IQ and SIQ decreased from baseline to the lowest points during CA, and then gradually recovered close to baseline until 72 hrs. The higher variability seen in the IQ curve might be caused by HFO (Fig. 1B).
Figure 1.
Representative raw EEG data, information quantity (IQ) and sub-band information quantity (SIQ) plots from the hypothermia and normothermia groups. A: Raw EEG signals from Windaq under hypothermia and normothermia. B-C: The effect of hypothermia on EEG recovery was apparent with the analysis of IQ (in B) and SIQ (in C). Higher IQ was more evident in hypothermia group compared with normothermia. The high variability in IQ might be due to the HFO.
C. Association between qEEG values and 72-hr NDS
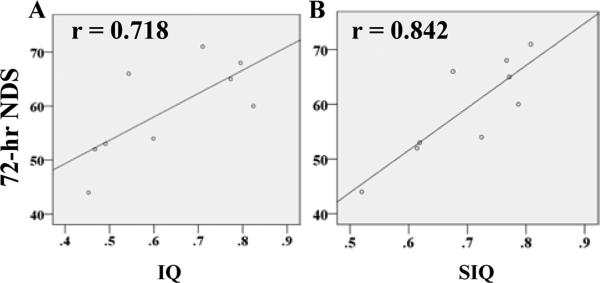
Bivariate analyses indicated a significant correlation between qEEG values and 72-hr NDS (Table. I). IQ-qEEG marker notably correlated with 72-hr NDS at 1 hr (r value: 0.829, p<0.01), 2 hrs (0.718, p<0.05) (Fig.2A), 24 hrs (0.723, p<0.05), 72 hrs (0.844, p<0.01). SIQ had a similar significant correlation with 72-hr NDS at 1 hr (0.802, p<0.01), 2 hrs (0.842, p<0.01) (Fig.2B), 72 hrs (0.710, p<0.05).
TABLE I.
Correlation coefficient between qEEG values and 72-hr NDS
| qEEG |
IQ | SIQ |
|---|---|---|
| Time | ||
| 1-1.5 hrs | 0.829** | 0.802** |
| 2-2.5 hrs | 0.718* | 0.842** |
| 3-3.5 hrs | 0.579 | 0.200 |
| 24 hrs | 0.723* | 0.621 |
| 48 hrs | 0.571 | 0.466 |
| 72 hrs | 0.844** | 0.710* |
p<0.05
p<0.01
Figure 2.
Representative Pearson correlation (r value) plot between IQ or SIQ and 72-hr NDS. A, IQ strongly correlated with 72-hr NDS at 2 hrs after ROSC (r value: 0.718), whereas, B, SIQ have a more robust correlation with 72-hr ROSC at the same time (r value: 0.842).
D. Prediction of Functional Outcomes by qEEG Markers
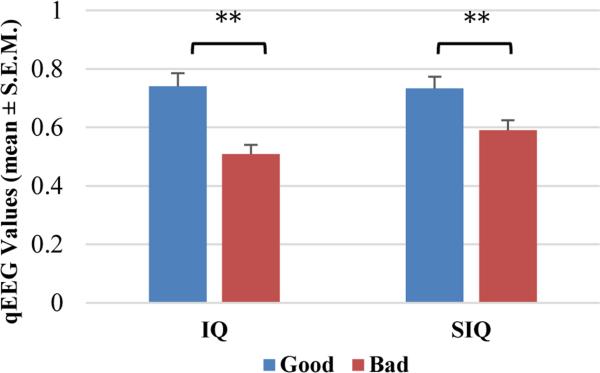
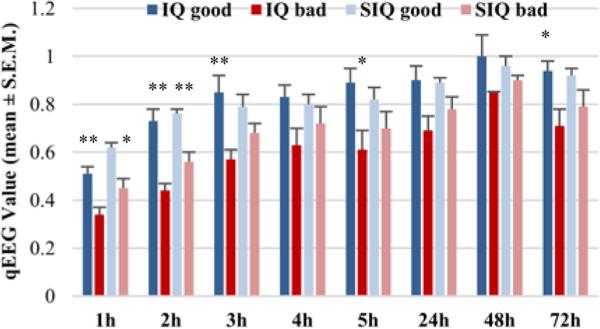
By comparing the good and bad neurological functional outcome groups, we found that the rats with good outcomes at 72 hrs after ROSC had higher aggregate IQ values (0.74±0.04) than those with bad outcomes (0.50±0.03) (p<0.01). The aggregate SIQ showed a similar tendency as the aggregate IQ. The rats in the good outcome group (0.73±0.04) also showed higher aggregate SIQ values than those with bad outcome (0.59±0.03) (p<0.01) (Fig.3). Significant differences between good/bad functional outcome groups could be found in both IQ and SIQ at different time intervals beginning at 1 hr after ROSC (Fig. 4).
Figure 3.
Higher aggregate IQ and SIQ values (mean±S.E.M) were found in rats with good functional outcome than in those with bad function outcome. *p<0.05, **p<0.01.
Figure 4.
In IQ, remarkable differences were observed between animals with good and bad outcomes beginning at 1 hr (good/bad: 0.51±0.03/0.34±0.03, p<0.01), 2 hrs (0.73±0.05/0.44±0.03, p<0.01), 3 hrs (0.85±0.07/0.57±0.04, p<0.01), 5 hrs (0.89±0.06/0.61±0.08, p<0.05), and 72 hrs (0.94±0.04/0.71±0.07, p<0.01), whereas notable differences in SIQ occurred at 1 hr (0.62±0.02/0.45±0.04, p<0.05) and 2 hrs (0.76±0.02/0.56±0.04, p<0.01). *p<0.05, **p<0.01
E. Changes in Aggregate IQ and Aggregate SIQ with Therapeutic Hypothermia
There was no significant difference in the recovery of SIQ between the hypothermia (0.66±0.04) and normothermia (0.64±0.04) groups (p>0.05), which is consistent with the trend of 72-hr NDS. The aggregate IQ of the hypothermia group (0.65±0.04) was significantly higher than the aggregate IQ of the normothermia group (0.56±0.04) (p<0.05).
IV. Discussion
In this study, the electrophysiological recovery in severely injured post-CA brains treated with therapeutic hypothermia was precisely tracked by entropy based-measures, IQ and SIQ. Both are able to accurately track the brain injury and recovery and predict the hypothermic effect on functional outcomes in the early time period after resuscitation when rats were still unresponsive.
IQ was previously validated by quantifying the recovery of EEG entropy in severe [5] and moderate brain injuries [6] with therapeutic hypothermia. However, IQ only analyzes the gross EEG, and changes in each EEG frequency band may relate to the recovery of different brain functions. To study the changes in clinically important frequency bands, we developed a new quantitative measure, SIQ, by averaging the IQ in 5 frequency sub-bands [7]. We previously found that a lower SIQ value is associated with greater injury and poor neurological outcome after CA [7]. Here we applied both IQ and SIQ on the EEG of post-severe CA rats. Both IQ and SIQ qEEG markers were proven to be accurate predictors of 72-hr NDS and were notably higher in the good functional outcome group than the bad functional outcome group as early as 1 hr after ROSC, while animals remained comatose.
Our previous study has shown that after moderate brain injury (7-min asphyxia-CA) both IQ [6] and SIQ (data not shown) accurately revealed the EEG recovery and predicted functional outcome. To investigate the effect of the 6th sub-band and compare IQ and SIQ, only 5 standard clinical sub-bands were used to calculate SIQ but the IQ calculated the gross entropy of 6 sub-bands. Due to the high mortality rate (overall 5/14) of these animals with severe brain injury, the current sample size cannot detect the statistical difference of 72-hr NDS between temperature groups, despite the improved functional outcome from 15 to 72 hrs in the hypothermia group. A similar lack of significance was also found in SIQ. The aggregate IQ recovery after resuscitation was higher in the hypothermia group than the normothermia group in severely brain injured 9-min CA rats. When IQ was calculated, the coefficients of 6 decompositions were combined to measure the distribution in the gross EEG, whereas the SIQ algorithm separately measured the entropy of coefficients in five different sub-bands of clinical interest and then averaged those results to get the final SIQ value. In other words, the 6th sub-band (approximately 61-122Hz) was considered in IQ but not in SIQ. The frequency band of the 6th sub-band is identified as ripple, an HFO [8] that is highly associated with epileptogenesis [8, 9] and is linked to poor outcome after CA [10]. Although IQ and SIQ depend on the bin size, differences in IQ or SIQ between animals remain the same as bin size increases [7]. M=20 was sensitive enough to discriminate the distinctions in qEEG markers among animals. While binning may filter some HFOs as a side effect, it would not completely filter the HFO components, as it is not a precise filtering process. The animals are more likely to generate HFOs after severe injury, resulting in the difference in prediction value between IQ and SIQ. In the current study, we didn't employ continuous video recordings or other measures to show evidence of epilepsy or seizure. Further investigation is needed to investigate the sources of such HFO activity in post-CA severe brain injury.
V. Conclusion
Our experiment demonstrated that HFO activities were particularly noticeable during the recovery from severe brain injury. While SIQ provides detailed sub-band EEG information related to the recovery of different brain functions, both early IQ and SIQ markers are able to accurately track recovery and predict the functional outcome from severe brain injury after CA. Development of an accurate early predictor for the recovery after ROSC from CA is the ultimate goal of neurologists and physicians. Our early qEEG markers, IQ and SIQ, are able to simplify the subjective and laborious interpretation of EEG, which may bring new benefits to bedside cerebral monitoring if translated into clinical use.
Acknowledgments
Research supported by R01HL118084 from NIH (to XJ). Dr. Jia was supported in partial by Maryland Stem Cell Research Fund (2013-MSCRFE-146-00) (to XJ).
Contributor Information
Ruoxian Deng, Department of Biomedical Engineering, Johns Hopkins University, Baltimore, MD 21205 and Department of Neurosurgery, University of Maryland School of Medicine, Baltimore, MD, USA 21201
Leanne M. Young, Department of Biomedical Engineering, Johns Hopkins University, Baltimore, MD 21205 and Department of Neurosurgery, University of Maryland School of Medicine, Baltimore, MD, USA 21201.
Xiaofeng Jia, Department of Neurosurgery, Orthopaedics, University of Maryland School of Medicine, Baltimore, MD, 21201, USA, and Department of Biomedical Engineering, Anesthesiology and Critical Care Medicine, Johns Hopkins University School of Medicine, Baltimore, MD, 21205, USA..
REFERENCE
- 1.Mozaffarian D, Benjamin EJ, Go AS, Arnett DK, Blaha MJ, Cushman M, et al. Heart disease and stroke statistics--2015 update: a report from the American Heart Association. Circulation. 2015 Jan 27;131:e29–322. doi: 10.1161/CIR.0000000000000152. [DOI] [PubMed] [Google Scholar]
- 2.Bernard SA, Gray TW, Buist MD, Jones BM, Silvester W, Gutteridge G, et al. Treatment of comatose survivors of out-of-hospital cardiac arrest with induced hypothermia. N Engl J Med. 2002 Feb 21;346:557–63. doi: 10.1056/NEJMoa003289. [DOI] [PubMed] [Google Scholar]
- 3.Bouwes A, Binnekade JM, Kuiper MA, Bosch FH, Zandstra DF, Toornvliet AC, et al. Prognosis of coma after therapeutic hypothermia: a prospective cohort study. Ann Neurol. 2012 Feb;71:206–12. doi: 10.1002/ana.22632. [DOI] [PubMed] [Google Scholar]
- 4.Shin HC, Tong S, Yamashita S, Jia X, Geocadin RG, Thakor NV. Quantitative EEG and effect of hypothermia on brain recovery after cardiac arrest. IEEE Trans Biomed Eng. 2006 Jun;53:1016–23. doi: 10.1109/TBME.2006.873394. [DOI] [PMC free article] [PubMed] [Google Scholar]
- 5.Jia X, Koenig MA, Shin HC, Zhen G, Yamashita S, Thakor NV, et al. Quantitative EEG and neurological recovery with therapeutic hypothermia after asphyxial cardiac arrest in rats. Brain Res. 2006 Sep 21;1111:166–75. doi: 10.1016/j.brainres.2006.04.121. [DOI] [PMC free article] [PubMed] [Google Scholar]
- 6.Jia X, Koenig MA, Nickl R, Zhen G, Thakor NV, Geocadin RG. Early electrophysiologic markers predict functional outcome associated with temperature manipulation after cardiac arrest in rats. Crit Care Med. 2008 Jun;36:1909–16. doi: 10.1097/CCM.0b013e3181760eb5. [DOI] [PMC free article] [PubMed] [Google Scholar]
- 7.Shin HC, Jia X, Nickl R, Geocadin RG, Thakor Ast NV. A subband-based information measure of EEG during brain injury and recovery after cardiac arrest. IEEE Trans Biomed Eng. 2008 Aug;55:1985–90. doi: 10.1109/TBME.2008.921093. [DOI] [PMC free article] [PubMed] [Google Scholar]
- 8.Bragin A, Wilson CL, Staba RJ, Reddick M, Fried I, Engel J., Jr. Interictal high-frequency oscillations (80-500 Hz) in the human epileptic brain: entorhinal cortex. Ann Neurol. 2002 Oct;52:407–15. doi: 10.1002/ana.10291. [DOI] [PubMed] [Google Scholar]
- 9.Jacobs J, Levan P, Chatillon CE, Olivier A, Dubeau F, Gotman J. High frequency oscillations in intracranial EEGs mark epileptogenicity rather than lesion type. Brain. 2009 Apr;132:1022–37. doi: 10.1093/brain/awn351. [DOI] [PMC free article] [PubMed] [Google Scholar]
- 10.Rossetti AO, Oddo M, Logroscino G, Kaplan PW. Prognostication after cardiac arrest and hypothermia: a prospective study. Ann Neurol. 2010 Mar;67:301–7. doi: 10.1002/ana.21984. [DOI] [PubMed] [Google Scholar]


