

Abstract
In this paper, we report a one-step tumor cell detection approach based on the dynamic morphological behavior tracking of cancer cells on a ligand modified surface. Every cell on the surface was tracked in real time for several minutes immediately after seeding until these were finally attached. Cancer cells were found to be very active in the aptamer microenvironment, changing their shapes rapidly from spherical to semi-elliptical, with much flatter spread and extending pseudopods at regular intervals. When incubated on a functionalized surface, the balancing forces between cell surface molecules and the surface-bound aptamers, together with the flexibility of the membranes, caused cells to show these distinct dynamic activities and variations in their morphologies. On the other hand, healthy cells remained distinguishingly inactive on the surface over the same period. The quantitative image analysis of cell morphologies provided feature vectors that were statistically distinct between normal and cancer cells.
Keywords: Temporal Image Processing, Cancer Cell Morphology, Human Glioblastoma (hGBM), Cell Imaging, Early Cancer Diagnosis
Innovation
Ligand-based approaches for cancer cell isolation often require a second step (cell lysis, genetic verification, etc.) to confirm malignancy. Our approach has the potential to eliminate such requirements. By observing the behavior of cells on a ligand-coated surface, there is a possibility to identify a cancer cell from a pool of mixed cells. We have performed the experiments for human glioblastoma (hGBM); however, this can be extended to multiple platforms for disease detection.
Introduction
Rapid diagnosis is crucial for early detection and effective cure of cancer. Tumor cells provide an important pathway for such detection. Several strategies such as dielectrophoresis, methods employing mechanical forces, flow cytometry and magnetic-attraction-based methods have been reported previously1–4. Genetic mutation and its subsequent transcription result in abnormal expressions of protein biomarkers on the cancer cells that can indicate physiological states of the cells and are important for monitoring cancer progression. Many ligand-based cell isolation platforms targeting these protein biomarkers have been previously reported for fast cancer diagnosis5,6. These affinity-based devices target cancer biomarkers with surface-bound complementary ligands such as antibodies or aptamers. Sorting based on affinity interactions with RNA aptamers has been shown to yield high efficiency and specificity7–11. In this approach, biopsy-extracted lesions can be confirmed for malignancy based on the number of cells captured on the aptamer-tethered surface after a certain period of incubation. These cell-isolation methods usually require a pre-screening followed by cell lysis for further verification. A strict lab environment is mandatory and a possible waiting period delays the diagnosis process. Also, to date, none of these methods can meet the requirements of non-invasiveness, low cost, high sensitivity, high specificity and minimal false results. False positives/negative results can add significant complexity to the later prognosis.
For rapid diagnosis, instead of prevailing multi-step approaches, a one-step method is clearly desired. Morphology-based one-step tumor cell confirmation methods have been proposed before. Cultured cancer cells were shown to demonstrate distinctive morphology compared to healthy counterparts. It was shown that cell morphology reflected the underlying gene expression and protein expression patterns on the cancer cell12. However, the cell culture approach required a prohibitively long verification time. Cell shapes were also reported to show somewhat distinguishing features after isolation on a ligand-modified surface7. However, in isolation-based approaches, few healthy cells also showed morphological features that matched closely to the tumor cells and thus reduced the specificity of the method.
In this article, a new cytological approach is presented to identify cancer cells based on the tracking of their dynamic behavior on functionalized surfaces. Aptamer-coated substrates were used to selectively interact with human glioblastoma (hGBM) tumor cells (Fig. 1). The hGBM cells are known to overexpress epidermal growth factor receptors (EGFRs) and these have been previously isolated using an anti-EGFR RNA aptamer13. Aptamers are single-stranded DNA or RNA oligonucleotides that bind to target molecules. Similar structures are found in biological systems such as riboswitches, which regulate transcription. These oligonucleotides have the tendency to fold into 3D structures that complement the binding sites of the target. These are also selected synthetically and have been used as ligands for affinity-based isolation14–16.
Figure 1.
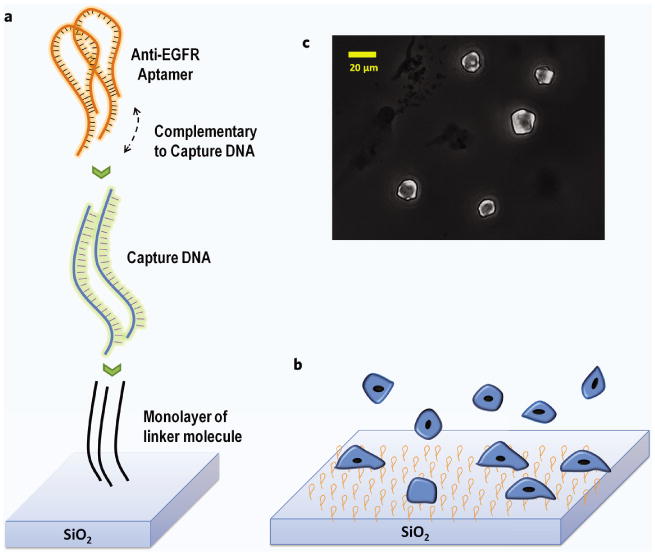
(a) Schematic depicting aptamer attachment chemistry starting with capture DNA immobilized on the surface through the PDITC linker (not to scale). The capture DNA provides a larger radius of gyration and hence less steric hindrance to the aptamer. Aptamers form a duplex with the capture DNA on one side while the other has the functional structure. The functional side binds to the target receptors on the cells. (b) Cells flatten out as these bind to the surface. (c) Microscopic image shows how surface-bound cells are flattened after attaching to the substrate.
During the incubation period of hGBM cells on the aptamer-functionalized surfaces, the cells showed distinct morphological attributes (non-globular form, extending pseudopods, flatter orientation, etc.), which were absent in normal cells. Several feature vectors such as non-uniformity and Hausdorff distance were calculated based on transient morphological changes from the images taken during incubation. The comparison of the vectors between healthy and diseased cells revealed a clear distinction. This single-step detection based on cell's dynamic morphological behavior is simple (potential avoidance of human subjectivity), economic (less stringent lab requirement) and have the potential for a better, faster and possibly a point of care detection system once matured.
Materials and Methods
Cancer and normal cells
The hGBM cells and astrocytes were obtained from consenting patients at the University of Texas Southwestern Medical Center at Dallas, Texas as per the approved Institutional Review Board (IRB) protocols. Astrocytes are glial cells from the same lineage as hGBM cells. Overexpression of EGFR on astrocyte cells was reported to be independent predictor of glioblsatoma17. Therefore, hGBM and its healthy counterpart astrocyte were used for proper comparison. Silicon dioxide (glass) surfaces were functionalized with RNA aptamers known to selectively bind to EGFR7. Once cells were incubated, time-lapse images were taken using optical microscope and recorded images were analyzed. Simple image processing techniques for contour detection were used to follow and quantify cell behavior. Quantitative data gave objective comparison between normal and cancer cells.
Role of EGFR as cancer biomarker
Upregulation of EGFR has been previously reported to be associated with lung cancer and glioblastoma (most aggressive malignant brain tumor) with EGFR densities ranging from 40,000 to 100,000 per cell18,19. In a separate study, a mutation of EGFR, known as EGFRvIII, has also been observed in lung and gliocarcinomas which was found to be responsible for the proliferative nature of cells20. Mutant EGFRvIII is responsible for constant activation of the receptors causing the cells to undergo constant division and thus predisposing the individual to cancer. The EG-FRvIII is characterized by a sequence deletion of exons 2–7 (amino acids 6–273)21. Both types of EGFRs are present on the hGBM cell surface but the expression level and the density of the wild type EGFR is much lower (40,000 per cell) than the density of mutant EGFR (approximately a million per cell). It has been shown that an anti-EGFR RNA aptamer used here binds specifically with both mouse-derived wild-type EGFR and mutant EGFRvIII7,22. EGFR-overexpressing glioma cells which were bound to fluorescence-tagged anti-EGFR aptamer showed increased expression compared to control fibroblast cells7. This difference was due to the low number of EGFR on fibroblast cell surfaces.
The anti-EGFR aptamers with capturing efficiency (ratio of the number of captured cells to the total number of tumor cells) of 62% was reported previously7. In the same paper, it was shown that the specif city of aptamers on tumor cell capturing was 94.82% from a mixture of hGBM and fibroblast cells. In our experiments, similar specif city was observed from a mixture of hGBM and astrocyte cells (data not shown). This specif city of the aptamer can be attributed to a few factors. The chosen aptamers could only bind to the extracellular ligand-binding domain III of the receptors which is present in both wild-type and mutant EGFRs. This minimizes the chances of non-specific adsorption. Again, tumor cells have high density of sialylation on their surface resulting in negatively charged cell surface23. As a result, generic tumor cells are repelled by the negative charge of the surface-grafted aptamer. This promotes only the EGFR-overexpressing cells to bind to the surface, resulting in the superior specificity.
Aptamer immobilization
Anti-EGFR RNA aptamer selection process and sequence has been reported before7. The anti-EGFR aptamer sequence was: 5′-GGC GCU CCG ACC UUA GUC UCU GUG CCG CUA UAA UGC ACG GAU UUA AUC GCC GUA GAA AAG CAU GUC AAA GCC GGA ACC GUG UAG CAC AGC AGA GAA UUA AAU GCC CGC CAU GAC CAG-3′ (the extended sequence used to bind to capture DNA is shown in italics). The sequence for mutant aptamer was 5′-GGC GCU CCG ACC UUA GUC UCU GUU CCC ACA UCA UGC ACA AGG ACA AUU CUG UGC AUC CAA GGA GGA GUU CUC GGA ACC GUG UAG CAC AGC AGA GAA UUA AAU GCC CGC CAU GAC CAG-3′. Substrate-anchored capture DNA probe had the sequence: 5′-amine-CTG GTC ATG GCG GGC ATT TAA TTC-3′.
The capture DNA probe improved selectivity and sensitivity of the aptamers. The DNA covalently immobilized the aptamer on the surface (functionalization). This DNA hybridized to one end of the aptamer, increasing the distance between the aptamers and the substrate and minimizing steric and electrostatic hindrances that could affect functionality. The aptamer's radius of gyration also increased, allowing increased reactivity.24
Covalent immobilization of anti-EGFR aptamers on substrates and verification
The aptamer binding protocol was adapted from literature7,25. Glass slides were used as substrates and were cut into ∼5 × 5 mm2 pieces. Piranha solution (H2O2:H2SO4, 1:3) was used to clean the slides for 10 minutes followed by deionized (DI) water rinse and nitrogen blow-dry. These slides were immersed in methanol/DI water (19:1) and 3% 3-aminopropyl trimethoxysilane (APTMS) solution for 30 minutes. After successive washing with DI water and methanol, the substrates were incubated at 120°C for 30 minutes. A dimethylformamide (DMF) solution was prepared using 10% pyridine and 1 mmol/l p-Phenylene diisothiocyanate (PDITC). The glass chips were then immersed in the DMF solution for 5 hours at 45°C, rinsed with DMF and 1,2- dichloroethane and dried with nitrogen gas. A 30 μmol/l of capture DNA solution with 5′ end amine group was prepared using DI water with 1% N,N-Diisopropylethylamine (DIPEA). 15 μl of the DNA solution was placed on each glass substrate. These were then incubated overnight in a humid chamber at 37°C. The substrates were then successively washed with methanol and diethylpyrocarbonate (DEPC)-treated DI water. To prevent any non-specific protein adsorption, unreacted PDITC moieties were capped to deactivate the functional ends. This was done by immersing the glass slides for 5 hours in 150 mmol/l DIPEA in DMF and 50 mmol/l 6-amino-1-hexanol. Again, each substrate was sequentially washed with ethanol, DMF, and DEPC-treated DI water. RNase-free and DEPC-treated DI water was used to wash the incubator. A 5 μl drop of 1 μmol/l anti-EGFR RNA aptamer was placed on each substrate in the presence of 1× annealing buffer [10 mmol/l Tris (pH 8.0), 1 mmol/l EDTA (pH 8.0), 1 mmol/l NaCl]. After 2 hours of hybridization at 37°C, substrates were washed with 1× annealing buffer and DEPC-treated DI water for 5 minutes. A mutant aptamer using the same protocol was hybridized onto control substrates and used as a negative control device. Prepared chips were used immediately after preparation or stored in 1× PBS (pH 7.5) with 5 mmol/l magnesium chloride solution until used.
Immobilization of ssDNA and RNA aptamers on the glass surface was verified by fluorescence measurements of acridine orange (AO) stain at an excitation wavelength of 460 nm and an emission wavelength of 650 nm. The chip surfaces were stained at different immobilization steps. In short, AO solution of concentration 2 mg/ml was prepared in sterilized DI water and the samples were completely immersed into it and kept on the shaker for 30 minutes. The samples were then washed thoroughly with DEPC water before fluorescence measurement. ImageJ software was used to analyze the images.
Isolation and sorting of hGBM cells
The hGBM cells were placed in ice-cold HBSS solution after being taken from the patient's brain. The specimens were, on average, larger than 50 mm3. Lymphocyte-M (Cedarlane labs) was used to remove the red blood cells from the specimen. A solution of 2% papain and dispase was used to gently dissociate the intact hGBM cells, followed by gentle grinding (trituration). FACSCalibur machine (BD Biosciences) was then used to sort out the cells. Clonal expansion and formation of orthotopic tumors was observed in both CD133+ and CD133− fractions. Cells from the CD133+ fraction were then used in the experiments.
Image processing, contour detection and feature extraction
Time-lapsed optical micrographs were acquired at 30-second intervals using a Leica microscope with DFC295 color camera at 20× magnification. A moving stage microscope was used to image the entire chip. Cell density was measured using hemocytometer and was kept at 100,000 cells/ml to avoid cell clumping. From the acquired images, each cell was cropped out using image segmentation algorithm and a 200 × 200 pixel cropping was performed around the estimated cell center. This cropping kept a typical cell completely inside the frame. Images where two or more cells were seen clumped together were discarded. Less than 5% of the images showed such clumping behavior of cells. The number of pixels was chosen to increase the speed as well as to retain the required information.
After initial Wiener filtering, contrast enhancement and smoothing, separated cell image contours were detected using “level set” algorithm26. Energy parameters were defined for each image and an initial contour was estimated. The contour image plot was then converted to binary format for further analysis. Binary morphological image processing functions ‘erode’ and ‘dilate’ were used to eliminate spurious pixels27. This conversion made it suitable to statistically analyze the extracted data, without losing any important morphological information.
Centroids for all cells were determined and cell membrane distances from the centers were calculated at an interval of 24° (Fig. 2). A total of 15 radii (360°/24) were calculated for each cell. This resolution was chosen for the specific image size used here. Too low a number of radii failed to reveal important features, whereas a large number increases computational load without adding any extra information.
Figure 2.
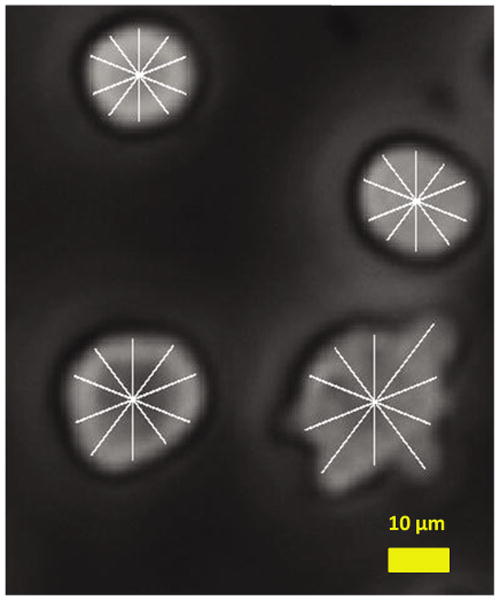
Extracted cell radius superimposed on the original grayscale image. Ten radial lines are shown here for clarity. Each radial line length is measured for comparison. A higher resolution is used in actual feature extraction.
Cancer cells continued to change shapes randomly while incubated on the surface. Shapes changed from oval to elliptical and then to highly non-uniform shapes with multiple pseudopods extension. The shape randomness was tracked from frame to frame for each cell. Non-uniformity of cells was calculated from the differential of two successive radii. For two successive radii, rn and rn+1, the differential was Δr = rn+1 − rn.
To avoid image-processing artifacts, an empirical deviation of 9 pixels (corresponding to ∼2 micron in actual cell size) was set as threshold. Any difference (Δr) below 9 pixels was considered as image acquisition/processing error and was discarded. This threshold level was used to amplify the difference and a non-uniformity parameter was calculated as:
Hausdorff distance is a standard measure to determine the variation between successive frames by calculating and comparing point-to-point distances between the contours28. This parameter finds the maximum value among all minimum distances between any two possible point sets on the two cell membranes from two consecutive images. A comparison was made frame by frame for all the cells.
Pseudopods were computationally defined as an extension of the membrane over a threshold multiplier of the average radius. Such extensions were calculated and tracked for a 360°-rotation of radius for every frame. Cancer cells showed random extensions and contractions of pseudopods, whereas normal cells remained mostly globular and did not show distinct activity. Hence, a change in number of pseudopods over time was also an important discriminating factor in this context. The rate of change in number of pseudopods from frame to frame was thus calculated. An extension was considered a positive change and its contraction was counted as a negative. Formation of pseudopods at different angles was measured and recorded to keep track of the cell wall changes.
Results and Discussions
Cell motility is a natural phenomenon, where cells move by protruding and contracting sections of the membrane. This complex process is accomplished by sophisticated balancing acts between internal cytoskeleton structure and the cell membrane proteins29. Flexibility of the cancer cell membranes has been reported to be higher than the healthy cells due to their inherent weak structures30,31. Because of overexpression of several proteins on the membrane of cancer cells, the balancing forces between the cytoskeleton and the membrane proteins are different than healthy cells. The hGBM cells, with a strong over-expression of the EGFR, when seeded on a surface functionalized with an anti-EGFR aptamer, had an added parameter in the balancing equation. The surface passivation due to anti-EGFR aptamer coating on the surface reduced adhesion while the binding interaction between EGFR and anti-EGFR aptamer interaction enhanced the membrane protrusion. This led to enhanced cell movement activity.
The RNA aptamers on the surface created a passive monolayer that inhibited regular cell-surface interactions through adhesion molecules. Creating a uniform dense layer covering the whole chip was important to avoid non-specific activity on the bare or low aptamer dense regions that may result in false positive diagnosis. On bare glass, astrocytes were found to show similar activity, though at a much reduced pace. A comparison of interactions (in terms of non-uniformity) between astrocyte cells and piranha-cleaned bare glass and an aptamer-functionalized glass substrate is presented in Supplementary Fig. 1.
Binding of probe DNA and RNA to the substrate was verified through staining by acridine orange (Supplementary Fig. 2). In all cases, before incubating on the substrates, cells were centrifuged and the supernatants were removed. Sterilized 1× PBS solution (with 5 mmol/l MgCl2) was added to dilute the cells and these were kept at 37°C in water bath. The functionalized slides were kept in PDMS wells and a 0.5-ml cell suspension was placed on each substrate to ensure they were completely submerged. The experiments were done both in and outside of an incubation chamber and negligible differences were observed during the short time of imaging.
Complete data acquisition process was done within 20 minutes of cell seeding. After 3–4 minutes of initial settling time, images were captured at 30-second intervals. Each cell image was separated out and contours were detected. Contour detection time depended on number of factors such as microscope light, depth of field (DOF) and aperture size. The protruded out-of-focus region of the cell images were manually corrected to define exact contour. Sequential images of 100 regions were taken on a moving-stage microscope to ensure that all cell activities were recorded across the whole chip surface (Supplementary Fig. 3). Each chip on average had about 8,000 cells and all of the cells were tracked periodically.
Four combinations of cells and functionalized surfaces were used: (i) hGBM cells + anti-EGFR aptamer surface, (ii) astrocytes + anti-EGFR aptamer surface, (iii) hGBM cells + mutant aptamer surface and (iv) astrocytes + mutant aptamer surface. The last three combinations acted as controls for the experiments. Non-uniformities and Hausdorff distances for all four combinations were calculated for randomly picked 100 cells per sample type. Tumor-cell activity on the aptamer-modified surface is shown in Fig. 3a.
Figure 3.
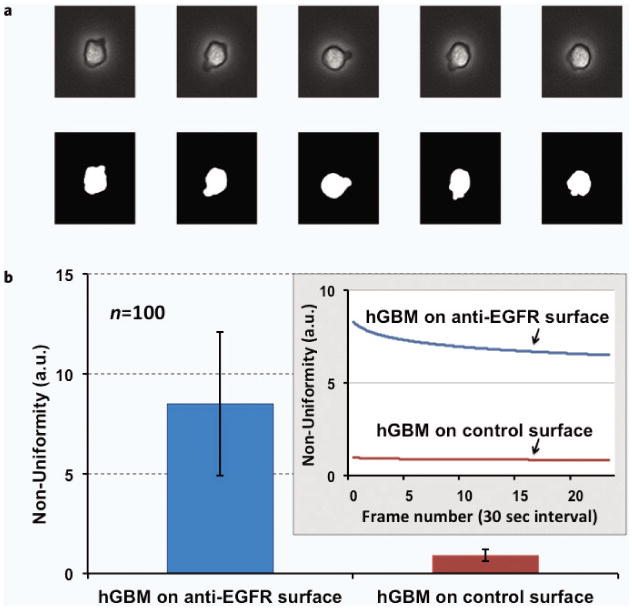
(a) Tumor cell activity on anti-EGFR aptamer modified surfaces. Five consecutive images with binary converted counterparts are shown. These images are taken every 30 seconds for the same cell. (b) EGFR-overexpressing hGBM cells showed enhanced activity through shape variation and pseudopod formation when incubated on the anti-EGFR aptamer surface. Large error bar indicates significant variations in cell shapes for the pool of measured cells. It depicts the formation and annihilation of the pseudopods, or changes in shape at higher randomness. In contrast, these cells showed negligible activity on the mutant aptamer-coated control surface. The inset shows the variation in non-uniformity over 15 minutes.
The hGBM cells on the anti-EGFR aptamer-modified surface showed much higher non-uniformity in their surface contour over the period of image acquisition. The same cells remained inactive on a mutant aptamer-coated controlled surface (Fig. 3b). The mutant aptamer had no specificity of EGFR hence the hGBM cells showed no distinct behavior. Over 25 frames, tumor cells showed non-uniformity ranging from 8–10 (a.u.) on average for the anti-EGFR aptamer surface, whereas in the control combinations, it remained below 1 (a.u.).
In control experiments, astrocyte cells were incubated on both the anti-EGFR aptamer and the mutant aptamer-coated surfaces. As expected, these cells showed negligible activities on both the surfaces (Fig. 4). This result supports the notion that surface was indeed passivated by the RNA layer and only a complementary anti-EGFR ligand on the surface could activate the cell towards shape changes.
Figure 4.
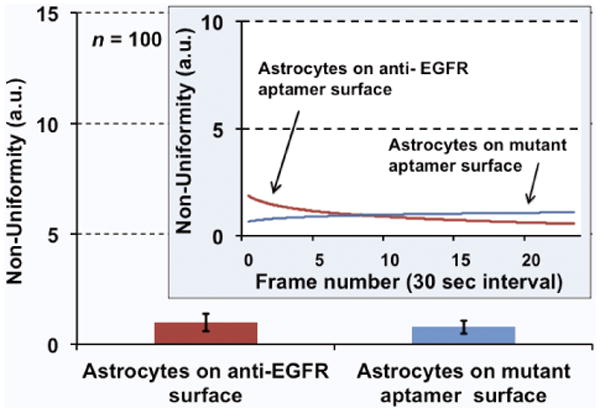
Average non-uniformity for the astrocyte cells calculated over 15 minutes. The cells remained inactive and “calm” on both EGFR-specific and non-specific surfaces. The inset shows the variation in non-uniformity over time.
The Hausdorff distance of the cell contour between the consecutive frames is shown in Fig. 5. Compared to the case of hGBM cells on mutant aptamer surfaces, the tumor cells on the anti-EGFR aptamer surfaces consistently showed higher Hausdorff distances, indicating rapid shape changes between frames. On average, the Hausdorff distance was calculated to be 4500 (a.u.) for tumor cells, whereas for control combinations, it stayed around 200 (a.u.).
Figure 5.
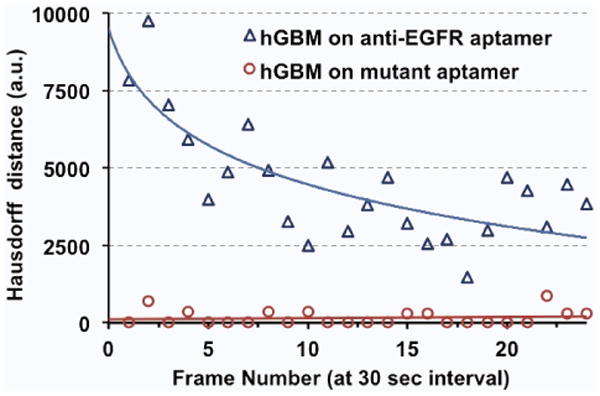
Hausdorff distances between consecutive frames (averaged over 40 cells). Cancer cells show enhanced activity at the beginning and the activity reduces with time as cells finally attach to the surface.
The rates of change in number of pseudopods between frames are shown in Table 1. The tumor cells on anti-EGFR aptamer surfaces showed pseudopods forming at different locations on the wall of the same cell as seen in consecutive frames (Fig. 3a). There was constant formation and contraction of pseudopods. Each contraction was considered as a change of –1 while formation of a new pseudopod was counted as +1. On the other hand, control combinations showed minimal changes in cell contours. Even if there were pseudopods at start, these stayed at the same orientation in all subsequent frames. This supports the necessity of cell tracking we mentioned in the beginning. A healthy cell, at the end of the incubation period may have a highly non-uniform shape similar to the tumor cells and may result in a false-positive if diagnosed by just the end-cell morphology. However, tracking the activity of the cell over the whole incubation period reveals the actual nature of the cell.
Table 1.
Differential change of pseudopod formation in the four combinations of cells and surfaces. Ten sets of random cells are taken from a pool of samples and presented in the table. The hGBM cells on anti-EGFR surface show significantly large number of changes when totaled over 25 frames that were captured 30 second apart.
| Differential Change over 25 frames | ||||||||||
|---|---|---|---|---|---|---|---|---|---|---|
| Dataset number | 1 | 2 | 3 | 4 | 5 | 6 | 7 | 8 | 9 | 10 |
| Astrocytes on anti-EGFR aptamer | 0 | 0 | 0 | 0 | 5 | 3 | 2 | 5 | 0 | 1 |
| Astrocytes on mutant aptamer | 0 | 0 | 3 | 0 | 0 | 4 | 0 | 0 | 1 | 0 |
| hGBM cells on anti-EGFR aptamer | 20 | 7 2 | 8 | 12 | 6 | 11 | 9 | 7 | 5 | 14 |
| hGBM cells on mutant aptamer | 0 | 0 | 1 | 0 | 0 | 0 | 0 | 0 | 1 | 0 |
conclusions
We have shown that there are quantitative differences in the interactions of astrocytes and hGBM cells on aptamer-functionalized surfaces. By using appropriate image-processing techniques in combination with surface preparation and selective functionalization, a cytological indicator for tumor cells can be implemented. Although the results were shown for only EGFR-overexpressing glioblastoma, using a similar aptamer micro-environment, other known oncoproteins can be targeted for detection of different tumors types. A chip-based device targeting several proteins can lead to a generic approach. The advantage of the technology compared to others is that it is suitable for a quick diagnosis without much overhead. The aptamer chips can remain active for a few weeks in controlled conditions and a microfluidic platform can be potentially incorporated. Once matured, the method can serve as an additional modality to identify tumor cells based on their physical behavior from blood samples or biopsy specimens directly drawn from patients.
Supplementary Material
Supplementary Figure 1 Astrocyte cell and substrate interactions for both bare glass surface and non-specific anti-EGFR RNA aptamer-functionalized surface. The inset shows the variation of non-uniformity over time.
Supplementary Figure 2 Acridine orange (AO) fluorescence is measured at multiple steps of surface functionalization to compare the presence of the surface-bound oligonucleotides. Higher fluorescence intensity on RNA-hybridized surface shows the formation of RNA aptamer monolayer on the surface.
Supplementary Figure 3 A 5 × 5 mm2 glass chip with incubated cells. The scratch mark is for orientation and to ensure that the functionalized side of the glass remains on top all the time. The images taken in one step are stitched together to show the complete chip surface.
Acknowledgments
Authors would like to acknowledge useful discussions with Yuan Wan and Jakir Hossen. Special gratitude is due to Dr. Robert Bachoo at the University of Texas Southwestern Medical Center at Dallas for providing hGBM and human-derived astrocyte cells.
References
- 1.Gascoyne PRC, Vykoukal J. Particle separation by dielectrophoresis. Electrophoresis. 2002;23:1973. doi: 10.1002/1522-2683(200207)23:13<1973::AID-ELPS1973>3.0.CO;2-1. [DOI] [PMC free article] [PubMed] [Google Scholar]
- 2.Gossett DR, Weaver WM, Mach AJ, Hur SC, Tse HTK, Lee W, Amini H, Di Carlo D. Label-free cell separation and sorting in microfluidic systems. Anal Bioanal Chem. 2010;397:3249–3267. doi: 10.1007/s00216-010-3721-9. [DOI] [PMC free article] [PubMed] [Google Scholar]
- 3.Barlogie B, Raber MN, Schumann J, Johnson TS, Drewinko B, Swartzendruber DE, Göhde W, Andreeff M, Freireich EJ. Flow cytometry in clinical cancer research. Cancer Res. 1983;43:3982–3997. [PubMed] [Google Scholar]
- 4.Pankhurst QA, Connolly J, Jones SK, Dobson J. Applications of magnetic nanoparticles in biomedicine. J Phys D Appl Phys. 2003;36:R167. [Google Scholar]
- 5.Huang YF, Chang HT, Tan W. Cancer cell targeting using multiple aptamers conjugated on nanorods. Anal Chem. 2008;80:567–572. doi: 10.1021/ac702322j. [DOI] [PubMed] [Google Scholar]
- 6.Nagrath S, Sequist LV, Maheswaran S, Bell SW, Irimia D, Ulkus L, Smith MR, Kwak EL, Digumarthy S, Muzikansky A. Isolation of rare circulating tumour cells in cancer patients by microchip technology. Nature. 2007;450:1235–1239. doi: 10.1038/nature06385. [DOI] [PMC free article] [PubMed] [Google Scholar]
- 7.Wan Y, Kim Y, Li N, Cho SK, Bachoo R, Ellington AD, Iqbal SM. Surface-immobilized aptamers for cancer cell isolation and microscopic cytology. Cancer Res. 2010;70:9371–9380. doi: 10.1158/0008-5472.CAN-10-0568. [DOI] [PubMed] [Google Scholar]
- 8.Wan Y, Mahmood M, Li N, Allen PB, Kim YT, Bachoo R, Ellington AD, Iqbal SM. Nanotextured substrates with immobilized aptamers for cancer cell isolation and cytology. Cancer. 2012;118:1145–1154. doi: 10.1002/cncr.26349. [DOI] [PMC free article] [PubMed] [Google Scholar]
- 9.Wan Y, Liu Y, Allen PB, Asghar W, Mahmood MAI, Tan J, Duhon H, Kim YT, Ellington AD, Iqbal SM. Capture, isolation and release of cancer cells with aptamer-functionalized glass bead array. Lab Chip. 2012;12:4693–4701. doi: 10.1039/c2lc21251j. [DOI] [PMC free article] [PubMed] [Google Scholar]
- 10.Ma H, Liu J, Ali MM, Mahmood MAI, Labanieh L, Lu M, Iqbal SM, Zhang Q, Zhao W, Wan Y. Nucleic acid aptamers in cancer research, diagnosis and therapy. Chem Soc Rev. 2015;44:1240–1256. doi: 10.1039/c4cs00357h. [DOI] [PubMed] [Google Scholar]
- 11.Erdmann VA, Barciszewski J, Mahmood M, Khan UM, Iqbal S. Nucleic acid-based encapsulations for cancer diagnostics and drug delivery. In: Erdmann VA, Barciszewski J, editors. DNA and RNA Nanobiotechnologies in Medicine: Diagnosis and Treatment of Diseases. Springer; 2013. pp. 163–187. [Google Scholar]
- 12.Kenny PA, Lee GY, Myers CA, Neve RM, Semeiks JR, Spellman PT, Lorenz K, Lee EH, Barcellos-Hoff MH, Petersen OW. The morphologies of breast cancer cell lines in three-dimensional assays correlate with their profiles of gene expression. Mol Oncol. 2007;1:84–96. doi: 10.1016/j.molonc.2007.02.004. [DOI] [PMC free article] [PubMed] [Google Scholar]
- 13.Carpenter G, Cohen S. Epidermal growth factor. Annu Rev Biochem. 1979;48:193–216. doi: 10.1146/annurev.bi.48.070179.001205. [DOI] [PubMed] [Google Scholar]
- 14.Hamaguchi N, Ellington A, Stanton M. Aptamer beacons for the direct detection of proteins. Anal Biochem. 2001;294:126–131. doi: 10.1006/abio.2001.5169. [DOI] [PubMed] [Google Scholar]
- 15.Macaya RF, Schultze P, Smith FW, Roe JA, Feigon J. Thrombin-binding DNA aptamer forms a unimolecular quadruplex structure in solution. Proc Natl Acad Sci. 1993;90:3745. doi: 10.1073/pnas.90.8.3745. [DOI] [PMC free article] [PubMed] [Google Scholar]
- 16.Downward J. Targeting RAS signalling pathways in cancer therapy. Nat Rev Cancer. 2003;3:11–22. doi: 10.1038/nrc969. [DOI] [PubMed] [Google Scholar]
- 17.Zhu A, Shaeffer J, Leslie S, Kolm P, El-Mahdi AM. Epidermal growth factor receptor: An independent predictor of survival in astrocytic tumors given definitive irradiation. Int J Radiat Oncol Biol Phys. 1996;34:809–815. doi: 10.1016/0360-3016(95)02184-1. [DOI] [PubMed] [Google Scholar]
- 18.Carpenter G. The biochemistry and physiology of the receptor-kinase for epidermal growth factor. Mol Cell Endocrinol. 1983;31:1–19. doi: 10.1016/0303-7207(83)90027-8. [DOI] [PubMed] [Google Scholar]
- 19.Barker FG, Simmons ML, Chang SM, Prados MD, Larson DA, Sneed PK, Wara WM, Berger MS, Chen P, Israel MA. EGFR overexpression and radiation response in glioblastoma multiforme. Int J Radiat Oncol Biol Phys. 2001;51:410–418. doi: 10.1016/s0360-3016(01)01609-1. [DOI] [PubMed] [Google Scholar]
- 20.Sok JC, Coppelli FM, Thomas SM, et al. Mutant epidermal growth factor receptor (EGFRvIII) contributes to head and neck cancer growth and resistance to EGFR targeting. Clin Cancer Res. 2006;12:5064–5073. doi: 10.1158/1078-0432.CCR-06-0913. [DOI] [PubMed] [Google Scholar]
- 21.Ekstrand AJ, Sugawa N, James CD, Collins VP. Amplified and rearranged epidermal growth factor receptor genes in human glioblastomas reveal deletions of sequences encoding portions of the N-and/or C-terminal tails. Proc Natl Acad Sci USA. 1992;89:4309–4313. doi: 10.1073/pnas.89.10.4309. [DOI] [PMC free article] [PubMed] [Google Scholar]
- 22.Li N, Nguyen HH, Byrom M, Ellington AD. Inhibition of cell proliferation by an anti-EGFR aptamer. PLoS One. 2011;6:e20299. doi: 10.1371/journal.pone.0020299. [DOI] [PMC free article] [PubMed] [Google Scholar]
- 23.Kökoğlu E, Sönmez H, Uslu E, Uslu I. Sialic acid levels in various types of cancer. Cancer Biochem Biophys. 1992;13:57–64. [PubMed] [Google Scholar]
- 24.Piro B, Reisberg S, Noel V, Pham MC. Investigations of the steric effect on electrochemical transduction in a quinone-based DNA sensor. Biosensors Bioelectron. 2007;22:3126–3131. doi: 10.1016/j.bios.2007.02.007. [DOI] [PubMed] [Google Scholar]
- 25.Iqbal SM, Akin D, Bashir R. Solid-state nanopore channels with DNA selectivity. Nat Nanotechnol. 2007;2:243–248. doi: 10.1038/nnano.2007.78. [DOI] [PubMed] [Google Scholar]
- 26.Sethian JA. A fast marching level set method for monotonically advancing fronts. Proc Natl Acad Sci USA. 1996;93:1591–1595. doi: 10.1073/pnas.93.4.1591. [DOI] [PMC free article] [PubMed] [Google Scholar]
- 27.Gil J, Kimmel R. Efficient dilation, erosion, opening, and closing algorithms. IEEE Trans Pattern Anal Mach Intell. 2002;24:1606–1617. [Google Scholar]
- 28.DHuttenlocher DP, Klanderman GA, Rucklidge WJ. Comparing images using the Hausdorff distance. IEEE Trans Pattern Anal Mach Intell. 1993;15:850–863. [Google Scholar]
- 29.Ananthakrishnan R, Ehrlicher A. The forces behind cell movement. Int J Biol Sci. 2007;3:303–317. doi: 10.7150/ijbs.3.303. [DOI] [PMC free article] [PubMed] [Google Scholar]
- 30.Cross SE, Jin YS, Rao J, Gimzewski JK. Nanomechanical analysis of cells from cancer patients. Nat Nanotechnol. 2007;2:780–783. doi: 10.1038/nnano.2007.388. [DOI] [PubMed] [Google Scholar]
- 31.Albrechtsen R, Nielsen M, Wewer U, Engvall E, Ruoslahti E. Basement membrane changes in breast cancer detected by immunohistochemical staining for laminin. Cancer Res. 1981;41:5076–5081. [PubMed] [Google Scholar]
Associated Data
This section collects any data citations, data availability statements, or supplementary materials included in this article.
Supplementary Materials
Supplementary Figure 1 Astrocyte cell and substrate interactions for both bare glass surface and non-specific anti-EGFR RNA aptamer-functionalized surface. The inset shows the variation of non-uniformity over time.
Supplementary Figure 2 Acridine orange (AO) fluorescence is measured at multiple steps of surface functionalization to compare the presence of the surface-bound oligonucleotides. Higher fluorescence intensity on RNA-hybridized surface shows the formation of RNA aptamer monolayer on the surface.
Supplementary Figure 3 A 5 × 5 mm2 glass chip with incubated cells. The scratch mark is for orientation and to ensure that the functionalized side of the glass remains on top all the time. The images taken in one step are stitched together to show the complete chip surface.