Abstract
Purpose
High-resolution images of glaucomatous damage to the retinal nerve fiber layer (RNFL) were obtained with an adaptive optics-scanning light ophthalmoscope (AO-SLO) and used as a basis for comparisons between en face slab images and thickness maps derived from optical coherence tomography (OCT) scans.
Methods
Wide-field (9 × 12 mm) cube scans were obtained with swept-source OCT (DRI-OCT) from six eyes of six patients. All eyes had a deep defect near fixation as seen on a 10-2 visual field test. Optical coherence tomography en face images, based on the average reflectance intensity, were generated (ATL 3D-Suite) from 52-μm slabs just below the vitreal border of the inner limiting membrane. The RNFL thickness maps were generated from the same OCT data. Both were compared with the AO-SLO peripapillary images that were previously obtained.
Results
On AO-SLO images, three eyes showed small regions of preserved and/or missing RNFL bundles within the affected region. Details in these regions were seen on the OCT en face images but not on the RNFL thickness maps. In addition, in the healthier hemi-retinas of two eyes, there were darker, arcuate-shaped regions on en face images that corresponded to abnormalities seen on AO-SLO. These were not seen on RNFL thickness maps.
Conclusions
Details of local glaucomatous damage, missing or easily overlooked on traditional OCT RNFL thickness analysis used in clinical OCT reports, were seen on OCT en face images based on the average reflectance intensity. While more work is needed, it is likely that en face slab imaging has a role in the clinical management of glaucoma.
Keywords: glaucoma, optical coherence tomography, en face imaging, retinal nerve fiber layer, adaptive optics
Details of glaucomatous damage seen with AO-SLO imaging are missed on the typically used retinal nerve fiber layer thickness maps of OCT cube scans. These details are better seen on en face images of the same OCT scans.
Spectral-domain optical coherence tomography (SDOCT) is routinely used to detect glaucomatous damage to the retinal nerve fiber layer (RNFL). For clinical use, circumpapillary images are obtained with circle scans and/or derived from cube (volume) scans of the disc. To detect glaucomatous damage, most commonly, the thickness of the circumpapillary RNFL (cpRNFL) is compared with values from healthy controls. Less commonly, analysis of RNFL thickness for clinical diagnosis includes the larger area of the peripapillary retina encompassed by the cube scan. Both approaches require accurate segmentation of the RNFL boundaries.
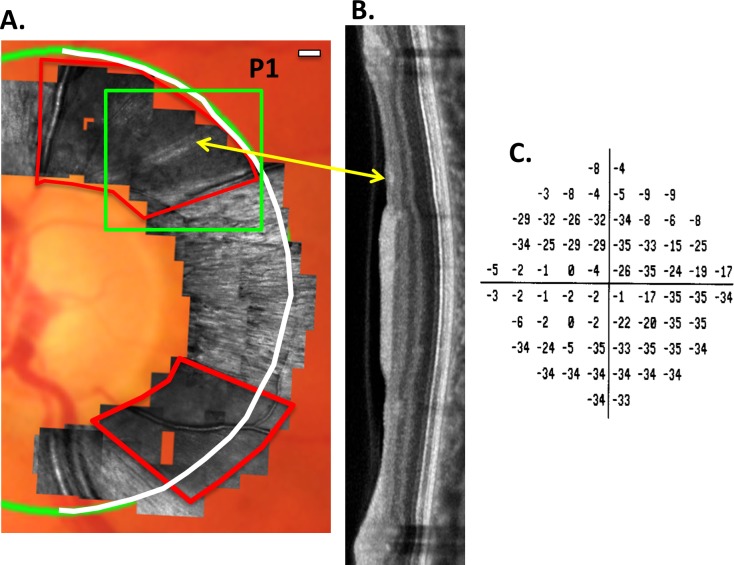
Although OCT scans provide valuable information about cpRNFL thickness, the lateral resolution of commercially available OCT instruments is limited to ∼15 to 20 μm. Adaptive optics applied to either OCT (AO-OCT) or to scanning laser ophthalmoscopy (AO-SLO) provide better lateral resolution and enable the visualization of individual axon bundles.1–7 These bundles are less reflective and/or missing from the RNFL in eyes with glaucoma.4–7 Recently, Hood et al.7 showed that locations with equally thinned cpRNFL, as measured with OCT, had different patterns of RNFL bundle loss when imaged with AO-SLO. For example, in some patients, these regions were devoid of RNFL bundles, whereas in others, bundles were present. Figure 1 provides an example from their study. In Figure 1A, a montage of AO-SLO images is superimposed on a fundus photograph. Two regions of abnormal RNFL bundles can be seen within the red borders. The abnormal region in the inferior disc appears totally devoid of bundles. On the other hand, in the superior region, there are two bundles (yellow arrow) within a region that otherwise appears devoid of bundles. Interestingly, the corresponding region on the OCT image (yellow arrow in Fig. 1B) appears more reflective (i.e., more intense). Of course, without the AO-SLO images, this small variation in reflectivity on the OCT would be difficult to interpret. In any case, there are local variations in reflectance intensity in regions of the OCT scan with approximately the same RNFL thickness.
Figure 1.
(A) For patient P1, AO-SLO images superimposed on a fundus photograph. The regions within the red borders are largely devoid of RNFL bundles. The green rectangle encompasses a region shown as an en face image in Figure 3A. (B) The temporal half (white semicircle in [A]) of an SDOCT circumpapillary scan. The yellow arrow indicates the region corresponding to the preserved RNFL bundles seen in (A). (C) The 10-2 total deviation plot for this eye. Modified from Figures 2 and 3 in Reference 7.
There is evidence from studies of humans, as well as of animal models, that glaucomatous damage can affect RNFL reflectivity, as well as RNFL thickness (Fortune B, et al. IOVS 2014;55:ARVO E-Abstract 2644 and Refs. 7–11). In a nonhuman primate model, Fortune et al. (Fortune B, et al. IOVS 2014;55:ARVO E-Abstract 2644 and Refs. 12–14) demonstrated that thickness and reflectivity carry different information and that OCT en face imaging can be used to detect these differences (Fortune B, et al. IOVS 2014;55:ARVO E-Abstract 2644). In humans, Van der Schoot et al.9 and Vermeer et al.10 developed en face image maps based on the RNFL reflectance intensity normalized to the RPE reflectance intensity. They suggested that these RNFL attenuation coefficient maps were superior to the familiar two-dimensional map of RNFL thickness. In fact, their results are consistent with the hypothesis that the internal structure of RNFL axon bundles is altered in glaucoma and, as a consequence, so too are the optical (scattering) properties.8,11 However, as they pointed out, their method requires accurate determination of the boundaries of both the RNFL and RPE layers. In practice, this can create a problem as the automated algorithms designed to accomplish this task often make errors.
To compare the details of local glaucomatous damage seen on OCT en face images to those seen on OCT RNFL thickness maps, we analyzed wide-field, swept-source (ss)OCT scans of patients for whom peripapillary AO-SLO images,7 as in Figure 1A, were available. In particular, following Fortune et al. (Fortune B, et al. IOVS 2014;55:ARVO E-Abstract 2644), we derived projection images by averaging the reflectance intensity of a fixed axial portion of each A-scan, thus creating an image of a “slab” with fixed thickness below the vitreous/inner limiting membrane (V/ILM). The V/ILM boundary segmented by automated algorithms shows the best precision, as well as best agreement with human experts, compared with the other segmented boundaries.15,16 We found that there were local variations in RNFL bundles present on AO-SLO images (e.g., the preserved bundles in the superior disc in Fig. 1A) that could be seen with OCT en face imaging. These details were not seen with typical RNFL thickness maps.
Methods
Patients
Six eyes from six patients, previously studied with AO-SLO, were included.6,7 These eyes had deep arcuate defects in the macula (five points ≤ −15 db on the total deviation plot of the 10-2 visual field [VF]), marked RNFL thinning on cpRNFL thickness plots from SDOCT circumpapillary scans, and abnormal and/or missing RNFL bundles on AO-SLO images. The AO-SLO images were obtained with a custom-built instrument17 and then montaged to obtain an image such as the one shown in Figure 1A.6,7 The patients' identification numbers used here correspond to those in Reference 7.
En Face Analysis of ssOCT Scans
Wide-field (9 × 12 mm) cube scans consisting of 256 B-scans, each with 512 A-scans, were obtained with ssOCT (DRI-OCT; Topcon, Inc., Tokyo, Japan). These scans were used to create maps of RNFL thickness, as well as en face projection images based on reflectance intensity. The latter was generated using special purpose software (ATL 3D-Suite; Fortune B, et al. IOVS 2014;55:ARVO E-Abstract 2644), which is capable of producing en face images in a variety of analysis modes. Slabs through the volume can be defined on the basis of either one or two segmented boundaries. In the first case, a slab can have a fixed thickness, and its axial depth can be defined relative to a reference plane based on a single specific boundary, such as 20 pixels starting at the V/ILM boundary. Alternatively, a slab can be defined by two segmented boundaries such as from the V/ILM to the proximal RNFL boundary. In the latter case, the slab is not constrained to uniform thickness. The axial information at each pixel of the slab can be projected to form the en face image as either the summed voxel projection (SVP), the average voxel projection (AVP), or the maximum intensity projection (MIP). The SVP and MIP images require some form of mapping the intensity values to image space (γ function) that can vary from eye to eye or day to day, whereas the γ function can be fixed across all eyes and scans for AVP images. Therefore, in this study, we obtained AVP en face images for the RNFL and for slabs with a fixed thickness of 52 μm (20 voxels) that were referenced to the V/ILM boundary. The slab thickness of 52 μm was chosen to be small enough to be affected by local differences in reflectance intensity but large enough to benefit from increased signal to noise from averaging over a greater number of voxels. Note that a thickness of 52 μm is larger than the minimum RNFL thickness seen in patients, which is 20 to 30 μm in regions of deep glaucomatous defects. Thus, in regions with a RNFL thickness of less than 52 μm, the slab will include the retinal ganglion cell (RGC) layer and inner plexiform layer, which are hypo-reflective relative to the RNFL. That is, the 52-μm slab incorporates information about both the thickness and reflectance of the RNFL of local regions.
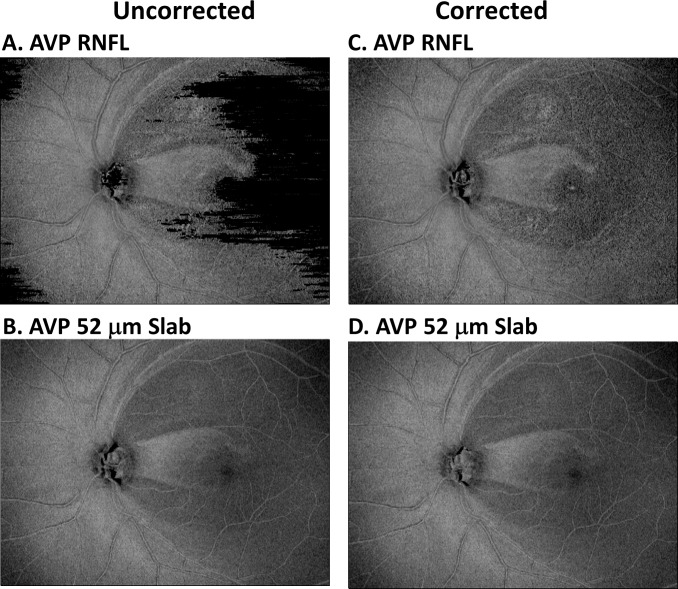
Figure 2 shows images for AVP RNFL (Figs. 2A, 2C) and the AVP 52-μm slab (Figs. 2B, 2D) for the eye whose data are shown in Figure 1. The images on the left were created using the V/ILM and the proximal RNFL boundaries determined by the OCT machines automated algorithm, whereas those on the right were derived after these boundaries were manually corrected. Notice that the appearance of the images for the corrected and uncorrected boundaries was very similar for the AVP 52-μm slab, but markedly difference for the AVP RNFL. This is due to the fact that the automated algorithm is more reliable for the V/ILM boundary than it is for the proximal RNFL boundary.15,16 For all eyes studied, the details seen on the corrected versions of both the RNFL and 52-μm slab images were similar. Thus, in the interest of making en face imaging clinically useful, the uncorrected AVP 52-μm slab images are used throughout the paper. Except for Figure 7D, all images are shown in retinal view.
Figure 2.
(A, C) For patient P1, the en face image of the AVP for the RNFL region. (B, D) The en face image of the AVP for a region (slab) between the ILM and 52 μm below the ILM. The images in (A, B) were derived using the RNFL boundaries determined by the machine's automated algorithm, whereas for (C, D), the boundaries were manually corrected.
Figure 7.
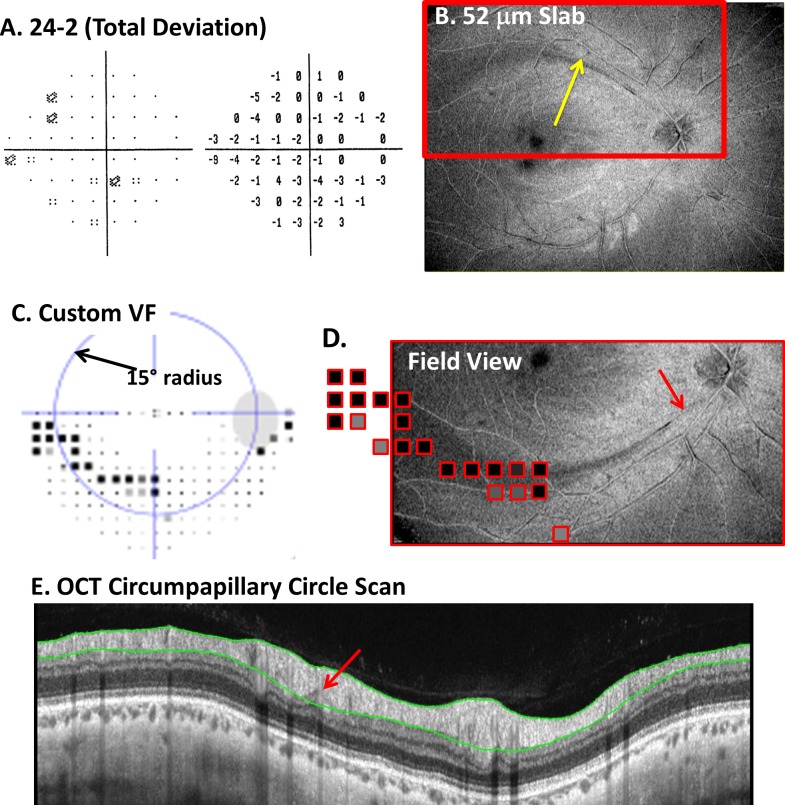
(A) The 24-2 total deviation plot. (B) The AVP 52-μm slab image with an arcuate darkening (yellow arrow) in the superior retina. (C) A custom VF obtained with the same spacing and stimulus size as the 10-2 VF pattern. The dark squares indicate abnormal regions. (D) A portion of the en face image from (B) with the abnormal VF points from (C) superimposed. (E) The SDOCT circumpapillary circle scan with a red arrow showing the location of a possible thinned region associated with the defect.
Results
Local Variations in RNFL Bundles Can Be Seen on OCT En Face Images
For the eye of patient P1, Figure 1 shows the AO-SLO images (A); the SDOCT circumpapillary scan (B) for the semicircle in white; and the total deviation (TD) plot of the 10-2 VF (C). This eye had deep defects in both the upper and lower hemi-fields of the 10-2 VF total deviation plot (Fig. 1C). The other five eyes had deep defects only in the upper VF (inferior disc).7
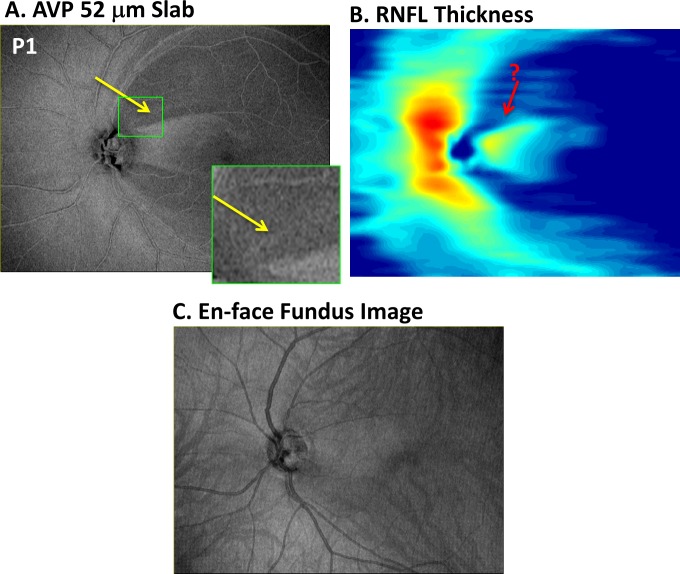
Because we were interested to determine whether local variations seen on AO-SLO images could be discerned on the en face images, we focused first on the three hemi-retinas with deep VF defects that showed clear local variations in the appearance of the remaining bundles. In all three of those eyes, aspects of these local AO-SLO variations were seen on OCT en face AVP images. In the case of P1, there is a local preservation of bundles seen on AO-SLO in the superior disc (yellow arrow in Fig. 1A). In the OCT en face AVP slab image for this eye (Fig. 3A), this region appears as a thin arcuate band of higher intensity (yellow arrow) compared with the neighboring regions. An enlarged image of the region associated with the green rectangle in Figure 1A is shown as the inset in Figure 3A. As discussed below, the preserved bundles are less clear on the conventional RNFL thickness map (Fig. 3B) derived from the uncorrected segmentations or on the en face “fundus” image (Fig. 3C) created by summing the voxel projection from the full axial depth of the OCT volume, as done by several commercially available OCT instruments.
Figure 3.
(A) For patient P1, the en face image of the AVP 52-μm slab as in Figure 2B. The region within the small green rectangle corresponds to that within the green rectangle of Figure 1A and is shown enlarged in the inset in (A). (B) Pseudo-color thickness map of the RNFL. (C) En face SVP of the entire OCT image.
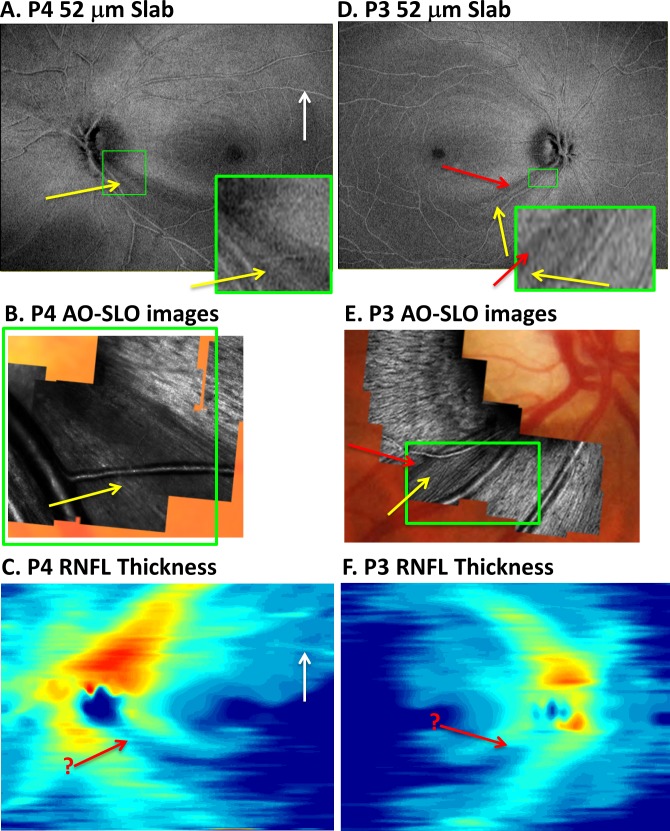
Patient P4 provides the second example (Figs. 4A–C). Again the yellow arrow on the OCT slab en face image (Fig. 4A) indicates the presence of an arcuate region associated with the preserved bundles seen in the corresponding region of the AO-SLO image (Fig. 4B). A portion of the OCT en face image is enlarged (the region associated with the green rectangle in Fig. 4B) and shown as the inset in Figure 4A. Notice the correspondence between Figures 4A (inset) and 4B.
Figure 4.
(A–C) For patient P4, the AVP 52-μm slab image (A), AO-SLO images (B), and RNFL thickness map (C) are shown in retinal view. The region of abnormal-appearing RNFL bundles on AO-SLO (yellow arrow in [B]) within a region of missing RNFL bundles can be identified in (A) (yellow arrow) but not (C) (red arrow in same location). (D–F) For patient P3, the AVP 52-μm slab image (D), AO-SLO images (E), and RNFL thickness map (F). There is a region of missing RNFL bundles on AO-SLO (red arrow in [E]) within a region of abnormal RNFL bundles (yellow arrow in [E]), and some of these details appear in the AVP 52-μm slab image (D). These variations are clearer in the green-bordered insets of approximately the same magnification.
Finally, in the case of patient P3 (Figs. 4D–F), the region that appeared abnormal on the AO-SLO images in Figure 4E included a region of bundles with low contrast (yellow arrow) and a region with a few bundles missing (red arrow). This narrow region of missing bundles appears as a dark band on the OCT en face 52-μm slab image (Fig. 4D, red arrow). Of course, the AO-SLO images have superior lateral resolution as expected. This is illustrated by the inset in Figure 4D, which has approximately the same magnification as the AO-SLO images within the green borders of Figure 4E. Once again, notice the correspondence between the regions within the green rectangle in Figures 4D and 4E.
Thus far, the results demonstrate that at least some of the details within abnormal regions identified on AO-SLO can be seen on OCT en face images. This suggests that en face images may reveal subtle local damage associated with mild glaucomatous damage. To test this hypothesis, we examined the other five hemi-fields (five eyes) without deep arcuate damage from the same total set of six patients.
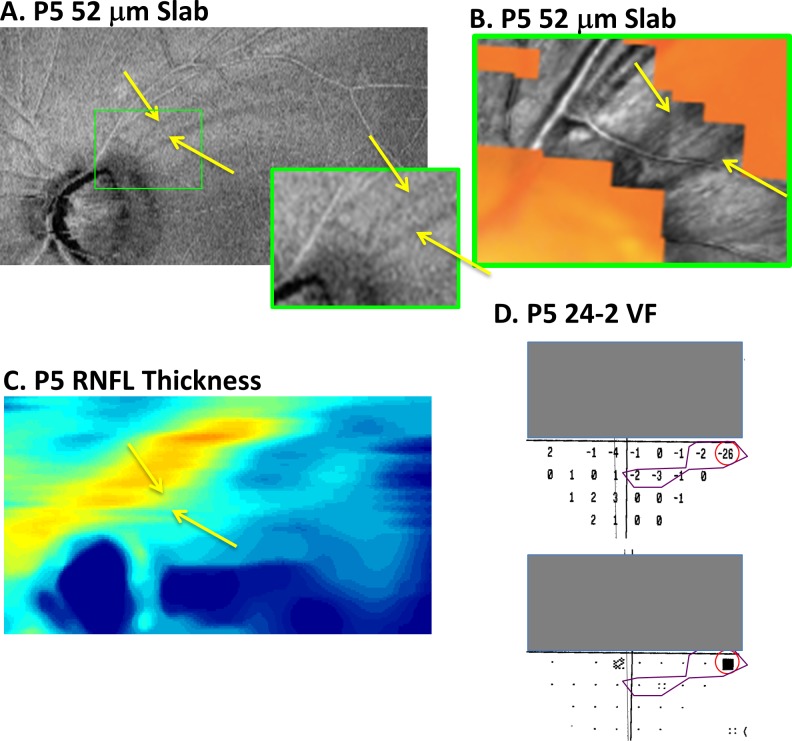
In the healthier, superior retina (lower VF) of two of these eyes, local variations in the reflectance of the RNFL bundles were seen on AO-SLO. In both of these eyes, dark arcuate-shaped regions could be seen on the OCT en face images, as shown in Figures 5 and 6. In the case of patient P5, there are two clear dark arcuate defects on the 52-μm slab image (yellow arrows in Fig. 5A). (Only a portion of the OCT en face image is shown so it could be enlarged.) The dark bands in Figure 5A correspond topographically to the darker regions on the AO-SLO image (yellow arrows in Fig. 5B). This correspondence is easier to see in the inset of Figure 5A, which shows the region encompassed by the AO-SLO images. The total deviation plots of the 24-2 VF for this eye are shown in Figure 5D. Interestingly, the only statistically abnormal point in the lower 24-2 VF (Fig. 5D) consistent with the spatial topography of these RNFL defects is the nasal most point with the TD value of −26 dB (red circle). Although not reaching statistical significance, the region with TD values of −2 and −3 dB (within purple border) may also be related.
Figure 5.
(A, B) For patient P5, a portion of the AVP 52-μm slab image (A) and AO-SLO images (B) are shown in retinal view. The dark arcuate regions on the en face slab image (yellows arrows in [A]) are associated with darker regions indicated by the yellow arrows on the AO-SLO (B). (C) The RNFL thickness map does not show the details seen in the en face images of the same region in (A). (D) On the 24-2 VF, the locations within the red circle and purple borders show regions with abnormal (red) and borderline abnormal (purple) total deviation values.
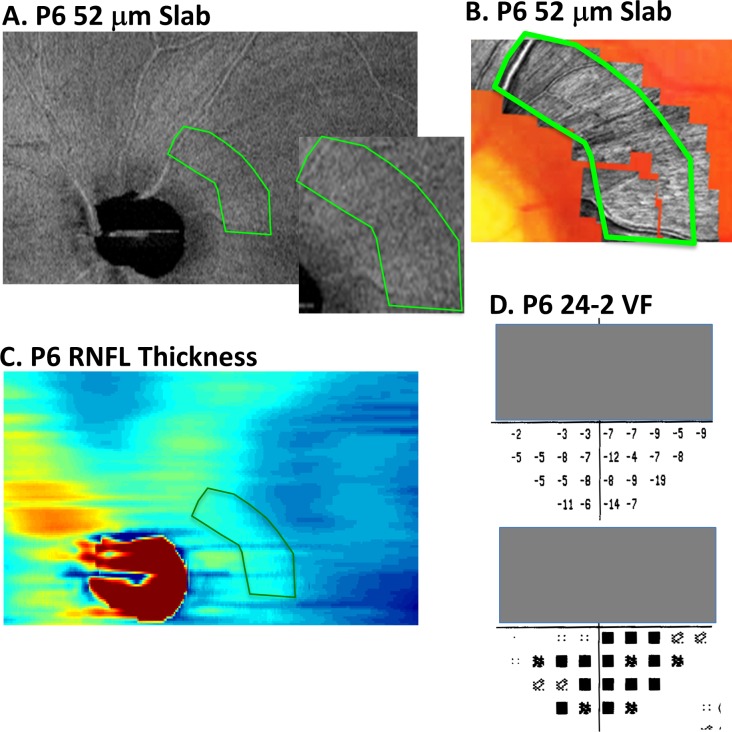
Figure 6.
(A, B) For patient P6, a portion of the AVP 52-μm slab image (A) and AO-SLO images (B) are shown in retinal view. The dark raked appearance on the en face slab image (within green borders in [A]) is associated with darker regions within the green borders on the AO-SLO (B). (C) The RNFL thickness map does not show the details seen in the en face images of the same region in (A). (D) On the 24-2 VF, the TD values suggest diffuse damage.
The second example, patient P6, shows a number of subtle arcuate defects in the OCT en-face image (Fig. 6A), which have been referred to as having a “raked appearance.”18 As in Figure 5A, only a portion of the en face image is shown. The AO-SLO images in Figure 6B are from the region within green border in Figure 6A. These images also show local variations. On the other hand, the 24-2 TD plots (Fig. 6D) suggest diffuse damage, as seen by the negative values in the lower VF. It is likely that both diffuse and local damage are involved. However, the point here is that the en face images reveal details missed on both the 24-2 VF and, as discussed below, on the OCT RNFL thickness map.
Comparison of OCT En Face Images to Traditional RNFL Thickness Maps
The details of local glaucomatous damage are better visualized on the OCT en face images than on the traditional RNFL thickness maps. First, consider the RNFL thickness maps in Figures 3B, 4C, and 4F for the hemi-fields with deep defects. The edges of the abnormal regions on the en face images are sharper and clearer. In addition, the local variations associated with glaucomatous damage are difficult to discern on the traditional RNFL thickness maps, where the location of local details identified with AO-SLO are indicated with the red arrow with a “?.” Finally, even if present, the variations in thickness would be hard to distinguish from blood vessels on the thickness maps. The white arrow in Figure 4C shows an example of a local variation in thickness due to a blood vessel, which could be confused for local RNF bundle preservation. On the en face AVP image (Fig. 4A), it is easier to see that this is a blood vessel.
Similarly, the local defects seen in the better hemi-retina were difficult to identify with confidence on the RNFL thickness maps. For example, the arcuate defects seen in Figures 5A (yellow arrows) and 6A are not obvious on the RNFL thickness map in Figures 5C and 6C.
Discussion
Commercial OCT reports designed for the clinician typically rely on RNFL thickness measurements. We derived en face slab images from wide-field ssOCT scans to compare the details of local glaucomatous damage seen on these images to those seen on RNFL thickness maps. The details of glaucomatous damage seen on AO-SLO images were used as the reference. Although AO-SLO lacks the axial resolution of OCT, it has superior lateral resolution.
The OCT en face images showed details of RNFL abnormalities that were difficult, if not impossible, to see with traditional RNFL thickness analysis. For example, the details indicated by the yellow and red arrows in Figures 3 through 5 could not be seen on the RNFL thickness maps, although they were confirmed on AO-SLO.
There are a several reasons for the superior performance of the OCT en face image. First, the RNFL thickness map depends on computer segmentation algorithms to identify layer boundaries. These algorithms include local spatial averaging, which acts as a low-pass filter and results in a loss of spatial detail. Second, blood vessels are easier to distinguish from local intact bundles of the RNFL based on morphology evident in OCT en face images but not in thickness maps. Third, abnormal regions of RNFL can vary in reflectance intensity and thickness (Fortune B, et al. IOVS 2014;55:ARVO E-Abstract 2644 and Ref. 7). Unlike RNFL thickness measures, OCT en face images of reflectance intensity are affected by both abnormalities. Fourth, the automated segmentation algorithms used by commercial OCT instruments to obtain the RNFL thickness maps are often erroneous. The en face slab of fixed depth used here only depends on identifying the border between the vitreous and the ILM, the easiest border for automated algorithms to identify reliably.15,16 In our experience, errors in accurately identifying the proximal RNFL boundary (between the RNFL and the RGC layer) are more likely to occur and are more difficult to identify.
The en face results also put our previous AO-SLO versus OCT comparisons in perspective. In Hood et al.,7 we compared peripapillary AO-SLO images to OCT circumpapillary circle scans. We noted that regions with an equal, but abnormally thin RNFL showed subtle variations in reflective intensity. These subtle variations appeared to correspond to local variations seen on AO-SLO. However, we pointed out that these local variations were not easy to identify with confidence, even on high-quality OCT circle scans. This is illustrated for patient P1 in Figure 1B, as well as in Figures 3 through 6 in Reference 7 for other eyes. We speculated that advances in OCT technology and/or analysis should allow these details to be appreciated. It turns out that en face slab analysis is one such analysis, whereas RNFL thickness analysis will miss these local variations in intensity for the reasons given above.
Potential Clinical Utility
Many, if not all, the commercial machines have, or will shortly have, the ability to do produce en face slab images. These OCT en face slab images may help the clinician detect and/or confirm early, local defects seen in some eyes. A patient recently tested at Columbia University illustrates the potential use of en face imaging. The patient's 24-2 VF (Fig. 7A) was unremarkable. The mean deviation (MD) and glaucoma hemi-field test (GHT) were within normal limits, and the VF was normal based on cluster criteria. Only the PSD fell outside normal limits (P < 5%). The OCT en face image, however, showed a clear arcuate defect in the superior retina (yellow arrow in Fig. 7B). Figure 7C shows the results of a custom VF (Octopus 900; Haag-Streit AG, Koeniz, Switzerland) performed using the test spot (size III) and spacing (2° grid) of the 10-2 VF test. There is an arcuate VF defect that corresponds to the location of the arcuate in Figure 7B. This is easier to see in Figure 7D where the portions of the en face image in Figure 7B (red rectangle) is presented in field view with the abnormal VF points from Figure 7C superimposed.
Interestingly, a small local abnormality can be observed on the OCT circumpapillary scan of this eye (Fig. 7E). The red arrow in Figure 7E indicates a hypo-reflective region in the location corresponding to the point marked by the red arrow in Figure 7D. Notice that the automated segmentation algorithm includes this small local deviation within the RNFL thickness. Thus, the commercial cpRNFL analysis and RNFL significance map missed this defect because of its limited depth and spatial extent. However, in fairness, it should be pointed out that circular scans with diameters larger than the standard 3.45-mm scan, which are available on some commercial machines, may improve detection of defects like this one.
Caveats and Limitations
First, only six eyes were studied in this proof of concept study. These six were not selected to illustrate our point, but included all the eyes in our previously published study comparing OCT circle scans to AO-SLO images. Further, the finding that details visible with en face analysis are missing from RNFL thickness maps makes sense from a theoretical view as explained above. In any case, to better understand the limits of en face analysis, a larger sample of patients with a wide range of damage should be studied.
Second, we are not suggesting that RNFL thickness analysis should be replaced with analysis of reflectance intensity in OCT en face images. For now, we consider the information available in OCT projection images (such as the fixed-thickness 52-μm slab AVP images used here) to be complementary. In fact, for detecting early glaucomatous damage, it is clear that a combination of RNFL and RGC layer thickness analyses from OCT cube scans of the disc and macula and VFs does very well.19,20 However, current analyses based only on thickness may miss very small (thin) defects, which can be seen on en face AVP images. On the other hand, early diffuse damage will be missed on the en face slab images. In fact, diffuse damage will be missed unless the local RNFL thickness is reduced to less than the thickness of the slab used and/or the reflectance intensity of the RNFL is reduced secondary to damage. However, the SVP mode of creating en face slab images, like RNFL thickness, will often be more sensitive to diffuse loss than the AVP mode.
In general, future studies need to address the sensitivity and specificity of methods based on both AVP and SVP en face images versus those based on RNFL thickness maps. These studies should include evaluation by masked graders of a wide range of images from healthy eyes to eyes with moderate glaucoma, with the latter including both local and diffuse damage.
The en face analysis used here can undoubtedly be improved. First, we did not optimize either the axial depth of the slab or its thickness, although given the variation in RNFL thickness and reflectance intensity of glaucomatous defects, no single slab thickness or depth will be optimal for examining all defects. Second, in this study, we focused on the average intensity (AVP). There are advantages and disadvantages to other projection modes (e.g., SVP and MIP), as well as alternative definitions of a slab (e.g., RNFL or fixed thickness). For example, because the AVP images are based on the average reflectance intensity within a slab/layer, they can miss information about the thickness of the RNFL. (Compare the variations in thickness seen in Fig. 6C to the en face image in Fig. 6A.) On the other hand, the SVP of the RNFL will supply information about RNFL thickness as it represents the sum of the reflectance intensity over the full depth of the segmented RNFL while at the same time making it easier to identify blood vessels. The relative tradeoffs between these approaches are the subject of another planned study. Third, probability maps, analogous to those for thickness measures, should be generated so the en face data can be compared with thickness and VF data on a similar (z-score) scale. In addition, it is worth noting that the parameters of the ssOCT scan were not optimized for this analysis. The ssOCT protocol was part of an earlier study. Thus, modifications in the scan parameters (e.g., number of A- and B-scans) may also improve the images.
Finally, no technique is perfect. Thus, a large group of healthy controls, as well as patients with a range of defects, needs to be examined to understand the nature of artifacts and false positives inherent in OCT en face imaging.
Summary
The OCT en face images contain information about local glaucomatous damage that is missing or overlooked with traditional OCT RNFL thickness analysis. Although more work is needed, it is likely that OCT en face images, as described here, have a role in the clinic.
Acknowledgments
Supported by National Institute of Health Grants EY-02115 (DCH) and P30 EY001931 (AD) and grants from Jane Banks Research Fund of the New York Glaucoma Research Institute (RR), Marrus Family Foundation (RBR), Chairman's Research Fund of the New York Eye and Ear Infirmary (RBR), and the Glaucoma Research Foundation (AD).
Disclosure: D.C. Hood, Topcon, Inc. (F, C); B. Fortune, None; M.A. Mavrommatis, None; J. Reynaud, None; R. Ramachandran, None; R. Ritch, None; R.B. Rosen, None; H. Muhammad, None; A. Dubra, Canon USA (F), P; T.Y.P. Chui, None
References
- 1. Kocaoglu OP,, Cense B,, Jonnal RS,, et al. Imaging retinal nerve fiber bundles using optical coherence tomography with adaptive optics. Vis Res. 2011. ; 51: 1835–1844. [DOI] [PMC free article] [PubMed] [Google Scholar]
- 2. Takayama K,, Ooto S,, Hangai M,, et al. High-resolution imaging of the retinal nerve fiber layer in normal eyes using adaptive optics scanning laser ophthalmoscopy. PLoS One. 2012. ; 7: e33158. [DOI] [PMC free article] [PubMed] [Google Scholar]
- 3. Huang G,, Gast TJ,, Burns SA. In vivo adaptive optics imaging of the temporal raphe and its relationship to the optic disc and fovea in the human retina. Invest Ophthalmol Vis Sci. 2014. ; 55: 5952–5961. [DOI] [PMC free article] [PubMed] [Google Scholar]
- 4. Takayama K,, Ooto S,, Hangai M,, et al. High-resolution imaging of retinal nerve fiber bundles in glaucoma using adaptive optics scanning laser ophthalmoscopy. Am J Ophthalmol. 2013. ; 155: 870–881. [DOI] [PubMed] [Google Scholar]
- 5. Scoles D,, Higgins BP,, Cooper RF,, et al. Microscopic inner retinal hyper-reflective phenotypes in retinal and neurologic disease. Invest Ophthalmol Vis Sci. 2014. ; 55: 4015–4029. [DOI] [PMC free article] [PubMed] [Google Scholar]
- 6. Chen MF,, Chui TY,, Alhadeff P,, et al. Adaptive optics imaging of healthy and abnormal regions of retinal nerve fiber bundles of patients with glaucoma. Invest Ophthalmol Vis Sci. 2015. ; 56: 674–681. [DOI] [PMC free article] [PubMed] [Google Scholar]
- 7. Hood DC,, Chen MF,, Lee D,, et al. Confocal adaptive optics imaging of peripapillary nerve fiber bundles: implications for glaucomatous damage. Transl Vis Sci Technol. 2015; 4 (2): 12. [DOI] [PMC free article] [PubMed] [Google Scholar]
- 8. Huang XR,, Zhou Y,, Kong W,, Knighton RW. Reflectance decreases before thickness changes in the retinal nerve fiber layer in glaucomatous retinas. Invest Ophthalmol Vis Sci. 2011. ; 52: 6737–6742. [DOI] [PMC free article] [PubMed] [Google Scholar]
- 9. van der Schoot J,, Vermeer KA,, de Boer JF,, Lemij HG. The effect of glaucoma on the optical attenuation coefficient of the retinal nerve fiber layer in spectral domain optical coherence tomography images. Invest Ophthalmol Vis Sci. 2012. ; 53: 2424–2430. [DOI] [PubMed] [Google Scholar]
- 10. Vermeer KA,, van der Schoot J,, Lemij HG,, de Boer JF. RPE-normalized RNFL attenuation coefficient maps derived from volumetric OCT imaging for glaucoma assessment. Invest Ophthalmol Vis Sci. 2012. ; 53: 6102–6108. [DOI] [PubMed] [Google Scholar]
- 11. Huang XR,, Knighton RW,, Cavuoto LN. Microtubule contribution to the reflectance of the retinal nerve fiber layer. Invest Ophthalmol Vis Sci. 2006. ; 47: 5363–5367. [DOI] [PubMed] [Google Scholar]
- 12. Fortune B,, Burgoyne CF,, Cull GA,, Reynaud J,, Wang L. Structural and functional abnormalities of retinal ganglion cells measured in vivo at the onset of optic nerve head surface change in experimental glaucoma. Invest Ophthalmol Vis Sci. 2012. ; 53: 3939–3950. [DOI] [PMC free article] [PubMed] [Google Scholar]
- 13. Fortune B,, Cull GA,, Burgoyne CF. Relative course of retinal nerve fiber layer birefringence and thickness and retinal function changes after optic nerve transection. Invest Ophthalmol Vis Sci. 2008. ; 49: 4444–4452. [DOI] [PMC free article] [PubMed] [Google Scholar]
- 14. Fortune B,, Burgoyne CF,, Cull G,, Reynaud J,, Wang L. Onset and progression of peripapillary retinal nerve fiber layer (RNFL) retardance changes occur earlier than RNFL thickness changes in experimental glaucoma. Invest Ophthalmol Vis Sci. 2013. ; 54: 5653–5661. [DOI] [PMC free article] [PubMed] [Google Scholar]
- 15. Garvin MK,, Abramoff MD,, Kardon R,, et al. Intraretinal layer segmentation of macular optical coherence tomography images using optimal 3-D graph search. IEEE Trans Med Imaging. 2008; 27: 1495–1505. [DOI] [PMC free article] [PubMed] [Google Scholar]
- 16. Yang Q,, Reisman CA,, Wang Z,, et al. Automated layer segmentation of macular OCT images using dual-scale gradient information. Opt Exp. 2010; 18: 21293–21307. [DOI] [PMC free article] [PubMed] [Google Scholar]
- 17. Dubra A,, Sulai Y. Reflective afocal broadband adaptive optics scanning ophthalmoscope. Biomed Opt Express. 2011. ; 2: 1757–1768. [DOI] [PMC free article] [PubMed] [Google Scholar]
- 18. Hoyt WF,, Frisen L,, Newman NM. Fundoscopy of nerve fiber layer defects in glaucoma. Invest Ophthalmol Vis Sci. 1973. ; 12: 814–829. [PubMed] [Google Scholar]
- 19. Hood DC,, Raza AS. On improving the use of OCT imaging for detecting glaucomatous damage. Brit J Ophthalmol. 2014. ; 98(suppl 2): ii1–ii9. [DOI] [PMC free article] [PubMed] [Google Scholar]
- 20. Hood DC,, Raza AS,, De Moraes CG,, et al. Evaluation of a one-page report to aid in detecting glaucomatous damage. Transl Vis Sci Technol. 2014; 3 (6): 8. [DOI] [PMC free article] [PubMed] [Google Scholar]


