

Abstract
Objective
To investigate the impact of transient (2-4 h) hypoxia on metabolic reprogramming of adipocytes.
Methods
The impact of transient hypoxia on metabolic reprogramming was investigated in 3T3-L1 cells before and after differentiation. Glucose uptake, fatty acid oxidation, lipolysis, and mitochondria were examined to determine the hypoxia effects. Preadipocytes were exposed to transient hypoxia (4h/day) in the course of differentiation. Insulin sensitivity and TG accumulation was examined in the cells at the end of differentiation to determine the reprogramming effects. AMPK activity and gene expression were determined by quantitative RT-PCR and Western blotting in search for mechanism of the reprogramming.
Results
In acute response to hypoxia, adipocytes exhibited an increase in insulin-dependent and -independent glucose uptake. Fatty acid β-oxidation and pyruvate dehydrogenase (PDH) activity were decreased. Multiple exposures of differentiating adipocytes to transient hypoxia enhanced insulin signaling, TG accumulation, expression of antioxidant genes in differentiated adipocytes in the absence of hypoxia. The metabolic memory was associated with elevated AMPK activity and gene expression (GLUT1, PGC-1α, PPARγ, SREBP, NRF-1, ESRRα, LPL). The enhanced insulin sensitivity was blocked by an AMPK inhibitor.
Conclusions
Repeated exposure of differentiating adipocytes to transient hypoxia is able to reprogram the cells for increased TG accumulation and enhanced insulin sensitivity. The metabolic alterations were observed in post-differentiated cells under normoxia. The reprogramming involves AMPK activation and gene expression in the metabolic pathways in cytosol and mitochondria.
Keywords: Reprogramming, adipocytes, hypoxia, insulin sensitivity
Introduction
Hypoxia exists in white adipose tissue of obese patients and rodents, and represents a mechanism for adipose tissue dysfunction although hyperoxia is also reported in obesity 1, 2,3. Hypoxia induces leptin expression 4-6, inhibits adiponectin expression 7, 8, activates macrophages or lymphocytes to express pro-inflammatory cytokines 7, 9 and triggers adipocyte death 10. Adipose tissue hypoxia has drawn more attention in the study of metabolic disorders in obesity 2, 11, 12. At the cellular level, hypoxia has many activities in the regulation of metabolism such as stimulation of glycolysis and inhibition of mitochondrial function. In adipocytes, persistent hypoxia (>8h exposure) inhibits insulin-induced glucose uptake and promotes lipolysis 10, 13, which correlates to inhibition of adipocyte differentiation 14, 15. These studies suggest that persistent hypoxia inhibits adipose tissue function through a negative impact on the endocrine and storage functions of adipocytes.
Although persistent hypoxia has been extensively studied in adipocytes, there is little information about impact of transient hypoxia (2-4 h) on adipocytes. During adipose tissue expansion, transient hypoxia may occur as a result of temporary disbalance of oxygen supply and consumption in the early phase of tissue expansion, which may precede the persistent hypoxia by years. The hypoxia is a result of either reduced blood supply or increased oxygen demand in adipose tissue 16, 17, which reflects a disbalance between cells and the extracellular matrix during tissue growth. The balance is usually restored after local adaptation of the blood vessel function to the growing tissue. The transient hypoxia may occur frequently during adipose tissue expansion in obesity. The impact of transient hypoxia on adipocytes and preadipocytes remains unknown in adipose tissue. Current study was designed to address this issue.
In this study, we examined metabolic responses of adipocytes and preadipocytes to transient hypoxia. Single and multiple exposures to hypoxia were applied to the cells to understand the acute and chronic impact in metabolism. The results suggest that preadipocytes may remember the hypoxia effect through a reprogramming process for enhanced insulin sensitivity and TG accumulation.
METHODS
Reagents
3-isobutyl-1-methylxanthine (IBMX, I5879), dexamethasone (D8893), human insulin solution (I9278), antibody to hypoxia-inducible factor (HIF-1α, H6536) and sodium sulfite (Na2SO3, S0505) were obtained from Sigma-Aldrich. Antibodies against glucose transporter 1 (Glut1; ab652), glucose transporter 4 (Glut4; ab654), Akt (ab8805), S6K (ab9366), phosphorylated Akt Thr308 (pAkt, ab38449), phosphorylated pyruvate dehydrogenase E1 Ser293 (pPDHE1, ab92696), and β-actin (ab6276) were obtained from Abcam (Cambridge, UK). Antibodies to pyruvate dehydrogenase E1 (PDHE1, sc-65242), insulin receptor β (IRβ, sc-711), insulin receptor substrate-1 (IRS-1, sc-7200), GSK-3β (sc-7291), SREBP1 (sc-13551) and phosphorylated GSK3β (pGSK3β; sc-11757-R) were obtained from Santa Cruz Biotechnology (Santa Cruz, CA). Antibody to phosphorylated AktSer473 was purchased from Calbiochem (Gibbstown, NJ). Antibodies to AMPK (#2603), phosphorylated AMPKα (Thr172, pAMPK, #2535), and phosphorylated acetyl CoA carboxylase (pACC, #3661) were purchased from Cell Signaling (Beverly, MA). Antibody to phosphorylated IRS-1 Ser-307 (28863) was purchased from Upstate Biotechnology (Canastota, NY). PPARγ (MAB3872) antibody was from EMD Millipore (Billerica, MA, USA).
Cell culture and adipocytes differentiation
3T3-L1 preadipocytes were purchased from the American Type Culture Collection (ATCC, Manassas, VA) and maintained in Dulbecco’s modified Eagle’s medium (DMEM) supplemented with 10% fetal calf serum. Two days after confluence, 3T3-L1 cells were induced to differentiation using the standard adipogenic cocktail (0.5mM IBMX, 1μM dexamethasone and 10μg/ml insulin) that was applied for 4 days, and followed by 10μg/ml insulin treatment for additional 4 days 18. Culture medium was changed every other day. The differentiated cells were maintained in normal serum-containing DMEM.
Hypoxia treatment
Two methods were used in the generation of hypoxia. Chemical hypoxia was generated by adding sodium sulfite Na2SO3 (Sigma) into the culture medium at a final concentration of 200 μg/ml to reduce dissolved oxygen to 1% in the aqueous medium according to a protocol described elsewhere 19. The hypoxia was confirmed by measuring the oxygen levels with an oxygen meter. Ambient hypoxia was generated using a low-oxygen air that contained 1% oxygen, 5% carbon dioxide, and 94% nitrogen as described elsewhere 7. In acute hypoxia response, differentiated 3T3-L1 adipocytes were serum-starved in DMEM supplemented with 0.25% bovine serum albumin (BSA) overnight, and then treated with the chemical hypoxia for 0.5h, 1h, 2h, 4h or 8h. The medium and cell lysates were collected at indicated times for subsequent assays. In the transient hypoxia treatment, differentiating 3T3-L1 preadipocytes were treated with the chemical hypoxia (4h) or ambient hypoxia (2h) once a day, which was applied at the last 4 days (4d) or whole differentiation process (8 days) during the differentiation period. Cells cultured in the normoxia medium were used as control.
Glucose uptake and fatty acid oxidation
After hypoxia treatment, cells were cultured in 24-well plates, starved with low glucose serum-free medium (DMEM with 0.25% BSA) overnight, 2-deoxy-D-[3H] glucose uptake was performed as previously described with some modifications 20. Briefly, 3T3-L1 cells were washed twice with warm (37 °C) PBS, adipocytes were either untreated (basal, insulin-independent) or treated with insulin (100nM) for 15 min in PBS buffer. Without changing the buffer, glucose uptake was monitored by adding 1.0 μCi per well of 2-deoxy-[1, 2-3H]-glucose (specific activity 740 GBq mmol/L) for 10 min at 37°C. The cells were gently washed three times with ice-cold PBS and lysed in 800 ml of solution containing 0.5 M NaOH and 0.1% sodium dodecyl sulfate. 3H-glucose uptake was detected in 4 ml of scintillate using Beckman LS6500 scintillate counter. Nonspecific deoxyglucose uptake is measured in the presence of 20 μM cytochalasin B and is subtracted from the total uptake for transporter-mediated glucose uptake. The level of glucose uptake in the control group (normoxia) was used as a reference to determine the hypoxia effect. For fatty acid oxidation, 3T3-L1 adipocytes were cultured in a 12-well plate, starved in serum-free DMEM with 0.25% BSA overnight, [14C] palmitic acid oxidation was detected after hypoxia treatment as described elsewhere 21.
Glycerol and TG assays
3T3-L1 adipocytes were cultured in a 6-well plate. In the hypoxia treatment, the cells were maintained in hypoxia medium supplemented with 0.25% BSA and 25μM HEPES. In the recovery treatment, the cells were maintained in DMEM supplemented with 0.25% BSA and 25μM HEPES overnight after hypoxia treatment. Supernatant medium was used to assay glycerol production, cytosolic protein extracts and triglyceride using the commercially available colorimetric kits (Sigma, St. Louis, MO). To test TG in adipocytes, oil red O staining was performed as previously described 18. Selected culture dishes were fixed with 10% formalin (Sigma-Aldrich) for at least 1 h. For quantitative TG analysis, TG was extracted from the whole cell lysate using the standard chloroform/methanol (2:1) protocol 22. TG was quantified enzymatically using the Serum Triglyceride Determination Kit (TR0100; Sigma-Aldrich) as described elsewhere 10. The result was normalized by protein concentration of the whole cell lysate to TG (mg)/protein (mg).
PDH enzyme activity
Cells were washed with PBS, harvested using NETN buffer (20 mM Tris-HCl pH 7.8), 1 mM EDTA, 50 mM sodium chloride, and 0.5% NP-40) and cell lysates were centrifuged at 12,000 rpm at 4°C for 10 min. Supernatants were collected and protein concentration was determined by BCA assay kit (Pierce). Pyruvate dehydrogenase activity (PDH: Abcam, USA) and lactic dehydrogenase (LDH: BioVision, USA) enzyme activity were measured immediately after the treatment according to the kit instruction.
Quantitative RT-PCR
Total RNA was isolated with TRIZOL reagent (Sigma T9424) according to the manufacturer’s protocol. The expression levels of mRNAs were quantified using the TaqMan PCR reagent kit’s detection system according to the protocols provided by the manufacturer (Applied Biosystems). Quantitative RT-PCR (qRT-PCR) was conducted using the ABI 7900HT Fast Real-Time PCR system (Applied Biosystems, Foster City, CA). The following primers and probes were ordered from Applied Bio systems. Lipid metabolism-related genes include lipoprotein lipase (LPL; Mm 00434770_m1), fatty acid synthase (FSA: Mm00662319-m1), hormone sensitive lipase (HSL: Mm00495359-m1), and adipose tissue triglyceride lipase (ATGL, Mm00503040_m1). Mitochondrial genes include PPARγ coactivator 1 alpha (PGC-1α, Mm00447183_m1), estrogen related receptor alpha (ESRRα, Mm00433143_m1), and nuclear respiratory factor 1 (NRF-1, (Mm00447996_m1). The mRNA signal was normalized with 18S signal and elative gene expression was determined using the 2^- ΔΔ Ct method. A mean value of triplicates was used for relative mRNA level or calculation of the degree of mRNA induction.
Western blot
Cells were harvested using NETN buffer (20 mM Tris-HCl pH 7.8, 1 mM EDTA, 50 mM sodium chloride, and 0.5% NP-40), lysed by sonication for 10 second at 40 Watts, then centrifuged at 12,000 rpm at 4°C for 10 min. Supernatants were collected and protein concentration was determined by BCA assay kit (Pierce). Western blot was conducted as described elsewhere 18.
Statistical analysis
In this study, all of the experiments were conducted at least three times with consistent results. The data from representative experiments are presented. Values are means ± SE of multiple data points or samples to represent the final result. Student’s t-test or one-way ANOVA was used in statistical analysis of the data, p values <0.05 were considered statistically significant.
Results
Transient hypoxia enhanced insulin-independent and -dependent glucose uptake
Long-term (>8 h) hypoxia treatment inhibits differentiation of preadipocytes, and suppresses insulin action in differentiated adipocytes 10, 15. The effect of short-term hypoxia remains unknown in adipocytes. To address this issue, differentiated adipocytes were exposed to hypoxia for different times up to 8h in a time course study. The basal glucose uptake was enhanced in adipocytes by the hypoxia in the absence of insulin stimulation. As observed at 0.5h, the increase was 68.2% (2h) and 228.6% (4h) above the control level (Fig. 1A). The increase went down thereafter as shown by the decreased glucose uptake at 8h (Fig. 1A). The response in glucose uptake was associated with an increase in protein of glucose transporter 1 (GLUT1) in adipocytes (Fig. 1B). GLUT1 protein was examined in the whole cell lysate and the increase was observed at 30min. Abundance of GLUT4 protein was not dramatically changed in the same condition (Fig. 1B). HIF-1α protein was up-regulated in parallel with GLUT1 (Fig. 1B).
Figure 1.
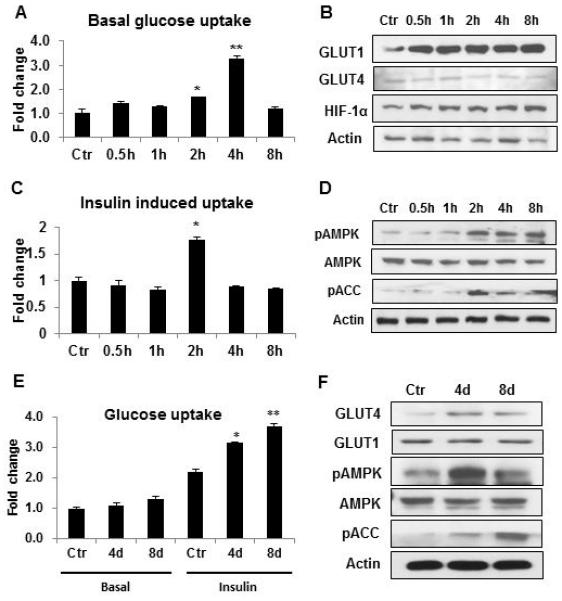
Induction of glucose uptake by transient hypoxia in 3T3-L1 adipocytes. A. Glucose uptake in differentiated adipocytes. Basal 2-deoxy-D-[3H] glucose uptake was examined in 3T3-L1 adipocytes after hypoxia treatment. B. GLUT1 expression in adipocytes. Proteins of GLUT1, GLUT4 and HIF-1α were determined in the whole cell lysate by Western blot. C. Insulin-stimulated glucose uptake. The test was conducted in differentiated cells. D. pAMPK (Thr172), and pACC (Ser79). The phosphorylation signals and AMPK were determined by Western blot in whole cell lysate of differentiated cells after hypoxia treatment. E. Glucose uptake in differentiated 3T3-L1 cells. The preadipocytes were treated with transient hypoxia (4h) once a day during the differentiation period either in the last 4 days (4d) or the whole process of differentiation of 8 days (8d). Glucose uptake was tested in cells in normoxia condition after differentiation in the presence or absence (basal) of insulin. F. GLUT4 protein and pAMPK. GLUT4, GLUT1, pAMPK, AMPK and pACC were examined in differentiated cells by Western blot. Experiments were repeated 3 times with consistent results. In the bar figure, results are mean ± SE (n=3). Ctr represents normoxia condition. *p<0.05, **p<0.01 vs. normoxia control.
In addition to the basal glucose uptake, insulin-stimulated glucose uptake was examined in the hypoxia model. The glucose uptake was enhanced by 82.2% at 2h of hypoxia treatment (Fig. 1C). The increase was transient as it was not observed before and after 2h. The enhanced insulin action was observed with elevated phosphorylation of AMPK and acetyl-CoA carboxylase (ACC) (Fig. 1D). ACC phosphorylation is catalyzed by AMPK. The data suggest that GLUT1 and AMPK activities are induced in adipocytes by hypoxia, which may contribute to the temporary induction of glucose uptake by hypoxia.
The effect of short-term hypoxia exposure was investigated in preadipocytes during cell differentiation to explore the metabolic reprogramming effect of hypoxia. 3T3-L1 preadipocytes were exposed to transient hypoxia for 4h/day during the course of differentiation. The treatment was conducted in two conditions, once a day in the last 4 days (4d) of differentiation, and once a day for 8 days (8d) in the whole process of differentiation. This design was employed to test the stage-specific effect of the hypoxia on differentiation. Glucose uptake was determined in the differentiated adipocytes in the absence of hypoxia to test the reprogramming effect. Basal glucose uptake in the absence of insulin stimulation was not altered by the hypoxia treatment (Fig. 1E). However, insulin-stimulated glucose uptake was significantly increased in the adipocytes. The increase was 42.7% (4d) and 62.2% (8d), respectively, in the cells treated in both conditions. The increase was associated with elevated GLUT4 protein, pAMPK and pACC signals (Fig. 1F). GLUT1 was not increased in the cells. The data suggest that the transient hypoxia have a long-term impact on preadipocytes. Preadipocytes are able to remember the impact with enhanced insulin sensitivity in normoxia condition. It is sufficient to generate the reprogramming effect by exposing the cells to the hypoxia in the last 4 days of differentiation.
Induction of TG accumulation in differentiating adipocytes by transient hypoxia
Given that transient hypoxia is able to reprogram the preadipocytes for enhanced insulin sensitivity, it may alter adipocyte differentiation. Triglyceride (TG) accumulation was examined in the adipocytes to evaluate the differentiation. TG abundance was quantified using two methods, oil red O staining and enzyme-based TG assay (Fig. 2, A and B). TG was increased by 60% in the hypoxia-treated cells. The increase was observed in both 4d and 8d treatment. The TG elevation was associated with enhanced protein expression of lipogenic transcription factors, PPARγ and SREBP (Fig. 2C). Expression of PPARγ target genes (FAS, SCD1, LPL and HSL) was enhanced in mRNA to support the enhanced function of the transcription factors (Fig. 2, D-G). The data suggest that TG biosynthesis is enhanced in adipocytes by the hypoxia-induced reprogramming through up-regulation of PPARγ and SREBP activities.
Figure 2.
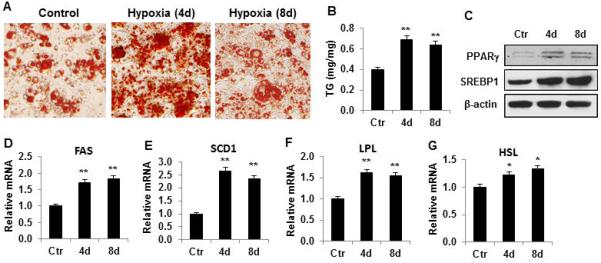
Lipid synthesis was enhanced by transient hypoxia. (A) TG determined by oil red O staining. Images are presentative of adipocytes after differentiation with transient hypoxic (4h/day) treatment in the course of differentiation. (B) TG in adipocytes after differentiation. (C) Proteins of PPARγ and SREBP in adipocytes after differentiation. (D) Relative FAS mRNA. (E) Relative SCD1 mRNA. (F) Relative LPL mRNA. (G) Relative HSL mRNA. In the bar figure, data represents mean ± SE (n=3). Ctr represents normoxic condition. *p<0.05, **p<0.01 vs. normoxic control.
Inhibition of oxidative phosphorylation and lipolysis by hypoxia
In cells, hypoxia decrease ATP production from fatty acids by inhibition of mitochondrial function. The reduction in fatty acid utilization may contribute to TG accumulation in adipocytes. To test this possibility, fatty acid oxidation was determined in adipocytes in acute hypoxia response using [14C] palmitic acid. The oxidation was quickly and significantly reduced by the hypoxia treatment (Fig. 3A). The inhibition was observed at 0.5h and the inhibition was enhanced with duration of hypoxia exposure in the time-dependent study of 8h. The inhibition peaked at 8h with 15.5 fold reduction. Glucose oxidation was examined indirectly by determining pyruvate dehydrogenase (PDH) activity, which is required for glucose utilization in the oxidative phosphorylation pathway in mitochondria. The catalytic activity of PDH was dramatically decreased by hypoxia in a time-dependent manner (Fig. 3B). The catalytic activity of lactate dehydrogenase (LDH) was increased by hypoxia at 1h (50.9% increase), and then followed by 44.5% decrease at 2h (Fig. 3C). Lipolysis was examined in the hypoxia-treated adipocytes by testing supernatant glycerol and expression of lipolytic enzyme. The glycerol and adipose triglyceride lipase (ATGL) were both reduced consistently by the hypoxia treatment (Fig. 3, D and E). Interestingly, expression of lipoprotein lipase (LPL) was decreased as well (Fig. 3F). The data suggest that utilization of fatty acid and glucose by mitochondria are inhibited by hypoxia in adipocytes. Adipocyte lipolysis and uptake of fatty acids by adipocytes are also inhibited by hypoxia. These metabolic alterations in adipocytes may contribute to TG accumulation in response to hypoxia.
Figure 3.
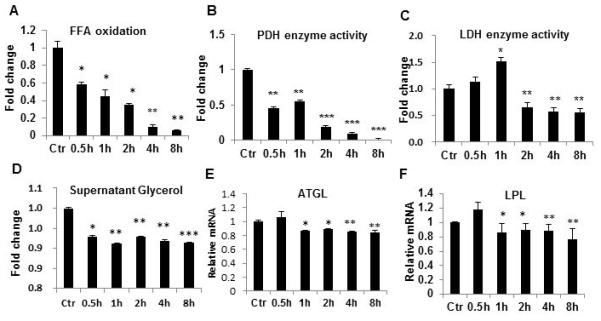
Fatty acid oxidation regulated by hypoxia. A. [14C] palmitic acid oxidation in differentiated 3T3-L1 adipocytes after hypoxia treatment. B. PDH enzyme activity after hypoxia treatment. C. LDH activity after hypoxia treatment. Ctr represents normoxic condition. D. Glycerol in cell supernatant. E. ATGL mRNA. F. LPL mRNA. In the bar figure, data represents mean ± SE (n=3). *P<0.05, **P<0.01, ***P<0.001 vs. normoxic control.
Mitochondrial genes in the metabolic reprogramming
The effects of transient hypoxia were remembered by differentiating adipocytes in the adipogenic model (Fig. 1, E and F), suggesting reprogramming of the metabolic system. The reprogramming is reflected in elevated glucose-uptake and enhanced AMPK activity in cells post differentiation under normoxia. It is unknown if the reprogramming involve expression of mitochondrial genes. To address this issue, expression of mitochondria genes was examined in the adipocytes. In adipocytes, PGC-1α mRNA was increased, but other genes such as NRF-1 and ESRRα were reduced in response to acute hypoxia exposure (Fig. 4, A-C). In the reprogrammed cells, expression of PGC-1 was increased (Fig. 4D). However, expression of NRF-1 and ESRRα was also increased (Fig. 4, E and F). The results suggest that the alteration of mitochondria genes is associated with the preadipocyte reprogramming by transient hypoxia.
Figure 4.
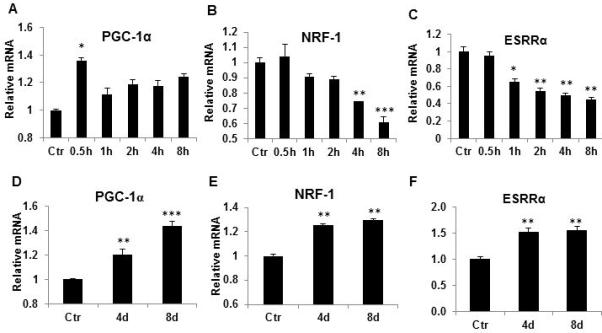
Regulation of mitochondrial genes during and post hypoxia. Acute effect of hypoxia was examined in 3T3-L1 adipocytes treated with hypoxia for different time, and mitochondrial genes were examined in mRNA by qRT-PCR. A. PGC-1α; B. NRF-1; C. ESRRα; D. PGC-1. 3T3-L1 preadipocytes were treated with hypoxia during differentiation for 4 days and 8 days. Mitochondria genes including PGC-1α were determined in differentiated adipocytes. E. NRF-1; F. ESRRα. In the bar figure, data represents result of mean ± SE (n=3). * p<0.05, **p<0.01, ***p<0.001 vs. normoxic control.
Increased insulin signaling activity in reprogrammed adipocytes
Insulin-stimulated glucose uptake was enhanced in the adipogenic model (Fig. 1E), suggesting that insulin signaling pathway may involve in the memory of the transient hypoxia effects. To test the possibility, insulin signaling molecules were examined in the reprogrammed adipocytes. The adipocytes were treated with 100nM insulin for 15min to activate the insulin signaling pathway. IRβ protein was not changed, but phosphorylation of Akt (pT308 and pS473) and GSK3β were all up-regulated in the adipocytes treated with transient hypoxia (Fig. 5, A and B). Without insulin treatment, the reprogrammed adipocytes did not show a difference from the control adipocytes (Fig. 5A, lanes 1-3). IRS-1 (pS307) was examined and no obvious change was observed (data not shown). These data demonstrate that the insulin signaling pathway is involved in reprogramming in adipocytes by the transient hypoxia.
Figure 5.
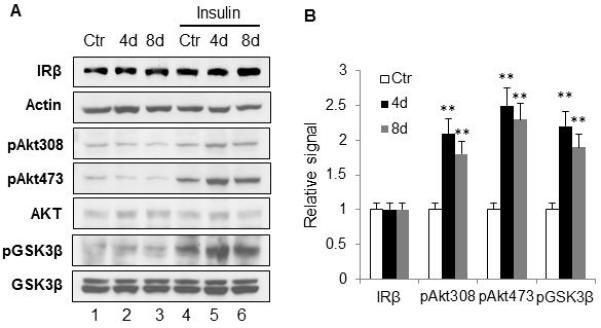
Enhanced insulin signaling pathway. A. Insulin signaling pathway. The hypoxia treatment was applied to 3T3-L1 cells during induction of differentiation as described in figure 1E. 3T3-L1 adipocytes were treated with 100nM insulin for 15min before harvested. Whole cell lysates were used in Western blot. The experiment was repeated three times with consistent results. B. Quantification of the signal. Quantification was normalized with loading control. The bar figure represents mean ± SE (n=3). * p<0.05, **p<0.01 vs. normoxic control.
AMPK in the memory of hypoxia effect
AMPK was activated by acute hypoxia and the enhanced activity was observed in the reprogrammed adipocytes. To determine the role of AMPK in the metabolic reprogramming, AMPK inhibition was introduced in the experiment using the chemical inhibitor Compound C (20μM). The glucose uptake was tested in the adipocytes with or without insulin stimulation. Effect of acute hypoxia was blocked by the AMPK inhibitor in the basal condition and in the presence of insulin (Fig. 6, A and B). The inhibition generated similar activities in the reprogrammed adipocytes (Fig. 6, C and D). The data suggests that AMPK is required for the acute effect of hypoxia and for the reprogramming effects of transient hypoxia.
Figure 6.
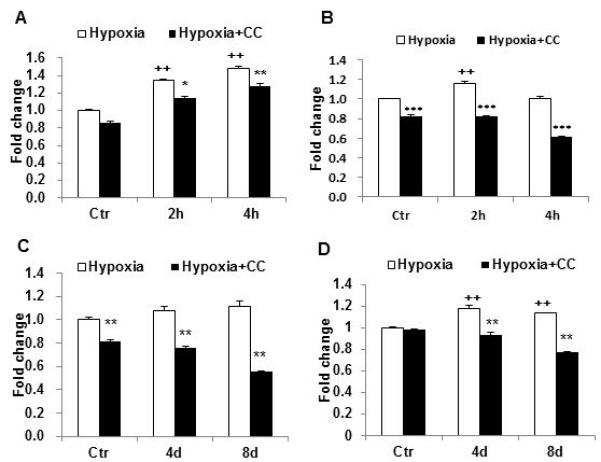
AMPK inhibition decreased the hypoxia effect on glucose uptake. A. Insulin-independent glucose uptake was reduced by AMPK inhibitor. 3T3-L1 adipocytes were exposed to hypoxia medium for 2h and 4h in the presence of compound C (20μm in DMSO). 2-deoxy-D-[3H] glucose uptake was examined immediately after the hypoxia treatment in the absence of insulin. B. Insulin-stimulated glucose uptake was decreased by hypoxia. C. Insulin-independent glucose uptake in 3T3-L1 adipocytes after recovery from hypoxia. D. Insulin-stimulated glucose uptake in adipocytes after recovery from the hypoxia treatment. Experiments were repeated 3 times with consistent results. In the bar figure, data represents mean ± SE (n=3). Ctr represents normoxic condition. CC: Compound C. ++ p<0.01 hypoxia vs normoxic control; * p<0.01, ** p<0.01, *** p<0.001 hypoxia with compound C vs. hypoxia.
Adipocyte reprogramming by transient ambient hypoxia
Above studies were conducted in hypoxia generated with sodium sulfite (Na2SO3, 200 μg/ml). It is not known if there are effects of the sodium sulfite on adipocytes beyond oxygen depletion. To address this issue, the reprogramming experiment was conducted under ambient hypoxia generated with 1% oxygen air. The differentiating 3T3-L1 cells were treated with the hypoxia once a day in the last four days of differentiation. The reprogramming effects were examined for TG accumulation, pAMPK, PPARγ, SREBP1 and gene expression (FAS, SCD1, PGC-1α, and NRF-1). All of these parameters were increased in the reprogrammed adipocytes (Fig. 7, A-D). The similar activities of ambient hypoxia and chemical hypoxia suggest that sodium sulfite does not have an effect beyond the oxygen depletion.
Fig. 7.
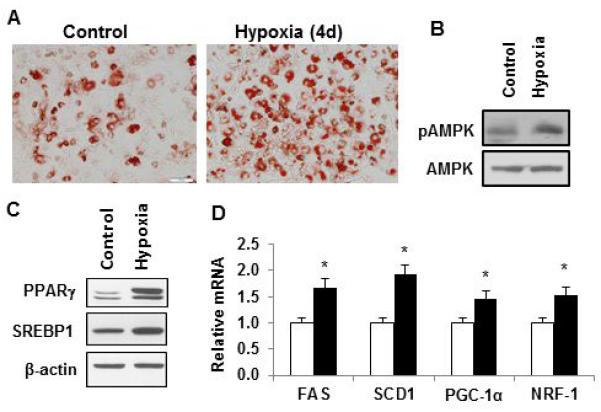
Adipocyte reprogramming by ambient hypoxia. 3T3-L1 preadipocytes were treated with ambient hypoxia (1% oxygen) for 2h each day in the last 4 days of differentiation. After completion of differentiation, the cells were incubated in the normal culture medium for one day and then used in the assays. (A) TG determined by oil red O staining. Representative images are presented. (B) pAMPK signal by Western blotting. (C) Proteins of PPARγ and SREBP in adipocytes. (D) Relative mRNA levels of FAS, SCD1, PGC-1α, and NRF1. In the bar figure, data represents mean ± SE (n=3). Control represents normoxic condition. * p<0.05 vs. normoxic control.
DISCUSSION
Current study demonstrates that transient hypoxia is able to reprogram differentiating 3T3-L1 cells in metabolism for enhanced TG accumulation. In acute response to hypoxia, adipocytes exhibited an increase in insulin-independent and -dependent glucose uptake. The responses are consistent with enhanced glucose demand in glycolysis in compensation for decreased ATP production by mitochondria under hypoxia. A reduction in lipolysis and β-oxidation of fatty acids was observed in the adipocytes in the acute response to hypoxia, which confirms the decrease in fatty acid utilization by mitochondria in ATP production. These metabolic alterations are in favor of TG accumulation in adipocytes. The acute hypoxia effect was programmed into differentiating preadipocytes through repeated exposure of the preadipocytes to transient hypoxia. The metabolic reprogram was observed in cells for increased TG accumulation and insulin sensitivity post differentiation in the absence of hypoxia. The enhanced insulin sensitivity was observed with increased signals of pAkt and pGSK-3β following insulin challenge together with elevated basal GLUT4 protein. Stimulation of de novo lipogenesis and inhibition of lipolysis by insulin may contribute to the TG accumulation. Expression of PPARγ and SREBP1 proteins was elevated in the reprogrammed cells, which provides a transcriptional mechanism for de novo lipogenesis and TG storage. The data suggest that transient hypoxia is able to reprogram metabolism in differentiating adipocytes. The reprogramming effects were observed in two different hypoxia models, chemical hypoxia and ambient hypoxia. In contrast to the transient hypoxia, persistent hypoxia inhibits insulin sensitivity and TG accumulation in adipocytes 10, 13.
Our data suggests that gene expression involves in the adipocyte reprogramming by transient hypoxia. Metabolic reprogramming is determined by gene expression and post-translational modification of enzymes. The activities of several transcription factors (HIF-1, PGC-1α, PPARγ and SREBP1) were increased together with expression of their target genes. In the acute response to hypoxia, HIF-1α was increased together with GLUT1 protein in adipocytes, which is consistent with our previous observation 10. As a HIF-1 target gene, GLUT1 protein was increased by hypoxia within 30 minutes in this study, suggesting a novel mechanism of regulation by hypoxia. In the classical regulation, GLUT1 transcription is increased by HIF-1, which takes more than 30 minutes to increase GLUT1 protein. In addition to this regulation, protein half-life or translational modification may also play a role in GLUT1 regulation by hypoxia. The increased PGC-1α may contribute to the mechanism of adipocyte reprogramming through interaction with HIF-1. The possibility is supported by PGC-1α activity in the induction of vascular endothelial growth factor (VEGF, a HIF-1 target gene) in the study of cold response 23. HIF-1 may contribute to the elevated PPARγ expression in the reprogrammed adipocytes. HIF-1 was reported to induce PPARγ expression in a study of hypoxic response 24. The elevated PPARγ and SREBP proteins may contribute to the enhanced expression of GLUT4, FAS, SCD1, LPL and HSL in the reprogrammed adipocytes. These data suggests that multiple transcription factors may involve in the metabolic reprogramming of differentiating adipocytes. In addition to gene expression, post-translational modification of proteins may also involve in the reprogramming. LPL activity is induced by glycosylation and mRNA expression in response to insulin 25. SREBP1 activity is enhanced by cleavage in addition to mRNA expression. PPARγ activity is regulated by acetylation and phosphorylation 26, 27. Those modifications remain to be tested in the adipocyte reprogramming.
Activation of AMPK may contribute to the metabolic reprogramming through post-translational modification of cellular proteins. AMPK is an energy sensor in cells, whose activity is induced by an increase in AMP/ATP ratio 28. An increase in AMPK activity was suggested by phosphorylation of AMPK (Thr172) and ACC (AMPK substrate) in the reprogrammed cells. The activities in the normoxia condition suggest a role of AMPK in the memory of the hypoxic response. AMPK contributes to insulin sensitivity in multiple mechanisms including induction of GLUT4 translocation to the plasma membrane 29, 30. AMPK also enhances PGC-1α activity through phosphorylation 31. The mechanism by which AMPK activity is enhanced in the reprogrammed adipocytes remains unknown.
The data provides an example that the impact of one and multiple hypoxia exposure is different. GLUT4, instead of GLUT1, was elevated in the reprogrammed adipocytes. FAS, SCD1, NRF-1, ESRRα and LPL were all increased in the reprogrammed adipocytes, but decreased in adipocytes in the acute hypoxia response. The data suggest that a part of acute hypoxic response is reprogrammed into the adipocytes through repeated exposure of differentiating adipocytes to the transient hypoxia.
This study has a couple of limitations. First, AMPK inhibition was performed using the chemical inhibitor. Although compound C is widely used in the inhibition of AMPK, it may have off-target effect. AMPK knockout will be a better tool to confirm the AMPK activity in the future. Second, the study was concentrated on the storage function of adipocytes, and the endocrine function was not examined in adipocytes.
In summary, the present study reveals that the transient hypoxia may promote TG accumulation in adipocytes. Repeated exposure of differentiating adipocytes to transient hypoxia is able to reprogram the cells for increased TG accumulation and enhanced insulin sensitivity. The effects involve induction of de novo lipogenesis, inhibition of lipolysis and suppression of fatty acid β-oxidation. The mechanism of reprogramming involves gene expression and AMPK activation. The mechanism of elevated AMPK activity remains unknown in the reprogrammed adipocytes. The results may apply to other type of cells given that AMPK regulates metabolism in many types of cells 32.
Acknowledgments
Funding: This work was supported by National Institutes of Health grant (DK068036 and DK085495) to JY, National Natural Science Funds for Distinguished Young Scholar of China (81025005) and Changjiang Scholars and Innovative Research Team in University of China (985 project IRT 0947) to JW. The qRT-PCR assay was performed in core facility supported by NIH grant (2P30DK072476). The funders had no role in study design, data collection and analysis, decision to publish, or preparation of the manuscript.
Footnotes
Conflict of interest: The authors declare that there are no conflicts of interest.
Author contributions: H.L, Z.G and Z.Z performed the experiments. J.Y and J.W designed the study and wrote the manuscript. J.Y is fully responsible for this article. All authors read and approved the final manuscript.
Reference
- 1.Ye J. Emerging Role of Adipose Tissue Hypoxia in Obesity and Insulin Resistance. Int J Obes. 2009;33(1):54–66. doi: 10.1038/ijo.2008.229. [DOI] [PMC free article] [PubMed] [Google Scholar]
- 2.Trayhurn P. Hypoxia and adipose tissue function and dysfunction in obesity. Physiol Rev. 2013;93(1):1–21. doi: 10.1152/physrev.00017.2012. [DOI] [PubMed] [Google Scholar]
- 3.Goossens GH, Bizzarri A, Venteclef N, Essers Y, Cleutjens JP, Konings E, et al. Increased adipose tissue oxygen tension in obese compared with lean men is accompanied by insulin resistance, impaired adipose tissue capillarization, and inflammation. Circulation. 2011;124(1):67–76. doi: 10.1161/CIRCULATIONAHA.111.027813. [DOI] [PubMed] [Google Scholar]
- 4.Ambrosini G, Nath AK, Sierra-Honigmann MR, Flores-Riveros J. Transcriptional activation of the human leptin gene in response to hypoxia. Involvement of hypoxia-inducible factor 1. J Biol Chem. 2002;277(37):34601–9. doi: 10.1074/jbc.M205172200. [DOI] [PubMed] [Google Scholar]
- 5.Grosfeld A, Zilberfarb V, Turban S, Andre J, Guerre-Millo M, Issad T. Hypoxia increases leptin expression in human PAZ6 adipose cells. Diabetologia. 2002;45(4):527–30. doi: 10.1007/s00125-002-0804-y. [DOI] [PubMed] [Google Scholar]
- 6.Wang B, Wood IS, Trayhurn P. Hypoxia induces leptin gene expression and secretion in human preadipocytes: differential effects of hypoxia on adipokine expression by preadipocytes. J Endocrinol. 2008;198(1):127–134. doi: 10.1677/JOE-08-0156. [DOI] [PubMed] [Google Scholar]
- 7.Ye J, Gao Z, Yin J, He H. Hypoxia is a potential risk factor for chronic inflammation and adiponectin reduction in adipose tissue of ob/ob and dietary obese mice. Am J Physiol Endocrinol Metab. 2007;293:E1118–E1128. doi: 10.1152/ajpendo.00435.2007. [DOI] [PubMed] [Google Scholar]
- 8.Hosogai N, Fukuhara A, Oshima K, Miyata Y, Tanaka S, Segawa K, et al. Adipose tissue hypoxia in obesity and its impact on adipocytokine dysregulation. Diabetes. 2007;56(4):901–11. doi: 10.2337/db06-0911. [DOI] [PubMed] [Google Scholar]
- 9.Rausch ME, Weisberg S, Vardhana P, Tortoriello DV. Obesity in C57BL/6J mice is characterized by adipose tissue hypoxia and cytotoxic T-cell infiltration. Int J Obes (Lond) 2008;32(3):451–63. doi: 10.1038/sj.ijo.0803744. [DOI] [PubMed] [Google Scholar]
- 10.Yin J, Gao Z, He Q, Ye J. Role of hypoxia in obesity-induced disorders of glucose and lipid metabolism in adipose tissue. Am J Physiol Endocrinol Metab. 2009;296:E333–E342. doi: 10.1152/ajpendo.90760.2008. [DOI] [PMC free article] [PubMed] [Google Scholar]
- 11.Ye J, McGuinness OP. Inflammation during obesity is not all bad: Evidence from animal and human studies. Am J Physiol Endocrinol Metab. 2013;304(5):E466–E477. doi: 10.1152/ajpendo.00266.2012. [DOI] [PMC free article] [PubMed] [Google Scholar]
- 12.Johnson AM, Olefsky JM. The origins and drivers of insulin resistance. Cell. 2013;152(4):673–84. doi: 10.1016/j.cell.2013.01.041. [DOI] [PubMed] [Google Scholar]
- 13.Regazzetti C, Peraldi P, Gremeaux T, Najem-Lendom R, Ben-Sahra I, Cormont M, et al. Hypoxia decreases insulin signaling pathways in adipocytes. Diabetes. 2009;58(1):95–103. doi: 10.2337/db08-0457. [DOI] [PMC free article] [PubMed] [Google Scholar]
- 14.Kim KH, Song MJ, Chung J, Park H, Kim JB. Hypoxia inhibits adipocyte differentiation in a HDAC-independent manner. Biochem Biophys Res Commun. 2005;333(4):1178–84. doi: 10.1016/j.bbrc.2005.06.023. [DOI] [PubMed] [Google Scholar]
- 15.Yun Z, Maecker HL, Johnson RS, Giaccia AJ. Inhibition of PPAR gamma 2 gene expression by the HIF-1-regulated gene DEC1/Stra13: a mechanism for regulation of adipogenesis by hypoxia. Dev Cell. 2002;2(3):331–41. doi: 10.1016/s1534-5807(02)00131-4. [DOI] [PubMed] [Google Scholar]
- 16.Ye J. Adipose Tissue Vascularization: Its Role in Chronic Inflammation. Curr Diab Rep. 2011;11(3):203–10. doi: 10.1007/s11892-011-0183-1. [DOI] [PMC free article] [PubMed] [Google Scholar]
- 17.Kim J-w, Osborne O, Oh Da Y, Sasik R, Schenk S, et al. Increased Adipocyte O2 Consumption Triggers HIF-1α, Causing Inflammation and Insulin Resistance in Obesity. Cell. 2014;157(6):1339–1352. doi: 10.1016/j.cell.2014.05.012. [DOI] [PMC free article] [PubMed] [Google Scholar]
- 18.Gao Z, He Q, Peng B, Chiao PJ, Ye J. Regulation of Nuclear Translocation of HDAC3 by IkBa Is Required for Tumor Necrosis Factor Inhibition of Peroxisome Proliferator-activated Receptor {gamma} Function. J Biol Chem. 2006;281(7):4540–7. doi: 10.1074/jbc.M507784200. [DOI] [PMC free article] [PubMed] [Google Scholar]
- 19.Jiang B, Ren C, Li Y, Lu Y, Li W, Wu Y, et al. Sodium sulfite is a potential hypoxia inducer that mimics hypoxic stress in Caenorhabditis elegans. J Biol Inorg Chem. 2010;16(2):267–74. doi: 10.1007/s00775-010-0723-1. [DOI] [PubMed] [Google Scholar]
- 20.Gao Z, Zhang X, Zuberi A, Hwang D, Quon MJ, Lefevre M, et al. Inhibition of Insulin Sensitivity by Free Fatty Acids Requires Activation of Multiple Serine Kinases in 3T3-L1 Adipocytes. Mol Endocrinol. 2004;18(8):2024–2034. doi: 10.1210/me.2003-0383. [DOI] [PubMed] [Google Scholar]
- 21.Gao Z, Yin J, Zhang J, Pope CR, E WR, Martin RJ, et al. Butyrate Improves Insulin Sensitivity and Increases Energy Expenditure in Mice. Diabetes. 2009;58:1509–1517. doi: 10.2337/db08-1637. [DOI] [PMC free article] [PubMed] [Google Scholar]
- 22.Lin J, Yang R, Tarr PT, Wu PH, Handschin C, Li S, et al. Hyperlipidemic effects of dietary saturated fats mediated through PGC-1beta coactivation of SREBP. Cell. 2005;120(2):261–73. doi: 10.1016/j.cell.2004.11.043. [DOI] [PubMed] [Google Scholar]
- 23.Xue Y, Petrovic N, Cao R, Larsson O, Lim S, Chen S, et al. Hypoxia-Independent Angiogenesis in Adipose Tissues during Cold Acclimation. Cell Metab. 2009;9(1):99–109. doi: 10.1016/j.cmet.2008.11.009. [DOI] [PubMed] [Google Scholar]
- 24.Krishnan J, Suter M, Windak R, Krebs T, Felley A, Montessuit C, et al. Activation of a HIF1alpha-PPARgamma axis underlies the integration of glycolytic and lipid anabolic pathways in pathologic cardiac hypertrophy. Cell Metab. 2009;9(6):512–24. doi: 10.1016/j.cmet.2009.05.005. [DOI] [PubMed] [Google Scholar]
- 25.Ong JM, Kern PA. The role of glucose and glycosylation in the regulation of lipoprotein lipase synthesis and secretion in rat adipocytes. J Biol Chem. 1989;264(6):3177–82. [PubMed] [Google Scholar]
- 26.Jiang X, Ye X, Guo W, Lu H, Gao Z. Inhibition of HDAC3 promotes ligand-independent PPARgamma activation by protein acetylation. J Mol Endocrinol. 2014;53(2):191–200. doi: 10.1530/JME-14-0066. [DOI] [PMC free article] [PubMed] [Google Scholar]
- 27.Choi JH, Banks AS, Estall JL, Kajimura S, Bostrom P, Laznik D, et al. Anti-diabetic drugs inhibit obesity-linked phosphorylation of PPARgamma by Cdk5. Nature. 2010;466(7305):451–6. doi: 10.1038/nature09291. [DOI] [PMC free article] [PubMed] [Google Scholar]
- 28.Musi N, Goodyear LJ. AMP-activated protein kinase and muscle glucose uptake. Acta Physiol Scand. 2003;178(4):337–45. doi: 10.1046/j.1365-201X.2003.01168.x. [DOI] [PubMed] [Google Scholar]
- 29.Russell RR, 3rd, Bergeron R, Shulman GI, Young LH. Translocation of myocardial GLUT-4 and increased glucose uptake through activation of AMPK by AICAR. Am J Physiol. 1999;277(2 Pt 2):H643–9. doi: 10.1152/ajpheart.1999.277.2.H643. [DOI] [PubMed] [Google Scholar]
- 30.Fisher JS, Gao J, Han DH, Holloszy JO, Nolte LA. Activation of AMP kinase enhances sensitivity of muscle glucose transport to insulin. Am J Physiol Endocrinol Metab. 2002;282(1):E18–23. doi: 10.1152/ajpendo.2002.282.1.E18. [DOI] [PubMed] [Google Scholar]
- 31.Jager S, Handschin C, St-Pierre J, Spiegelman BM. AMP-activated protein kinase (AMPK) action in skeletal muscle via direct phosphorylation of PGC-1alpha. Proc Natl Acad Sci U S A. 2007;104(29):12017–22. doi: 10.1073/pnas.0705070104. [DOI] [PMC free article] [PubMed] [Google Scholar]
- 32.Denko NC. Hypoxia, HIF1 and glucose metabolism in the solid tumour. Nat Rev Cancer. 2008;8(9):705–13. doi: 10.1038/nrc2468. [DOI] [PubMed] [Google Scholar]