Abstract
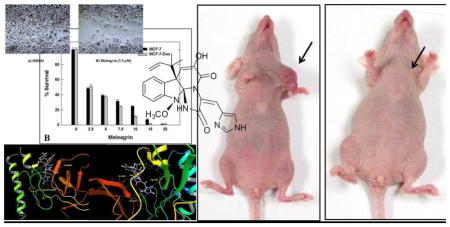
Fungi of the genus Penicillium produce unique and chemically diverse biologically active secondary metabolites, including indole alkaloids. The role of dysregulated hepatocyte growth factor (HGF) and its receptor, c-Met, in the development and progression of breast carcinoma is documented. The goal of this work is to explore the chemistry and bioactivity of the secondary metabolites of the endophytic Penicillium chrysogenum cultured from the leaf of the olive tree Olea europea, collected in its natural habitat in Egypt. This fungal extract showed good inhibitory activities against the proliferation and migration of several human breast cancer lines. The CH2Cl2 extract of P. chrysogenum mycelia was subjected to bioguided chromatographic separation to afford three known indole alkaloids; meleagrin (1), roquefortine C (2) and DHTD (3). Meleagrin inhibited the growth of the human breast cancer cell lines MDA-MB-231, MDA-468, BT-474, SK BR-3, MCF7 and MCF7-dox, while similar treatment doses were found to have no effect on the growth and viability of the non-tumorigenic human mammary epithelial cells MCF10A. Meleagrin also showed excellent ATP competitive c-Met inhibitory activity in Z-Lyte assay, which was further confirmed via molecular docking studies and Western blot analysis. In addition, meleagrin treatment caused a dose-dependent inhibition of HGF-induced cell migration, and invasion of breast cancer cell lines. Meleagrin treatment potently suppressed the invasive triple negative breast tumor cell growth in an orthotopic athymic nude mice model, promoting this unique natural product from hit to a lead rank. The indole alkaloid meleagrin is a novel lead c-Met inhibitory entity useful for the control of c-Met-dependent metastatic and invasive breast malignancies.
Keywords: Bioassay-guided, Breast cancer, c-Met, Endophyte, Meleagrin, Olive tree, Penicillum chrysogenum
Graphical Abstract
1. Introduction
Microbial extracts continued to be a productive sustained resource of new entities with chemical and biological importance. Endophytes are microbes that colonize in the living internal tissues of plants without causing any immediate, or negative pathological effects.1,2 The outstanding chemical diversity of biologically active secondary metabolites from endophytic fungi has led to further research on these organisms.1 The most well-known example is paclitaxel, the top prescribed drug for breast, ovaries and several other malignancies, produced by the Pacific yew tree Taxus brevifolia and the endophytic terrestrial fungus Taxomyces andreanae.2 The fungi of the genus Penicillium are well-known producers of various secondary metabolites possessing valuable pharmaceutical and therapeutic properties.3 Among various compounds biosynthesized by Penicillium species, there is an interestingly large group of biologically active metabolites including ergot alkaloids, diketopiperazines, and quinoline alkaloids.3 The indole alkaloids meleagrin and roquefortine C, mainly isolated from Penicillium species,4,5 are biogenetically interrelated alkaloids with promising biological properties,6–8 such as antibacterial,9 cytochrome P450 inhibitory,10 and tubulin polymerization inhibitory activity.11 Meleagrin is a common mycotoxin first isolated from P. meleagrinum in 1979.12 Meleagrin was recently reported to show potent antibacterial activity via targeting the bacterial enoyl-acyl carrier protein reductase (Fab I) and therefore proposed as a promising novel antibiotic entity.13 Oxaline, the meleagrin’s 9-O-methyl analog, was reported to disrupt tubulin polymerization, resulting in cell cycle arrest at the M-phase in Jurkat cells.14 Roquefortine C, the biosynthetic precursor of meleagrin, is a relatively common fungal metabolite with over 130 papers published on its occurrence, biosynthesis, and biological activities.6–10 It was reported to possess neurotoxic properties in mice and inhibited the Gram-positive bacterial growth.8 The mechanisms responsible for its toxicity and metabolism were related to the inhibition of various cytochromes P450s.8 Its biosynthesis from histidine, tryptophan, and mevalonic acid has been well-established and it was also known to be a biosynthetic precursor of meleagrin.6
Meleagrin B is a novel complex meleagrin type alkaloid with a rare diterpene moiety isolated from a deep ocean sediment-derived fungus Penicillium sp. F23-2.15 It showed potent cytotoxicity against the four diverse tumor cell lines A-549, HL-60, BEL-7402 and MOLT-4, with IC50 values ranging from 1.8 to 6.7 μM.15 Meleagrin also exhibited moderate cytotoxicity against the non-small cell lung cancer A-549 cells and the leukemia HL-60 cell line, with the IC50 values of 19.9 and 7.4 μM, respectively.16 The cytotoxic mechanisms of meleagrin B and meleagrin were investigated by flow cytometric analysis.16 Meleagrin B induced HL-60 cells apoptosis at 5 and 10 μM, while meleagrin arrested the cell cycle through G2/M phase at the same concentrations.16 This study focuses on the activities of the title alkaloids17–19 against various breast cancer cell lines.
Breast carcinoma is among the most frequent global malignancies and is the leading cause of death among young women in developed countries, claiming the lives of hundreds of thousands.20–22 One out of seven to ten women will have this disease over their lifetime.20–22 Current treatment options include surgery, radiation, hormonal replacement and chemotherapy.21 Breast cancer chemotherapeutics pose a high degree of morbidity and mortality risk, arising from, inter alia, cardiac toxicities, secondary cancers, wound infections, peripheral neuropathy, lymphedema, and psychological disorders.20–22 Radiotherapy can also cause dermal reactions and cardiac mortality.21,22 Improving treatment options by discovery of more-selective, less-toxic and targeted therapies for highly resistant disease, such as triple-negative breast cancer (TNBC), is an urgent area of unmet medical need.
Receptor tyrosine kinases (RTK) targeting small molecules such as imatinib, lapatinib, crizotinib, and gefitinib have illustrated the utility of selectively targeting this protein class for treatment of selected cancers.23 A unique member of the RTK family, c-Met, also represents an important clinically valid molecular target for cancer therapy. c-Met and HGF are each required for normal mammalian development and have been shown to be particularly important in cell migration, morphogenic differentiation, organization of three-dimensional tubular structures (e.g. renal tubular cells, gland formation, etc.), cell growth, survival, and angiogenesis.23 Both c-Met and HGF have been shown to be dysregulated in a number of major human cancers, which correlated with poor prognosis. The inhibition of c-Met with a variety of receptor antagonists inhibited the motility, invasiveness, and tumorgenicity of human tumor cell lines.23–25 More than 240 small-molecule c-Met inhibitors are currently in different clinical trial phases, and would seem to have potential to delay the progression of a wide array of Met-dependent malignancies.26–32 Crizotinib is a dual Met and anaplastic lymphoma kinase (ALK) inhibitor approved by the FDA for ALK-driven lung cancer.23 Cabozantinib was also approved by the FDA in 2012 for medullary thyroid cancer.23 The documented efficacies of these marketed agents, as well as of promising ones still undergoing clinical trials, validates c-Met as a molecular target in cancer therapy and motivates further discovery of novel c-Met inhibitory entities.
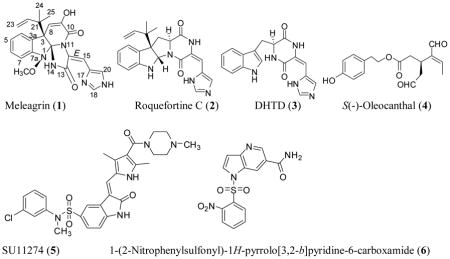
This study reports the novel c-Met inhibitory activity of meleagrin, isolated from the endophytic fungus P. chrysogenum cultured from the leaves of olive tree growing in its natural habitat, along with the related indole alkaloids roquefortine C and dehydrohistidyltryptophenyl-diketopiperazine (DHTD).17–19 The in vitro breast cancer proliferation, migration, and invasion inhibitory activities of the title compounds will also be reported against a panel of breast cancer cell lines including MDA-MB-231, MDA-468, BT-474, SKBR-3, MCF7, MCF7-dox and T-47D. Meleagrin showed significant wild and mutant c-Met inhibitory activity in Z-Lyte assay. Western blot analysis of MDA-MB-231 cells treated with various doses of meleagrin showed significant reduction of the activated (phosphorylated) c-Met level and had no effects on the total Met level. This result further correlated the antiproliferative, antimigratory and anti-invasive activities of meleagrin against breast cancer cell lines to c-Met activation inhibition. The in-silico binding mode of meleagrin at the ATP binding pocket of c-Met crystal structures will also be reported. Finally, the in vivo activity of meleagrin against the invasive human TNBC cells MDA-MB-231 will be reported using a xenograft orthotopic athymic nude mouse model.25
Results and discussion
Several endophytic fungi were cultured and isolated from different olive tree organs collected at its native habitat in Siwa Oasis, Western desert, Egypt. Of these, the lipophilic extract of the mycelia of a filamentous fungus cultured over PDA solid media showed a good (IC50<100–200 μg/mL) antiproliferative activity against several human breast cancer cell lines. This fungus was identified as a P. chrysogenum species based on its 16S-rRNA gene sequencing. Large-scale fermentation of this fungal species afforded mycelial mass, which was extracted with CH2Cl2 resulting in a 5 g crude extract. Bioguided fractionation of this crude extract afforded the three known indole alkaloids: meleagrin (1), roquefortine C (2) and DHTD (3).15–19 The identity of these compounds was confirmed by comparison of their 1H and 13C NMR data with those described in the literature.15–19
The antiproliferative activities of 1–3 were tested using MTT colorimetric assay against six human breast cancer cell lines including: MDA-MB-231, MDA-468, BT-474, SKBR-3, MCF7 and MCF7-dox. Selection of the aforementioned breast cancer cell lines was based on their phenotypes and intended to represent the major heterogeneous pheno-subtypes of breast cancer. ERα is expressed in MCF7, MCF7-dox and BT-474 cells, whereas MDA-MB-231 and MDA-MB-468 cells lack the expression of ERα.25 Meanwhile, c-Met is expressed in the six chosen cancer cell lines.25 In order to evaluate the off-target effects of meleagrin, it has been additionally tested against the c-Met independent T-47D human breast cancer cells. This particular cell line was chosen as it represents a completely different breast cancer phenotype and lacks the c-Met receptor expression.25 A minimum of four concentrations per compound were tested and used to calculate the IC50. (−)-Oleocanthal was used as a positive control at different doses (10, 20 and 40 μM) against different cancer cell lines based on its well-defined earlier studies.24,25 The results revealed that both roquefortine C (2) and DHTD (3) showed moderate antiproliferative activity against all c-Met-dependant cell lines, with an IC50 range of 20–40 μM, whereas meleagrin showed good activity against these breast cancer cells with an IC50 range of 1.8–8.9 μM (Table 1, Figures 1A–C). Importantly, meleagrin 1 lacked the activity against the c-Met independent T-47D breast cancer cells at similar treatment doses with an IC50 >40 μM (Figure 1B). This result confirmed the differential sensitivity of human breast cancer cells to meleagrin and suggested the activity may be linked, at least in part, to its inhibitory effects on the c-Met signaling. Thus, the ability of meleagrin to exhibit a degree of selectivity towards c-Met in breast cancer cells is evident.
Table 1.
Antiproliferative activities of 1–3 against human breast cancer cell lines.
| Cell line | Meleagrin (1) IC50 μM |
Roquefortine C (2) IC50 μM |
DHTD (3) IC50 μM |
|---|---|---|---|
| MCF7 | 1.9 | 21.7 | ~40 |
| MCF7-dox | 3.2 | 24.4 | 23.8 |
| BT-474 | 2.7 | 29.6 | ~40 |
| SKBR-3 | 2.8 | 23.4 | ~40 |
| MDA-MB-231 | 6.8 | 23.5 | 31.8 |
| MDA-MB-468 | 8.9 | 28.6 | ~40 |
| T-47D | >40 | ND | ND |
Figure 1.
Meleagrin inhibits HGF-induced proliferation of breast cancer cell lines: MDA-MB-231, MDA-MB-468, and BT-474 (A), MCF7, MCF7-dox and T-47D (B) as well as SKBR-3 (C). Error bars indicate the SEM of n=3/dose. (−)-Oleocanthal was used as a positive control at doses selected based on well-defined activities in earlier studies.24,25
Interestingly, the toxicity of 1–3 towards the non-tumorigenic human mammary epithelial MCF-10A cells was minimal (Figure 2). Compounds 1–3 showed toxicity to MCF-10A cells only at relatively higher concentrations compared to their corresponding IC50 against the malignant cell lines, indicating a high degree of selectivity towards the malignant cells (Table 2).
Figure 2.
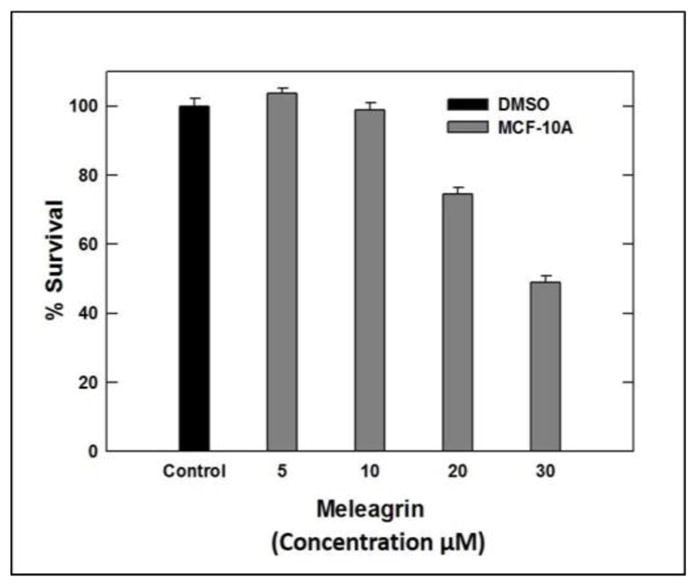
Cytotoxic activities of meleagrin against the non-tumorigenic human mammary epithelial MCF-10A.
Table 2.
Cytotoxic activities of alkaloids 1–3 against of the non-tumorigenic human mammary epithelial cells MCF-10A.
| Meleagrin (1) | Roquefortine C (2) | DHTD (3) | ||||||
|---|---|---|---|---|---|---|---|---|
| Doses | 5 μM | 10 μM | 20 μM | 30 μM | 20 μM | 40 μM | 40 μM | 60 μM |
| % Survival | 100% | 98.8% | 74.4% | 48.9% | 98.4% | 92.6% | 99.1% | 89.9% |
The Cayman’s LDH cytotoxicity assay kit was used to measure the ability of meleagrin to induce mitochondrial cell death and the LDH release in MDA-MB-231 cells.33 Two different doses of 1 were used, 25 and 50 μM to assess target cell death. Meleagrin showed only 2.5% cytotoxicity at 25 μM and 9.4% cytotoxicity at 50 μM (Figure 3). This clearly suggested that meleagrin did not show significant cytotoxicity up to several folds its antiproliferative activity IC50 values and therefore its effect is mainly cytostatic.
Figure 3.
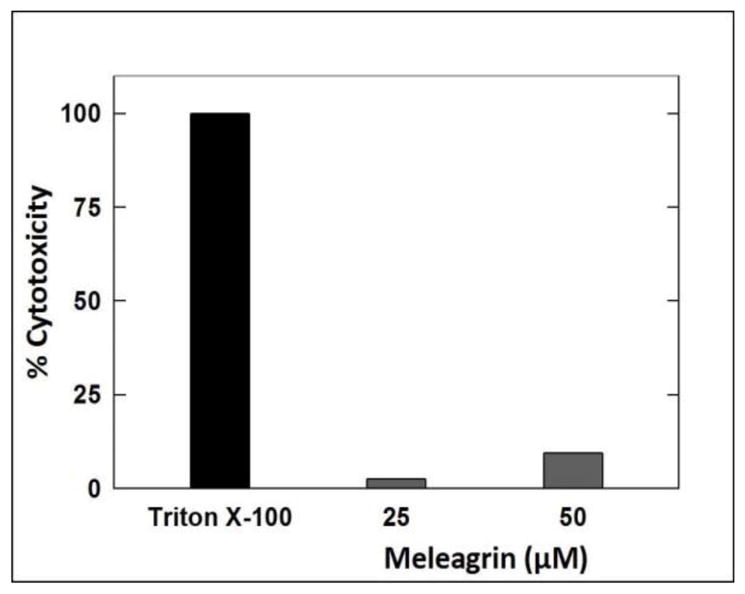
LDH cytotoxicity assay of meleagrin. Error bars indicate the SEM of n = 3/dose.
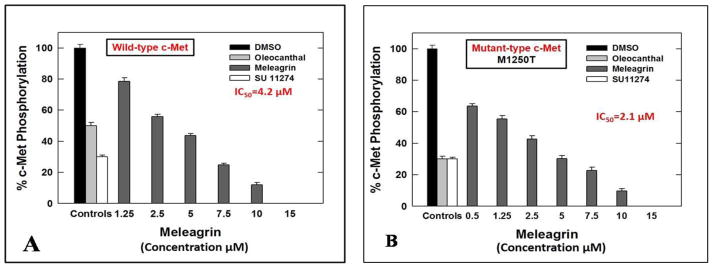
The cell-free Z′-Lyte™ Kinase Assay-Tyr6 Peptide kit (Life Sciences) was used to assess the in vitro ability of the isolated indole alkaloids 1–3 to inhibit the phosphorylation (activation) at the ATP binding pocket of wild-type c-Met.24,25,34 In this experiment, Tyr6 peptide was used as a substrate; thus, the changes of Z′-Lyte™ Tyr6 peptide phosphorylation can directly reflect the c-Met kinase activity.24,25,34 The natural olive oil-based phenolic S(−)-oleocanthal (4) was used as a positive standard control for activity comparison. The calculated IC50 of (−)-oleocanthal in this assay was 5.2 μM, which was consistent with the reported literature value (4.8 μM) validating the results of this study.24,25 The known standard ATP competitive c-Met inhibitor SU11274 (5) was also used as a second positive control, inhibiting 70% of c-Met phosphorylation at 0.5 μM (Table 3).24,25 The percentage of c-Met phosphorylation inhibition exhibited by 1–3 at 5 and 10 μM doses is shown in (Table 3). Meleagrin was the most potent among the tested compounds, inhibiting the c-Met phosphorylation in a dose-dependent manner, with an IC50 value of 4.2 μM (Figure 4A). The meleagrin biosynthetic precursors analogs DHTD (3) and to a less extent roquefortine C (2) did not show the same c-Met phosphorylation inhibition activity level even when applied at concentrations up to 10 μM (Table 3). This clearly proves the importance of the meleagrin’s complex structural core for the activity, especially the unique trinitrogenated center C-2 and the enolic hydroxy-bearing C-9 functionalities.
Table 3.
c-Met inhibitory activity of alkaloids 1–3 and positive controls 4 and 5 using the Z′-Lyte™ kinase assay kit.
| Compound Name | % Phosphorylation Inhibition (5 μM) | % Phosphorylation Inhibition (10 μM) |
|---|---|---|
| Meleagrin (1) | 56.3% | 88% |
| Roquefortine C (2) | 39.7% | 59.7% |
| DHTD (3) | 0.0 | 10.2% |
| (−)-Oleocanthal (4) | 50% | 70% |
| SU 11274 (5, 0.5 μM) | 70% | ND |
Figure 4.
IC50 of meleagrin 1 with (A) wild type and (B) mutant type c-Met. Error bars indicate the SEM of n=3/dose. Oleocanthal 4 and SU 11274 6 were used as positive controls at 5 and 0.5 μM, respectively.24
The promising activity of meleagrin against the wild-type c-Met encouraged the investigation of its ability to inhibit the phosphorylation of the mutant-type c-Met (M1250T).35 Several protein kinase inhibitors have achieved great success in molecular targeted therapies and therefore approved for the treatment of different malignancies.26 Although the overall response rate to these targeted therapies is impressive, the durability of the response is limited by the rapid emergence of drug resistance due to the occurrence of inhibitor-resistant mutant forms of the target protein kinase. Therefore, studying the inhibitory effect of established and new inhibitors not only against the wild type but in addition against different common mutant forms of the targeted kinases is of significant therapeutic relevance and long-term applicability. One mechanism by which the c-Met deregulation leads to aggressive cancer progression is through the gain-of-function mutations, which are also correlated with poor clinical outcomes.27,28 Various activating-point mutations in the c-Met proto-oncogene, which result in the change of amino acid substitutions in the tyrosine kinase and in the juxtamembrane domains of the c-Met.27,28 This is particularly had been implicated and documented as the cause of hereditary papillary renal carcinoma (PRC) and were also detected in other carcinomas including lung, head and neck, childhood hepatocellular, and gastric cancers.29–32 The MetPRC mutant M1250T displays the highest catalytic activity and thus, confers with the highest neoplastic-transforming potential.35 Cells expressing the MetPRC mutant display a ‘scattered’ phenotype, disassembling the tightly packed islands and aggressive induction of cell detachment and migration.35 Cancer cells expressing Met M1250T mutant consequently exhibited increased migration as well as dramatically increased anchorage-independent growth potential, forming numerous large colonies, compared to cells expressing the wild-type c-Met, after HGF stimulation.35 Therefore, the in vitro potency of meleagrin (1) to inhibit the activation of the P+1 loop mutant M1250T c-Met, which is near the ATP binding site, was assessed and compared with its activity against the wild-type c-Met. Interestingly, meleagrin was 2-fold more potent against the oncogenic human mutant c-Met, with an IC50 value of 2.1 μM (Figure 4B), compared with its IC50 value of 4.2 μM against the wild-type c-Met (Figure 4A). On the other hand, the known standard Met inhibitor SU 11274 was almost equipotent against both wild and mutant types of c-Met kinase, which provides another strength and potential therapeutic value to meleagrin’s c-Met inhibitory profile. The ability of meleagrin to inhibit the oncogenic c-Met mutant M1250T set the foundation for the future study of possible use of meleagrin-type scaffolds to control c-Met-dependent malignancies with higher expression levels of this mutant variant.
In-silico study was conducted in attempt to understand the binding mode and justify the activity of meleagrin versus other inactive biosynthetic precursor alkaloids 2 and 3. More than 20 c-Met crystal structures were published with and without ligands, revealing two general distinct binding modes for the ATP competitive inhibitors. Type-I ligands assume a U-shape geometry through the dual interactions with the hinge region Met1160 and the activation loop residue Tyr1230, unlike the less abundant type-II ligand inhibitors, which adopt an extended orientation and bind at one side only.36,37 The c-Met ATP binding site includes: [1] The hinge region including the most critical Met1160 and Pro1158 moieties. Interaction at this site is highly characteristic for all compounds targeting the ATP binding site.24,38 [2] The central hydrophobic region. [3] Two hydrophobic subpockets. [4] The c-Met activation loop including the critical Asp1222, Tyr1230, and Lys1245.24 Good binding affinity is expected for any c-Met active hit through interactions with at least one of Asp1222, Phe1223, or Tyr1230 at the activation loop and either of Pro1158, Met1160 or Ile1084 at the hinge region.24,38
In this study, the highly resolved c-Met kinase domain crystal structure PDB 2WD1, at a resolution of 2 Å, was used to assess the binding mode of meleagrin at the c-Met ATP binding pocket. To validate the docking results, the c-Met’s crystal structure 2WD1 ligand 4-azaindole (6) was docked into its ATP binding pocket by using the same docking parameters used with meleagrin docking.39 The ligand 6 mostly overlaid the original co-crystallized structure (Figure 5A). The imidazolidine ring of 1 exhibited one hydrogen bonding interaction via its N-14 NH group with the hinge region’s essential amino acid Ile1084 of the used c-Met crystal structure 2WD1 (Figure 5B). Furthermore, a strong π-π stacking interaction has also been observed within a 5Å distance between the Tyr1230’s aromatic ring at the activation loop and the meleagrin’s imidazole ring, thus hindering the Tyr1230 autophosphorylation necessary for the c-Met activation. This clearly shows the importance of the meleagrin’s imidazole ring, which is missing in both other alkaloids 2 and 3, justifying 1’s superior activity.
Figure 5.
A. The structure overlay and docking simulation of 1 (thick tube) and the ligand 6 (thin tube) at the crystal structure of the c-Met crystal structure PDB2WD1. B. Important HB interactions of meleagrin (1) at the ATP binding site of the same c-Met crystal structure. C. Important HB interactions of 1 at the ATP binding site of the M1250T mutant type c-Met crystal structure PDB2RF3.
The promising activity of meleagrin against the M1250T mutant-type c-Met in the Z′-Lyte biochemical assay, with 2-fold higher potency than the wild-type c-Met, initiated additional docking study to virtually justify such improved mutant-type c-Met inhibitory potency. The highly resolved c-Met kinase domain crystal structure PDB 2RFS was used. Selection of this particular crystal structure was based upon a previous study reporting this c-Met crystal structure which contains the nine known activating point mutations of the c-Met proto-oncogene, including M1250T.34,35 Meleagrin (1) showed a good fitting within the ATP binding pocket of the crystal structure 2RFS as expected, satisfying the same two critical interactions with Ile1084 in the hinge region and Tyr1230 at the activation loop, which were previously observed upon docking in the wild-type c-Met crystal structure 2WD1 (Figures 5B and 5C). However, an additional hydrogen bonding interaction between the N-14 NH of meleagrin’s imidazole ring and the backbone carbonyl group of Arg1208 (Figure 5C). Such additional hydrogen bonding interaction was not observed with the wild-type c-Met 2WD1 and appears to impart the improved binding affinity against the M1250T mutant c-Met. This could therefore explain, at least in part, the enhanced activity of meleagrin against the M1250T mutant type compared to the wild-type c-Met.
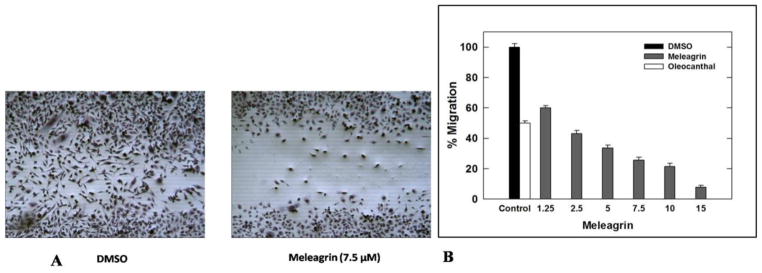
HGF/c-Met pathway dysregulation is known to activate migration and invasion of c-Met-dependent malignancies. To assess the effect of meleagrin on HGF-induced MDA-MB-231 cells migration, the wound healing assay was performed (Figure 6A). A 40 ng/mL dose of HGF significantly induced cellular migration with more than 85% wound closure after a 24 h treatment period. Figure 6A shows the ability of 1 to significantly suppress the HGF-induced cell migration in a dose dependent manner. Treatment of cells with 1.25, 2.5, 5, 7.5, 10, and 15 μM meleagrin for 24 h significantly inhibited the TNBC MDA-MB-231 cells’ migration in a dose-responsive manner, with an IC50 value of 1.8 μM (Figure 6B). This activity level is consistent with c-Met inhibitory activity.
Figure 6.
A. Antimigratory activity of meleagrin (1) against the TNBC MDA-MB-231 cells in WHA showing the comparison of DMSO vehicle control (left panel) and 7.5 μM treatment of 1 (right panel). B. Effect of 1 treatment on MDA-MB-231 cell migration in wound healing assay at different concentrations compared to DMSO as a negative vehicle control and (−)-oleocanthal (10 μM) as a positive control. Error bars indicate the SEM of n = 3/dose.
Compounds 1–3 were also tested for their ability to inhibit the invasiveness of MDA-MB-231 breast cancer cells using the Trevigen’s Cultre Coat® 96-well cell invasion assay. Pretreatment with 40 ng/mL HGF was used in the growth media as a mitogen to induce the cell invasiveness via c-Met activation. In this assay, two different concentrations for each compound were tested. Both 4 and 8 μM were used for meleagrin and 15 and 30 μM were used for each of roquefortine C and DHTD. The doses were selected based on the activity performance of compounds in the Z′-Lyte assay and their IC50 values in migration assays. Meleagrin was the most active hit, which significantly decreased the level of HGF-mediated cell invasion through the BME in a dose-responsive manner as compared to the vehicle-treated cells, which was also consistent with its c-Met kinase inhibitory activity in Z′-Lyte assay (Table 4, 1Figure 7). These results clearly correlate the c-Met phosphorylation inhibition of with the proliferation, migration, and invasion inhibition assays, reinforcing the hypothesis that c-Met inhibition can be a major molecular target and driving force for the bioactivity of meleagrin against the c-Met-dependent TNBC.
Table 4.
Anti-invasive activity of compounds 1–3 using Trevigen’s CultreCoat® invasion assay kit.
| Meleagrin (1) | Roquefortine C (2) | DHTD (3) | |||
|---|---|---|---|---|---|
| 4 μM | 8 μM | 15 μM | 30 μM | 15 μM | 30 μM |
| 30.7% | 57.5% | 47.6% | 79.3% | 46.1% | 83% |
Figure 7.
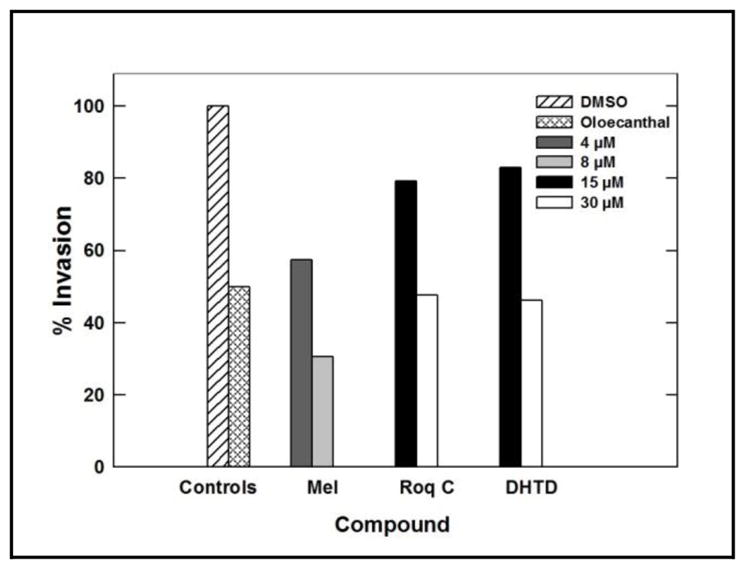
Anti-invasive activity of 1–3 against the metastatic TNBC cells MDA-MB-231 using the Trevigen’s CultreCoat® cell invasion kit model. DMSO was used a negative vehicle control and (−)-oleaocanthal (10 μM) was used as a positive control.25
Western blot analysis was conducted to assess the effect of meleagrin on the c-Met level in the TNBC MDA-MB-231 cells. Treatment with 15 and 30 μM doses 1 resulted in no effect on the total c-Met level, but resulted in a significant reduction in the phosphorylated (activated) c-Met level compared to the vehicle-treated control group (Figure 8). This may suggest that 1 mainly targets the c-Met activation but does not affect the expression level of c-Met.
Figure 8.
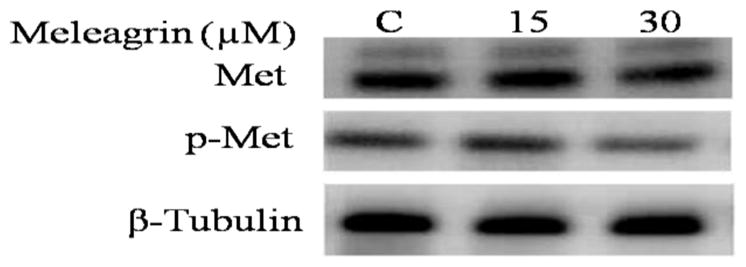
Western blot analysis of the treatment effect of 1 on the c-Met phosphorylation in the TNBC MDA-MB-231. Higher doses of meleagrin significantly reduced the activated level of c-Met (p-c-Met) but had no effect on the total c-Met level.
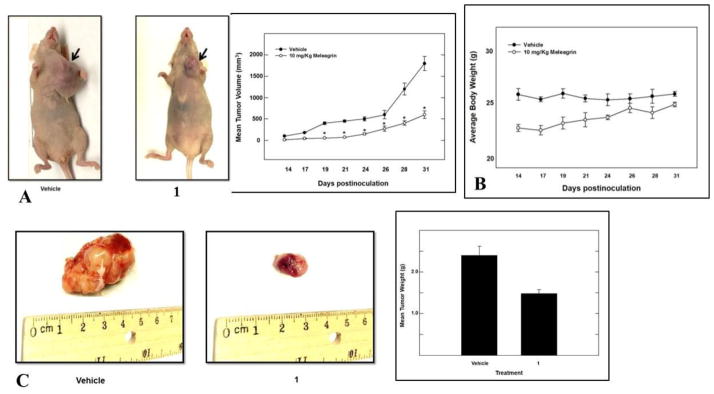
Meleagrin was considered the most promising in vitro hit among the isolated alkaloids and therefore was further selected for subsequent in vivo study to assess its antitumor potential. An orthotopic nude mouse model was selected and the human TNBC cell line MDA-MB-231/GFP was used. An i.p. dose of 10 mg/kg body weight was used 3 times per week, started on the 14th day post-inoculation and continued for 3 weeks. The growth of the breast tumor was compared with the non-treated animals (DMSO control group). Tumor progression was monitored by direct measurement of the tumor volume starting on the 14th day post-inoculation. Remarkably, meleagrin caused a significant reduction in the tumor volume and tumor growth by 65%, compared to the vehicle-treated control group (Figures 9A and 9C). This effect was not adversely affecting the treated mice’s normal body weight gains or their gross phenotype (Figure 9B), indicating that 1 lacks potential systemic toxicity and can demonstrate non-toxic efficacy against breast cancer in a clinically relevant orthotopic mouse model (Figures 9A and 9C).
Figure 9.
In vivo activity of meleagrin (1). A. Right panel: tumor volume was calculated and monitored over the study period for the treatment and vehicle groups. Left panel: comparison of the effect of 1 treatment versus the vehicle control on the tumor size in intact mice. Arrows indicate the tumor location. B. Monitoring control and treatment groups’ animal body weight over the experiment days showing no significant changes. C. Right pane: Bar graph representation of the comparison of the tumor weight in meleagrin treatment group versus the vehicle control group. Left panel: Photomicrographs of the excised primary breast tumors from the vehicle-treated mice group (left), and tumors excised from mice ip-treated with mealeagrin 10 mg/kg/3X/week (right).
Conclusion
Bioassay-guided fractionation of the endophytic fungus P. chrysogenum mycelia and media extracts identified meleagrin (1) as a significant wild and mutant c-Met inhibitor. This was correlated with antiproliferative, antimigratory, and anti-invasive activities against a wide panel of c-Met dependent breast cancer cells but was inactive against the c-Met independent breast cancer cells. The unique structural and pharmacophoric features of 1 justified its c-Met activity in-silico. Western blot analysis further confirmed p-c-Met as 1’s molecular target in the TNBC cell line MDA-MB-231. Meleagrin’s in vitro activity was further in vivo confirmed in a clinically relevant orthotopic mouse xenograft model. The unique pharmacophoric pattern and sustained fungal source supply render meleagrin as a potential lead for future development as a c-Met inhibitor for the control of c-Met-dependent malignancies.
Experimental
3.1. General
Thin layer chromatography (TLC) analysis was carried on pre-coated Si gel 60 F254 500 μm TLC plates (EMD Chemicals), using 1% p-anisaldehyde in concentrated H2SO4 and/or Dragendorff’s reagent as chemical visualizing reagents. For column chromatography, Si gel 60 (Natland International Corporation, 230–400 μm) and Sephadex LH-20 (Sigma-Aldrich) were used with gradient CH2Cl2-methanol mixtures as mobile phases. Generally, 1:100 ratios of mixtures to be chromatographed versus the used stationary phase were applied in all liquid chromatographic purifications. 1H and 13C NMR spectra were recorded in CDCl3, using tetramethylsilane (TMS) as an internal standard, on a JEOL Eclipse-ECS NMR spectrometer operating at 400 MHz for 1H NMR and 100 MHz for 13C NMR. The high-resolution ESIMS experiments were conducted using a JEOL JMS-T100 LP AccuTOF LC-Plus, equipped with an ESI source (JEOL Co. Ltd., Tokyo, Japan). ESI-MS detection was set using negative ion mode; needle voltage set at −2,000 V; and the ring lens and orifices-1 and 2 voltages set at −10, −35, and −7V, respectively. Nitrogen was used as the nebulizing and desolvation gas, and pressure was maintained constant at 0.608 MPa. Desolvation chamber and orifice-1 temperatures were set to 250 °C and 120 °C, respectively. Results were obtained using Mass Center software, MS-56010MP (JEOL).
3.2. Chemicals and reagents
All chemicals were purchased from Sigma-Aldrich (St. Louis, MO), unless otherwise stated. Organic solvents were purchased from VWR (Suwanee, GA), dried by standard procedures, packaged under nitrogen in Sure/Seal bottles and stored over 4 Å molecular sieves. HGF growth factor, used in cell assays, was acquired from PeproTech Inc. (Rocky Hill, NJ). Wild-type c-Met recombinant human protein and its oncogenic mutant variants were purchased from Life Sciences. Unless otherwise indicated, cell culture reagents were obtained from Life Technologies, Inc.
3.3. Taxonomic identification
The strain of fungus was isolated from an olive tree leaf, which was collected from Siwa oasis at the Egyptian western desert. Phenotypic and 18S-rDNA sequence analyses, morphological and chemotaxonomy investigations were used for taxonomic identification.40,41 The phylogeny of the isolated endophytic fungus was inferred by sequence comparison of its amplified internal transcribed spacer (ITS) region (GenBank accession number BankIt1845948 Seq1KT362139) with published sequences obtained from GenBank.40,41 The most related sequences were aligned, and a neighbor-joining tree was calculated. The isolated endophytic fungus identified as P. chrysogenum isolate MS15.
3.4. Fermentation, extraction, and isolation
P. chrysogenum was cultured on compound media-α liquid media (20 g sucrose, 5 g peptone, 5 g yeast extract, 5 g NaCl, 5 g Na2HPO4 in 1L). Thirty 2L Erlenmeyer flasks were prepared, each containing, 800 mL media and fermented for 14 days in static condition at room temperature. The collected mycelia were then freeze dried and extracted three times with CH2Cl2. The organic solvent was concentrated under reduced pressure to yield 5 g crude extract. The extract was subjected to CC (Sephadex LH20, CH2Cl2-MeOH, starting with 100% CH2Cl2 then 5%, 10/%, 20%, 30%, 40% and 50 %) to afford 7 fractions. Fraction 2 was fractionated over Si gel 60, eluting with CH2Cl2-MeOH (v/v, 9:1), then further purified using Sephadex LH-20 with CH2Cl2-MeOH (v/v, 9:1) to afford 1 (50 mg). Fraction 3 was fractionated on Si gel 60 using CH2Cl2 - MeOH (v/v, 8.5:1.5) then run preparative TLC over Si gel plate using solvent system: CH2Cl2-MeOH (v/v, 9:1) + 0.1%NH4OH solution to afford 2 (5 mg). Fraction 4 was applied on Si gel 60 using CH2Cl2-MeOH (v/v, 8:2), then further purified on Sephadex LH-20 using CH2Cl2-MeOH (v/v, 8:2) to afford 3 (4 mg).
3.5. In vitro assays
3.5.1. Cell lines and culture conditions
The human breast cancer cell lines MDA-MB-231 (ER−, PR−, HER2−), MDA-MB-468 (basal/ER−, PR−, HER2−), MCF-7 (luminal A/ER+, PR+/−, HER2−), SKBR3 (HER2/ER−, PR−, HER2+), BT-474 (luminal B/ER+, PR+/−, HER2+) and T-47D (luminal A/ER+, PR+/−, HER2−) were purchased from American Type Culture Collection (ATCC, Manassas, VA, USA), while the human breast cancer cell line MCF7-dox resistant was kindly provided by Dr. Yong-Yu Liu (Associate Professor of Pharmacology, School of Pharmacy, ULM, Monroe, Louisiana, USA). For in vivo xenograft study, the human breast cancer cell line MDA-MB-231/GFP was obtained from Cell Biolabs, Inc. (San Diego, CA). These cell lines were maintained in RPMI-1640 (GIBCO-Invitrogen, NY) supplemented with 10% fetal bovine serum (FBS), 100 U/mL penicillin G, 100 μg/mL streptomycin and 2 mmol/L glutamine in a 5% CO2 containing humidified atmosphere at 37 °C.25 The MCF10A cell line, an immortalized, non-tumorigenic human mammary epithelial cell line, was purchased from ATCC (Manassas, VA). MCF10A cells were maintained in DMEM/F12 supplemented with 5% horse serum, 0.5 μg/mL hydrocortisone, 20 ng/mL EGF, 100 U/mL penicillin G, 100 ng/mL cholera toxin, 100 μg/mL streptomycin, and 10 μg/mL insulin. For sub-culturing, cells were rinsed twice with sterile Ca2+ andMg2+-free phosphate buffered saline (PBS) and incubated in 0.25% trypsin containing 0.025% EDTA in PBS for 10 min at 37 °C.25 The released cells were centrifuged, re-suspended in fresh media and counted using hemocytometer. All cells were maintained at 37 °C in an environment of 95% air and 5% CO2 in humidified incubator. A stock solution was prepared by dissolving each tested analog in sterilized DMSO at a concentration of 20 mM for all assays and stored at 4 °C. Working solutions at their final concentrations for each assay were prepared inappropriate culture medium immediately prior to use. The vehicle (DMSO) control was prepared by adding the maximum volume of DMSO, used in preparing test compounds, to the appropriate media type such that the final DMSO concentration was maintained as the same in all treatment groups within a given experiment and never exceeded 0.1%.25
3.5.2. Measurement of viable cell number
Viable cell count was determined using the 3-(4,5-dimethylthiazol-2-yl)-2,5-diphenyl tetrazolium bromide (MTT) colorimetric assay. The optical density of each sample was measured at 570 nm on a microplate reader (BioTek, VT). The number of cells per well was calculated against a standard curve prepared at the start of each experiment by plating various concentrations of cells (1,000–60,000 cells per well), as determined using a hemocytometer.42
3.5.3. MTT proliferation assay
MDA-MB-231, MDA-468, BT-474, SKBR-3, MCF7, T-47D and MCF7-dox, in exponential growth, were plated at a density of 1×10⁴ cells per well (6 wells/group) in 96-well culture plates and maintained in RPMI-1640 media supplemented with 10% FBS and allowed to adhere overnight at 37 °C under 5% CO2 in a humidified incubator. The next day, cells were washed with PBS, divided into different treatment groups and then fed serum-free defined RPMI-1640 media containing 40 ng/mL of HGF as a mitogen and experimental treatments (containing various doses of the specific tested compound) or vehicle-treated control media and incubation resumed at 37 °C under 5% CO2 for 72 h. Cells in all groups were fed fresh treatment media every other day during the 72 h treatment period. Control and treatment media were then removed, replaced with fresh media, and 50 μL MTT solutions (1 mg/mL) was added to each well and plates were re-incubated for 4 h. At the end of the incubation period, the color reaction was stopped by removing the media and adding 100 μL DMSO to dissolve the formazan crystals formed. Incubation at 37 °C was resumed for up to 20 minutes to ensure complete dissolution of crystals. Absorbance was determined at λ 570 nm using an ELISA plate reader (BioTek, VT, USA). The IC50 value for each compound was calculated by non-linear regression (curve fit) of log (concentration) versus the % survival, implemented in GraphPad Prism version 5.0 (GraphPad Software, La Jolla, CA, USA). The % cell survival was calculated as follows: % cell survival = (Cell No. treatment/Cell No. DMSO) x 100%.25
3.5.4. MCF-10A cytotoxicity assay
The confluent monolayer MCF-10A cells were harvested and seeded into 96-well plate at density 2×10⁴ cells/well and left to recover.25 Cells were treated with test compounds at different concentrations in fresh serum-free media, each in triplicate, 24 h post seeding and then incubated at 37 °C in humidified atmosphere of 5% CO2 for 24 h. At the end of treatment, media were replaced by fresh ones containing 50 μL MTT (1 mg/mL in PBS) and incubated for further 4 h. The insoluble formazan crystals were solubilized in 100 μL of DMSO and absorbance was measured at 570 nm on microplate reader (BioTek, VT, USA). The average number of cells per well was calculated from the standard curve prepared by platting various cell concentrations at the start of the experiment.25
3.5.5. LDH cytotoxicity assay
The assay was accomplished in compliance with the manufacturer procedures after optimization regarding the number of cells per well and serum concentration.30 Briefly, the human metastatic breast cancer MDA-MB-231 cells were seeded into 96-well plate at a cell density of 3×10⁴ cells per well in 200 μL culture medium. Same volume of culture medium was added to three wells as background control. After cell recovery and attachment, media were removed and cells were treated with 200 μl of 5% serum culture media containing 1 at desired concentrations in triplicates. Triton X-100 (20 μL) 10% solution was added to three wells containing only the cells (maximum release) and 20 μl of assay buffer to other three cell-free wells (spontaneous release). The microplate was then incubated in a 5% CO2 humidified incubator at 37 °C for 24 h. Plate was then centrifuged at 400 x g for five minutes and 100 μL of cell supernatant were transferred to a new 96-well plate. Reaction buffer (100 μL of NAD+, lactic acid, INT, reconstituted diaphorase) was added to each well and the plate was incubated with gentle shaking for 30 minutes at room temperature. Finally, absorbance was measured at 490 nm using Synergy 2 microplate reader (BioTek, Vermont, USA). The percent cytotoxicity was calculated using the following formula:
3.5.6. Phosphorylation inhibition assay
Z′-LYTE™ Kinase Assay-Tyr6 Peptide kit (Life Sciences) was used to assess the ability of the isolated indole alkaloids to inhibit c-Met phosphorylation.24,25,34 Briefly, 20 μL/well reactions were set up in 96-well plates containing kinase buffer, 200 μM ATP, 4 μM Z-Lyte™ Tyr6 peptide substrate, 2500 ng mL−1 c-Met kinase and compound of interest as an inhibitor. After 1 h of incubation at rt, 10 μL development solution containing site-specific protease was added to each well. Incubation was continued for 1 h. The reaction was then stopped, and the fluorescent signal ratio of 445 nm (coumarin)/520 nm (fluorescein) was determined on a plate reader (BioTek FLx800™), which reflects the peptide substrate cleavage status and/or the kinase inhibitory activity in the reaction. The IC50 value for each compound was calculated by nonlinear regression of log concentration versus the % c-Met phosphorylation, implemented in GraphPad Prism version 5.0 (GraphPad Software, CA, USA).
3.5.7. Cell migration assay
Wound-healing assay was conducted as previously described.25,43 The confluent monolayer MDA-MB-231 cells were harvested and seeded onto a sterile 24-well plate then allowed to recover overnight. A scratch wound was inflicted using a sterile 200 μL pipette tip. Wounds were photographed on an inverted microscope connected to vista vision camera to measure the boundary of the wound at pre-migration. Subsequently, cells were treated with different concentrations of tested compound in serum starved media, each in triplicate, using DMSO as vehicle control. Incubation was carried out for 20–24 h till wound just about to close in control wells. Media was then aspirated and cells were fixed by methanol prior to staining with Giemsa stain. Images were captured for each wound (3 images/well) and processed by camera program (Liss View software) where the healed wound width was measured. Percent migration was calculated using the following equation:
The IC50 value for each compound was calculated by nonlinear regression of log concentration versus the % migration.
3.5.8. Cell invasion assay
Trevigen’s CultreCoat® 96 well cell invasion kit was utilized to assess the ability of the tested compounds to inhibit the invasion of metastatic human breast cancer MDA-MB-231 cells through basement membranes.25,44 The experiment was performed according to manufacturer procedure with optimization regarding the number of cells per well. Inserts were rehydrated by adding 25 μl of warm serum-free RPMI-1640 medium and incubated at 37 °C for 1h. Cells in cultural plates were starved in serum-free RPMI-1640 for 16 h prior to the assay. Cells were then harvested, resuspended and counted to prepare working concentrations in RPMI-1640 medium. To the top hydrated inserts, 25 μL of cell suspension (25,000 cells) were added, whereas 150 μL of 5 % serum media containing tested compounds or DMSO as vehicle control were added to the bottom wells. Plates were then gathered and incubated at 37 °C in a humidified CO2 incubator for 24 h. After incubation, the top chamber was inverted and carefully shacked to remove the media, and then transferred to receiver plate. Wells of the top chamber were washed with 100 μl washing buffer and placed back on receiver plate. Cell dissociation solution/calcein AM mixture (100 μl) were added to each well of bottom chamber and plate was re-incubated at 37 °C in a humidified CO2 incubator for 1 h. Finally, the top chamber was removed and the fluorescence of lower plate was measured at 485 nm excitation, 520 nm emission using Synergy 2 microplate reader (BioTek, Vermont, USA). Relative fluorescence units (RFU) were used to calculate the number of cells invaded the basement membrane in control and experimental wells using a standard curve that has been constructed prior the experiment.
3.6. Molecular modeling
The in-silico experiments were carried out using Schrödinger molecular modeling software package installed on an iMac 27-inch Z0PG workstation with a 3.5 GHz Quad-core Intel Core i7, Turbo Boost up to 3.9 GHz, processor and 16 GB RAM (Apple, Cupertino, CA, USA).
3.6.1. Protein structure preparation
Two X-ray crystal structures of the c-Met tyrosine kinase domain; (PDB codes: 2WD1 and 2RF3) were retrieved from the Protein Data Bank (www.rcsb.org). The Protein Preparation Wizard of the Schrödinger suite was implemented to prepare the c-Met kinase domain.31 The protein was reprocessed by assigning bond orders, adding hydrogen, creating disulfide bonds and optimizing H-bonding networks using PROPKA (Jensen Research Group, Copenhagen, Denmark). Finally, energy minimization with a root mean square deviation (RMSD) value of 0.30Å was applied using an Optimized Potentials for Liquid Simulation (OPLS_2005, Schrödinger, New York, USA) force field.
3.6.2. Ligand structure preparation
The chemical structure of meleagrin was sketched on the Maestro 9.3 panel interface (Maestro, version 9.3, 2012, Schrödinger, New York, USA). The LigPrep 2.3 module (LigPrep, version 2.3, 2012, Schrödinger, New York, USA) of the Schrödinger suite was implemented to generate the 3D structure and search for different conformers. The Optimized Potentials for Liquid Simulation (OPLS_2005, Schrödinger, New York, USA) force field was applied to geometrically optimize the ligand structure and to compute partial atomic charges. Finally, at most, 32 poses per ligand were generated with different steric features for the subsequent docking studies.
3.6.3. Molecular docking
The two prepared X-ray crystal structures of c-Met receptor tyrosine kinase domain were used to generate receptor energy grids applying the default value of the protein atomic scale (1.0Å) within the cubic box centered on the cocrystallized ligand of each crystal structure. After receptor grid generation, the prepared structure of the most active 1 was docked using the Glide 5.8 module (Glide, version 5.8, 2012, Schrödinger, New York, USA) in extra-precision (XP) mode.45
3.7. Protein extraction and Western blot analysis
Western blot experiments were conducted as previously described.46 Briefly, MDA-MB-231 cells were seeded at a density of 1×10⁶ cell/100 mm culture dish and incubated overnight to recover and attach at 37 °C in a 5% CO2 humidified incubator. Cells were treated either with meleagrin or DMSO as a vehicle control, in serum free media supplemented with HGF (50 ng/mL) for 48 h. Protein content was obtained using RIPA buffer (Thermo Fisher Scientific, Madison, WI). Samples were diluted with 2X Laemmli buffer (Biorad, Hercules, CA) prior to loading on gels. Protein lysates (30 μg) were electrophoresed on Mini-Protean® polyacrylamide gels (Biorad, Hercules, CA) using Tris/Glycine/SDS running buffer and then transferred to Immu-Blot® PVDF membranes (Biorad, Hercules, CA). Blotted membranes were blocked with 5% BSA (Cell Signaling Technology, Beverly, MA) in TBST (10 mM Tris-HCl, 150 mM NaCl, 0.1% Tween-20) for 2 h with agitation. Blots were then incubated overnight at 4 °C with appropriate primary antibodies (Cell Signaling Technology, Beverly, MA). Membranes were washed three times with TBST after incubation and reincubated with HRP-labeled secondary antibodies (Cell Signaling Technology, Beverly, MA) for 1 h. Chemiluminescence detection was performed using Supersignal West Pico solutions (Thermo Fisher Scientific, Madison, WI) and G. BOX imaging system with high resolution 100m pixel camera (Syngene, Fredrick, MD).
3.8. In vivo study using athymic nude xenograft mouse model
All animal experiments were approved by the Institutional Animal Care and Use Committee, University of Louisiana at Monroe, and were handled in strict accordance with good animal practice as defined by the NIH guidelines. Athymic nude mice (Foxn1nu/Foxn1+, 4–5 weeks, female) were purchased from Harlan (Indianapolis, IN).25 The mice had free access to standard pellet food and water. The animals were acclimated to animal house facility conditions at a temperature of 18–25 °C, with a relative humidity of 55–65% and a 12 h light/dark cycle, for one week prior to the experiments. MDA-MB-231/GFP human breast cancer cells were cultured and resuspended in serum-free DMEM medium (20 μL).25 After anesthesia, cell suspensions (1×10⁶ cells/20 μL) were inoculated subcutaneously into the second mammary gland fat pad just beneath the nipple of each animal to generate orthotopic breast tumor xenograft.25 About 48 h post-inoculation, the mice were randomly divided into two groups: i) the vehicle-treated control group (n = 5), ii) the meleagrin-treated group (n = 5). Treatment (3X/week) started 14 days postinoculation with intraperitoneally (i.p.) administered vehicle control (DMSO/saline) or 10 mg/kg meleagrin. The mice were monitored by measuring tumor volume, body weight, and clinical observation. Tumor volume (V) was calculated by V = L/2 x W2, where L is the length and W is the width of tumors.25 All mice were sacrificed on the 33rd day post-inoculation and the tumors were excised and weighed.
3.9. Statistics
The results are presented as the means ± SEM of at least three independent experiments. Differences among various treatment groups were determined by the analysis of variance (ANOVA) followed by Dunnett’s test using PASW statistics® version 18 (Quarry Bay, Hong Kong). A difference of p <0.05 was considered statistically significant as compared to the vehicle-treated control group. The IC50 values (concentrations that induce 50% cell growth and migration inhibition) were determined using a non-linear regression curve fitting analysis using GraphPad Prism software version 5 (La Jolla, CA, USA).
Acknowledgments
The Egyptian Ministry of Higher Education is acknowledged for supporting M.S.M.’s fellowship. Research reported in this publication was supported in-part by the National Cancer Institute of the National Institutes of Health under Award Number R15CA167475-01.
Footnotes
Publisher's Disclaimer: This is a PDF file of an unedited manuscript that has been accepted for publication. As a service to our customers we are providing this early version of the manuscript. The manuscript will undergo copyediting, typesetting, and review of the resulting proof before it is published in its final citable form. Please note that during the production process errors may be discovered which could affect the content, and all legal disclaimers that apply to the journal pertain.
References and notes
- 1.Kjer J, Debbab A, Aly AH, Proksch P. Nat Protoc. 2010;5:479. doi: 10.1038/nprot.2009.233. [DOI] [PubMed] [Google Scholar]
- 2.Strobel GA. Crit Rev Biotechnol. 2002;22:315. doi: 10.1080/07388550290789531. [DOI] [PubMed] [Google Scholar]
- 3.Antipova TV, Zhelifonova VP, Baskunov BP, Ozerskaya SM, Ivanushkina NE, Kozlovsky AG. Appl Biochem Microbiol. 2011;47:288. [Google Scholar]
- 4.Polonsky J, Merrien MA, Scott PM. Ann Nutr Aliment. 1977;31:963. [PubMed] [Google Scholar]
- 5.Ohmomo S, Oguma K, Ohashi T, Abe M. Ag Biol Chem. 1978;42:2387. [Google Scholar]
- 6.Steyn PS, Vleggaar R. J Chem Soc Chem Comm. 1983:560. [Google Scholar]
- 7.Musuku A, Selala MI, de Bruyne T, Claeys M, Schepens PJC, Tsatsakis A, Shtilman MI. J Nat Prod. 1994;57:983. [Google Scholar]
- 8.Clark B, Capon RJ, Lacey E, Tennant S, Gill JHJ. Nat Prod. 2005;68:1661. doi: 10.1021/np0503101. [DOI] [PubMed] [Google Scholar]
- 9.Kopp-Holtwiesche B, Rehm HJ. J Env Pathol Toxicol Oncol. 1990;10:41. [PubMed] [Google Scholar]
- 10.Aninat C, Hayashi Y, Andre F, Delaforge M. Chem Res Toxicol. 2001;14:1259. doi: 10.1021/tx015512l. [DOI] [PubMed] [Google Scholar]
- 11.Koizumi Y, Arai M, Tomoda H, Omura S. Biochim Biophys Acta. 2004;23:47. doi: 10.1016/j.bbamcr.2004.04.013. [DOI] [PubMed] [Google Scholar]
- 12.Nakajima S, Nozawa K. J Nat Prod. 1979;42:423. [Google Scholar]
- 13.Zheng CJ, Sohn M-J, Lee S, Kim W-G. PLoS One. 2013;8:e78922/1. doi: 10.1371/journal.pone.0078922. [DOI] [PMC free article] [PubMed] [Google Scholar]
- 14.Steyn PS. Tetrahedron. 1970;26:51. doi: 10.1016/0040-4020(70)85006-2. [DOI] [PubMed] [Google Scholar]
- 15.Du L, Li D, Zhu T, Cai S, Wang F, Xiao X, Gu Q. Tetrahedron. 2009;65:1033. [Google Scholar]
- 16.Du L, Feng T, Zhao B, Li D, Cai S, Zhu T, Wang F, Xiao X, Gu Q. J Antibiotics. 2010;63:165. doi: 10.1038/ja.2010.11. [DOI] [PubMed] [Google Scholar]
- 17.Effendi H. PhD dissertation. Heinrich-Heine-Universitat Dusseldorf; 2004. p. 53. [Google Scholar]
- 18.Musuku A, Selala MI, de Bruyne T, Claeys M, Schepens PJC, Tsatsakis A, Shtilman MI. J Nat Prod. 1994;57:983. [Google Scholar]
- 19.Ali H, Ries MI, Nijland JG, Lankhorst PP, Hankemeier T, Bovenberg RA, Vreeken RJ, Driessen AJ. PLoS One. 2013;8:e65328. doi: 10.1371/journal.pone.0065328. [DOI] [PMC free article] [PubMed] [Google Scholar]
- 20.Boyle P, Ferlay J. Ann Oncol. 2005;16:481. doi: 10.1093/annonc/mdi098. [DOI] [PubMed] [Google Scholar]
- 21.American Cancer Society. [Accessed June 1, 2015];Cancer Facts and Figures. 2015 http://www.cancer.org/research/cancerfactsstatistics/cancerfactsfigures2015/in.
- 22.Siegel RL, Miller KD, Jemal A. CA Cancer J Clin. 2015;65:5. doi: 10.3322/caac.21254. [DOI] [PubMed] [Google Scholar]
- 23.Furlan A, Kherrouche Z, Montagne R, Copin MC, Tulasne D. Cancer Res. 2014;74:6737. doi: 10.1158/0008-5472.CAN-14-1932. [DOI] [PubMed] [Google Scholar]
- 24.Elnagar A, Sylvester P, El Sayed K. Planta Medica. 2011;77:1013. doi: 10.1055/s-0030-1270724. [DOI] [PubMed] [Google Scholar]
- 25.Akl MR, Ayoub NM, Mohyeldin MM, Busnena BB, Foudah AI, Liu Y-Y, El Sayed KA. PLoS One. 2014;9:e97622. doi: 10.1371/journal.pone.0097622. [DOI] [PMC free article] [PubMed] [Google Scholar]
- 26.Cui JJ. ACS Med Chem Lett. 2014;5:272. doi: 10.1021/ml500091p. [DOI] [PMC free article] [PubMed] [Google Scholar]
- 27.Agwa ES, Ma PC. Cancer Manag Res. 2014;6:397. doi: 10.2147/CMAR.S37345. [DOI] [PMC free article] [PubMed] [Google Scholar]
- 28.Smyth EC, Sclafani F, Cunningham D. Oncotargets Ther. 2014;7:1001. doi: 10.2147/OTT.S44941. [DOI] [PMC free article] [PubMed] [Google Scholar]
- 29.Lee JH, Han SU, Cho H, Jennings B, Gerrard B, Dean M, Schmidt L, Zbar B, Vande Woude GF. Oncogene. 2000;19:4947. doi: 10.1038/sj.onc.1203874. [DOI] [PubMed] [Google Scholar]
- 30.Maemura M, Yoshimoto A, Tsukada Y, Morishita Y, Miyazawa K, Tanaka T, Kitamura N. Cancer Sci. 2006;97:1343. doi: 10.1111/j.1349-7006.2006.00335.x. [DOI] [PMC free article] [PubMed] [Google Scholar]
- 31.Ma PC, Kijima T, Maulik G, Fox EA, Sattler M, Griffin JD. Cancer Res. 2003;63:6272. [PubMed] [Google Scholar]
- 32.Zou HY, Li Q, Lee JH, Arango ME, McDonnell SR, Yamazaki S, Koudriakova TB, Alton G, Cui JJ, Kung PP, Nambu MD, Los G, Bender SL, Mroczkowski B, Christensen JG. Cancer Res. 2007;67:4408. doi: 10.1158/0008-5472.CAN-06-4443. [DOI] [PubMed] [Google Scholar]
- 33. [Accessed July 2015]; https://www.caymanchem.com/app/template/Product.vm/catalog/601170.
- 34.Bellon SF, Kaplan-Lefko P, Yang Y, Zhang Y, Moriguchi J, Rex K, Johnson CW, Rose PE, Long AM, O’Connor AB, Gu Y, Coxon A, Kim TS, Tasker A, Burgess TL, Dussault I. J Biol Chem. 2008;283:2675. doi: 10.1074/jbc.M705774200. [DOI] [PubMed] [Google Scholar]
- 35.Giordano S, Maffe A, Williams TA, Artigiani S, Gual P, Bardelli A, Basilico C, Michieli P, Comoglio PM. FASEB J. 2000;14:399. doi: 10.1096/fasebj.14.2.399. [DOI] [PubMed] [Google Scholar]
- 36.Schiering N, Knapp S, Marconi M, Flocco MM, Cui J, Perego R, Rusconi L, Cristiani C. Proc Natl Acad Sci U S A. 2003;100:12654. doi: 10.1073/pnas.1734128100. [DOI] [PMC free article] [PubMed] [Google Scholar]
- 37.Wang W, Marimuthu A, Tsai J, Kumar A, Krupka HI, Zhang C, Powell B, Suzuki Y, Nguyen H, Tabrizizad M, Luu C, West BL. Proc Natl Acad Sci U S A. 2006;103:3563. doi: 10.1073/pnas.0600048103. [DOI] [PMC free article] [PubMed] [Google Scholar]
- 38.Peach ML, Tan N, Choyke SJ, Giubellino A, Athauda G, Burke TR, Jr, Nicklaus MC, Bottaro DP. J Med Chem. 2009;52:943. doi: 10.1021/jm800791f. [DOI] [PMC free article] [PubMed] [Google Scholar]
- 39.Porter J, Lumb S, Franklin RJ, Gascon-Simorte JM, Calmiano M, Riche KL, Lallemand B, Keyaerts J, Edwards H, Maloney A, Delgado J, King L, Foley A, Lecomte F, Reuberson J, Meier C, Batchelor M. Bioorg Med Chem Lett. 2009;19:2780. doi: 10.1016/j.bmcl.2009.03.110. [DOI] [PubMed] [Google Scholar]
- 40.White TJ, Bruns T, Lee S, Taylor J. Amplification and direct sequencing of fungal ribosomal RNA genes for phylogenetics. In: Innis M, Gelfand D, Sninsky J, White T, editors. PCR Protocols: a Guide to Methods and Applications. Academic Press; Orlando, Florida: 1990. pp. 315–322. [Google Scholar]
- 41.Tamura K, Dudley J, Nei M, Kumar S. Mol Biol Evol. 2007;24:1596. doi: 10.1093/molbev/msm092. [DOI] [PubMed] [Google Scholar]
- 42.Mosmann T. J Immunol Meth. 1983;65:55. doi: 10.1016/0022-1759(83)90303-4. [DOI] [PubMed] [Google Scholar]
- 43.Rodriguez LG, Wu X, Guan JL. Methods Mol Biol. 2005;294:23. doi: 10.1385/1-59259-860-9:023. [DOI] [PubMed] [Google Scholar]
- 44. [Accessed June 10, 2015];Trevigen’s CultreCoat® cell invasion assay protocol. www.trevigen.com.
- 45.Friesner RA, Murphy RB, Repasky MP, Frye LL, Greenwood JR, Halgren TA, Sanschagrin PC, Mainz DT. J Med Chem. 2006;49:6177. doi: 10.1021/jm051256o. [DOI] [PubMed] [Google Scholar]
- 46.Elsayed HE, Akl MR, Ebrahim HY, Sallam AA, Haggag EG, Kamal AM, El Sayed KA. Chem Biol Drug Des. 2015;85:231. doi: 10.1111/cbdd.12380. [DOI] [PubMed] [Google Scholar]


