Abstract
The determination of the acid-base dissociation constants, and thus the pKa values, of α-keto acids such as pyruvic acid is complex due to the existence of these acids in their hydrated and non-hydrated or oxo-state. Equilibria involved in the hydration and dehydration of the α-keto group of pyruvic acid and three other α-keto acids, 3-methyl-2-oxobutanoic acid, 4-methyl-2-oxopentanoic acid, and 2-oxo-2-phenylacetic acid, were investigated by proton and carbon nuclear magnetic resonance spectrometry, NMR, at constant ionic strength, 0.15, and 25°C. Dissociation constants for the oxo (pKaoxo) and hydrated (pKahyd) acids of each compound were estimated from the change in the degree of hydration with changes in pH and directly from the changes in chemical shifts of various hydrogen and carbons nuclei with pH. α-Keto acids showed greater hydration in their acidic forms than their carboxylate forms. The degree of hydration was sensitive to steric and electronic/resonance factors. As expected, the oxo forms of the acids were stronger acids compared with their hydrated analogs, and their dissociation constants were also sensitive to steric and electronic factors.
Keywords: α-keto carboxylic acids, pyruvic acid, dissociation constants, hydration, NMR spectroscopy, UV/Vis spectroscopy, structure property relationship, non-linear regression
INTRODUCTION
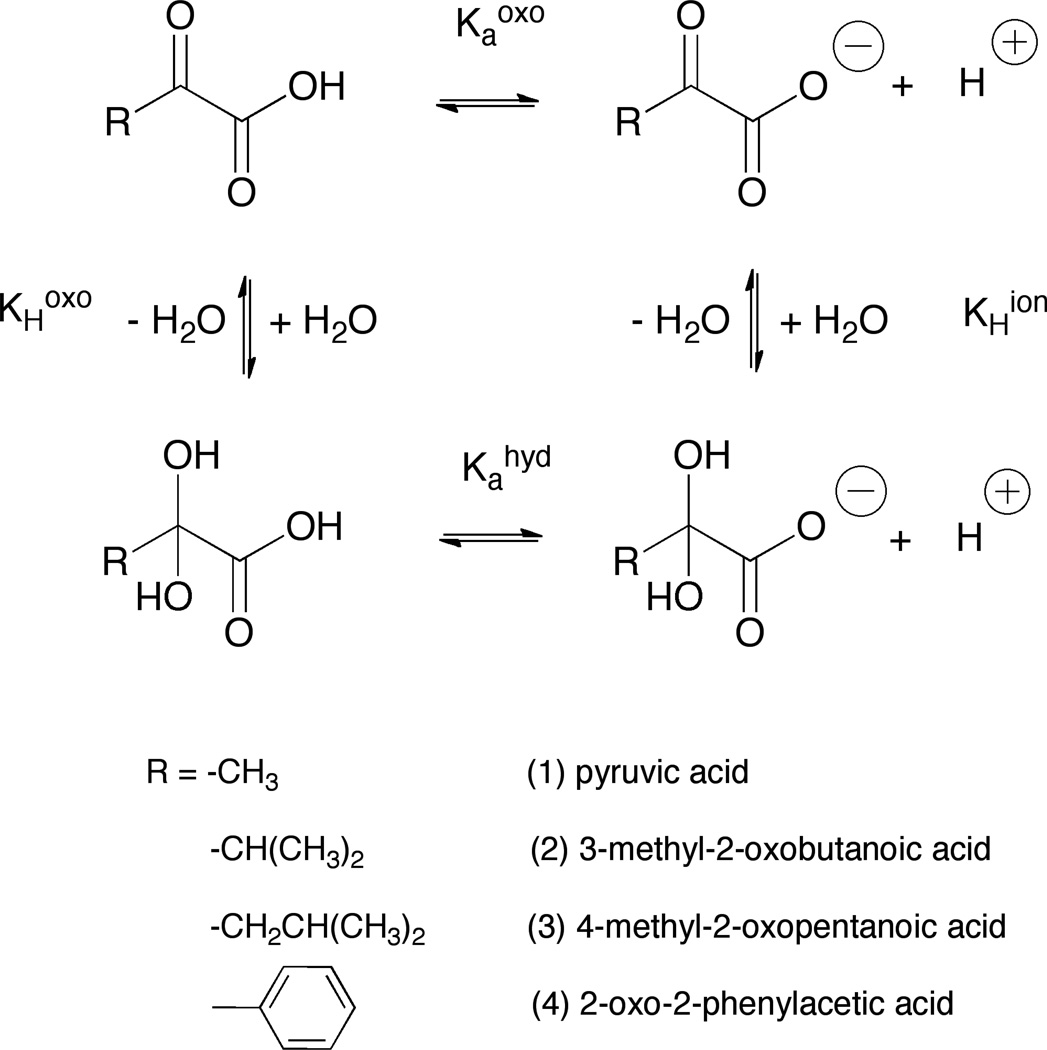
The objective of this study was to determine the acid-base dissociation constants of the oxo, or non-hydrated, and hydrated forms, and thus their pKaoxo and pKahyd values, respectively, and the hydration equilibrium constants of a series of α-keto acids 1–4 (Scheme 1) using both proton and carbon, nuclear magnetic resonance (NMR) spectrometry to follow the integration and shifts of various atoms in the molecules affected by changes in pH values.
Scheme 1.
Ionization and hydration equilibria of various α-keto acids, 1–4, inaqueous solution
Pyruvic acid (1) readily reacts with hydrogen peroxide to form acetic acid and carbon dioxide, and α-keto acids are of major importance in intermediary metabolism and as components of the Krebs cycle.1 Pyruvic acid plays an important role in vivo metabolic pathways, such as gluconeogenesis, transamination and fermentation. It can be involved in enzyme-catalyzed intracellular phenomena2 and converted into fatty acids or energy through acetyl-CoA. α-Keto acids are used as model substrates of enzymes and in the development of enzyme inhibitors.3 They have been used to treat some pathological conditions,4, 5, 6 and are of interest as biosynthetic precursors7 and intermediates in the syntheses.8
For many drugs and biological molecules,9 including α-keto acids, the apparent acid-base dissociation constant, Ka, and thus their pKa value, is an important physicochemical characteristic thought to be associated with biological activity and chemical reactivity and stability. It is known that most α-keto acids can exist in an equilibrium between their oxo-form and as their hydrated, gem-diol (Scheme 1) form, depending on the electron-withdrawing or donating properties and steric effects of the groups adjacent to the α-keto group, the center of the nucleophilic water addition reaction.10 Several values have been reported for the pKa of pyruvic acid (2.4 ± 0.2) and some other α-keto acids. The values represent composite values and reflect the acidities and the relative concentrations of the hydrated and oxo forms of the acids.11
The pKa of the non-hydrated acid, oxo- or keto-form, is not readily measured directly but can be determined from knowledge of the equilibrium of hydration of the protonated and deprotonated forms and the apparent macroscopic pKa or pKaobs values.12,13 A number of techniques have been used for the determination of the degree of hydration and the measurement of pKa values of α-keto acids. NMR represents the most powerful and unique of these techniques. Here, NMR was used to investigate and determine the equilibrium constants for hydration, and the, pKaoxo and pKahyd values of α-keto acids 1–4 (Scheme 1).10 By following the shifts of selected protons and carbons14 as a function of pH for both the acids, hydrated and oxo forms, the pKaoxo and pKahyd values could be determined directly.
MATERIALS AND METHODS
Materials
All the keto acids (Scheme 1) were purchased as their sodium salt, except 2-oxo-2-phenyl acetic acid (4), from Sigma-Aldrich (Milwaukee, WI, USA), as was deuterium oxide (99.96%). Tetramethylsilylpropionate (TMSP-d4) was purchased from Cambridge Isotopes Laboratories (Tewksbury, MA, USA), and methanol HPLC grade from Sigma-Aldrich were used as an internal and external standard for the NMR studies, respectively. Deionized water was used to prepare all the NMR samples. HCl 37% A.C.S. reagent purchased from Sigma-Aldrich and NaOH 10N purchased from Fischer Scientific (Pittsburgh, PA, USA).
Methods
The initial concentration of the acids used in the NMR samples was 150 mM in a volume of 0.5 mL of solvent (9:1 v/v H2O:D2O). All spectra were acquired using 5 mm NMR tubes. The α-keto acid solutions were titrated to the desired pH using concentrated hydrochloric acid and/or sodium hydroxide such that the final ionic strength was 0.15 with sodium chloride. The pH of each sample was measured directly in the NMR tube using a 5 mm pH electrode purchased from Wilmad Labglass (Vineland, NJ, USA). No correction was made for the deuterium isotope effect. The samples were stable during the analysis and no variation in spectra and pH values was observed when the runs were repeated.
One-dimensional 1H and 13C-NMR spectra for compounds 1–4 were acquired on a 400 or 500 MHz Bruker (Rheinstetten, Germany) spectrometer equipped with a X-channel observe quadruple nuclei probe or carbon-enabled cryoprobe, respectively. Sample temperature was set to 25°C.
Quantitative 13C NMR spectra15 for compounds 4 were acquired using the inverse gated 1H decoupling pulse sequence.16 To insure the integrals are quantitative, the interscan delay is set to 75 s, which is greater than 5*T1 as determined using the inversion recovery experiment.16 Data was processed with the software MestreNova (MestreLab Researcher, S. L., Santiago de Compostela, Spain).
Chemical shifts were referenced to the internal standard, TMSP-d4 or to the external standard methanol. The relative amount of the hydrated and non-hydrated keto acids was determined using the relative peak area measured by the global spectral deconvolution algorithm implemented in MestreNova software.17
Data fitting
Data fitting to estimate limiting hydration constants and Ka values was performed using GraphPad/Prism version 6.0 (GraphPad Software, La Jolla, CA, USA). Non linear least-squares regression analysis, choosing relative weighting (in order to minimize the weighted sum-of squares), was used to obtain best-fit values of the parameters described later in Eqs. 7 and 14.
RESULTS AND DISCUSSION
The reversible hydration of a series of α-keto acids 1–4 and their equilibria involved in ionization protonation of the oxo and hydrated forms (Scheme 1) in aqueous solution were investigated using 1H and 13C-NMR techniques. The hydration and dehydration kinetics, although fast, are considered in “slow exchange” on the NMR time scale, meaning that the lifetime of each specie is longer than the amount of time required to distinguish them, which equals the inverse of their chemical shift difference in Hz (on the order of milliseconds on a 400 or 500 MHz spectrometer). Thus one is able to see peaks in the NMR spectrum corresponding to both the hydrated and nonhydrated species.
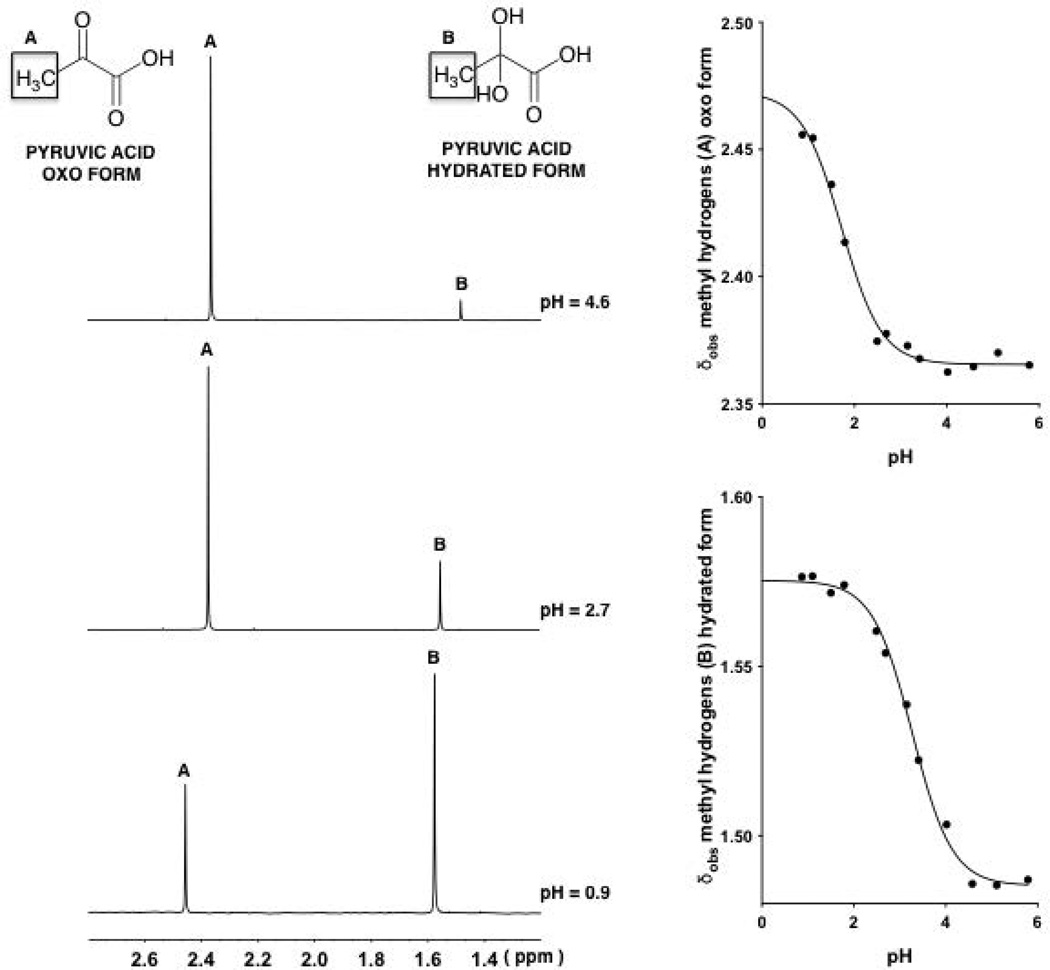
The 1H NMR spectra of pyruvic acid in aqueous solutions at 25°C are shown in Fig. 1 at pH values 0.9, 2.7 and 4.6.
Figure 1.
1H-NMR spectra (9:1 v/v H2O:D2O)of the methyl resonances of pyruvic acid (1, oxo form and its hydrate) at various pH values, 4.6, 2.7 and 0.9 (top to bottom on the left).Observed chemical shifts (δobs) of the signals arising from the methyl hydrogens associated with the oxo and hydrated forms of 1 plotted against pH (right). The two continuous lines with a sigmoidal shape are described by Eq. 14, fitting δobs values at different pH values.
Each spectrum shows two peaks at around 1.5 and 2.4 ppm, which are the expected signals for the methyl protons of pyruvic acid corresponding to the hydrated and oxo forms, respectively. The relative positions of the peaks are in agreement with this assignment inasmuch as the shielding of the methyl protons of the oxo would be predicted to be smaller than that for the corresponding methyl protons in the hydrated form. At pH 0.9, a higher fraction of the hydrated form exists than at pH 2.7 and 4.6. That is, the degree or fraction hydrated significantly decreased following the overall ionization of the α-keto acids to their deprotonated or carboxylate form. The 1H-NMR spectrum at different pH values also shows that the observed chemical shift (δobs) values of the peaks associated with both forms decreased following the ionization of the two forms of the acid. That is, the protonated and non-protonated forms are in fast exchange on the NMR time scale, meaning that one sees a weighted average, rather than individual peaks. The kinetics of this reaction must be much faster than hydration reaction.
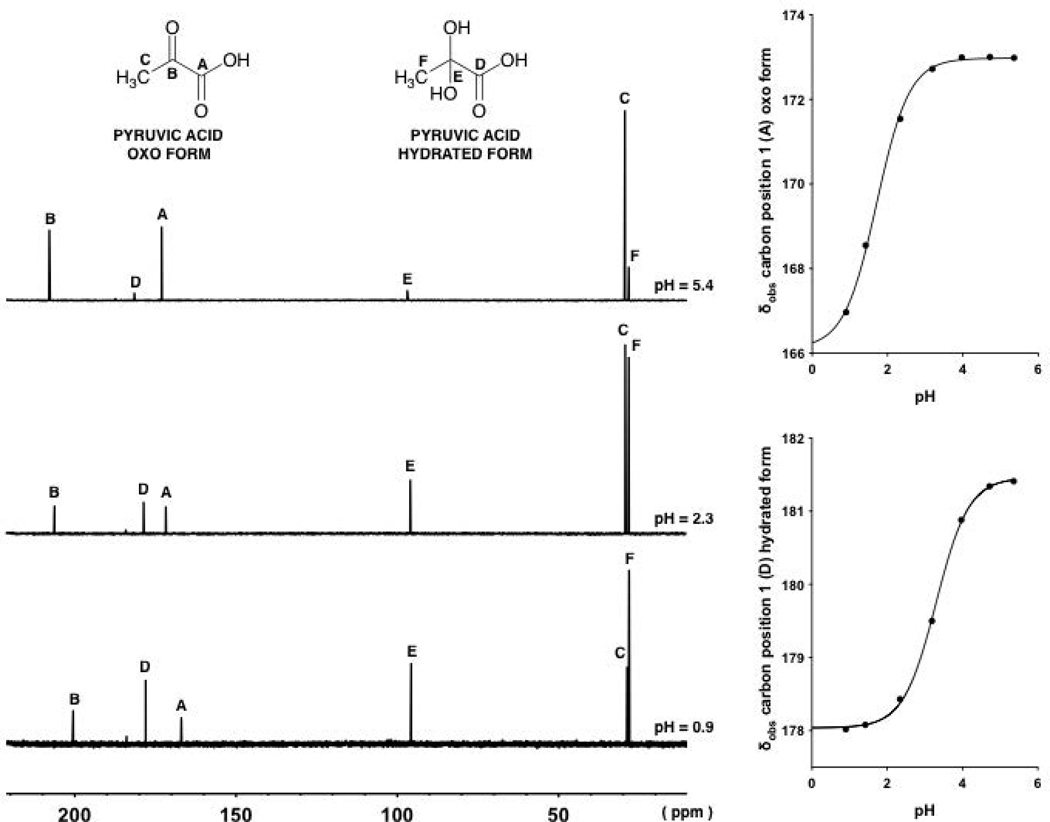
The 13C NMR spectra of pyruvic acid in aqueous solutions at 25°C are shown in Fig. 2 at pH values 0.9, 2.3 and 5.4.
Figure 2.
13C-NMR spectra of pyruvic acid (1, oxo form and its hydrate) at different pH values, 5.4, 2.3 and 0.9 (top to bottom on the left).Observed chemical shifts (δobs) of the signals arising from the carbon in position 1 associated with the oxo and hydrated forms of 1 plotted against pH (right).The two continuous lines with a sigmoidal shape are described by Eq. 14, fitting δobs values at different pH values.
Each spectrum shows six peaks, which are the signals for the CH3 carbons (28 and 29 ppm) of the hydrated and oxo forms, respectively; the carbon in position 2 (96 ppm) for the hydrated form; the carbon in position 1 (170 ppm) of the oxo form; the carbon in position 1 (184 ppm) for the hydrated form and the carbon in position 2 (200 ppm) associated with the oxo form. Figure 2 shows that the ionization of the α-keto acid (oxo and hydrated forms) occurs simultaneously with a downfield shift of the carbon signals, more evident for the α-carbon and carboxylic carbon peaks than for the CH3 carbon peaks.
Note, 1H and 13C NMR studies for pyruvic acid were conducted at pH values below 6 in order to avoid a degradation reaction seen at higher pH values. Investigations in our laboratories showed that an aldol-like condensation with a second molecule of pyruvic acid to form a dimer and subsequent oligomers occurred rather rapidly at neutral and alkaline pH values. This will be the subject of a later paper.
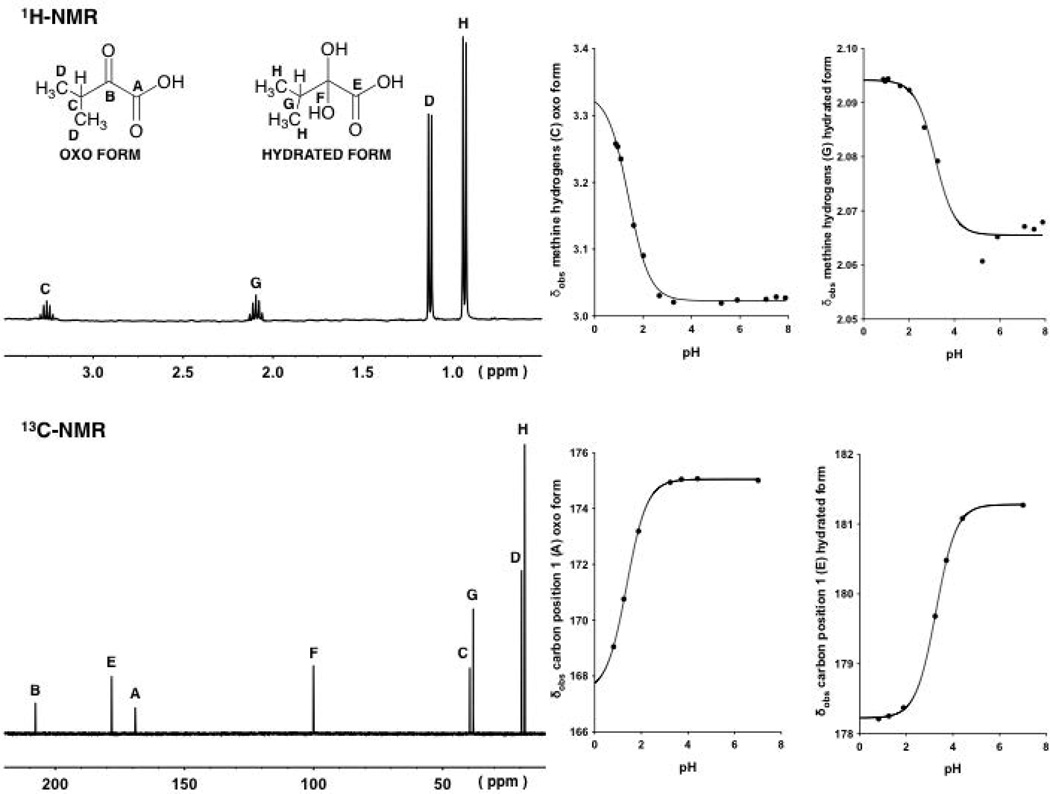
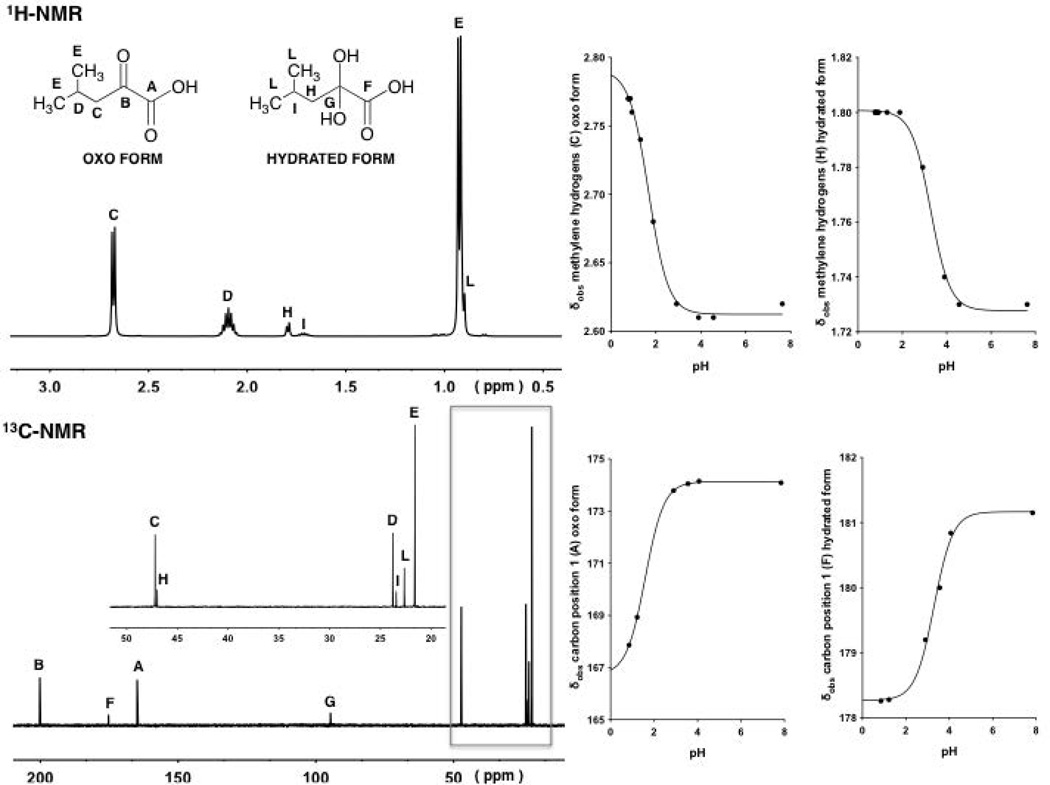
The 1H and 13C NMR spectra of α-keto acids 2 and 3 at different pH values showed the appearance of the peaks arising from the hydrogens and carbons (Figs. 3 and 4) associated with the hydrated and oxo forms. It can be seen that at different pH values the observed chemical shifts (δobs) values of the peaks associated with both forms changed following the ionization.
Figure 3.
1H-NMR and 13C-NMR of compound 2 at pH values at approximately 0.8 and 0.9, respectively (left).Observed chemical shifts (δobs) of the signals arising from the tertiaryhydrogensand the carbon in position 1 associated with the oxo and hydrated forms of 2 plotted against pH (right).The four continuous lines with a sigmoidal shape are described by Eq. 14, fitting δobs values at different pH values.
Figure 4.
1H-NMR and 13C-NMR of compound 3 at pH values at approximately 1.8 and 0.8, respectively (left). Observed chemical shifts (δobs) of the signals arising from the methylenehydrogens and the carbon in position 1 associated with the oxo and hydrated forms of 3 plotted against pH (right).The four continuous lines with a sigmoidal shape are described by Eq.14, fitting δobs values at different pH values.
From the analysis of the 1H NMR of compounds 1–3, it was possible to determine the degree of hydration at different pH values, using the relative peak area of methyl hydrogens for 1 and 2 and the peak area of the alkyl chain hydrogens (–CH2CH(CH3)2) for 3 associated with the oxo and hydrated form.
The observed equilibrium constants of hydration (KH) for compounds 1–3 were determined by measurements of their degrees of hydration at different pH values, by the integrated relative area of the protons resonance of the hydrated and oxo forms, Eq. 1:
| (1) |
where Phyd and Poxo are the hydrated and oxo forms of each compound.
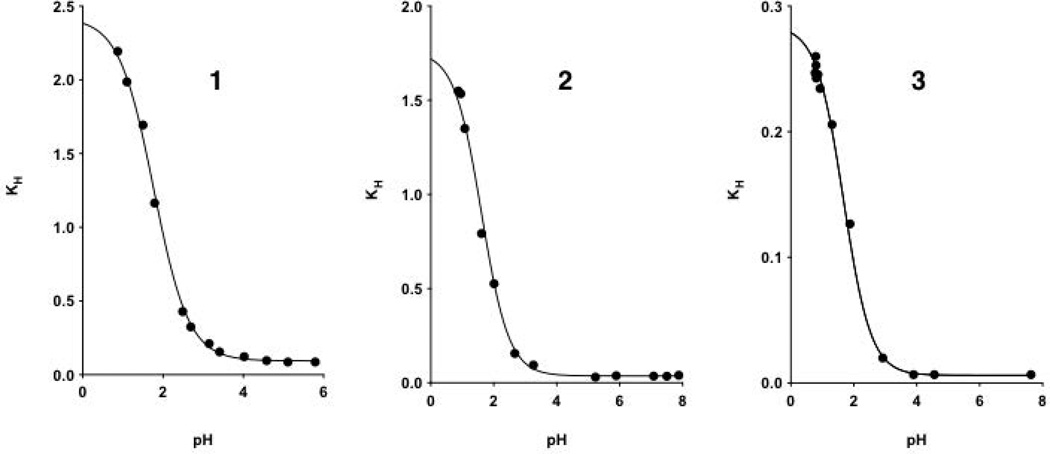
Figure 5 shows the plots of the changes in KH with changing pH values of compounds 1–3. The protonated forms of each compound are more hydrated than their respective carboxylated forms. Pyruvic acid (1) appeared more hydrated than compounds 2 and 3 both in their protonated (KHoxo, defined below) and deprotonated (KHion, defined below) forms (Table 1).
Figure 5.
Observed hydration equilibrium constants (KH) for compounds 1–3 plotted against pH.The continuous lines with a sigmoidal shape are described by Eq. 7, fitting KH values at different pH values.
Table 1.
KH and pKa values ± standard error (SE) for 1–4 at 25°C, ionic strength 0.15.
| Compound | pKaoxo± SE a | pKahyd± SE a | KHoxo± SE a | KHion± SE a | pKaoxo ± SE b | pKahyd± SE b | pKaoxo± SE c | pKahyd± SE c |
|---|---|---|---|---|---|---|---|---|
| 1 | 1.79 ± 0.06 | 3.23 ± 0.04 | 2.353 ± 0.000 | 0.087 ± 0.002 | 1.70 ± 0.09 | 3.27 ± 0.04 | 1.71 ± 0.04 d 1.72 ± 0.04 e 1.64 ± 0.02 d, f 1.65 ± 0.04 e, f |
3.25 ± 0.03 d 3.29 ± 0.02 e 3.24 ± 0.03 d, f 3.26 ± 0.03 e, f |
| 2 | 1.60 ± 0.09 | 3.29 ± 0.06 | 1.786 ± 0.183 | 0.037 ± 0.002 | 1.39 ± 0.06 | 3.12 ± 0.10 | 1.37 ± 0.02 d 1.38 ± 0.02 e |
3.27 ± 0.01 d 3.19 ± 0.05 e |
| 3 | 1.68 ± 0.05 | 3.35 ± 0.04 | 0.285 ± 0.011 | 0.006 ± 0.002 | 1.70 ± 0.07 g 1.68 ± 0.04 g |
3.28 ± 0.04 g 3.36 ± 0.11 g |
1.59 ± 0.08d 1.59 ± 0.02 e |
3.30 ± 0.07 d 3.26 ± 0.08 e |
| 4 | ND | ND | ND | ND | ND | ND | 1.82 ± 0.13 d 1.82 ± 0.15 e |
ND |
The equilibrium constant of hydration KHoxo, KHion and dissociation Kaoxo and Kahyd were determined from measurements of the degrees of oxo and hydrated form at different pH values by 1H-NMR. Equilibrium constants were calculated using Eqs 1, 7 and 8, as described above
Determined by the observed chemical shift (δobs) of the signals arising from methyl (1), methine (2) and methylene (3) associated with the hydrated and oxo forms, using 1H-NMR. The pKa values were calculated using eq. 14, as described above
Determined by 13C-NMR, by δobs of the signals arising from carbon in position 1
and position 2
associated with the hydrated and oxo forms. The pKa values were calculated using eq. 14, as described above
Determined in pure water using methanol as external reference
Signal for methylene hydrogens is split into a doublet
(ND) not determined
Dissociation constants (Ka) for compounds 1–3 in hydrated and non-hydrated form were then estimated from the determination of their hydration equilibrium constants as a function of solution pH changes (Table 1) as follows.
From the Scheme 1, the two equilibrium constants of hydration for the protonated (HA) and deprotonated (A−) forms of each compound can be defined by Eqs. 2 and 3:
| (2) |
| (3) |
and the dissociation constants for the oxo and hydrated forms can be defined by Eqs 4 and 5:
| (4) |
| (5) |
where [HAhyd] and [A−hyd] are the concentrations of protonated and deprotonated hydrated form and [HAoxo] and [A−oxo] are the concentrations of protonated and deprotonated oxo forms, respectively.
The hydration equilibrium is pH dependent, thus the changes in hydration determined by NMR then determines the overall apparent dissociation of the acids. At various pH values the observed equilibrium constants of hydration of compounds 1–3 requires one to consider the contribution of each specie in solution, hydrated and oxo forms, protonated and deprotonated respectively, as defined in the Scheme 1 and by Eq. 6:
| (6) |
The observed equilibrium constant of hydration can also be expressed as a function of [H+] and the acid dissociation constant for the oxo form by Eq. 7:
| (7) |
the dissociation constant of oxo form can be determined from the determination of the observed equilibrium constants of hydration at different pH values from a fit to Eq. 7.
The dissociation constant for the hydrated form of compounds 1–3 can then be calculated from Eq. 8:
| (8) |
The oxo form of each compound is a stronger acid than the hydrated form. The values for all the constants using this method are reported in Table 1.
Dissociation constants of α-keto acids 1–3 were also determined by chemical shift of the signals arising from methyl, methine and methylene hydrogens, respectively (Fig. 1, 3, 4) and from measurements of the chemical shift arising from carbon in position 1 (Fig. 2, 3, 4, 6) and position 2 of the oxo and hydrated forms at different pH values.
Figure 6.
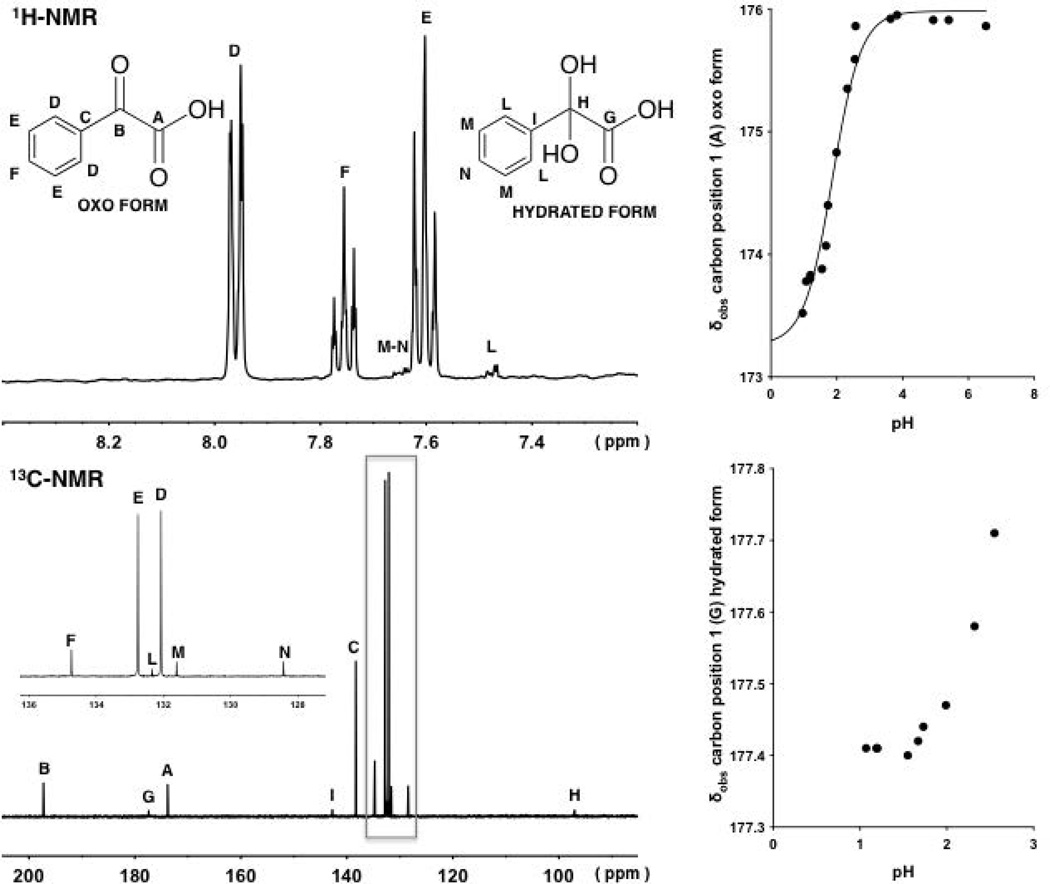
1H-NMR and 13C-NMR of compound 4 at pH values at approximately 1.5 and 1.2, respectively (left). Variation of the observed chemical shifts (δobs) of the signals arising from the carbon in position 1 associated with the oxo and hydrated forms of 4 at different pH values (right).The continuous line with a sigmoidal shape is described by Eq. 14, fitting δobs values at different pH values.
The pKa value for each specie can be determined from plots of the observed chemical shift (δobs) versus the pH using fits to the appropriate equations as follows. The observed chemical shift of a 1H or 13C NMR resonance can be expressed as the weighted average of the limiting chemical shift values, where the weighing factors are the pH-dependent mole fractions (f). The chemical shift versus pH data can be fitted using the follow Eq. 9:
| (9) |
where f and δ are the fraction and the chemical shift of protonated form (HA), and deprotonated form (A−) respectively of both the oxo or hydrated forms. The mole fractions fHA and fA− are described by Eqs. 10 and 11:
| (10) |
| (11) |
The mole fractions can then be expressed as a function of [H+] and the individual acid dissociation constants (Ka), assuming that activity coefficients are unity:
| (12) |
| (13) |
and, thus, the Eq. 9 can be redefined by Eq. 14:
| (14) |
where the Ka value defined in Eq. 14 represents the value for the specific specie being followed, that is, the hydrated or oxo-form. The pKa values for 1–3 using the fits to Eq. 14 are also reported in Table 1. One can see an excellent correlation between the values using both methods.
Concerns about a possible deuterium isotope effect, because of the presence of 10% D2O in the samples and the use of an internal standard on the acid-base equilibrium was evaluated. 13C-NMR analyses of pyruvic acid (1) at different pH values were performed in water, no D2O, and using methanol contained in a coaxial cylindrical tube, as an external reference. The observed chemical shifts (δobs) of the signals arising from the carbon in position 1 and 2 associated with the oxo and hydrated forms of 1 were plotted against pH and fitted according to Eq. 14. No significant difference was found between these values and those determined using 10% D2O and an internal standard (Table 1).
1H and 13C-NMR spectrum of 4 (Fig. 6) were also analyzed at different pH values. Because of the complexity of the aromatic proton signals of the oxo and hydrated forms and the difficulty to detect the signals arising from the carbon of the hydrated form at higher pH values (Fig. 6), the determination of KH values and the pKa of the hydrated form were not possible. Only the pKa value of the oxo form, and its standard error, were determined plotting the observed chemical shifts of the signals arising from the carbon in position 1 or 2 against pH and fitting to Eq. 14 (Table 1).
Quantitative 13C NMR spectra for 4 did show greater hydration in its acidic form compared to its carboxylate form (more than 10% of hydrated form was found at pH below 1 and only the oxo form was detected at pH values above 3), consistent with what was seen for the alkyl substituted α-keto acids. The loss of the coupling of the π-orbital overlap of the keto-carbonyl of 4 with the π-orbitals of the phenyl ring on hydration clearly reduces the degree of hydration for both the acid and carboxylate forms compared to 1–3. The steric effect of the aromatic ring of 4 to the addition of water on the carbonyl center may also contribute to the shift the equilibrium of hydration-dehydration to the energetically more favorable oxo form.
Data showing the shift of the carboxylic/carboxylate carbon signal for 4 with pH for both the oxo and hydrated species are shown in Figure 6.
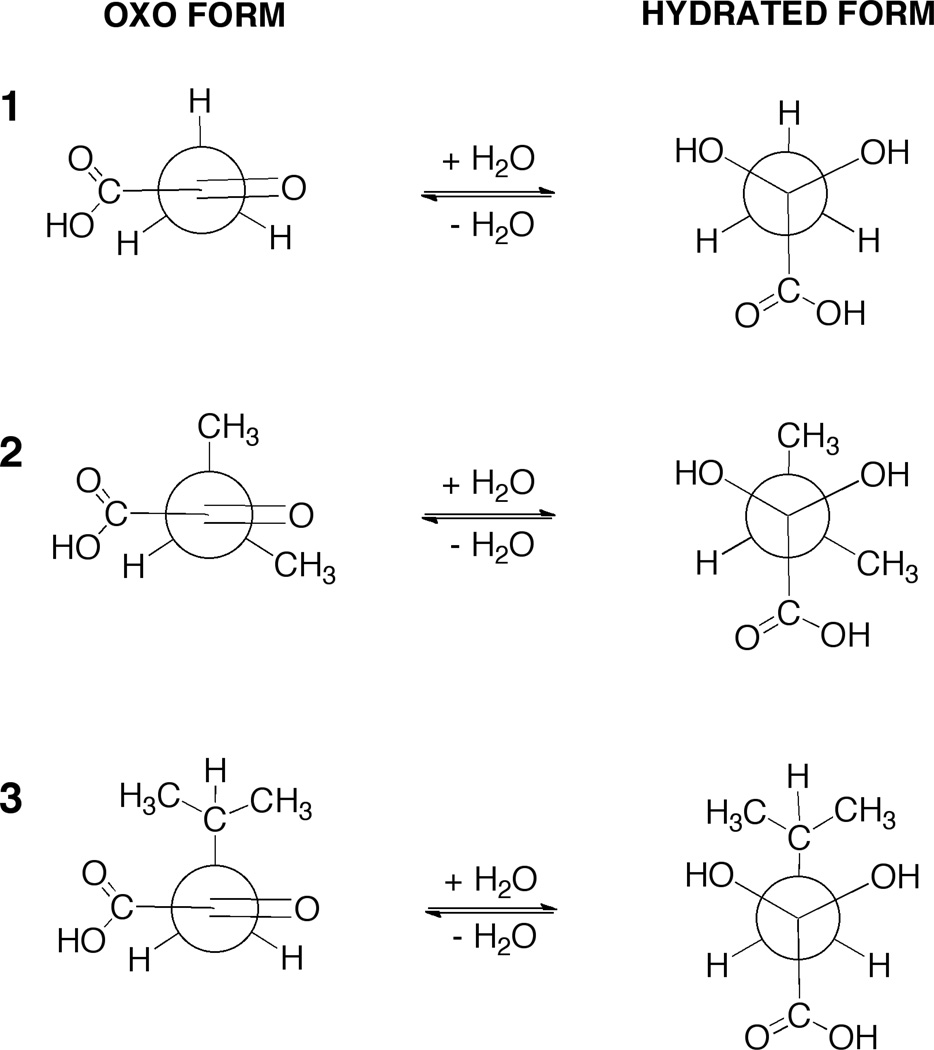
The variation in the degrees of hydration of the carbonyl compounds 1–3 may be, in part, explained on the basis of the inductive effect of the groups adjacent to the carbonyl atom (except in the case of 3). Methyl and carboxylate groups have a +I effect, hydrogen has zero I effect, and the carboxylic acid has –I effect.18 Electron withdrawing groups adjacent to the carbonyl group will help promote addition of a water molecule, whereas electron-donating groups will have the opposite effect. At pH below 1, as 1 and 2 are ~70% and ~60% hydrated, KHoxo values are greater then 2.3 and 1.7, respectively. The low value for hydration of compound 3 (KHoxo ~ 0.28) is likely because of steric hindrance to hydration and not purely due to indicative effects. Inspection of Newman projection (Fig. 7) provides some insight. In the staggered conformation the hydroxyl groups of hydrated 3 will interfere sterically with rotation of the –CH(CH3)2 grouping. This limits the number of conformations that hydrated 3 can take up as compared to hydrated 1 and 2. From entropic considerations this would result in a more positive ΔG° value for the hydration of 3 compared with that for hydration of 1 and 2.10
Figure 7.
Newman projection formulas for α-keto acids 1–3.Each of the hydrates is drawn in the staggered orientation.
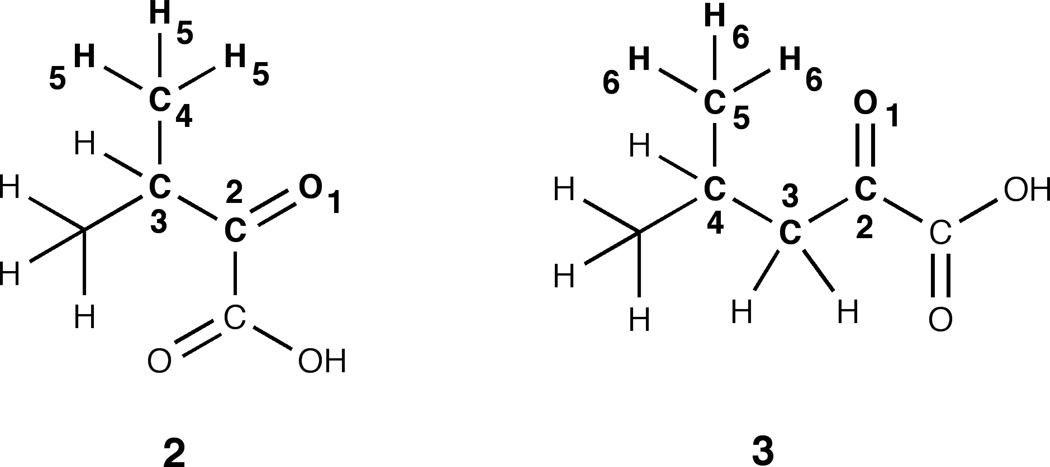
Moreover, the empirical rule of six proposed by Newman to explain the steric effect of atoms in the six position to the addition reaction of a reagent across a double bond, may be applied to the α-keto acids (Fig. 8). If the atoms in 3 are numbered consecutively starting with the α-carbonyl oxygen as one (the carbon in α position is the center of hydration reaction), the presence of hydrogens in the position-six must be considered an important contributory factor to the steric effect.19 This may help explain the greater degree of hydration of 2 than 3. Although some might consider 2 to be more sterically hindered, Newman’s rule of six, says the opposite. That is, in the case of 2, it has no “interfering” atoms in position-six.
Figure 8.
Newman’s rule of six appliedα-keto acids 2 and 3.In the reaction involving the addition of water to the unsaturated ketofunction (carbon 2), compound 3 presentsa greater steric effect than 2, due to the presence of multiple atoms, hydrogens, in the six-position.
Pyruvic acid (both oxo and hydrated forms) is a stronger acid than the analogous aliphatic carboxylic acid, propanoic acid (pKa ~ 4.87), and 2-hydroxypropanoic acid ((±) lactic acid) (pKa ~ 3.86).20 The presence of the electron-withdrawing substituents, α-keto group and the hydroxyl groups (one for the lactic acid or two for hydrated pyruvic acid) stabilize the deprotonated forms (anion) relative to the protonated forms (neutral), compared to the analogous unsubstituted carboxylic acid. As expected, compounds 1–3 are stronger acids in the oxo form than their hydrated analogs (Table 1). The pKa values at 25°C and ionic strength 0.15 for 1–3 in their oxo and hydrated forms also showed some variation with chain length but the effects were relatively mild compared to the effects on the degree of hydration. Even though, one was not able to determine the dissociation constants for compound 4 with accuracy, by analogy with compounds 1–3, the pKa value of the oxo form (pKaoxo = 1.82) is considerably lower than the value for the hydrated form due to the presence of the electron-withdrawing α-keto group. Kerber and Fernando11 reported a pKa value for the oxo form of 4 of 1.3. By analogy with carboxylic acids, benzoic acid and acetic acid, the presence of the aromatic ring enhances the deprotonation of the carboxylic group and results in a stronger acid, compared to acetic acid.
CONCLUSIONS
A unique application of 1H and 13C-NMR was used to determine acid dissociation and hydration equilibrium constants for the series of α-keto acids 1–3. For 4, the determination of the equilibrium constants of hydration and the microscopic pKa value in the hydrated form could not be determined. The pKa value in the oxo form could be estimated and its overall behavior was similar to 1–3.
ACKNOWLEDGMENTS
The authors would like to thank Richard Prankerd from Monash University for his valuable insight. Support for the NMR instrumentation was provided by NIH Shared Instrumentation Grant # S10RR024664, # S10RR014767 and NSF Major Research Instrumentation Grant # 0320648.
REFERENCES
- 1.Williamson JR, Walajtys-Rode E, Coll KE. Effects of branched chain α-ketoacids on metabolism of isolated rat liver cells. J Biol Chem. 1979;254:11511–11520. [PubMed] [Google Scholar]
- 2.Gray LR, Tompkins SC, Taylor EB. Regulation of pyruvate metabolism and human disease. Cell Mol Life Sci. 2014;71:2577–2604. doi: 10.1007/s00018-013-1539-2. [DOI] [PMC free article] [PubMed] [Google Scholar]
- 3.Cooper AJK, Ginos SZ, Meister A. Synthesis and properties of the α-keto acids. Chem Rev. 1983;83:321–358. [Google Scholar]
- 4.Mela-Riker L, Bardos D, Vlessis AA, Widener L, Muller P, Trunkey DD. Chronic hyperdynamic sepsis in the rat. II. Characterization of liver and muscle energy metabolism. Circ Shock. 1992;36:83–92. [PubMed] [Google Scholar]
- 5.Aussel C, Cynober L, Lioret N, Coudray-Lucas C, Vaubourdolle M, Saizy R, et al. Plasma branched-chain keto acids in burn patients. Am J Clin Nutr. 1986;44:825–831. doi: 10.1093/ajcn/44.6.825. [DOI] [PubMed] [Google Scholar]
- 6.Blonde’-Cynober F, Plassart F, De Bandt J-P, Rey C, Lim SK, Moukarbel N, et al. Metabolism of α-ketoisocaproic acid in isolated perfused liver of cirrhotic rats. Am J Physiol. 1995;268:E298–E304. doi: 10.1152/ajpendo.1995.268.2.E298. [DOI] [PubMed] [Google Scholar]
- 7.Tugarinov V, Kanelis V, Kay LE. Isotope labeling strategies for the study of high-molecular-weight proteins by solution NMR spectroscopy. Nat Protocols. 2006;1:749–754. doi: 10.1038/nprot.2006.101. [DOI] [PubMed] [Google Scholar]
- 8.Li LS, Wu YL. An efficient method for synthesis of α-keto acid ester from terminal alkynes. Tetrahedron Lett. 2002;43:2427–2430. [Google Scholar]
- 9.Bashford D, Karplus M. pKa’s of ionizable groups in proteins: atomic detail from a continuum electrostatic model. Biochemistry. 1990;29:10219–10225. doi: 10.1021/bi00496a010. [DOI] [PubMed] [Google Scholar]
- 10.Cooper AJL Redfield. Proton magnetic resonance studies of α-keto acids. J Biol Chem. 1975;250:527–532. [PubMed] [Google Scholar]
- 11.Kerber RC, Fernando MS. α-oxocarboxylic acids. J Chem Education. 2010;87:1079–1084. [Google Scholar]
- 12.Pocker Y, Meany JE, Nist BJ, Zadorojny C. The reversible hydration of pyruvic acid. I. Equilibrium studies. J Phys Chem. 1969;73:2879–2882. [Google Scholar]
- 13.Hellstrom N, Almqvist SO. Hydration and Dehydration of pyruvic acid. J. Chem. Soc. (B): Phys Org. 1970:1396–1400. [Google Scholar]
- 14.Fischer G, Flatau S, Schellenberger A, Zschunke A. 13C NMR investigations on the structure of α-keto acids in aqueous solution. J Org Chem. 1988;53:214–216. [Google Scholar]
- 15.Gouk SW, Cheng SF, Malon M, Ong ASH, Chuah CH. Critical considerations for fast and accurate regiospecific analysis of triacylglycerols using quantitative 13C NMR. Anal Methods. 2013;5:2064–2073. [Google Scholar]
- 16.Braun S, Kalinowski HO, Berger S. 150 and more basic NMR experiments: a practical course. Wiley-VCH: Weinheim; 1998. [Google Scholar]
- 17.Cobas C, Seoane F, Vaz E, Bernstein MA, Dominguez S, Perez M, Sykora S. Automatic assignment of 1H-NMR spectra of small molecules. Magn Reson Chem. 2013;51:649–654. doi: 10.1002/mrc.3995. [DOI] [PubMed] [Google Scholar]
- 18.March J. Advanced organic chemistry: reactions, mechanism, and structure. New York: McGraw-Hill; 1968. p. 21. [Google Scholar]
- 19.Newman MS. Some observations concerning steric factors. J Am Chem Soc. 1950;72:4783–4786. [Google Scholar]
- 20.Prankerd RJ. Data compilations. Appendix A. Main list. In: Brittain HG, editor. Profiles of drug substances, excipients, and related methodology. 1st ed. Vol. 33. 2007. p. 242 and 341. [DOI] [PubMed] [Google Scholar]


