
Figure 2. Proportion of HIV Positive Individuals Virally Suppressed and HIV Incidence Estimates (2001–2013).
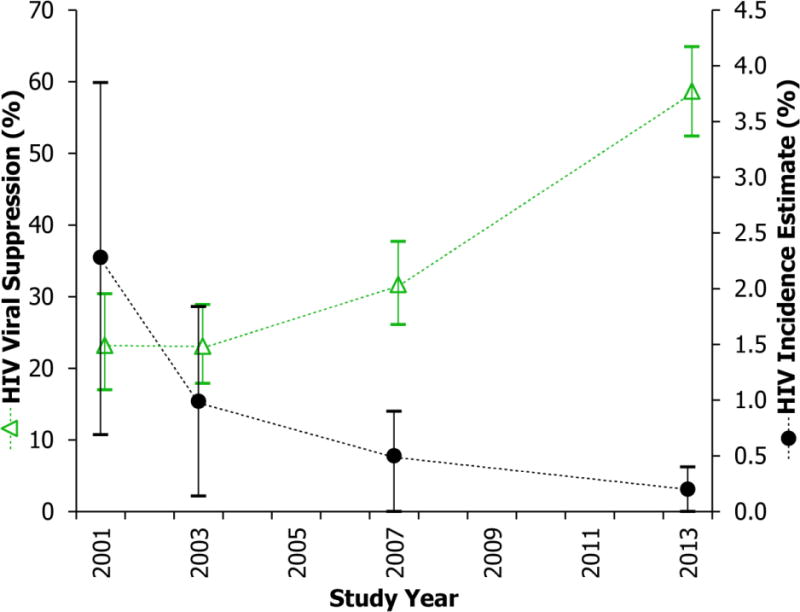
The green triangles denote the proportion of HIV positive patients with an HIV viral load <400 copies/mL in each identity-unlinked serosurvey. The black circles represent cross-sectional HIV incidence estimates determined by a validated multi-assay algorithm with a window period of 101 days and a 0% false-recent misclassification rate. Vertical lines indicate 95% confidence intervals.