

Key points
Direct connections between corticospinal (CS) axons and motoneurons (MNs) appear to be present only in higher primates, where they are essential for discrete movement of the digits. Their presence in adult rodents was once claimed but is now questioned.
We report that MNs innervating forearm muscles in infant rats receive monosynaptic input from CS axons, but MNs innervating proximal muscles do not, which is a pattern similar to that in primates.
Our experiments were carefully designed to show monosynaptic connections. This entailed selective electrical and optogenetic stimulation of CS axons and recording from MNs identified by retrograde labelling from innervated muscles. Morphological evidence was also obtained for rigorous identification of CS axons and MNs.
These connections would be transient and would regress later during development.
These results shed light on the development and evolution of direct CS–MN connections, which serve as the basis for dexterity in humans.
Abstract
Recent evidence suggests there is no direct connection between corticospinal (CS) axons and spinal motoneurons (MNs) in adult rodents. We previously showed that CS synapses are present throughout the spinal cord for a time, but are eliminated from the ventral horn during development in rodents. This raises the possibility that CS axons transiently make direct connections with MNs located in the ventral horn of the spinal cord. This was tested in the present study. Using cervical cord slices prepared from rats on postnatal days (P) 7–9, CS axons were stimulated and whole cell recordings were made from MNs retrogradely labelled with fluorescent cholera toxin B subunit (CTB) injected into selected groups of muscles. To selectively activate CS axons, electrical stimulation was carefully limited to the CS tract. In addition we employed optogenetic stimulation after injecting an adeno‐associated virus vector encoding channelrhodopsin‐2 (ChR2) into the sensorimotor cortex on P0. We were then able to record monosynaptic excitatory postsynaptic currents from MNs innervating forearm muscles, but not from those innervating proximal muscles. We also showed close contacts between CTB‐labelled MNs and CS axons labelled through introduction of fluorescent protein‐conjugated synaptophysin or the ChR2 expression system. We confirmed that some of these contacts colocalized with postsynaptic density protein 95 in their partner dendrites. It is intriguing from both phylogenetic and ontogenetic viewpoints that direct and putatively transient CS–MN connections were found only on MNs innervating the forearm muscles in infant rats, as this is analogous to the connection pattern seen in adult primates.
Key points
Direct connections between corticospinal (CS) axons and motoneurons (MNs) appear to be present only in higher primates, where they are essential for discrete movement of the digits. Their presence in adult rodents was once claimed but is now questioned.
We report that MNs innervating forearm muscles in infant rats receive monosynaptic input from CS axons, but MNs innervating proximal muscles do not, which is a pattern similar to that in primates.
Our experiments were carefully designed to show monosynaptic connections. This entailed selective electrical and optogenetic stimulation of CS axons and recording from MNs identified by retrograde labelling from innervated muscles. Morphological evidence was also obtained for rigorous identification of CS axons and MNs.
These connections would be transient and would regress later during development.
These results shed light on the development and evolution of direct CS–MN connections, which serve as the basis for dexterity in humans.
Abbreviations
- AAV
adeno‐associated virus
- CFP
cyan fluorescent protein
- ChR2
channelrhodopsin‐2
- CS
corticospinal
- CST
corticospinal tract
- CTB
cholera toxin B subunit
- E
embryonic day
- ECFP
enhanced cyan fluorescent protein
- EYFP
enhanced yellow fluorescent protein
- GFP
green fluorescent protein
- HDC
high divalent cations
- LED
light‐emitting diode
- MN
motoneuron
- P
postnatal day
- PB
phosphated‐buffer
- PFA
paraformaldehyde
- PSD
postsynaptic density
- YFP
yellow fluorescent protein
Introduction
In higher primates, direct connections between corticospinal tract (CST) axons and spinal motoneurons (MNs) play a key role in the control of fine hand movements (Porter, 1987; Bortoff & Strick, 1993; Lemon et al. 2002; Lemon, 2008). Although the strength of these connections varies among primate species (Kuypers, 1982; Lemon & Griffiths, 2005), direct cortico‐motoneuronal connections may be a unique feature of primates. Few, if any, such connections have been found in the other mammalian species studied, for example in carnivores (Lloyd, 1941; Asanuma et al. 1971; Illert et al. 1976).
Direct CS axon–MN synapses in the rat have been reported once, but doubt was later cast on that finding. This electrophysiological study reported that cervical MNs show monosynaptic responses to cortical stimulation (Elger et al. 1977). However, it was later questioned whether only the CST was stimulated (Porter & Lemon, 1993), and in a subsequent study no monosynaptic EPSPs were recorded from cervical MNs in response to contralateral pyramid stimulation (Alstermark et al. 2004). Nonetheless, upon morphological examination using light microscopy, direct CS connection was suggested by the close apposition of CS fibre boutons and MNs (Liang et al. 1991; Raineteau et al. 2002). In addition, investigators using electron microscopy have reported direct CS–MN synaptic contacts (Curfs et al. 1996), though more recent electron microscopic observations questioned whether direct synapses form between CS axons and MNs, and it was suggested that primary afferents were mistaken for CS axons in the earlier study (Yang & Lemon, 2003). In any case, all of these studies were done in adult rats.
In earlier studies, we used in vitro co‐cultures of cerebral cortex and spinal cord slices prepared from rats or mice to show that CS axons extend to nearly all of the spinal grey matter at the initial stages of development, but then later regress mainly from the ventral horn (Ohno et al. 2004, 2010). Similar regressive events during development were seen in vivo in both rats and mice (Kamiyama et al. 2006, 2015). These observations raise the possibility that CS axons make direct, and presumably transient, connections with MNs at an early postnatal stage in rodents. In the present study, we used electrophysiological, morphological and optogenetic methods to test this possibility with acute slices of the cervical spinal cord prepared from early postnatal rats (P7–P9).
Methods
Animals
All experiments were performed in accordance with the National Institutes of Health Guide for the Care and Use of Laboratory Animals (8th edition) and were approved by the Institutional Animal Care and Use Committee at Teikyo University School of Medicine (No. 10‐007). All efforts were made to minimize the number of animals used. Wistar rats of both sexes were used for electrophysiological and morphological examination on postnatal days 7–9 (P7–P9). This study is based on data from 116 rats and includes data from optical recordings (n = 9, Fig. 1), electrical stimulation studies (n = 94, Figs 1 and 2), optogenetic studies (n = 11, Figs 3, 5 and 6) and immunohistochemical studies of the contact between synaptophysin‐expressing CS axons and MNs (n = 2, Fig. 4).
Figure 1. Monosynaptic EPSCs elicited in cervical MNs by electrical stimulation of the CST .

A, schematic drawing of the experimental arrangement. Transverse cervical spinal cord slices of (C7–C8) were prepared from P7–P9 animals. The CST fibres were electrically stimulated, and whole‐cell recordings were made from MNs retrogradely labelled with Alexa 488‐CTB injected into distal or proximal target muscles. Inset: photomicrograph of fluorescently labelled MNs. B, optical imaging of CST‐evoked postsynaptic potentials recorded in the hemilateral spinal cord. Responses occurred 13.2 ms after the stimulation (left) and disappeared after electrolytic lesion (right). The black oblique bar on the spinal cord surface is a string holding the slice. C, neurofilament‐immunostaining of the slice in B, where the hemilateral part is shown (the yellow dotted rectangle). % ΔF/F, fluorescence change by stimulation / baseline fluorescence (%). The electrolytic lesion is restricted to within the dorsal column. The area enclosed by the white rectangle, which includes the dorsal column, is magnified in the right panel. D, representative traces of CS‐EPSCs recorded from MNs labelled with CTB‐Alexa 488 injected into forearm muscles voltage clamped at –90 mV. Each black trace is the average of 10 traces (original traces are shown in grey). The upper traces were recorded in normal ACSF, the lower ones in ACSF containing high concentrations of divalent cations (HDC; 7 mm Ca2+, 3 mm Mg2+). E, membrane currents recorded at –90 mV from a proximal muscle MN where monosynaptic CS‐EPSCs were not recorded. The upper 5 traces were recorded without stimulation. The middle 5 traces were recorded before, during and after 10 repetitive stimuli (arrows, interval 10 ms) over a span of 170 ms. The lower 5 traces were recorded after the perfusate was changed from normal ACSF to HDC. F, schematic drawing of the location of the stimulating electrodes. The distance of the dorsal edge of the CST from the tip of the stimulating electrode for CST (2) was nearly 175 μm. The location of Ia stimulation in the middle part of the dorsal column was 175 μm (1) from the dorsal edge of the CST. The location of the electrode shift over the midline to the contralateral CST is also shown (see text). G, responses to stimulation of the middle part (1) (ascending fibres, including Ia fibres) and the ventralmost part (the CST) of the dorsal column. Both types of stimulation evoked monosynaptic EPSCs, but with different latencies, in forearm MNs under HDC‐ACSF. The latency of responses to CST stimulation was significantly shorter than that to Ia stimulation (insets).
Figure 2. Distribution of monosynaptic CS‐EPSC‐positive and ‐negative motoneurons .
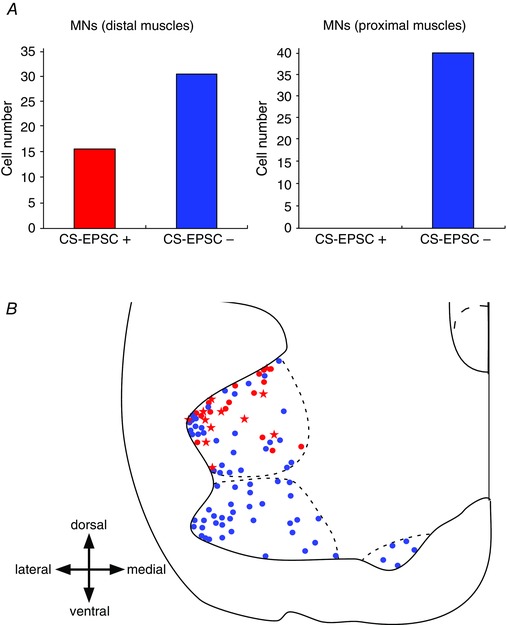
A, summary graphs showing the numbers of CS monosynaptic EPSC‐positive and ‐negative neurons innervating distal (forearm) and proximal (pectoralis major and serratus anterior) muscles. B, locations of the monosynaptic CS‐EPSC‐positive (red) and ‐negative (blue) neurons examined using electrical stimulation. Red and blue dots indicate the centres of the somata of those neurons. Stars indicate the neurons where monosynaptic CS‐EPSCs were evoked by optogenetic stimulation. The fine dotted lines indicate the borders of the forearm, pectoralis major and serratus anterior MN groups, and were drawn based on the findings obtained after injection of CTB‐Alexa 488 into each muscle group, with reference to the atlas of MN pools (Watson et al. 2012).
Figure 3. Optogenetic stimulation of CS axons .
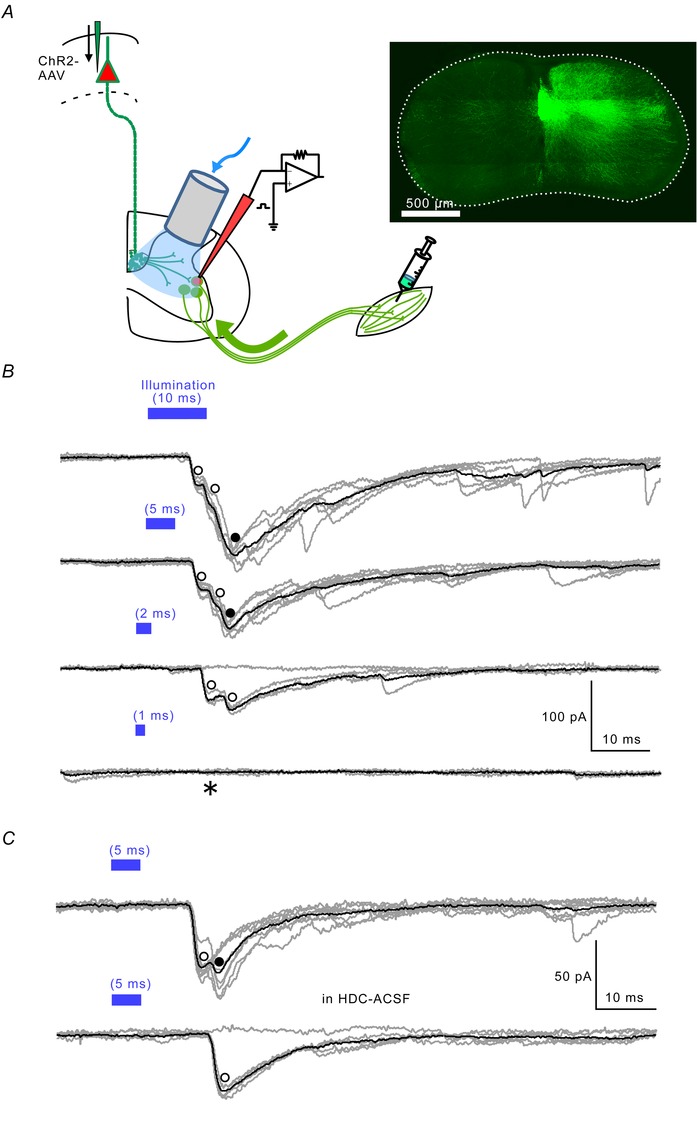
A, schematic drawing similar to Fig. 1 A . AAV vector (pAAV‐CaMKIIα‐hChR2(H134R)‐EYFP) was injected into the unilateral cortex on P0. CTB‐Alexa 488 was injected into the muscle groups on P4–P6. The slice was illuminated with blue LED light through an optical fibre. Inset: EYFP‐ChR2‐containing axons at the C8 level in a transverse cord section stained with anti‐GFP antibody. The dotted line indicates the contour of the spinal cord. B, the illumination durations and the evoked EPSCs in a MN in normal ACSF. The duration of the light pulse (blue bars) was progressively shortened to the indicated times. Open circles indicate definite monosynaptic responses, filled circles those that may be polysynaptic (see text). Illumination of 1 ms evoked a no response (*). C, monosynaptic EPSCs in HDC‐ACSF obtained from another MN. Latencies generally increased in HDC solution, where membrane excitability was lower (Frankenhaeuser & Hodgkin, 1977). EPSC amplitude also depended on the level of ChR2 expression.
Figure 5. Close apposition between CS axons and MN dendrites where monosynaptic CS‐EPSCs were recorded .

A, bright field micrograph of a transverse slice of hemilateral spinal cord where monosynaptic EPSC responses were recorded from a cell stained red by Neurobiotin‐NeutrAvidin‐Texas Red injected during the recording. B, magnification of the area within the white rectangular box in A. Shown is immunostaining of ChR2‐EYFP‐containing CS axons (green) and the traced image of the dendritic arbor of the MN (red). Ca–c, images taken from the white box C in B. Ca, fluorescence image of NeutrAvidin‐Texas Red labelling of Neurobiotin injected during recording. Cb, the soma was also retrogradely labelled with Alexa 488‐CTB injected into a forearm muscle. Cc, merged image of Ca and b. D and E, close apposition of the distal (D) and proximal (E) dendrites of a recorded cell to ChR2‐EYFP‐containing axons: Da and Ea, images of Neurobiotin‐NeutrAvidin‐Texas Red fluorescence; Db and Eb, immunostaining for ChR2‐EYFP; Dc and Ec, the merged images. These are magnified images of the small white boxes labelled D and E in B.
Figure 6. Close apposition of CS axon and PSD‐95 puncta on a MN dendrite where monosynaptic CS‐EPSCs were recorded .

A, immunostaining of a ChR2‐EYFP‐containing CS axon. B, immunostaining of PSD‐95. C, merged image of A and B. D, fluorescence image of streptavidin‐Alexa 546 labelling of Neurobiotin. E, merged image (A, B and D). Each image is a single optical scan. The three spots are on a MN making contact with ChR2‐expressing axons expressing PSD‐95 (arrows).
Figure 4. Close apposition of synaptophysin‐ECFP‐containing CS terminals to a MN .

A, CS axons containing ECFP were stained with anti‐GFP antibody and detected with a 2nd antibody conjugated with Texas Red. This image was made from 26 Z‐stack images. MNs were retrogradely labelled with CTB‐Alexa 488 (green) in the C7 spinal cord on P7. The white line indicates the contour of the spinal cord. B, CS axons labelled with Texas Red. To eliminate non‐specific staining near the surface, Z projections of 5 serial images were made from the same Z‐stack images used in A. The dotted line indicates the border between the white and grey matter. C, MN pools located in the dorsolateral ventral horn. Shown is an expanded image of the area within the white box in A. D, close contact between a proximal dendrite of a MN and a bouton‐like putative presynaptic terminal of a CS axon (arrow). Shown is an expanded image of the area within the white box in C.
Retrograde labelling of cervical MNs
On P4–P6, rats were anaesthetized using 2.8% isoflurane, after which an incision was made in the skin to expose the target muscles. To retrogradely label particular MN pools in the cervical spinal cord, we used a 10 μl Hamilton syringe (Hamilton, Reno, NV, USA) fitted with a 27 G needle (Terumo, Tokyo, Japan) to inject targeted muscles with cholera toxin subunit B‐conjugated Alexa Fluor 488 (CTB‐Alexa 488; Life Technologies, Carlsbad, CA, USA) diluted to 1 mg ml−1 in phosphate‐buffered saline (PBS). The injected muscles included distal muscles (forearm muscles (1 μl × 4–5 sites): extensor carpi ulnaris/radialis, extensor digiti, flexor carpi ulnaris/radialis, flexor digitorum profundus, palmaris longus), proximal muscles (pectoralis major muscle (1 μl × 4 sites)) and the serratus anterior muscle (1 μl × one site). After closing the incision with cyanoacrylate adhesive, the animals were returned to the dam. MN pools were adequately labelled 48–72 h after injection (Kondo et al. 2006). Using a fluorescence microscope, we then examined the distribution of injected dye and found that the Alexa 488 fluorescence had not spread to untargeted muscles (data not shown). However, because the serratus anterior muscle is very small around P8 and the CTB‐Alexa 488 signal was weak, we did not obtain reliable observations of the serratus anterior muscle. In a preliminary experiment using an adeno‐associated virus (AAV)‐green fluorescent protein (GFP) vector injected into the serratus anterior muscle of the same age rats, the subscapularis and teres major muscles showed weak GFP fluorescence on P35 (data not shown). We therefore conclude that dye injected into the serratus anterior muscle would in this study spread slightly to subscapularis and teres major muscles, though all three muscles are shoulder muscles.
Cervical spinal cord slices
Rats were anaesthetized with urethane intraperitonealy (i.p) (1.2–1.5 g kg−1 i.p.) on P7–P9 and a laminectomy was performed. The C5–Th1 spinal cord block was excised and transferred to oxygenated (95% O2–5% CO2) ice‐cold (<4°C) cutting solution containing (in mm): 234 sucrose, 2.5 KCl, 1.25 NaH2PO4, 10 MgSO4, 0.5 CaCl2, 26 NaHCO3, 11 d‐glucose, 1 kynurenate (pH 7.4). Transverse slices (450–600 μm thick) of the C6–C8 cervical segments were cut using a Linearslicer (PRO7; Dosaka EM, Kyoto, Japan), transferred to a slice chamber, submerged and perfused for more than 1 h at 15 ml min−1 with oxygenated artificial cerebrospinal fluid (ACSF) composed of the following (in mm): 119 NaCl, 2.5 KCl, 1 NaH2PO4, 1.3 MgCl2, 2.5 CaCl2, 26 NaHCO3, 20 d‐glucose, pH 7.4.
Electrophysiology
A bipolar stimulating electrode was inserted into the ventralmost part of dorsal column (Fig. 1 A), and current pulses (amplitude, principally 140 μA, see Results; width, 100 μs) applied at 0.1 Hz were used to stimulate the CS axons.
MNs labelled with CTB‐Alexa 488 were identified by illumination through a 470–495 nm excitation filter and dichroic mirror using a mercury lamp (100 W), and the fluorescent emission was viewed using a CCD camera (Hamamatsu Photonics, Hamamatsu, Japan) through an absorption filter (510–550 nm, U‐MNIBA3 mirror unit; Olympus, Tokyo, Japan). Whole cell currents were recorded from the fluorescent MNs using patch electrodes fabricated from borosilicate glass pipettes (GC150F‐10; Harvard Apparatus, Edenbridge, UK). The resistance of the electrodes filled with internal solution was 5–6 MΩ. The internal solution contained (in mm): 128 caesium gluconate, 20 CsCl, 10 N‐2‐hydroxyethylpiperazine‐N ′‐2′‐ethanesulfonic acid (Hepes)‐CsOH (pH 7.2–3.0), 0.2 EGTA, 2 ATP (Mg2+ salt) and 0.2 GTP (Na+ salt); osmolarity was adjusted to 280 mosmol l−1. All of the solutions contained 50 μm N‐(2‐aminoethyl) biotinamide hydrochloride (Neurobiotin; Vector Laboratories, Burlingame, CA, USA), enabling visualization of MNs and their dendritic arborization (see Immunocytochemistry section). Voltage and current clamp experiments were carried out using an Axopatch 200B patch clamp amplifier (Axon Instruments, Union City, CA, USA). Data were stored on a computer after digitization using an AD converter with Clampex software (Axon Instruments). To confirm the viability of each recorded neuron, at the end of each experiment, we tested whether the cell generated spikes with an overshoot upon injection of current.
All data are presented as the mean ± SEM. Student's t test and the partly paired t test were used for statistical testing.
Optical recordings
Slices of the C6–C8 cervical segments were stained with 0.2 mm Di‐4‐ANNEPS (Life Technologies), a fluorescent voltage‐sensitive dye. The dye stock and staining solutions were prepared as described by Tominaga et al. (2000). Slices were incubated with the dye for 25–30 min in a humid, oxygen‐saturated chamber. The stained slices were rinsed several times with oxygenated ACSF and then maintained in oxygenated ACSF for more than 1 h before recordings were made.
Changes in the fluorescence of the voltage‐sensitive dye were measured using a high‐speed CCD camera system (MiCAM02; Brainvision, Tokyo, Japan). Slices were illuminated through a 510–550 nm excitation filter and dichroic mirror using a tungsten–halogen lamp (100 W), and the fluorescence emission was captured through an absorption filter (λ > 575 nm long‐pass, U‐MWIG2 mirror unit, Olympus). The CCD‐based camera had an 8.4 mm × 6.5 mm imaging area consisting of 96 × 64 pixels. Images were obtained through a ×10 water immersion objective lens (LUMPlan Fl numerical aperture (NA) = 0.3; Olympus), which covered a unilateral area of the transverse spinal cord slice. The acquisition time was 2.2 ms for each of the 514 frames chosen (total light exposure time was 1130 ms). The light exposure was shutter‐controlled to cut unnecessary exposure during the interval between measurements. Optical responses evoked by electrical stimulation of the ventralmost part of the dorsal column at 0.1 Hz (see Electrophysiology section) were recorded and at least 25 responses were averaged.
Criteria for monosynaptic EPSCs
We used the following criteria to define monosynaptic EPSCs: (i) the EPSC onsets had fixed latencies with no noticeable jitter (Doyle & Andresen, 2001; Rose & Metherate, 2005; Vrieseling & Arber, 2006), (ii) the recorded EPSCs consistently followed the same time course, including the time to peak and decay time, without failure (Berry & Pentreath, 1976; Sah & Nicoll, 1991; Doyle & Andresen, 2001), and (iii) the responses were recorded in the presence of high concentrations of divalent cations (HDC; 7 mm Ca2+, 3 mm Mg2+), which suppress polysynaptic responses by increasing the threshold for spike generation (Frankenhaeuser & Hodgkin, 1957; Jahr & Jessell, 1985; Jahr & Yoshioka, 1986; Miles & Wong, 1987; Sah & Nicoll, 1991; Crepel & Ben‐Ari, 1996).
Viral production and photoactivation
A plasmid vector encoding human codon optimized ChR2 (hChR2) fused with enhanced yellow fluorescent protein (EYFP) (pAAV‐CaMKIIα‐hChR2(H134R)‐EYFP) was a kind gift from Dr Deisseroth (Stanford University, Stanford, CA, USA). Adeno‐associated virus (AAV) 1 vectors were produced as described previously (Kamiyama et al. 2015). The final particle titres were 4.8 × 10⁹ viral genomes (vg) per microlitre. Using a microinjector (Pneumatic PicoPump PV820; World Precision Instruments, Sarasota, FL, USA), the viral solution (0.3 μl) was stereotaxically injected into two targeted sites in the left sensorimotor cortex, 550 μm below the cortical surface, on P0. The coordinates were 1.5 mm lateral and 0.6 mm anterior, and 2.2 mm lateral and 1.3 mm anterior to the bregma. We adjusted these coordinates in the P0 rat brain to cover the forearm area identified in adult rats using the intracortical microstimulation method (Neafsey & Sievert, 1982).
For photoactivation of ChR2‐containing CS axons, we used a blue light‐emitting diode (LED; 465 nm, LEX2‐B; Brainvision) controlled by a stimulator (SEN‐7203; Nihon Kohden, Tokyo, Japan). The emitted blue light was guided into an optical fibre 0.5 mm in diameter (Edmund Optics Japan, Tokyo, Japan) (Campagnola et al. 2008), which was positioned using a micromanipulator. The estimated power density of the LED light was 8.9 mW mm−2 at the slice surface.
Exo utero electroporation
To label presynaptic terminals of CS neurons in the spinal cord, exo utero electroporation (Saito, 2006) was used to transfect an expression plasmid (pBluscript‐β‐actin‐synaptophysin‐ECFP, a gift from Shigeo Okabe, Tokyo University) encoding synaptophysin fused with enhanced cyan fluorescent protein (ECFP) into CS neuronal progenitor cells that projected to C7–C8 as previously described (Ohno et al. 2010, Kamiyama et al. 2015) with some modifications. On embryonic day 15.5 (E15.5), fetuses within the amniotic membrane were exposed by incision of the uterine wall after laparotomy. Using a glass micropipette (60 μm in diameter), 1 μl of the plasmid (1.5 mg ml−1 in PBS) was injected into the lateral ventricle, the wall of which contains CS neuron progenitors at this stage (Saito & Nakatsuji, 2001). The positive paddle of a tweezer‐type electrode (3 mm in diameter, Nepagene, Ichikawa, Japan) was then placed in a dorsofrontal position with respect to the cerebral hemisphere, across the amniotic membrane. This localized the region of transfection because the plasmid DNA moves toward the positive electrode and enters the cells facing the lateral ventricle on the side of the positive electrode (i.e. dorsofrontal side) through pores generated by electric pulses (Saito, 2006). Immediately after injection, before diffusion of the plasmid out of the injection site (Saito & Nakatsuji, 2001), four square‐wave electric pulses (40 V pulses, duration 50 ms, frequency 1 Hz) were delivered. Progenitors of the brainstem neurons projecting to the spinal cord are generated in the walls below the third ventricle and are thus distant from the lateral ventricle; moreover, those cells leave that region to differentiate before E15.5 (Altman & Bayer, 1980 a,b,c,d, 1981). Consequently, no brainstem neurons were transfected during this procedure. The fetuses were then returned to the abdominal cavity, and the abdominal wall of the dam was sutured, after which the dam was allowed to recover on a heating pad for 1 h. The fetuses were sutured and allowed to develop in the abdominal cavity until E21.5, after which the pups were collected by Caesarean section and brought up by foster mothers. On P4, CTB‐Alexa 488 was injected to forearm muscles as above. Seven days after Caesarean section (P7), the pups were transcardially perfused with 4% paraformaldehyde (PFA) in 0.1 m phosphated buffer (PB) (PFA–PB).
Immunocytochemistry
Neurobiotin in the recorded MNs and ChR2‐EYFP in the CS axons
After injection of Neurobiotin tracer during whole‐cell recordings, the cord slices were fixed with 4% PFA–PB, washed twice for 10 min in 50 mm PBS containing 0.1% Triton X‐100, and then left overnight with gentle shaking at 4 °C in 0.1% Triton X‐100 PBS containing NeutrAvidin‐Texas Red (1:500 dilution; Life Technologies), anti‐green fluorescent protein (GFP) antibody (rabbit IgG, 1:1000 dilution; MBL, Nagoya, Japan) and 5% skimmed milk (Morinaga, Tokyo, Japan). After washing three times in PBS, free‐floating slices were incubated with CY5‐conjugated anti‐rabbit IgG (1:200 dilution; Jackson ImmunoResearch, West Grove, PA, USA) in 0.1% Triton X‐100 PBS. Stained slices were examined using confocal and two‐photon microscopes (FV1000 and FV1000‐MPE; Olympus). Stacked images of MNs acquired using a two‐photon laser scanning microscope were three dimensionally traced and reconstructed using Neurolucida software (Microbrightfield Bioscience Japan, Chiba, Japan).
To immunostain postsynaptic densities (PSDs), slices fixed with 4% PFA‐PB were pretreated for 1 h in 0.5% Triton X‐100 PBS and blocked for 1 h using 10% goat serum–0.1% Triton X‐100 PBS with gentle shaking at room temperature. The slices were then stained overnight with gentle shaking at 4°C in 10% goat serum–0.1% Triton X‐100 PBS containing anti‐GFP antibody (rabbit IgG, 1:1000 dilution; MBL) and anti‐PSD‐95 antibody (mouse IgG, 1:100 dilution; Merck Millipore, Darmstadt, Germany). After washing three times in PBS, free‐floating slices were incubated overnight with gentle shaking at 4°C in 10% goat serum–0.1% Triton X‐100 PBS containing streptavidin‐Alexa 546 (1:500 dilution; Life Technologies), CY5‐conjugated anti‐rabbit IgG (1:200 dilution; Jackson ImmunoResearch) and Alexa 405‐conjugated anti‐mouse IgG (1:200 dilution; Life Technologies). The stained slices were then washed three times in PBS and examined using a confocal microscope (A1; Nikon, Tokyo, Japan). Because of the limited penetration of anti‐PSD‐95 antibodies, our observations of PSD‐95 staining on MNs contacting ChR2‐expressing CS axons were limited to within approximately 35 μm from the surface.
Neurofilaments
Once the recordings from the slices were complete, electrolytic lesions were made in the CST, after which the slices were fixed and immunohistological procedures were carried out, basically as described above. The primary antibody was anti‐neurofilament H unphosphorylated (SMI 32) (mouse IgG, 1:500 dilution; Covance, Emeryville, CA, USA), and the secondary antibody was Alexa 488‐conjugated anti‐mouse IgG (1:1000 dilution; Life Technologies).
Synaptophysin‐containing CS axons and MNs
After perfusion of electroporated animals, the spinal cords were isolated and post‐fixed overnight at 4°C in 4% PFA–PB. They were then washed three times with PBS, cut into 50 μm‐thick transverse sections using a Microslicer (DTK‐1000; Dosaka EM), and stained as described above. The primary antibody was anti‐GFP (rabbit IgG, 1:1000 dilution; MBL), and the secondary antibody was biotinylated anti‐rabbit IgG (1:250 dilution; Vector Laboratories), which reacted with NeutrAvidin‐Texas Red (1:500 dilution; Life Technologies).
Results
Determination of the current strength for selective stimulation of the CS tract
A stimulating electrode was initially placed in the ventralmost part of dorsal column, where the CST is located in rodents, after which we used optical imaging with fast voltage‐sensitive dye (Di‐4‐ANNEPS) to determine the current that would adequately stimulate CST axons without spreading outside the main CST. While recording changes in membrane potential within the spinal cord, we gradually increased the stimulation intensity until reaching a current (140 μA) at which the amplitude of evoked EPSPs in the grey matter (Maeda et al. 2007) reached a plateau (Fig. 1 B, left). To confirm that only CST fibres were activated, we made an electrolytic lesion around the stimulation electrode in stepwise fashion using low‐intensity DC currents until a stimulating current pulse ≥150 μA (width = 100 μs) no longer evoked optical EPSPs (Fig. 1 B, right). The slices were then fixed, and it was verified that the electrolytic lesions were located within the CST in slices stained with anti‐neurofilament antibodies (Fig. 1 C). This result showed excellent reproducibility (n = 9; see also the next section), and we stimulated the CST using 140 μA currents in all subsequent experiments.
Monosynaptic CS‐EPSCs recorded from forearm MNs
MNs innervating the same muscle are aligned in longitudinal columns within the ventral horn, i.e. within MN pools (Romanes, 1964). We first studied MNs in the pools innervating the flexor and extensor muscles of the forearm. To identify those pools, the MNs were retrogradely labelled by injecting CTB‐Alexa 488 into the muscles on P4–P6, which enabled visualization of MNs in the lateral MN pools (McKenna et al. 2000; Tosolini & Morris, 2012). Two to three days after the injection, the CST was electrically stimulated as described above, and whole‐cell recordings were made from the labelled MNs.
Monosynaptic CS‐EPSCs (see Methods concerning the criteria for monosynaptic EPSCs) were recorded from 16 of the 47 MNs in this group (Figs 1 D and 2 A). When the electrode was moved over the midline to the contralateral CST (a shift of 80–90 μm, Fig. 1 F), CS‐EPSCs completely disappeared (n = 6/6), which further confirmed that our stimulation was spatially limited to the CST located in the hemilateral dorsal column. The time to peak and latency were fixed for each neuron. The amplitude of the EPSCs was 21.5 ± 3.1 pA (mean ± SEM), and the input resistance was 128.7 ± 11.6 mΩ. The latency of the EPSCs was 4.1 ± 0.2 ms in normal ACSF and 4.9 ± 0.3 ms in HDC‐ACSF, and the time to peak was 1.7 ± 0.3 ms.
Stimulation of the middle part of the dorsal column activates Ia fibres (Yoshida et al. 2006) and evoked Ia monosynaptic EPSCs (Fig. 1 F). Ia‐induced EPSCs were recorded from CS‐EPSC‐positive MNs (n = 6/6) under the same HDC‐ACSF conditions. The latency of the Ia‐evoked monosynaptic EPSCs was 2.7 ± 0.2 ms, which is in good agreement with previous measurements (3.0 ± 0.5 ms (mean ± SD) made in P6–P10 rats (Pinco & Lev‐Tov, 1993). This latency was significantly shorter (about half) than the CST‐evoked monosynaptic EPSCs (4.9 ± 0.2 ms, P < 0.001, paired t test) (Fig. 1 G). This difference also indicates monosynaptic EPSCs induced by CST stimulation are not explained by current spread from activated Ia fibres to the dorsal side of the dorsal column.
Selective innervation of CS axons on MNs
To determine whether MNs innervating the more proximal brachial and shoulder muscles received direct synapses from CS axons, subsets of MNs were retrogradely labelled by injection into the pectoralis major or anterior serratus muscle on P4–P6. Surprisingly, no monosynaptic CS‐EPSCs were recorded from any of the 40 MNs studied in this group (Fig. 1 E, middle five traces, and Fig. 2 A, right graph, blue bar). At the end of these experiments, we recorded spontaneous EPSCs from all of these MNs and confirmed that they generated spikes upon current injection (see Methods), indicating that these MNs remained viable throughout the recording sessions. As with forearm MNs, we recorded no obvious polysynaptic responses (n = 0/40). However, when we repetitively stimulated the CST 10 times at 10 ms intervals to evoke spikes in premotor neurons through temporal summation, the frequency of EPSCs 60–110 ms after the first stimulation significantly increased from the level of spontaneous EPSCs in the absence of stimulation (0.77 ± 0.14 vs. 0.14 ± 0.05, P < 0.01, n = 12), and this increment was abolished in HDC‐ACSF (0.77 ± 0.14 vs. 0.07 ± 0.03, P < 0.01, n = 12) (Fig. 1 E). This finding indicates that the CS axons polysynaptically influence the activity of the proximal MNs.
The distribution of all the MNs recorded is shown in Fig. 2 B. The locations of the somata of MNs exhibiting monosynaptic CS‐EPSCs are shown as red circles; all others are shown as blue circles. The MNs innervating the forearm muscles were located in the dorsolateral ventral horn; those innervating brachial and shoulder muscles were in the ventrolateral and ventromedial areas, respectively. Red circles were distributed only within the dorsolateral ventral horn, which clearly shows selective innervation of certain groups of MNs by CS axons.
Optogenetic stimulation of CS axons
We next performed a more rigorously selective stimulation of CS axons using optogenetic methods (Deisseroth et al. 2006; Kamiyama et al. 2015). On P0, AAV‐ChR2‐EYFP was injected into a sensorimotor region of the cortex. ChR2‐EYFP was then detected in CS fibres at the cervical spinal cord level on P7 (Figs 3 A and 5 B). To increase the detectability of the channel, the spinal cord slices were immunostained with anti‐GFP antibody. Immunoreactivity in the white matter was found only in the CST within the ventralmost part of the dorsal column; it was not detected in any other areas (Fig. 3 A, right panel).
Unlike single‐shock electrical stimulation, which evokes synchronized firing, optogenetic stimulation may activate axons asynchronously because ChR2 levels in the membrane vary from axon to axon. Therefore, to make firing as synchronous as possible, we shortened the stimulus duration so as to activate only axons containing high levels of ChR2. Figure 3 B illustrates EPSCs obtained from MNs stimulated at a fixed power (8.9 mW mm−2) with stepwise shortening of the illumination duration. Shortening from 10 to 5 ms reduced the maximum amplitude of the response, which became polyphasic (Fig. 3 B, filled circle). This may be caused by a reduction in the firing frequency of axons with a low threshold and/or exclusion of axons with a high threshold. The initial response had a fixed latency (Fig. 3 B, first and second record, left open circle), which is consistent with a monosynaptic response. In response to 2 ms photostimulation (Fig. 3 B, third record), the peaks of the traces coincided well (Fig. 3 B, open circles), behaving similarly in an all‐or‐none fashion, which implies two synaptic contacts by a single axon. One millisecond photostimulation did not evoke an EPSC in any MNs recorded (Fig. 3 B, asterisk). These results suggest that optogenetic stimulation can be employed in a way similar to single‐shock electrical stimulation to show monosynaptic connections, though the time courses of most responses were longer and more complex than those elicited by single‐shock electrical stimulation (20–100 ms with light vs. 20–50 ms with electrical stimulation). Whereas the second peak (Fig. 3 C, filled circle) was abolished in the presence of HDC‐ACSF, the first (Fig. 3 C upper, open circle) remained and showed the all‐or‐none characteristics of a monosynaptic response (Fig. 3 C lower traces, open circle). Using the monosynaptic response criteria (see Methods), we found that illumination of the medial grey matter evoked monosynaptic EPSCs in 12 of the 23 MNs tested. The distribution of MNs in which monosynaptic CS‐EPSCs were elicited by optogenetic stimulation is shown in Fig. 2 B (n = 12, red stars). The amplitude of the EPSCs was 23.7 ± 4.9 pA and the time to peak was 1.8 ± 0.3 ms, neither of which differed significantly from those of electrically evoked CS‐EPSCs (P = 0.69, 0.82 respectively).
The most rigorous way to optogenetically demonstrate monosynaptic connections would be to elicit EPSCs by direct activation of presynaptic Ca2+ channels through illumination‐induced depolarization in the presence of tetrodotoxin and 4‐aminopyridine (Petreanu et al. 2009; Cruikshank et al. 2010). Although we attempted to do that experiment, we recorded no EPSCs under 1 μm tetrodotoxin and 1 mm 4‐aminopyridine from optogenetically CS‐EPSC‐positive neurons from P7–P9 rats (MNs (n = 2) or interneurons (n = 2, data not shown), irrespective of the illumination time (the intensity was the maximum for our fibre‐coupled LED (8.9 mW mm−2)). Apparently, ChR2 expression in the CS synaptic terminals was not sufficient to activate Ca2+ channels (see Discussion).
Close apposition between CS axons and forearm MNs
We attempted to show synaptic structures between MNs and CS axons. To use a presynaptic marker to identify CS axons, on E15.5 we carried out exo utero electroporation to transfect a synaptophysin‐ECFP expression plasmid into embryonic cortical excitatory neurons, which are generated in the wall of the lateral ventricle. Spinal projection neurons in the brainstem are not generated before E15.5 (see Methods for details). To label MNs, on P5 CTB‐Alexa 488 was injected into the muscles. On P7, we examined ECFP‐labelled CS axons extending towards the dorsolateral ventral horn, where the forearm MNs were located (Fig. 4 A). Labelling of MNs with CTB was limited to somata and proximal dendrites up to about 40–50 μm from the somata (Fig. 3 A). To find CS–MN synapses, we used high‐magnification confocal microscopy to look for close apposition between labelled MN and presynaptic CS axons containing synaptophysin‐ECFP. We revised the criteria for ‘close apposition’ for synaptic contact previously used with conventional light microscopic observation (Lawrence et al. 1985; Liang et al. 1991; Raineteau et al. 2002) to one appropriate for confocal microscopy: (i) both presynaptic and postsynaptic elements appear in the same plane, (ii) a bouton‐like structure is present on the presynaptic terminal, and (iii) no gap is seen between the CS presynaptic terminal and MN dendrite at the highest magnification (>×1000). In 50 sections from two P7 rats, we found MNs contacting puncta of CS axons (1.4 ± 0.2 contacts per MN) (n = 5 MNs, Fig. 4 C and D). We then confirmed that other descending pathways were not labelled by synaptophysin‐ECFP. To remove non‐specific immunostaining for ECFP on the section surface, Z‐projections were made from five serial images (Fig. 4 B). We detected no continuous staining indicative of axon bundles running perpendicular to the sections in the white matter outside the CST in any of the sections examined (n = 50).
We further examined the contacts by labelling larger numbers of CS axons and the distal dendrites of MNs. For this purpose, some MNs in which optogenetic stimulation gave rise to monosynaptic CS‐EPSCs were labelled with Neurobiotin injected through whole cell recording pipettes (Fig. 5 B, C–E) (n = 6). In addition, CS axons containing ChR2‐EYFP were also labelled with a CY5‐conjugated secondary antibody to discriminate CTB‐Alexa 488 used for retrograde labelling of MNs. Perhaps because it is a membrane protein, ChR2‐EYFP was present along the entire length of CS axons to their terminals, making it an excellent marker with which to label axons. These CS axons extended to MN pools and were in close apposition to their distal (Fig. 5 D) or proximal (Fig. 5 E) dendrites, where they exhibited varicosity‐like or terminal bouton‐like structures (Fig. 5 D and E). We used immunostaining to determine whether the postsynaptic marker PSD‐95 was present in the dendritic spots of MNs that stained with Neurobiotin (n = 5) and made contact with ChR2‐expressing CS axons. All these MNs were in close apposition (9.4 ± 4.2 per MN) to CS axons labelled with ChR2‐EYFP. Nearly half of these contacts were accompanied by PSD‐95 immunoreactive spots (5.2 ± 2.5, Fig. 6 on the MN dendrites, indicating partner postsynaptic structures.
Discussion
Rigorous evidence of monosynaptic connection between neuronal elements would be a recording of monosynaptic EPSPs or EPSCs from postsynaptic neurons with intracellular electrodes or patch pipettes in response to selective stimulation of presynaptic cells, or electron micrographs showing synaptic structures between identified pre‐ and postsynaptic elements. Although monosynaptic connections between CS axons and MNs are widely believed to exist in some species, highly rigorous evidence is rare. For example, there is no convincing electron microscopic evidence showing identified CS axon terminals forming synapses with identified MNs. The current belief in the existence of direct connections is based largely on the indirect finding that CS fibres invade lamina IX, where MN somata are present (Shinoda et al. 1981; Bortoff & Strick, 1993; Armand et al. 1994), and on latency analyses showing that following CST or motor cortex stimulation, the discharges of MNs (Porter & Hore, 1969), their axons in the periphery (Bernhard & Bohm, 1954) or neuromuscular units (Fetz & Cheney, 1980; Olivier et al. 1997; McKiernan et al. 1998) are compatible with direct CS–MN synapses. This is chiefly because direct connections may be present only in higher primates, including humans, which limits experimental manipulation. In the present study, we selectively stimulated CS axons electrically and optogenetically and recorded monosynaptic EPSCs from MNs retrogradely labelled from the muscles they innervate. We also identified CS terminal–MN contacts morphologically. We believe that our findings provide new and compelling direct evidence of monosynaptic CS–MN connections in the developing rat.
Selective stimulation of the CST and the CS monosynaptic response
To demonstrate monosynaptic CS–MN connections electrophysiologically, it is critically important to selectively stimulate only the CST. One earlier electrophysiological study claimed the presence of direct CS axon–MN synapses in adult rats, where the conduction velocity of the CST was 60 m s−1 (Elger et al. 1977). Because this velocity is significantly faster than those (8–18 m s−1) reported elsewhere (Porter & Sanderson, 1964; Ohta & Tashiro, 1968; Mediratta & Nicoll, 1983; Ryder et al. 1991; Porter & Lemon, 1993), it was suggested (Babalian et al. 1993) that the electrical stimulation used in that study may have produced current spread and activated other descending pathways, including the reticulospinal tract, which shows faster conduction velocities (60–80 m s−1, Shapovalov, 1975). In our study the stimulating current was carefully calibrated to avoid spread of the stimulated area beyond the CST in the ventralmost part of the dorsal column (Fig. 1 B and C). Furthermore, we also injected AAV‐ChR2 into the cerebral cortex and then used light to selectively stimulate ChR2‐containing CS axons in spinal cord slices.
The latencies may seem somewhat long for the distance between stimulation and recording points. Nearly the entire conduction pathway of CS axons in spinal cord slices resides in the grey matter. In cat, the conduction velocity of CS axons in the grey matter is much slower (0.4 m s−1) than in the white matter (4–90 m s−1) (Shinoda et al. 1986). We previously found that the conduction velocity of CS axons in the C7 grey matter was 0.14–0.18 m s−1 on P7 (Kamiyama et al. 2006) and was 0.14 ± 0.01 m s−1 in co‐cultures of cortex and spinal cord after 6 days in vitro (Maeda et al. 2007). If that conduction velocity (0.14 m s−1) were applied to our experiments, the latency would be about 5 ms because the distance from the CST (ventralmost dorsal column) to the centre of the somata of MNs innervating the forearm was almost 700 μm in the fixed C8 tissue on P8. The latencies in this study (4.1 ± 1.2 ms) are thus in good accord with the calculated value.
We did not record clear disynaptic or polysynaptic responses, i.e. EPSCs that had the same amplitude and time course, but latencies that were not fixed and that jittered, making them clearly distinguishable from spontaneous EPSCs (n = 0/47) in normal ACSF. If polysynaptic responses had been reproducibly recorded along with monosynaptic ones, the monosynaptic responses would have been easily distinguishable. Nonetheless, it is well established that polysynaptic responses show more jitter at their onsets than monosynaptic ones (Doyle & Andresen, 2001), because EPSP summation, baseline membrane potentials and spike thresholds in the upstream (presynaptic) neurons are highly variable and sensitive to many factors. The well‐established criteria adopted in this study (see Methods) were rigorous and reliable. The absence of polysynaptic responses is probably because a single firing of a CS axon does not produce suprathreshold EPSPs in the interneurons. In fact, we recorded no suprathreshold EPSPs in any MN studied in the current clamp mode, which is also to be expected (ca 2.77 mV), given the EPSC amplitudes and the input resistances of the MNs (see the results).
Optogenetic stimulation of CS axons
The amount of ChR2 in an axonal membrane following viral transfection of the cell will depend on (i) the amount of infecting virus and the expression efficiency, (ii) the length of the post‐infection period, and (iii) the distance from the somata to a target area to be illuminated. We injected virus solution at two points in the sensorimotor cortex to expand the region of strong ChR2 expression (see Methods). The expression of ChR2 in cells transfected using an AAV vector reportedly reaches a level sufficient for optogenetic experiments within 3 weeks after injection (Zhang et al. 2010). Because ours was a developmental study, however, we had to perform our experiments 7–9 days after AAV‐ChR2 injection, which was done on P0. The level of ChR2 expression was therefore expected to be considerably lower than in other optogenetic experiments. In fact, the intensity of ChR2‐EYFP fluorescence 7–9 days after AAV injection into the cortex was obviously weaker than the intensity 14 days after injection (data not shown). Moreover, our targeted CS axon terminals in C7–C8 were more than 1 cm from their somata in the cerebral cortex, which further diminished the level of ChR2, as compared to the somata, where the ChR2 was synthesized.
Despite these conditions, we activated CS axons and evoked postsynaptic responses through illumination for as little as 2 ms. The vast majority of earlier studies using ChR2 analysed the macroscopic functionality of particular neuronal populations – for example, alterations in a behaviour with continuous or long‐term stimulation (see for review Fenno et al. 2011; Tye & Deisseroth, 2012). Here we demonstrated that stimulation of ChR2 using light could be employed to demonstrate monosynaptic connections, which had previously only been accomplished using single‐shock electrical stimulation. The use of ChR2 to determine anatomical connections is not unprecedented, as other laboratories have also done so (Cruikshank et al. 2010; Kohara et al. 2014).
Morphological analyses of contacts between CS axons and MNs
We showed that CS axons were in close apposition to MNs. MNs were labelled retrogradely with CTB injected into targeted muscles or with Neurobiotin injected directly through the recording pipettes. CTB labelled only somata and proximal dendrites, while injected Neurobiotin labelled MN dendrites nearly entirely (Fig. 4 A). In addition, the numbers of CS axons labelled with ChR2‐EYFP introduced through AAV infection of cortical cells were significantly greater than those labelled with synaptophysin‐ECFP introduced by electroporation. These would have made the numbers of close contacts detected in CTB‐MN/synaptophysin‐ECFP‐CS axon pairs (1.4 ± 0.2 contacts per MN) much smaller than the numbers detected in Neurobiotin‐MN/ChR2‐EYFP‐CS axon pairs (9.4 ± 4.2 per MN). Furthermore because penetration of the antibodies used into the tissue should be limited, immunostaining would have revealed only some of the structures to be studied. Consequently, although our morphological findings provide further evidence of direct CS–MN synapses, they do not provide reliable quantitative information about CS–MN synapses for the reasons mentioned above.
The significance of direct and selective CS axon–MN connections early during development in the rat
Results from recent studies support the view that direct CS axon–MN synapses are not present in adult rodents (Yang & Lemon, 2003; Alstermark et al. 2004). In our previous in vitro (Ohno et al. 2004, 2010) and in vivo (Kamiyama et al. 2006) studies, we found that CS axons are present throughout the grey matter early during development, but then regress mainly from the ventrolateral area. Those results suggest the direct CS axon–MN connections observed here may occur transiently during development in the rat. In this study, we showed only the existence of direct CS–MN connections in the P7–P9 rat; we did not determine when these transient direct connections are eliminated. This is mainly because it is very difficult to keep MNs viable in slices obtained from adult rodents (Carlin et al, 2000; Carp et al. 2008; Mitra & Brownstone, 2012). However, this problem is now being addressed in our laboratory through trans‐synaptic tracing using genetically modified rabies virus.
CS axons control adult forelimb movement via a polysynaptic pathway mediated by spinal interneurons, and a considerable fraction of the CS axons influence sensory input and/or reflex pathways to indirectly control forelimb movements. The other descending pathways, including the reticulospinal and rubrospinal tracts, also probably contribute to the cortical control of movement (Porter & Lemon, 1993).
We recorded electrical responses from MNs innervating the forearm muscles, pectoralis muscle and serratus anterior muscle. In 87 MNs studied, monosynaptic CS‐EPSCs were recorded only from MNs innervating the forearm muscles (Figs 1 and 2); no monosynaptic CS‐EPSCs were recorded from any MNs innervating proximal muscles (Figs 1 and 2). Because our results were obtained from transverse slices, synapses at distal dendrites would be missed if the MNs extend long dendrites beyond the thickness of our slices. For example, MNs located in the ventromedial area are reported not only to have dendrites in the transverse plane, but also to extend them in the rostrocaudal direction, though quantitative data are not available (Scheibel & Scheibel, 1969). For the following reasons, however, we suggest this possibility is not very likely and can perhaps be ruled out entirely. Among the MNs in the ventromedial area, phrenic MNs have been shown to possess long rostrocaudal dendrites (Sterling & Kuypers, 1967), but the length of those dendrites in neonatal and infant rats (P0–P7) is reportedly 100 μm at most (Lindsay et al. 1991), and the thickness of our slices was 450–600 μm and covered about half of one spinal segment in the P7–P9 rat. In addition, it is unlikely that CS axons make synapses exclusively on the distalmost dendrites of these MNs.
The CST is generally believed to be involved in mediating dexterity, at least in higher primates, which is based on direct connections between CS axons and MNs innervating distal muscles involved in digit movements (Lawrence & Kuypers, 1968; Lawrence & Hopkins, 1976). In fact, direct CS–MN synapses are dominant in MNs innervating distal muscles, including those that move the digits (Kuypers, 1960, 1962; Kuypers et al. 1960; Clough et al. 1968; de Noordhout et al. 1999), while there are few, if any, in proximal muscles (Phillips & Porter, 1964; Brouwer & Ashby, 1990; Palmer & Ashby, 1992). It is noteworthy that this tendency was also observed in a putatively transient CS–MN connection during development in the rat.
The biological significance of this direct and selective CS–MN connection is not known, though microcircuits in the spinal cord have been shown to undergo remodelling in juveniles (Gonzalez‐Forero & Alvarez, 2005). Connections between CS axons and MNs innervating distal forearm muscles, whether monosynaptic or polysynaptic, are involved in discrete, dexterous movements, and microcircuit formation may depend on postnatal refinement that requires activity‐dependent plasticity. The corticospinal projections, including transient CS axon–MN connections, seen during development in the rat are probably not for driving muscle contractions. Consistent with that idea, we recorded no EMG responses from forearm muscles upon stimulation of the pyramids (data not shown). Perhaps transient CS axon–MN connections play a role in the formation of neuronal circuits converging on the affected groups of MNs (Meng et al. 2004; Kamiyama et al. 2015).
From a phylogenetic viewpoint, one could speculate that these transient connections are the primordium of the direct CS–MN connections seen in higher primates. To add new connections to mature circuits during evolution, it would be easier to leave previously transient and redundant connections than to create genomic changes manifesting new phenotypes for additional connections or circuits. Additional information on the developmental changes in CS–MN connections in other mammalian species will shed light on this issue.
Additional information
Competing interests
None declared.
Author contributions
H.M., S.F. and M.S. designed this study. H.M. and S.F. did electrophysiological experiments. S.F. did immunohistochemical experiments. H.K., N.M. and N.I. contributed to morphological studies. H.M. and K.O. produced the AAV vector. H.M., S.F., N.M., N.I. and M.S. wrote the paper. All the physiological and morphological experiments were done in the laboratory of Department of Physiology, Teikyo University School of Medicine. All authors have approved the final version of the manuscript and agree to be accountable for all aspects of the work. All persons designated as authors qualify for authorship, and all those who qualify for authorship are listed.
Funding
This work was supported by grants from the Ministry of Education, Culture, Sports, Science and Technology, Japan Grant‐in‐Aid Grant 23300141 to M.S.
Acknowledgements
The authors would like to thank Professor Shigeo Okabe for kindly donating synaptophysin‐ECFP plasmid and Professor Deisseroth for the hChR2‐EYFP plasmid vector. We would also like to thank Dr Ichiro Takahashi for helpful advice on morphological studies.
H. Maeda and S. Fukuda contributed equally to this work.
References
- Alstermark B, Ogawa J & Isa T (2004). Lack of monosynaptic corticomotoneuronal EPSPs in rats: disynaptic EPSPs mediated via reticulospinal neurons and polysynaptic EPSPs via segmental interneurons. J Neurophysiol 91, 1832–1839. [DOI] [PubMed] [Google Scholar]
- Altman J & Bayer SA (1980. a). Development of the brain stem in the rat. I. Thymidine‐radiographic study of the time of origin of neurons of the lower medulla. J Comp Neurol 194, 1–35. [DOI] [PubMed] [Google Scholar]
- Altman J & Bayer SA (1980. b). Development of the brain stem in the rat. II. Thymidine‐radiographic study of the time of origin of neurons of the upper medulla, excluding the vestibular and auditory nuclei. J Comp Neurol 194, 37–56. [DOI] [PubMed] [Google Scholar]
- Altman J & Bayer SA (1980. c). Development of the brain stem in the rat. III. Thymidine‐radiographic study of the time of origin of neurons of the vestibular and auditory nuclei of the upper medulla. J Comp Neurol 194, 877–904. [DOI] [PubMed] [Google Scholar]
- Altman J & Bayer SA (1980. d). Development of the brain stem in the rat. IV. Thymidine‐radiographic study of the time of origin of neurons in the pontine region. J Comp Neurol 194, 905–929. [DOI] [PubMed] [Google Scholar]
- Altman J & Bayer SA (1981). Development of the brain stem in the rat. V. Thymidine‐radiographic study of the time of origin of neurons in the midbrain tegmentum. J Comp Neurol 198, 677–716. [DOI] [PubMed] [Google Scholar]
- Armand J, Edgley SA, Lemon RN & Olivier E (1994). Protracted postnatal development of corticospinal projections from the primary motor cortex to hand motoneurones in the macaque monkey. Exp Brain Res 101, 178–182. [DOI] [PubMed] [Google Scholar]
- Asanuma H, Stoney SD Jr & Thompson WD (1971). Characteristics of cervical interneurones which mediate cortical motor outflow to distal forelimb muscles of cats. Brain Res 27, 79–95. [DOI] [PubMed] [Google Scholar]
- Babalian A, Liang F & Rouiller EM (1993). Cortical influences on cervical motoneurons in the rat: recordings of synaptic responses from motoneurons and compound action potential from corticospinal axons. Neurosci Res 16, 301–310. [DOI] [PubMed] [Google Scholar]
- Bernhard CG & Bohm E (1954). Cortical representation and functional significance of the corticomotoneuronal system. AMA Arch Neurol Psychiatry 72, 473–502. [DOI] [PubMed] [Google Scholar]
- Berry MS & Pentreath VW (1976). Criteria for distinguishing between monosynaptic and polysynaptic transmission. Brain Res 105, 1–20. [DOI] [PubMed] [Google Scholar]
- Bortoff GA & Strick PL (1993). Corticospinal terminations in two new‐world primates: further evidence that corticomotoneuronal connections provide part of the neural substrate for manual dexterity. J Neurosci 13, 5105–5118. [DOI] [PMC free article] [PubMed] [Google Scholar]
- Brouwer B & Ashby P (1990). Corticospinal projections to upper and lower limb spinal motoneurons in man. Electroencephalogr Clin Neurophysiol 76, 509–519. [DOI] [PubMed] [Google Scholar]
- Campagnola L, Wang H & Zylka MJ (2008). Fiber‐coupled light‐emitting diode for localized photostimulation of neurons expressing channelrhodopsin‐2. J Neurosci Methods 169, 27–33. [DOI] [PubMed] [Google Scholar]
- Carlin KP, Jiang Z & Brownstone RM (2000). Characterization of calcium currents in functionally mature mouse spinal motoneurons. Eur J Neurosci 12, 1624–1634. [DOI] [PubMed] [Google Scholar]
- Carp JS, Tennissen AM, Mongeluzi DL, Dudek CJ, Chen XY & Wolpaw JR (2008). An in vitro protocol for recording from spinal motoneurons of adult rats. J Neurophysiol 100, 474–481. [DOI] [PMC free article] [PubMed] [Google Scholar]
- Clough JFM, Kernell D & Phillips CG (1968). The distribution of monosynaptic excitation from the pyramidal tract and from primary spindle afferents to motoneurones of the baboon's hand and forearm. J Physiol 198, 145–166. [DOI] [PMC free article] [PubMed] [Google Scholar]
- Crepel V & Ben‐Ari Y (1996). Intracellular injection of a Ca2+ chelator prevents generation of anoxic LTP. J Neurophysiol 75, 770–779. [DOI] [PubMed] [Google Scholar]
- Cruikshank SJ, Urabe H, Nurmikko AV & Connors BW (2010). Pathway‐specific feedforward circuits between thalamus and neocortex revealed by selective optical stimulation of axons. Neuron 65, 230–245. [DOI] [PMC free article] [PubMed] [Google Scholar]
- Curfs MH, Gribnau AA & Dederen PJ (1996). Direct cortico‐motoneuronal synaptic contacts are present in the adult rat cervical spinal cord and are first established at postnatal day 7. Neurosci Lett 205, 123–126. [DOI] [PubMed] [Google Scholar]
- Deisseroth K, Feng G, Majewska AK, Miesenbock G, Ting A & Schnitzer MJ (2006). Next‐generation optical technologies for illuminating genetically targeted brain circuits. J Neurosci 26, 10380–10386. [DOI] [PMC free article] [PubMed] [Google Scholar]
- de Noordhout AM, Rapisarda G, Bogacz D, Gérard P, De Pasqua V, Pennisi G & Delwaide PJ (1999). Corticomotoneuronal synaptic connections in normal man: an electrophysiological study. Brain 122, 1327–1340. [DOI] [PubMed] [Google Scholar]
- Doyle MW & Andresen MC (2001). Reliability of monosynaptic sensory transmission in brain stem neurons in vitro. J Neurophysiol 85, 2213–2223. [DOI] [PubMed] [Google Scholar]
- Elger CE, Speckmann EJ, Caspers H & Janzen RW (1977). Cortico‐spinal connections in the rat. I. Monosynaptic and polysynaptic responses of cervical motoneurons to epicortical stimulation. Exp Brain Res 28, 385–404. [DOI] [PubMed] [Google Scholar]
- Fenno L, Yizhar O & Deisseroth K (2011). The development and application of optogenetics. Annu Rev Neurosci 34, 389–412. [DOI] [PMC free article] [PubMed] [Google Scholar]
- Fetz EE & Cheney PD (1980). Postspike facilitation of forelimb muscle activity by primate corticomotoneuronal cells. J Neurophysiol 44, 751–772. [DOI] [PubMed] [Google Scholar]
- Frankenhaeuser B & Hodgkin AL (1957). The action of calcium on the electrical properties of squid axons. J Physiol 137, 218–244. [DOI] [PMC free article] [PubMed] [Google Scholar]
- Gonzalez‐Forero D & Alvarez FJ (2005). Differential postnatal maturation of GABAA, glycine receptor, and mixed synaptic currents in Renshaw cells and ventral spinal interneurons. J Neurosci 25, 2010–2023. [DOI] [PMC free article] [PubMed] [Google Scholar]
- Illert M, Lundberg A & Tanaka R (1976). Integration in descending motor pathways controlling the forelimb in the cat. 1. Pyramidal effects on motoneurones. Exp Brain Res 26, 509–519. [DOI] [PubMed] [Google Scholar]
- Jahr CE & Jessell TM (1985). Synaptic transmission between dorsal root ganglion and dorsal horn neurons in culture: antagonism of monosynaptic excitatory postsynaptic potentials and glutamate excitation by kynurenate. J Neurosci 5, 2281–2289. [DOI] [PMC free article] [PubMed] [Google Scholar]
- Jahr CE & Yoshioka K (1986). Ia afferent excitation of motoneurones in the in vitro new‐born rat spinal cord is selectively antagonized by kynurenate. J Physiol 370, 515–530. [DOI] [PMC free article] [PubMed] [Google Scholar]
- Kamiyama T, Kameda H, Murabe N, Fukuda S, Yoshioka N, Mizukami H, Ozawa K & Sakurai M (2015). Corticospinal tract development and spinal cord innervation differ between cervical and lumbar targets. J Neurosci 35, 1181–1191. [DOI] [PMC free article] [PubMed] [Google Scholar]
- Kamiyama T, Yoshioka N & Sakurai M (2006). Synapse elimination in the corticospinal projection during the early postnatal period. J Neurophysiol 95, 2304–2313. [DOI] [PubMed] [Google Scholar]
- Kohara K, Pignatelli M, Rivest AJ, Jung H‐Y, Kitamura T, Suh J, Frank D, Kajikawa K, Mise N, Obata Y, Wickersham IR & Tonegawa S (2014). Cell type‐specific genetic and optogenetic tools reveal hippocampal CA2 circuits. Nat Neurosci 17, 269–279. [DOI] [PMC free article] [PubMed] [Google Scholar]
- Kondo M, Tsuboi Y, Yamamoto T, Inage T, Iwamoto Y & Kamogawa H (2006). The location of brainstem neurons with bilateral projections to the motor nuclei of jaw openers in the cat. Neurosci Lett 403, 250–255. [DOI] [PubMed] [Google Scholar]
- Kuypers HG (1960). Central cortical projections to motor and somato‐sensory cell groups. An experimental study in the Rhesus monkey. Brain 83, 161–184. [DOI] [PubMed] [Google Scholar]
- Kuypers HG (1962). Corticospinal connections: postnatal development in the Rhesus monkey. Science 138, 678–680. [DOI] [PubMed] [Google Scholar]
- Kuypers HG (1982). A new look at the organization of the motor system. Prog Brain Res 57, 381–403. [DOI] [PubMed] [Google Scholar]
- Kuypers HG, Fleming WR & Farinholt JW (1960). Descending projections to spinal motor and sensory cell groups in the monkey: cortex versus subcortex. Science 132, 38–40. [DOI] [PubMed] [Google Scholar]
- Lawrence DG & Hopkins DA (1976). The development of motor control in the Rhesus monkey: evidence concerning the role of corticomotoneuronal connections. Brain 99, 235–254. [DOI] [PubMed] [Google Scholar]
- Lawrence DG & Kuypers HG (1968). The functional organization of the motor system in the monkey. I. The effects of bilateral pyramidal lesions. Brain 91, 1–14. [DOI] [PubMed] [Google Scholar]
- Lawrence DG, Porter R & Redman SJ (1985). Corticomotoneuronal synapses in the monkey: light microscopic localization upon motoneurons of intrinsic muscles of the hand. J Comp Neurol 232, 499–510. [DOI] [PubMed] [Google Scholar]
- Lemon RN (2008). Descending pathways in motor control. Annu Rev Neurosci 31, 195–218. [DOI] [PubMed] [Google Scholar]
- Lemon RN & Griffiths J (2005). Comparing the function of the corticospinal system in different species: Organizational differences for motor specialization? Muscle Nerve 32, 261–279. [DOI] [PubMed] [Google Scholar]
- Lemon RN, Maier MA, Armand J, Kirkwood PA & Yang HW (2002). Functional differences in corticospinal projections from macaque primary motor cortex and supplementary motor area. Adv Exp Med Biol 508, 425–434. [DOI] [PubMed] [Google Scholar]
- Liang FY, Moret V, Wiesendanger M & Rouiller EM (1991). Corticomotoneuronal connections in the rat: evidence from double‐labeling of motoneurons and corticospinal axon arborizations. J Comp Neurol 311, 356–366. [DOI] [PubMed] [Google Scholar]
- Lindsay AD, Greer JJ & Feldman JL (1991). Phrenic motoneuron morphology in the neonatal rat. J Comp Neurol 308, 169–179. [DOI] [PubMed] [Google Scholar]
- Lloyd DP (1941). The spinal mechanism of the pyramidal system in cats. J Neurophysiol 4, 525–546. [Google Scholar]
- McKenna JE, Prusky GT & Whishaw IQ (2000). Cervical motoneuron topography reflects the proximodistal organization of muscles and movements of the rat forelimb: a retrograde carbocyanine dye analysis. J Comp Neurol 419, 286–296. [DOI] [PubMed] [Google Scholar]
- McKiernan BJ, Marcario JK, Karrer JH & Cheney PD (1998). Corticomotoneuronal postspike effects in shoulder, elbow, wrist, digit, and intrinsic hand muscles during a reach and prehension task. J Neurophysiol 80, 1961–1980. [DOI] [PubMed] [Google Scholar]
- Maeda H, Ohno T & Sakurai M (2007). Optical and electrophysiological recordings of corticospinal synaptic activity and its developmental change in in vitro rat slice co‐cultures. Neuroscience 150, 829–840. [DOI] [PubMed] [Google Scholar]
- Mediratta NK & Nicoll JA (1983). Conduction velocities of corticospinal axons in the rat studied by recording cortical antidromic responses. J Physiol 336, 545–561. [DOI] [PMC free article] [PubMed] [Google Scholar]
- Meng Z, Qun L & Martin JH (2004). The transition from development to motor control function in the corticospinal system. J Neurosci 24, 605–614. [DOI] [PMC free article] [PubMed] [Google Scholar]
- Miles R & Wong RK (1987). Inhibitory control of local excitatory circuits in the guinea‐pig hippocampus. J Physiol 388, 611–629. [DOI] [PMC free article] [PubMed] [Google Scholar]
- Mitra P & Brownstone RM (2012). An in vitro spinal cord slice preparation for recording from lumbar motoneurons of the adult mouse. J Neurophysiol 107, 728–741. [DOI] [PubMed] [Google Scholar]
- Neafsey EJ & Sievert C (1982). A second forelimb motor area exists in rat frontal cortex. Brain Res 232, 151–156. [DOI] [PubMed] [Google Scholar]
- Ohno T, Maeda H, Murabe N, Kamiyama T, Yoshioka N, Mishina M & Sakurai M (2010). Specific involvement of postsynaptic GluN2B‐containing NMDA receptors in the developmental elimination of corticospinal synapses. Proc Natl Acad Sci USA 107, 15252–15257. [DOI] [PMC free article] [PubMed] [Google Scholar]
- Ohno T, Maeda H & Sakurai M (2004). Regionally specific distribution of corticospinal synapses because of activity‐dependent synapse elimination in vitro. J Neurosci 24, 1377–1384. [DOI] [PMC free article] [PubMed] [Google Scholar]
- Ohta M & Tashiro N (1968). Pyramidal tract response to cortical stimulation in the rat. Jpn J Physiol 18, 432–445. [DOI] [PubMed] [Google Scholar]
- Olivier E, Edgley SA, Armand J & Lemon RN (1997). An electrophysiological study of the postnatal development of the corticospinal system in the macaque monkey. J Neurosci 17, 267–276. [DOI] [PMC free article] [PubMed] [Google Scholar]
- Palmer E & Ashby P (1992). Corticospinal projections to upper limb motoneurones in humans. J Physiol 448, 397–412. [DOI] [PMC free article] [PubMed] [Google Scholar]
- Petreanu L, Mao T, Sternson SM & Svoboda K (2009). The subcellular organization of neocortical excitatory connections. Nature 457, 1142–1145. [DOI] [PMC free article] [PubMed] [Google Scholar]
- Phillips CG & Porter R (1964). The pyramidal projection to motoneurones of some muscle groups of the baboon's forelimb. Prog Brain Res 12, 222–245. [DOI] [PubMed] [Google Scholar]
- Pinco M & Lev‐Tov A (1993). Synaptic excitation of alpha‐motoneurons by dorsal root afferents in the neonatal rat spinal cord. J Neurophysiol 70, 406–417. [DOI] [PubMed] [Google Scholar]
- Porter R (1987). The Florey Lecture, 1987. Corticomotoneuronal projections: synaptic events related to skilled movement. Proc R Soc Lond B Biol Sci 231, 147–168. [DOI] [PubMed] [Google Scholar]
- Porter R & Hore J (1969). Time course of minimal corticomotoneuronal excitatory postsynaptic potentials in lumbar motoneurons of the monkey. J Neurophysiol 32, 443–451. [DOI] [PubMed] [Google Scholar]
- Porter R & Lemon R (1993). Corticospinal Function and Voluntary Movement. Oxford University Press, Oxford, UK. [Google Scholar]
- Porter R & Sanderson JH (1964). Antidromic cortical response to pyramidal‐tract stimulation in the rat. J Physiol 170, 355–370. [DOI] [PMC free article] [PubMed] [Google Scholar]
- Raineteau O, Fouad K, Bareyre FM & Schwab ME (2002). Reorganization of descending motor tracts in the rat spinal cord. Eur J Neurosci 16, 1761–1771. [DOI] [PubMed] [Google Scholar]
- Romanes GJ (1964). The motor pools of the spinal cord. Prog Brain Res 11, 93–119. [DOI] [PubMed] [Google Scholar]
- Rose HJ & Metherate R (2005). Auditory thalamocortical transmission is reliable and temporally precise. J Neurophysiol 94, 2019–2030. [DOI] [PubMed] [Google Scholar]
- Ryder J, Zappulla R & Nieves J (1991). Motor evoked potentials elicited from pyramidal stimulation and recorded from the spinal cord in the rat. Neurosurgery 28, 550–558. [DOI] [PubMed] [Google Scholar]
- Sah P & Nicoll RA (1991). Mechanisms underlying potentiation of synaptic transmission in rat anterior cingulate cortex in vitro . J Physiol 433, 615–630. [DOI] [PMC free article] [PubMed] [Google Scholar]
- Saito T (2006). In vivo electroporation in the embryonic mouse central nervous system. Nat Protoc 1, 1552–1558. [DOI] [PubMed] [Google Scholar]
- Saito T & Nakatsuji N (2001). Efficient gene transfer into the embryonic mouse brain using in vivo electroporation. Dev Biol 240, 237–246. [DOI] [PubMed] [Google Scholar]
- Scheibel ME & Scheibel AB (1969). Terminal patterns in cat spinal cord. 3. Primary afferent collaterals. Brain Res 13, 417–443. [DOI] [PubMed] [Google Scholar]
- Shapovalov AI (1975). Neuronal organization and synaptic mechanisms of supraspinal motor control in vertebrates. Rev Physiol Biochem Pharmacol 72, 1–54. [DOI] [PubMed] [Google Scholar]
- Shinoda Y, Yamaguchi T & Futami T (1986). Multiple axon collaterals of single corticospinal axons in the cat spinal cord. J Neurophysiol 55, 425–448. [DOI] [PubMed] [Google Scholar]
- Shinoda Y, Yokota J & Futami T (1981). Divergent projection of individual corticospinal axons to motoneurons of multiple muscles in the monkey. Neurosci Lett 23, 7–12. [DOI] [PubMed] [Google Scholar]
- Sterling P & Kuypers HG (1967). Anatomical organization of the brachial spinal cord of the cat. II. The motoneuron plexus. Brain Res 4, 16–32. [DOI] [PubMed] [Google Scholar]
- Tominaga T, Tominaga Y, Yamada H, Matsumoto G & Ichikawa M (2000). Quantification of optical signals with electrophysiological signals in neural activities of Di‐4‐ANEPPS stained rat hippocampal slices. J Neurosci Methods 102, 11–23. [DOI] [PubMed] [Google Scholar]
- Tosolini AP & Morris R (2012). Spatial characterization of the motor neuron columns supplying the rat forelimb. Neuroscience 200, 19–30. [DOI] [PubMed] [Google Scholar]
- Tye KM & Deisseroth K (2012). Optogenetic investigation of neural circuits underlying brain disease in animal models. Nat Rev Neurosci 13, 251–266. [DOI] [PMC free article] [PubMed] [Google Scholar]
- Vrieseling E & Arber S (2006). Target‐induced transcriptional control of dendritic patterning and connectivity in motor neurons by the ETS gene Pea3. Cell 127, 1439–1452. [DOI] [PubMed] [Google Scholar]
- Watson C, Paxinos G & Kayalioglu G (2009). The Spinal Cord. Elsevier, London, UK. [Google Scholar]
- Yang HW & Lemon RN (2003). An electron microscopic examination of the corticospinal projection to the cervical spinal cord in the rat: lack of evidence for cortico‐motoneuronal synapses. Exp Brain Res 149, 458–469. [DOI] [PubMed] [Google Scholar]
- Yoshida Y, Han B, Mendelsohn M & Jessell TM (2006). PlexinA1 signalling directs the segregation of proprioceptive sensory axons in the developing spinal cord. Neuron 52, 775–788. [DOI] [PMC free article] [PubMed] [Google Scholar]
- Zhang F, Gradinaru V, Adamantidis AR, Durand R, Airan RD, de Lecea L & Deisseroth K (2010). Optogenetic interrogation of neural circuits: technology for probing mammalian brain structures. Nat Protoc 5, 439–456. [DOI] [PMC free article] [PubMed] [Google Scholar]