

Key points
Sympathetic activity exhibits respiratory modulation that is amplified in hypertensive rats.
Respiratory modulated sympathetic activity produces greater changes in vascular resistance than tonic stimulation of the same stimulus magnitude in normotensive but not hypertensive rats.
Mathematical modelling demonstrates that respiratory modulated sympathetic activity may fail to produce greater vascular resistance changes in hypertensive rats because the system is saturated as a consequence of a dysfunctional noradrenaline reuptake mechanism.
Respiratory modulated sympathetic activity is an efficient mechanism to raise vascular resistance promptly, corroborating its involvement in the ontogenesis of hypertension.
Abstract
Sympathetic nerve activity (SNA) exhibits respiratory modulation. This component of SNA is important – being recruited under cardiorespiratory reflex conditions and elevated in the spontaneously hypertensive (SH) rat – and yet the exact influence of this modulation on vascular tone is not understood, even in normotensive conditions. We constructed a mathematical model of the sympathetic innervation of an arteriole, and used it to test the hypothesis that respiratory modulation of SNA preferentially increases vasoconstriction compared to a frequency‐matched tonic pattern. Simulations supported the hypothesis, where respiratory modulated increases in vasoconstriction were mediated by a noradrenergic mechanism. These predictions were tested in vivo in adult Wistar rats. Stimulation of the sympathetic chain (L3) with respiratory modulated bursting patterns, revealed that bursting increases vascular resistance (VR) more than tonic stimulation (57.8 ± 3.3% vs. 44.8 ± 4.2%; P < 0.001; n = 8). The onset of the VR response was also quicker for bursting stimulation (rise time constant = 1.98 ± 0.09 s vs. 2.35 ± 0.20 s; P < 0.01). In adult SH rats (n = 8), the VR response to bursting (44.6 ± 3.9%) was not different to tonic (37.4 ± 3.5%; P = 0.57). Using both mathematical modelling and in vivo techniques, we have shown that VR depends critically on respiratory modulation and revealed that this pattern dependency in Wistar rats is due to a noradrenergic mechanism. This respiratory component may therefore contribute to the ontogenesis of hypertension in the pre‐hypertensive SH rat – raising VR and driving vascular remodelling. Why adult SH rats do not exhibit a pattern‐dependent response is not known, but further modelling revealed that this may be due to dysfunctional noradrenaline reuptake.
Key points
Sympathetic activity exhibits respiratory modulation that is amplified in hypertensive rats.
Respiratory modulated sympathetic activity produces greater changes in vascular resistance than tonic stimulation of the same stimulus magnitude in normotensive but not hypertensive rats.
Mathematical modelling demonstrates that respiratory modulated sympathetic activity may fail to produce greater vascular resistance changes in hypertensive rats because the system is saturated as a consequence of a dysfunctional noradrenaline reuptake mechanism.
Respiratory modulated sympathetic activity is an efficient mechanism to raise vascular resistance promptly, corroborating its involvement in the ontogenesis of hypertension.
Abbreviations
- BF
blood flow
- BP
blood pressure
- MVC
muscle vasoconstrictor
- NA
noradrenaline
- SH rat
spontaneously hypertensive rat
- SMC
vascular smooth muscle cell
- SNA
sympathetic nerve activity
- VR
vascular resistance
Introduction
It is well known that sympathetic nerves discharge in bursting patterns, with cardiac, respiratory and lower‐order rhythmicities (Habler et al. 1994; Malpas, 1998; Gilbey, 2001; Janig, 2006; Pilowsky, 2009). A component of the respiratory rhythm has a central origin, and is known to be a major contributor to sympathetic oscillations (Habler et al. 1994; Malpas, 1998).
The central modulation of sympathetic nerve activity (SNA) by respiration, occurs due to coupling of pre‐sympathetic centres in the medulla oblongata with central pattern generators of respiration (Haselton & Guyenet, 1989; Malpas, 1998; Mandel & Schreihofer, 2009; Zoccal et al. 2009; Moraes et al. 2014). This results in SNA being entrained to respiration, with bursts occurring predominantly in the inspiratory/post‐inspiratory phase (Habler et al. 1994; Janig, 2006; Malpas, 2010; Zoccal & Machado, 2011). As well as contributing to baseline sympathetic output, a recruitment of this rhythm is important for mediating sympathoexcitatory responses to cardiorespiratory reflex activation (Guyenet, 2000; Dick et al. 2004; Mandel & Schreihofer, 2009; Moraes et al. 2012; Zoccal et al. 2014).
The respiratory rhythm of SNA is also a crucial contributor to the sympathetic over‐activity seen in animal models of hypertension (Simms et al. 2010; Zoccal & Machado, 2011). Amplified respiratory–sympathetic coupling has been reported in the pre‐hypertensive spontaneously hypertensive (SH) rat, indicating that an enhancement of this rhythm may be a significant contributor to the pathogenesis of hypertension (Simms et al. 2009; Briant et al. 2014; Moraes et al. 2014). The importance of respiratory modulation of SNA has also been highlighted in human hypertension; altered breathing patterns induce improvements in blood pressure in patients with essential hypertension (Joseph et al. 2005). Despite the clear importance of this component of SNA, the precise physiological role of respiratory modulation on vasoconstriction remains uncertain, even in normotensive conditions.
Previous studies comparing the vascular responses to sympathetic stimulation evoked by burst‐like and tonic patterns have shown inconsistent results. In vivo studies in cat skeletal muscle (Andersson, 1983) and rabbit hindquarters (Ando et al. 1993) suggest that oscillations in SNA do not enhance absolute vasoconstriction when compared to tonic stimulations of the same average firing frequency. Others, however, have reported that ‘irregular’ sympathetic stimulation patterns do preferentially increase vasoconstriction compared to tonic (regular) stimulation in the rat (Nilsson et al. 1985; Hardebo, 1992; DiBona & Sawin, 1999), cat (Bloom et al. 1987) and pig (Lacroix et al. 1988). Similar pattern‐dependent observations, in the skin resistance responses (Kunimoto et al. 1992) and cardiac noradrenaline spill‐over (Lambert et al. 2011) to sympathetic bursting, have been made in humans. As well as exhibiting contrasting results, no one study focuses exclusively on the vasoconstrictive effects of sympathetic stimulation applied at respiratory related frequencies, nor considers changes in the amplitude of this respiratory rhythm of sympathetic activity – as seen in hypertension (Simms et al. 2010).
Initially, we used mathematical modelling to explore the effect of respiratory modulation on vascular resistance. We generated a mathematical model of the sympathetic innervation of an artery in a normotensive (Wistar) rat and the corresponding contractile response. The sympathetic component of this model was stimulated with tonic and respiratory bursting patterns, and the consequential changes in arterial radius were calculated. From these results, we hypothesised that respiratory modulated bursts of sympathetic activity preferentially increase vascular resistance compared to tonic increases in sympathetic output. We then explored these computational findings by investigating the influence of respiratory modulated bursting in vivo in adult Wistar and SH rats. We then used the model to predict which mechanism underlies the dependence of the vascular response to sympathetic patterning in Wistar and SH rats.
Methods
Computational overview
A mathematical model was constructed of an artery with sympathetic innervation (Fig. 1). This was used to make experimental predictions about the dependence of VR on sympathetic stimulation pattern. The model is based on previously published models (Lemon et al. 2003 a,b; Bennett et al. 2005; Briant et al. 2015) and experimental data (Hillarp & Olivecrona, 1946; Iversen, 1967; Luff, 1996). A descriptive overview of the model is given here, as well as the main modelling assumptions made. Full equations of the model of sympathetic innervation of a single smooth muscle cell (SMC) can be found in our previous paper (Briant et al. 2015).
Figure 1. Morphology of modelled artery segment and its sympathetic innervation .
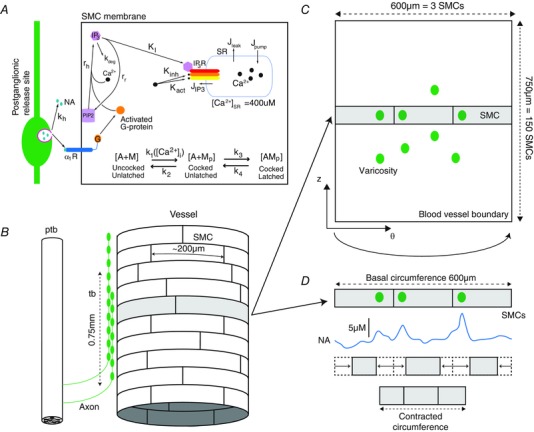
A, the kinetics of sympathetically mediated contraction of a smooth muscle cell (SMC) in the model. These kinetics have been described in detail previously (Briant et al. 2015). B, experimental data shows that a pre‐terminal bundle (ptb) follows the vessel perivascularly (Luff, 1996). Varicose axons extend out of the ptb in a terminating bundle (tb). These varicosities are release sites of NA onto the SMCs. The terminal bundle consist of varicose axons, spanning a distance of 750 μm of the artery axially. SMCs are arranged circumferentially and have dimensions 5 μm × 200 μm (Luff, 1996). A cylindrical layer of SMCs was therefore modelled, represented on a 2D grid (C). The coordinates are now polar (θ,z). The modelled artery wall was endowed with 100 varicosities to fit data from the release probability from sympathetic varicosities (Stjarne, 2000). Each of the 100 varicosities is considered to be driven by the same membrane potential pattern, as recorded from the axon of a model of a sympathetic postganglionic neurone (Briant et al. 2014). The arterial radius is determined by considering each ring of SMCs; a particular circumferential ring of SMCs (z = constant; shaded area), with 3 varicosities releasing NA (noradrenaline) onto them, can be seen. Release of NA causes the SMCs to contract, changing their length (D). The sum of these contracted lengths gives the contracted circumference (and therefore radius). SMCs are not coupled mechanically, electrically or chemically.
Modelling assumptions summary
The following assumptions were extracted from experimental data of the modelled system or designed to reduce the computational complexity of the model.
The modelled arterial segment is 750 μm long (axially) and receives innervation from 100 sympathetic varicosities, all with probability of release = 1. The artery model therefore has innervation from 100 sympathetic neurones, each with one release site.
The firing of these neurones, driven by current pulse injection, is synchronous. (These neurones discharge in unison.)
The artery wall can be modelled as a cylindrical shell of SMCs. This is a grid of 3 × 150 SMCs (see Fig. 1 B and C).
These SMCs are electrically, chemically and mechanically uncoupled. This assumption reduced the computational complexity of the model and has been shown to be consistent with experimental data in previous computational studies (Bennett et al. 2005).
Released NA can diffuse to activate neighbouring SMCs.
NA release is driven by the firing of a model sympathetic neurone (Briant et al. 2014). The modelled kinetics of the NA release process are depicted in Fig. 1 A.
Contraction of individual SMCs is governed by a mathematical model of this process previously described (Briant et al. 2015).
Model equations
The model consisted of a previous published model describing NA release from sympathetic nerve terminals and how this released NA causes SMC contraction (Briant et al. 2015) in combination with a model of the SMC layer of an artery wall.
Model simulations begin with stimulation of sympathetic postganglionic neurones with tonic and (respiratory) bursting patterns of current pulses. These neurones innervate a cylindrical layer of SMCs (representing the contractile part of an artery wall; Fig. 1 B); the action potentials generated propagate down the axons, triggering release of NA onto the artery wall at various ‘release sites’ (varicosities), as described in Briant et al. (2015). This released NA diffuses across the artery wall (see below), and causes vasoconstriction of the artery (Fig. 1 D).
Artery model morphology
The structure of sympathetic innervation of arteries documented in rats (Luff, 1996) was used to constrain the model. The artery segment modelled is innervated by a ‘terminating bundle’ of postganglionic axons (Fig. 1 B). The number of SMCs, or the region of a vessel, innervated by an individual axon from this bundle is unknown (Luff, 1996). It is known that terminating bundles of the main ventral artery of the rat tail spans a few millimetres of the vessel perivascularly (Sittiracha et al. 1987; Luff, 1996). For this reason, and for computational efficiency, the morphology of the model was defined as a 750 μm axial segment of artery. Given that SMCs have a width of 5 μm and are arranged circumferentially around the artery (Krizmanich & Lee, 1993), the modelled segment comprised 150 (750/5) SMCs axially. In canine, SMCs in situ have a length of <200 μm (Wadsworth et al. 1988) and resistance vessels in humans have a typical luminal radius of 100 μm (Intengan et al. 1999). Therefore the modelled artery consists of three SMCs circumferentially (giving a radius of 95 μm). The arterial wall is considered to be represented by a single cylindrical shell of SMCs, representing the first layer of SMCs at the medial‐adventitial border receiving innervation (Luff, 1996). The modelled artery is thus an array of 150 × 3 SMCs in cylindrical co‐ordinates (Fig. 1 C).
NA release, diffusion and SMC contraction
NA is released onto the SMC array at distinct sites (varicosities; Fig. 1 C). Each sympathetic axon in the terminating bundle has ∼26000 varicosities along its terminating length (Dahlstrom & Haggendal, 1966). The probability of release from an individual site following stimulation is known to be less than 0.01 (Astrand & Stjarne, 1989); each propagating action potential therefore causes release at <260 sites. Thus, to make the model computationally manageable, the artery segment is considered to have 100 varicosities, each with a probability of release of 1. Terminating axons are known to undergo extensive branching which exhibits little structure (Burnstock & Costa, 1975; Luff, 1996). Release sites were therefore randomly placed on the arterial segment using a pseudo‐random number generator in MATLAB to assign varicosity location.
Diffusion of the released NA (from the 100 different release sites) across the artery wall was modelled with the diffusion equation in cylindrical co‐ordinates, in a similar fashion to Bennett et al. (2005). However, the radius of the model was considered to be constant as the artery is modelled as a thin cylindrical shell of SMCs. The concentration of noradrenaline, [NA], depends on the location(s) at which NA is released. Upon release onto the arterial surface, its diffusion is governed by the 2D‐heat equation in cylindrical coordinates:
The NA diffusion constant is taken to be the same as that of dopamine, (Nicholson, 1995; Bennett et al. 2005). Q is a source term describing the release of NA from stimulated varicosities, and is a function of space and time. This term is the output from the model of the exocytosis of vesicles containing NA previously described (Briant et al. 2015). During diffusion is kept constant, even when the model radius decreases due to SMC contraction.
The numerical solution of this equation was found using an explicit finite difference scheme. The NA concentration at time is given by:
where iterates over the spatial grid in cylindrical coordinates, iterates over time, and. The spatial domain is and. The vessel boundaries at and have 0 boundary conditions. The initial [NA] profile is 0.
NA released from sympathetic terminals, diffuses across the artery wall and binds to α1‐adrenoreceptors on the SMCs, causing them to generate a contractile force, as defined for a single SMC in Briant et al. (2015).
Contractile forces, lengths and resistance
We related the contractile force generated by each of the SMCs comprising the artery wall to a change in arterial radius, by assuming a linear relationship between SMC force and SMC length as follows. The contractile force produced by each modelled SMC is at a maximum 1.6 μN, according to experimental recordings (Yagi et al. 1988). Phenylephrine stimulation of aortic smooth muscle cells yields a maximum of a 30% change in cell length (Julien et al. 2001). The contractile force and length of the cell were therefore assumed to be linearly related, so that at 0 μN the length of the cell is 200 μm and at 1.6 μN the length is 140 μm (70% of 200 μm).
As the SMCs in the model are arranged and are assumed to contract circumferentially, the change in length of each SMC can be summed around each of the 150 circumferential rings, and a change in circumference obtained (Fig. 1 D). This is represented as a radius (r), noting that the basal radius of the model is. Averaging this radius over each of the 150 rings of SMCs, gives a representation of the change in radius of the artery at each time‐step. To measure contraction of the model at each time‐point, a proxy for vascular resistance, was used. This measure is proportional to the vascular resistance, according to the Hagen‐Poiseuille law.
Model simulation
The grid spacing used was and (corresponding to a circumferential step of) and the time‐step used was. Simulations of the model were performed on a two dual‐core Opteron 8GB RAM node, using the computational facilities of the Advanced Computing Research Centre, University of Bristol, UK (http://www.bris.ac.uk/acrc/). Simulations of the artery wall model for 100 s with sympathetic stimulation took ∼30 mins. Code for the model has been posited on MathWorks FileExchange (http://www.mathworks.com/matlabcentral/fileexchange/?term=authorid%3A196854).
In vivo experimental methods
All experiments conformed to the UK Home Office guidelines regarding the ethical use of animals and were approved by the University of Bristol Ethical Review Committee. Male Wistar rats (n = 8, 13–15 weeks, 250–350 g) and SH rats (Okamoto and Aoki (1963); n = 8, 13–15 weeks, 250–350 g) were used for the main protocol, and additional Wistar rats (n = 2, 13–15 weeks, 250–350 g) were used for a pharmacological protocol. Animals were deeply anaesthetised with halothane, until loss of withdrawal to paw pinch. Urethane and α‐chloralose were then administered i.p. (1.2 g kg−1 and 60 mg kg−1, respectively; Sigma‐Aldrich, USA). Core temperature was monitored and maintained at 36–38°C with a homoeothermic heat pad (Harvard Apparatus, UK). The left jugular vein was cannulated with a catheter for rehydration with standard lactated Ringer's solution throughout the experiment (0.1‐0.2 ml every 20–30 min). Animals were then prepared for cardiovascular measurements (Fig. 2) described below. Rats were killed with an i.v. bolus of urethane (1.5‐2.0 g kg−1) at the end of the experiment.
Figure 2. Measuring sympathetically driven changes to hindlimb vascular resistance in vivo .
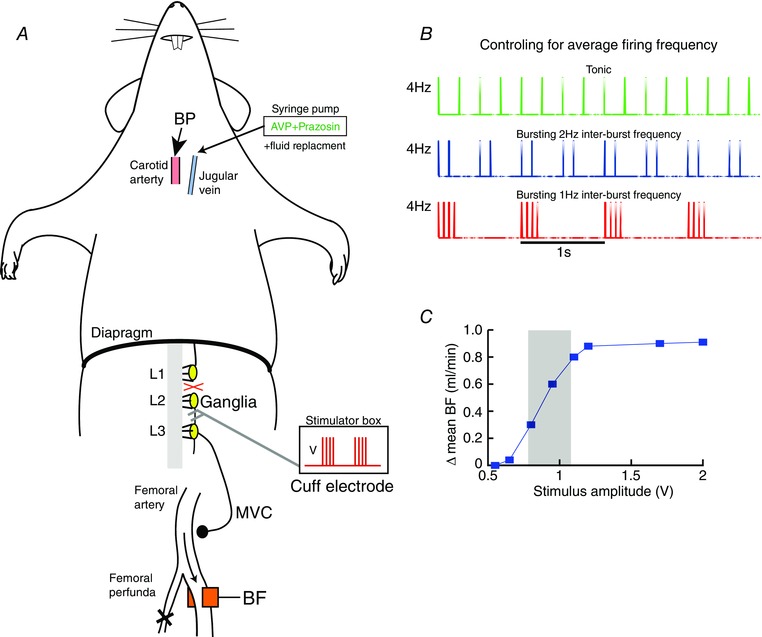
A, schematic of the in vivo rat preparation. Recordings of blood pressure (BP) from the carotid artery and blood flow (BF) from the femoral artery were made. The profunda femoris was tied, to increase flow past the recording probe. The sympathetic ganglia (L3) was located and the sympathetic chain between L2–L3 connected to a cuff electrode for stimulating with current pulses, increasing muscle vasoconstrictor (MVC) drive to the hindlimb. B, each pulse had a duration of 2 ms and amplitude of 0.5–2.5 V. These were played in with 3 stimulation patterns; tonic, bursting with a 1 Hz inter‐burst frequency (1 Hz bursting) and bursting with a 2 Hz inter‐burst frequency (2 Hz bursting). The sympathetic chain was stimulated with these 3 patterns for 15 s, whilst maintaining average firing frequency at 2, 4, 8 or 10 Hz. The three patterns for 4 Hz average firing frequency is shown. C, the amplitude of the stimulus was titrated by giving supra‐threshold (40 Hz, tonic, 15 s) pulses of varying amplitude (0.5–2.5 V). The change in mean BF was plotted as a function of amplitude, and the working amplitude chosen set to that producing a ∼50% decrease in mean BF (shaded area).
Cardiovascular recordings
The carotid artery was cannulated with a catheter (PE‐50 tubing; 100 I.U. ml–1 heparin in 0.9% saline) and connected to a pressure transducer for continuous recording of arterial blood pressure (BP). Heart rate (HR) was derived from the pulsatile BP waveform online. Mean blood flow (BF) from the left femoral artery was measured using a Transonic 1.0PSB Precision Flowprobe (Transonic USA, Ithaca, NY, USA). The artery was dissected free of the femoral vein using glass hooks to minimise nerve damage, and the flow probe positioned rostral to the profunda femoris artery, which was tied off to increase femoral artery blood flow. The leg was wrapped in insulating material to keep it warm and encourage blood flow. Coupling gel (Aquasonic, Parker Labs, Fairfield, NJ, USA) was placed between the artery and the flow probe to ensure good ultrasound coupling. All wounds were closed to prevent dehydration and insulated to minimise heat loss and prevent cutaneous vasoconstriction. The cardiovascular recordings reached stable values ∼10 min after preliminary surgical procedures.
All BP and BF data were recorded using a data acquisition hardware (Micro1401‐3, Cambridge Electronic Design (CED), Cambridge, UK) and Spike2 software (CED) and sampled at 1 k Hz. Vascular resistance (VR) was calculated as BP/BF online, and was smoothed (τ = 0.05 s).
Sympathetic stimulation
The rat was placed in a supine position and a lateral incision (∼4 cm) was made ∼0.8 cm posterior to the xiphoid process. The abdominal muscle layer was opened and the superior epigastric arteries cauterised. Using cotton swab sticks and gauze, a window to the left lumbar region was created by gently reflecting the liver anteriorly (against the diaphragm), the stomach and spleen right‐laterally and the small intestine posteriorly. The lumbar sympathetic chain (L) was located by following the left renal vein to its apposition to the abdominal aorta and identifying the L4 sympathetic ganglia under the abdominal aorta. After dissecting the lumbar sympathetic chain away from surrounding tissue, the chain was transected at L2 and the peripheral end (between L2 and L3) placed inside a silicon cuff with bipolar platinum–iridium electrode contacts. The cuff electrode was secured in place by suturing to the psoas major muscle (Ethibond polyester suture 6‐0, Ethicon, USA). A 1:1 mixture of petroleum jelly (Vaseline, UK) and polyethylene glycol (PEG‐200, Alfa Aesar, UK) was applied to the exposed nerve for protection and electrical isolation.
To stimulate the nerves, the cuff electrode were connected to an isolated voltage stimulator (DS2, Digitimer, UK) which was triggered externally via the acquisition hardware. The output was manipulated using a custom‐designed software script (Spike2, CED) allowing stimulation with different patterns (bursts and tonic) and frequencies.
Stimulation protocol
Stimulation amplitude was fixed as the voltage at which a half‐maximal change in blood flow was produced in response to a 15 s train of high‐frequency (40 Hz) tonic pulses (2 ms pulse width). The range of stimulus voltages was 0.5–2.5 V and this ensured the stimulation amplitude was both sub‐maximal and supra‐minimal (Fig. 2 C). The voltage ranges we used were similar to those applied with comparable cuff electrodes to sympathetic nerves described previously (Stauss & Kregel, 1996; Rathner & McAllen, 1998).
The sympathetic nerve was then stimulated with different patterns; tonic and bursting (Fig. 2 B). Two bursting patterns were considered in this study, motivated by resting respiratory modulation of sympathetic nerve activity to match a slow and fast respiratory rate (60–120 breaths per minute) observed in vivo (Habler et al. 1994; Malpas, 1998). The burst duration was fixed at 250 ms – approximately the duration of a respiratory modulated waveform of sympathetic activity recorded in situ (Paton, 1996; Simms et al. 2009), and used previously in vivo (Stauss & Kregel, 1996).
These two bursting patterns consist of bursts of voltage pulses occurring every 1 s (1 Hz bursting) and 0.5 s (2 Hz bursting) matching the aforementioned respiratory rates. The number of pulses in each burst was altered, allowing control of the average firing frequency of the stimulation (see below). To determine the dependency of vascular resistance on stimulation patterning (bursting vs. tonic), the aforementioned tonic and two ‘respiratory’ bursting patterns were applied to the sympathetic chain, controlling for the average firing frequency across the patterns. The sympathetic chain was stimulated with average firing frequencies of 2 Hz, 4 Hz, 8 Hz and 10 Hz, for both tonic and the two bursting patterns. For each pattern, the number of pulses per burst was adjusted to achieve the desired average firing frequency (4 Hz average firing frequency example in Fig. 2 B).
Pharmacological assessment of the transmitters mediating the VR response
Pharmacological experiments were conducted on a separate cohort of Wistar rats (n = 2) to assess the contribution of α1‐adrenorecptors in mediating the changes in vascular resistance using prazosin (1 mg kg−1 i.v.). Arginine vasopressin (AVP; 5 μm) was infused at 10–100 μl min−1 pump (syringe pump NE‐1000, New Era Pump Systems) to restore blood pressure to control levels in the presence of prazosin. Bolus i.v. administration of phenylephrine (PE; 30–50 μg kg−1) was used to test the efficacy of the α1‐adrenoreceptor blockade.
Statistical tests and data analysis
Data were expressed as means ± standard error (SEM); n refers to the number of animals. Statistical significance, defined as P < 0.05, was assessed using Student's two‐tailed t test, ANOVA with Bonferroni post hoc tests, Kruskal–Wallis non‐parametric test with Dunn's multiple comparison test or repeated measures ANOVA (Prism 5, GraphPad Software, San Diego, USA). Time‐series data were exported to MATLAB 6.1 (The MathWorks Inc., Natick, MA, USA) for further analysis.
Results
Respiratory modulated bursting increases vascular resistance in a mathematical model of an artery
The model was driven with tonic and respiratory modulated bursting and the arterial radius and VR responses calculated (Fig. 3). In response to tonic stimulation at an average firing frequency of 8 Hz (Fig. 3 Aa), the spatial NA concentration increased (Fig. 3 Ab), and consequently the arterial radius decreased (Fig. 3 C). As the average firing frequency of the tonic stimulation increased, the arterial radius (r) decreased further in a sigmoidal fashion (Fig. 3 C); EC50 of 8.1 Hz. Sympathetic neurones were stimulated with bursts (1 s inter‐burst interval, 250 ms burst duration; Fig. 3 Ba) – mimicking respiratory modulated bursting in situ (Simms et al. 2009; Briant et al. 2014; Moraes et al. 2014; Stalbovskiy et al. 2014). It was found that such stimulation increased the spatial NA concentration markedly in comparison to tonic patterning (Fig. 3 Bb). As the average firing frequency of the bursting stimulation increased, the decrease in radius (r) was greater than that observed using frequency‐matched tonic stimulation (EC50 = 6.2 Hz; Fig. 3 C). Conversely, 1/r 4 – a proxy for VR – increased with increasing average firing frequency (Fig. 3 D). In summary, and consistent with our hypothesis, bursting patterns with respiratory rhythms preferentially increased VR compared to tonic patterns in the mathematical model.
Figure 3. Respiratory burst stimulation evokes greater arterial contractions in a mathematical model of an artery .
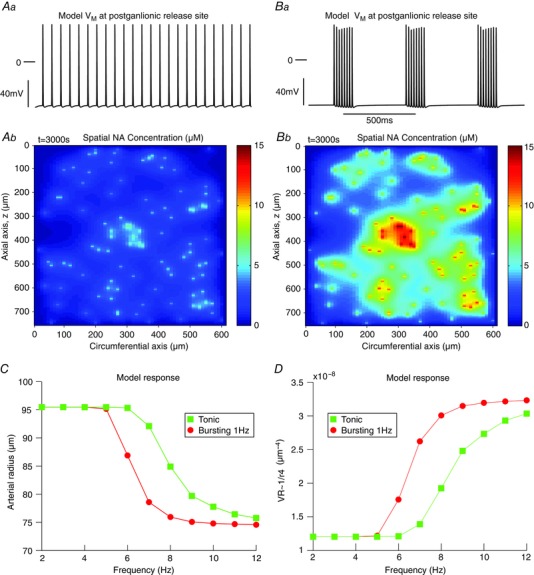
Model response to tonic (A) and bursting (B) stimulation at an average firing frequency of 8 Hz. Stimulating the model to tonically fire at 8 Hz (Aa) drove NA release at the varicosities (Ab). This release, peaking at 7 μm, diffused across the arterial segment, and caused a reduction in arterial radius r (C) and an increase in a proxy for VR (1/r 4), as given by the Hagen‐Poiseuille equation (D). The tonic response of the arterial radius and VR in the model (squares) increased with increasing average firing frequency. Stimulating the model with bursts (250 ms duration; 1 s burst interval) (Ba), and the same average firing frequency of 8 Hz, caused a greater release of NA (Bb) that peaked at 14 μm. This released NA caused a greater change in arterial radius (C) and VR (D), compared to frequency‐matched tonic stimulation (circles). VR = vascular resistance.
Vascular resistance response depends on sympathetic patterning in vivo
These computational findings were then tested in vivo. Following L2 transection, MAP (66.3 ± 3.2 mmHg) and VR (67.9 ± 14.8 mmHg min–1 ml–1) in Wistar rats (n = 8) was not significantly different from MAP (73.7 ± 4.1 mmHg; P = 0.22) and VR (95.5 ± 15.8 mmHg min–1 ml–1; P = 0.09) in SH rats (n = 8). The sympathetic chain was stimulated in Wistar rats with tonic and two bursting patterns (1 Hz and 2 Hz inter‐burst frequencies) at the same average firing frequency (representative example shown in Fig. 4). Stimulation increased BP and decreased BF (Fig. 4 A), indicating that VR had increased (Fig. 4 C). At 8 Hz stimulation, bursting patterns produced a greater increase in VR compared to tonic stimulation (Fig. 4 C). Steady‐state VR was also higher in response to bursting stimulation than tonic. Note that HR did not change during stimulation (Fig. 4 B), confirming that the change in VR was most likely due to vasoconstriction and not an alteration in cardiac output.
Figure 4. Respiratory burst patterning evokes a greater increase in vascular resistance in Wistar rats in vivo .
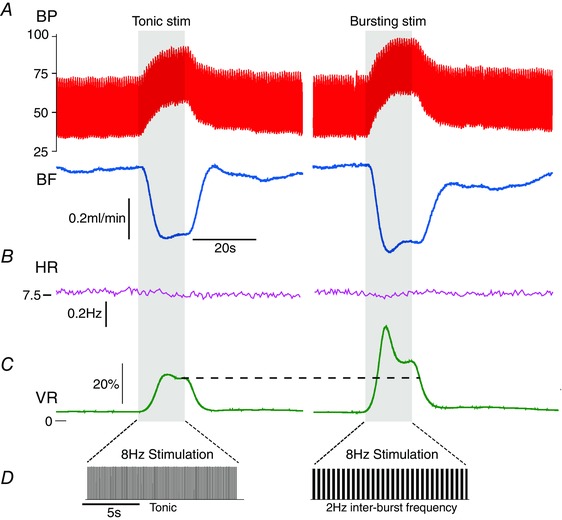
The sympathetic ganglia were stimulated with tonic and bursting patterns (with the same average firing frequency) for 15 s. In response to 8 Hz stimulation, blood pressure (BP) increased and blood flow (BF) decreased (A), and consequently vascular resistance (VR) increased (C). Bursting patterns of stimulation produced a larger increase in VR than tonic patterns. This was characterised by a larger, initial transient increase in VR and also a larger steady‐state response (dashed line). B, note that the heart rate (HR) did not change during the stimulus epoch (shaded region). D, the 15 s stimulus for both tonic and bursting (2 Hz inter‐burst frequency) patterns.
Vascular responses to tonic and bursting stimuli were compared systematically over a range of frequencies in eight Wistar rats (Fig. 5). VR in response to stimulation was represented as a percentage of the maximum response. The rise time (Fig. 5 B), and steady‐state (Fig. 5 C) and maximum (Fig. 5 D) VR responses to tonic and bursting (at 1 Hz or 2 Hz) were measured. At low average firing frequencies (2 Hz, 4 Hz), the maximal VR response was not dependent on pattern, as revealed by a two‐way repeated measures ANOVA (Fig. 5 D). However, at 8 Hz and 10 Hz stimulation, the maximal VR response was greater for bursting patterns. For example, for an average firing frequency of 8 Hz, bursting at 1 Hz produced a VR response that was 57.8 ± 3.3% of maximum, compared to 44.8 ± 4.2% for tonic patterning (P < 0.001). The ANOVA revealed that stimulation pattern was a significant source of variation (P < 0.001). Bursting therefore produces a greater maximum VR response than tonic stimulation. Similarly, the steady‐state response of VR was also dependent on stimulation patterning (Fig. 5 C), as revealed by a two‐way repeated measures ANOVA, with bursting patterns producing a greater steady‐state VR than tonic patterns at 8 and 10 Hz. Thus, in Wistar rats, burst stimulation with a respiratory rhythm produced a greater VR response than tonic patterns. A single exponential was fitted to the rise profile of the VR response to 10 Hz stimulation (n = 8, Fig. 5 B). The measured time constant of this rise in response to tonic stimulation (2.35 ± 0.20 s) was significantly greater than that of 1 Hz (2.06 ± 0.10 s; P < 0.05) and 2 Hz (1.98 ± 0.09 s; P < 0.01) bursting. Bursting patterns therefore also produced a faster rise time in the VR response than tonic patterns in adult Wistar rats.
Figure 5. Respiratory bursting preferentially increases vascular resistance in the Wistar rat in vivo .
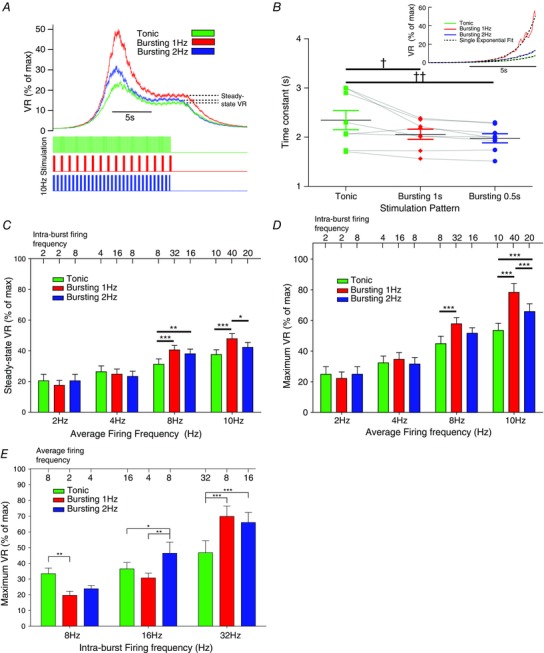
The vascular resistance (VR) response to tonic and bursting (1 Hz and 2 Hz) patterns was measured and compared in Wistar rats (n = 8). A, VR was normalised by the maximal VR response (evoked by a 40 Hz tonic train) and expressed as a percentage. For 10 Hz average firing frequency, 1 Hz and 2 Hz bursting rhythms produced a greater maximal (peak) and steady‐state (dashed line) VR response than tonic stimulation. B, the rise‐profile of the VR response to tonic and bursting patterns was investigated. A single exponent was fitted to the rise profile (inset; dashed lines) and the time constant of rise measured. The time constant of rise for tonic (2.35 ± 0.20 s) was greater than that for 1 Hz (2.06 ± 0.10 s; P < 0.05) and 2 Hz (1.98 ± 0.09 s; P < 0.01) bursting. VR therefore increases faster in response to bursting than tonic patterns. C, the steady‐state VR response was measured for all average firing frequencies of stimulation in Wistar rats. At 8 Hz and 10 Hz average firing frequencies, the response was greater for bursting with a 1 Hz inter‐burst frequency, compared to tonic stimulation. Two‐way mixed‐measures ANOVA revealed that frequency (P = 0.013), stimulation pattern (P < 0.001) and an interaction of these two (P = 0.001) all significantly influence the steady‐state VR response. D, maximum VR response was also measured, and was significantly influenced by pattern (P < 0.001; two‐way repeated measures ANOVA). At 8 Hz and 10 Hz, bursting patterns produced a greater maximum VR response that tonic patterns. E, In 6 Wistars, we also delivered 80pulses at fixed intra‐burst frequencies (8, 16 and 32 Hz), for tonic and bursting (1 Hz and 2 Hz) patterns, and measured the maximum VR response. At 16 Hz and 32 Hz, bursting evoked a greater increase in VR than tonic patterning. *P < 0.05, **P < 0.01, ***P < 0.001, two‐way repeated measures ANOVA, Bonferroni post hoc; † P < 0.05, †† P < 0.01, one‐way repeated measures ANOVA, Bonferroni post hoc.
We also conducted a separate stimulation protocol in six Wistars that controlled for intra‐burst firing frequency (Fig. 5 E). Tonic and bursting (1 Hz and 2 Hz) patterns of 80 stimulus pulses were delivered, whilst fixing intra‐burst firing frequency at 8, 16 or 32 Hz. At 32 Hz intra‐burst frequency, 1 Hz bursting (69.9 ± 6.6%, P < 0.001) and 2 Hz bursting (66.0 ± 6.4%, P = 0.002) evoked a greater maximal VR response than tonic patterning (46.8 ± 7.6%), as revealed by two‐way repeated measures ANOVA.
Enhanced vascular resistance response to respiratory bursting is mediated by a noradrenergic mechanism
Addition of prazosin, an α1‐adrenergic receptor antagonist, completely blocked the increases in vascular resistance produced by tonic and bursting patterns of nerve stimulation and by exogenous phenylephrine (Fig. 6). We applied all three stimulus patterns (10 Hz average firing frequency, n = 2) to the sympathetic nerve before prazosin administration (Fig. 6 Aa). In the presence of prazosin, no response to 10 Hz average firing frequency nerve stimulation was observed for any of the patterns (Fig. 6 Ab). The efficacy of the α1‐adrenoreceptor blockade was confirmed by the absence of a response to i.v. PE infusion (Fig. 6 B). These data indicate that the increased VR response to bursting in the adult Wistar (Figs 4 and 5) is due to an NA‐mediated mechanism.
Figure 6. Enhanced vascular resistance response to respiratory bursting is mediated by a noradrenergic mechanism .
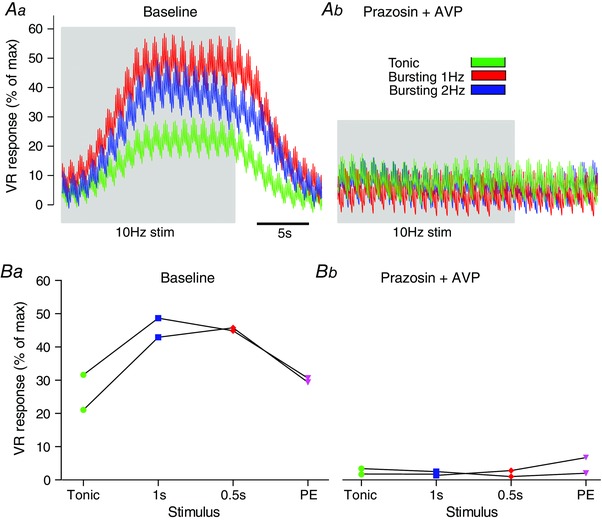
The contribution of noradrenaline (NA) to the VR response to sympathetic stimulation was tested in WYK rats (n = 2). Aa, stimulation (10 Hz average firing frequency) was applied to the sympathetic nerve, at all 3 patterns; tonic, 1 Hz bursting and 2 Hz bursting. Ab, prazosin (1 mg kg−1) was then given (i.v.) to block α1‐adrenoreceptors. The stimulation patterns were repeated and no response was seen. B, this was repeated in n = 2 animals. Given that the response following blockade was completely abolished, we conclude that: (1) the VR response was mediated by a NA mechanism and (2) the enhanced VR response to respiratory modulated bursting was also due to a NA‐mediated mechanism. PE = phenylephrine.
Dependency on sympathetic stimulation pattern is lost in the SH rat in vivo
In SH rats (n = 8), the steady‐state response to stimulation was dependent on the average firing frequency of stimulation (P < 0.01), as observed in Wistar rats (see above) and revealed by a two‐way repeated measures ANOVA (Fig. 7). Stimulation pattern, however, was no longer a significant source of variation (P = 0.21). At 8 Hz stimulation, tonic stimulation produced similar VR responses to bursting at 1 Hz and 2 Hz (25.5 ± 3.0% vs. 29.8 ± 3.2%, P = 0.13 and 24.0 ± 3.2%, P = 0.78, respectively). Similarly, the maximum VR response to each stimulation pattern was not different: for example, the maximum VR response to 8 Hz tonic stimulation (37.4 ± 3.5%) was not different to that produced by 1 Hz (44.6 ± 3.9%; P = 0.57) or 2 Hz (35.9 ± 2.9%; P = 0.30) burst patterns. Thus, peak and steady‐state VR responses do not depend on stimulation pattern (tonic or respiratory bursting) in the adult SH rat.
Figure 7. Stimulation pattern does not influence the vascular resistance (VR) response in the spontaneously hypertensive (SH) rat .
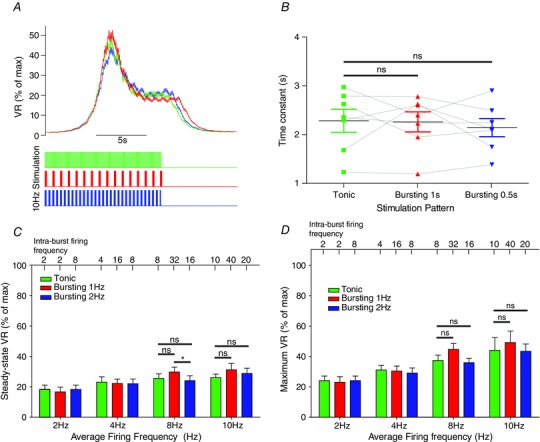
A, the VR response to tonic and bursting (1 Hz and 2 Hz) patterns was measured and compared in SH rats (n = 8). Time‐series data indicated that the VR response was independent of stimulation patterning (bursting vs. tonic). B, the rise‐profile of the VR response to tonic and bursting patterns was investigated in the SH rat. A single exponent was fitted to the rise profile and the time constant of rise measured. The time constant of rise for tonic (2.28 ± 0.23s) was not different to that for 1 Hz (2.25 ± 0.21 s, P = 0.99) and 2 Hz (2.14 ± 0.19 s, P = 0.31) bursting, as revealed by one‐way repeated measures ANOVA (P = 0.668). The rate of increase of VR in response to sympathetic stimulation is therefore independent of patterning in the SH rat. C, the steady state VR response was not different across the stimulation patterns, as revealed by a two‐way ANOVA. D, similarly, the maximal VR response did not differ across the stimulation patterns. *P < 0.05, ns = not significant (all P values greater than 0.3).
Finally, the rise profile of the VR response to 8 Hz stimulation in SH rats was fitted with a single exponential, and the time constant of rise to tonic (2.28 ± 0.24 s) versus 1 Hz (2.24 ± 0.21s) and 2 Hz (2.14 ± 0.19s) burst patterning was not different (P = 0.67; Fig. 7 B). Thus, the rate of VR response does not depend on stimulation pattern in the adult SH rat. Therefore, adult SH rats exhibited a loss of the pattern‐dependent response to sympathetic stimulation.
Role of NA uptake in pattern‐dependent response of vasculature to sympathetic stimulation
We used the model to investigate which mechanism may explain the pattern dependency in the Wistar rat (Fig. 8). We focused on alterations in the reuptake of NA, as this has been implicated in pattern‐dependent contractile responses in the rat tail artery in vitro (Gonon et al. 1993; Stjarne et al. 1994; Stjarne & Stjarne, 1995). To test this hypothesis, the rate of reuptake of NA was reduced 3‐fold from its original value (of k h = 0.003 ms−1; see Briant et al. (2015)), and the model was again driven with tonic and bursting patterns (Fig. 8 A). As a consequence of this parameter alteration, the model artery was found to lose its pattern dependency, with both tonic and bursting patterns now producing similar changes in arterial radius (Fig. 8 A), a situation analogous to the SH rats (Fig. 7). These data suggest that NA reuptake mechanisms may cause the pattern dependent response seen in Wistar rats.
Figure 8. Role of NA uptake on pattern dependency .
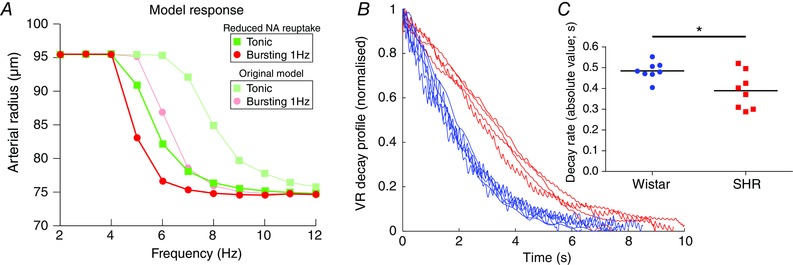
A, the rate of reuptake of NA from the synaptic cleft was reduced 3‐fold in the model. The model was then stimulated with tonic (squares) and 1 Hz bursting (circles) patterns of activity at average firing frequencies of 2–12 Hz. The response of the original model with normal rates of NA reuptake is also shown (shaded circles/squares). Following decreased rate of NA reuptake, the response of the model becomes independent of stimulation pattern. B and C, the decay profile of vascular resistance (VR; following a 15 s 10 Hz tonic stimulus) in Wistar (n = 8) and SH (n = 8) rats was fitted with a single exponential. The time constant of decay of VR in SH rats (0.48 ± 0.02s) was significantly smaller than in Wistar rats (0.39 ± 0.03 s; P = 0.016), suggesting decreased reuptake of NA in the SH rat. *P < 0.05, **P < 0.01, ***P < 0.001.
Our computational data (Fig. 8 A) also suggested that the loss of pattern dependency in the SH rat may be due to a reduction in the rate of NA reuptake. Diminished NA reuptake mechanisms have been reported in human hypertension (Rumantir et al. 2000; Schlaich et al. 2004) and in the SH rat (Cabassi et al. 2001; Shanks et al. 2013); we therefore tested whether NA reuptake may explain the loss of pattern dependency in the SH rat in vivo. When the decay profile of the VR response (following the offset of the stimulus) was analysed in the experimental data (0.48 ± 0.02 s−1 for Wistar rats; n = 8), the decay time constant was seen to be significantly reduced in the SH rat (0.39 ± 0.03 s−1; n = 8; P = 0.016; Fig. 8 B and C). These experimental data suggest that SH rats exhibit prolonged vasoconstriction following sympathetic input, which may be evidence of reduced NA reuptake mechanisms in the anaesthetised adult SH rat in vivo.
Amplified respiratory modulation in the Wistar rat
Finally, we stimulated the sympathetic chain with tonic and bursting patterns in eight Wistar rats at 4 Hz and 8 Hz average firing frequencies (Fig. 9). For each pattern, the difference in the maximum VR response at 8 Hz and 4 Hz was calculated (Fig. 9 C). This gain in the peak VR response due to tonic patterning (10.9 ± 3.1%) was smaller than the gain by 1 Hz bursting (26.3 ± 4.1%, P = 0.01) and 2 Hz bursting (20.1 ± 3.6, P = 0.02).
Figure 9. Amplification of respiratory modulation preferentially increases vascular resistance in vivo .
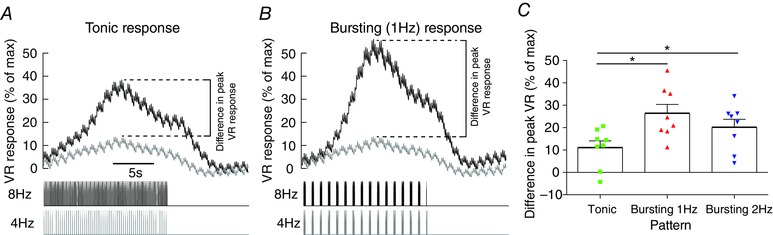
The sympathetic nerve was driven with voltage pulses with a tonic and bursting (1 Hz and 2 Hz inter‐burst) patterns at 4 Hz and 8 Hz frequencies in Wistar rats (n = 8). This doubling of frequency mimics the amplification of respiratory–sympathetic coupling seen in the SH rat (Simms et al. 2009; Briant et al. 2014; Moraes et al. 2014). A, tonic patterning at 8 Hz produces a marked increase in vascular resistance (VR) compared to 4 Hz. B, bursting (1 Hz inter‐burst frequency) with an 8 Hz average firing frequency similarly produces a greater VR response than 4 Hz, but the difference (dashed lines) in these two responses was greater than the tonic difference. C, this difference between the 4 Hz and 8 Hz VR response for each stimulation patterns was measured (dashed lines). This difference was greater in response to 1 Hz bursting than tonic (one‐way ANOVA; P < 0.05), suggesting that an amplification of the respiratory component will produce a greater increase in VR than an equivalent tonic increase. Hence a doubling of sympathetic output (4 Hz→8 Hz) via increased respiratory modulation (as in the pre‐hypertensive SH rat), would greatly increase VR compared to an equivalent tonic increase in output.
Discussion
In this investigation we have used mathematical modelling and in vivo techniques to quantify the influence of respiratory modulation of sympathetic activity on vascular resistance. The modelling indicated that respiratory modulated bursting of SNA should increase VR more than tonic stimulation at the same average firing rate. Subsequent in vivo experiments confirmed that respiratory modulated bursting preferentially increases the rate of rise and absolute value of VR in Wistar but not SH rats. In Wistar rats, respiratory modulation of sympathetic activity is therefore a crucial determinant of vascular tone; its recruitment more quickly and reliably increases VR compared to tonic increases in sympathetic output. The modelling data suggested that this pattern dependence was due to a NA mechanism and this was supported by pharmacological data in vivo.
Model of sympathetic innervation of artery
We note that this is the first such model of the contractile response of an artery following sympathetic stimulation. Importantly, the model output mimicked experimental data phenomologically and was useful for guiding data collection, testing hypotheses and asking new questions. Our model does, however, come with limitations; we have not modelled numerous processes that are involved in neuromuscular signalling at arteries, including co‐transmitters and pre‐synaptic receptors. Nevertheless, our model accurately captures the responses we observed in vivo, and so provides a good explanation of the origins of the contractile response of artery to sympathetic stimulation.
Importance of respiratory modulation of sympathetic activity
Our results highlight the importance of respiratory modulated bursting of sympathetic activity as a reliable and robust method of neuro‐vascular communication. We have demonstrated that respiratory modulated bursts of SNA are important for autonomic function as they produce robust changes in VR, with a quicker response time than seen with tonic stimulation. This may explain why respiratory modulation of sympathetic activity is both recruited and augmented to mediate cardiorespiratory response to reflex challenges (Guyenet, 2000; Dick et al. 2004; Mandel & Schreihofer, 2009; Moraes et al. 2012; Zoccal et al. 2014) as during these defensive reflexes it will be important to elevate vascular tone reliably and quickly.
Can we expect to see our result of an amplified vascular response to bursting physiologically, given that it occurs at average firing frequencies of 8 Hz? Gain at the pre‐to‐postganglionic node in the vasoconstrictor pathway is known to occur, especially during bursts of activity (Birks et al. 1981; Birks & Isacoff, 1988). Sympathetic preganglionic neurones in the un‐anaesthetised (in situ) Wistar‐Kyoto rat fire at 2.5 Hz with an SD of 1.6 Hz (Briant et al. 2014; Stalbovskiy et al. 2014). Pre‐to‐postganglionic gain is known to be approximately 2.5 (Bratton et al. 2010; Springer et al. 2015), therefore we may expect firing frequencies in sympathetic postganglionic neurones in the Wistar rats of 7.5 Hz (3 × 2.5; 3 Hz being in 0.5 SD). Indeed, frequencies of ∼6 Hz have been reported in anaesthetised rat sympathetic ganglia in vivo (McLachlan et al. 1998; Bratton et al. 2010). Furthermore, we note that in conditions of sympathoexcitation, average firing frequencies of individual sympathetic preganglionic neurones can be markedly increased to beyond 8 Hz (Stalbovskiy et al. 2014). Therefore, inputs to sympathetic postganglionic neurones of 8 Hz are seen physiologically under conditions of sympathetic recruitment. The fact that these firing rates are seen during chemoreflex activation is pertinent, given that sympathetic overactivity and amplified respiratory modulation in hypertension has been attributed to changes to chemoreflex sensing in SH rats (Zoccal & Machado, 2011). Moreover, in the pre‐hypertensive SH rat, where average preganglionic firing frequencies under resting conditions of 3.5 Hz have been reported (Briant et al. 2014), after accounting for gain we may expect postganglionic firing rates of 8 Hz (3.5 × 2.5). Therefore, these results at 8 Hz can be expected to occur in the Wistar and SH rats under physiological conditions.
Noradrenergic mechanism underlying the pattern‐dependent vascular response
Both the experimental and modelling data presented indicate that the pattern dependency of the vasculature to sympathetic stimulation is mediated by a NA mechanism. Such a mechanism could involve increased exocytosis of large NA vesicles, increased release of NA co‐transmitters or saturation of NA reuptake.
Exocytosis of vesicles containing NA would be expected to be more reliable in response to bursts of sympathetic activity, due to the increase in release probability associated with repetitive firing (Lisman, 1997). Moreover, bursts arriving at the sympathetic terminal may increase the release probability of larger vesicles, which would be expected to have a greater effect on SMC contractility. Evidence for this comes from amperometric measurements of synaptic events in A1 and A2 noradrenergic neurones (Chiti & Teschemacher, 2007). Large NA release events comprised a small proportion of the total amperometric events (2%), but represented a significant proportion of the total charge (>25%). These large quantal events were reported to release up to 45‐fold more molecules of NA than the smaller events. Peripheral noradrenergic (sympathetic) nerve terminals also contain large, NA‐packed vesicles (Iversen, 1967; Luff, 1996). Respiratory modulated bursts incoming to the sympathetic terminal may trigger exocytosis of these ‘large dense‐cored vesicles’ (LDCVs), greatly increasing the end‐plate concentration of NA and therefore the contractile response of the vascular bed. Higher frequency stimulation has indeed been shown to increase the release probability of LDCVs from sympathetic terminals (Stjarne, 1989; Cifuentes et al. 2008). Increased release probability of LDCVs may therefore describe a mode for more effective and efficient increases in vascular resistance in response to respiratory bursting.
Sympathetic nerve terminals are known to co‐release neuropeptide‐Y (NPY) and adenosine‐triphosphate (ATP) (Huidobro‐Toro & Donoso, 2004; Burnstock, 2009; Wier et al. 2009). It is known that early during a train of postganglionic action potentials, SMCs are activated by ATP (Wier et al. 2009). In the rat tail artery, ATP is quickly eliminated from the receptor area in 50–100 ms (Bao et al. 1993), and therefore has a short‐lived influence on contractility. Given our stimulations lasted 15 s, it is therefore unlikely that ATP contributes to the pattern‐dependent effect that we have reported in Wistar rats. We note that LDCVs also co‐store NPY (Klein & Lagercrantz, 1981; Lundberg et al. 1989; DePotter et al. 1997; Brock et al. 2000). Therefore, respiratory modulated bursts may evoke LDCV exocytosis, increasing the end‐plate concentrations of both NPY and NA; it may be an interaction between these co‐transmitters that determines the pattern‐dependent response. However, the modulatory influence of NPY on NA‐mediated SMC contraction is not completely understood (Wier et al. 2009). Importantly, during prolonged stimuli – for example, our 15 s stimulation protocol – vasoconstriction is due to NA release (Wier et al. 2009). In line with this, we observed a complete abolition of the vascular response to stimulation following administration of an α1‐adrenoreceptor antagonist (prazosin). Taken together, these data suggest that the vascular response (and its pattern dependence) is due to some NA mechanism.
While sympathetic bursting may increase NA release, another factor likely to increase end‐plate NA concentration is the rate of reuptake or downregulation of reuptake mechanisms. Reuptake of NA is thought to ‘saturate’ during long (Gonon et al. 1993) and high‐frequency (Stjarne et al. 1994) trains of sympathetic stimulation (Stjarne & Stjarne, 1995). It may be expected that NA reuptake becomes saturated during a burst of sympathetic activity – such as a respiratory modulated burst (see Fig. 10 A). With increased NA concentration in the neuromuscular junction the contractile response of the artery wall would be maintained until desensitisation of the α1‐adrenoreceptors occurred. When the rate of NA reuptake in the model was reduced, the exaggerated vasoconstriction observed in Wistar rats was no longer dependent on the stimulation pattern. These simulation data are consistent with a saturation of NA reuptake occurring during a burst; saturation of NA reuptake may therefore explain the enhanced VR response to respiratory modulated bursting seen (in Wistar) in vivo.
Figure 10. Respiratory modulated bursting of sympathetic activity in the ontogenesis of hypertension .
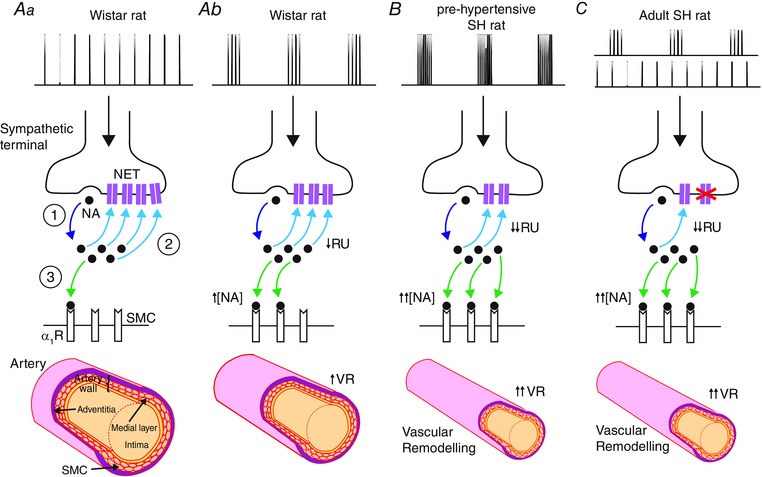
Spikes arriving in the sympathetic terminal trigger the release of noradrenaline (NA; ①). Aa, during tonic stimulation (top trace) in Wistar rats, much of the released NA is cleared by the NA reuptake (RU) transporter (NET; ②). Some of the released NA binds to α1‐adrenoreceptors (α1Rs) on the smooth muscle cell (SMC; ③) membrane, causing a contractile response. Ab, during recruitment of respiratory modulated bursting (top trace) of sympathetic activity in Wistar rats, there is less RU as it becomes saturated (↓RU) and so more NA is available (↑[NA]) to bind to α1Rs, enhancing the contractile response (↑VR). B, Simms et al. (2009) demonstrated that pre‐hypertensive SH rats exhibit amplified respiratory modulated bursting (top trace) and greater increases in VR following reinstatement of this rhythm. This is consistent with the amplified bursts causing greater NET saturation (↓↓RU), resulting in greater NA concentrations in the neuromuscular junction (↓↓[NA]), and therefore a much larger contractile response (↑↑VR). Chronic vasoconstriction may also lead to inward remodelling of the blood vessels, as SMCs are rearranged around a smaller lumen (bottom; Intengan & Schiffrin (2001)). Together, this may contribute to the ontogenesis of hypertension in this strain. C, in the adult SH rat, NET is dysfunctional (crosses), as reported previously (Rumantir et al. 2000; Cabassi et al. 2001; Schlaich et al. 2004). Hence, the contractile response is no longer dependent on the stimulation pattern; the elevated synaptic NA concentration is prolonged in both bursting and tonic patterns (top traces) producing marked vasoconstriction. ↑/↑↑ = increase/large increase; ↓/↓↓ = decrease/large decrease; pre‐hyp = pre‐hypertensive; VR = vascular resistance; [NA] = neuromuscular junction NA concentration; RU = reuptake.
Respiratory modulation of sympathetic activity in the spontaneously hypertensive rat
Whole‐nerve recordings of SNA in the SH rat have demonstrated in situ that the sympathetic–respiratory coupling is amplified, and that this occurs before the onset of hypertension (Simms et al. 2009). Whole‐cell patch‐clamping studies in situ have revealed that components of this amplified respiratory coupling may originate from both central (Moraes et al. 2014) and peripheral (Briant et al. 2014) changes in neuronal excitability. The amplitude of respiratory modulated bursts of sympathetic preganglionic neurones are doubled in the pre‐hypertensive rat (Briant et al. 2014). Our results of in vivo stimulation in the Wistar rat, indicate that such a doubling in respiratory modulated bursting greatly increases VR (Fig. 9). We propose that such a mechanism is involved in the development of hypertension and that this occurs at the pre‐hypertensive stage (neonatal/juvenile) in the SH rat (see Fig. 10 B). Importantly, respiratory–sympathetic coupling is already exaggerated early in neonatal life in SH rats (Simms et al. 2009).
In hypertension, resistance arteries undergo eutrophic and/or hypertrophic remodelling (Intengan & Schiffrin, 2001), with adult SH rats exhibiting predominantly inward eutrophic remodelling (Mulvany et al. 1996). Our results in the adult SH rat differ from that of adult Wistar rats, in that respiratory modulated bursting does not produce an enhanced VR response compared to tonic patterning of the same average firing frequency (Fig. 10 C). These results do not undermine the importance of respiratory modulation of SNA, as hypertension is already established at this age, but do warrant an explanation. One explanation for these data is that the vascular remodelling present at this age in the SH rat may increase the responsiveness of the vasculature to sympathetic drive (Mulvany, 1983; Walsh, 1983; Mulvany, 1984; Nyborg & Bevan, 1988), causing the vasculature to lose its ability to respond further to sympathetic respiratory patterning perhaps due to saturation of vasoconstrictor machinery.
NA reuptake has been reported to be dysfunctional in human hypertension (Rumantir et al. 2000; Schlaich et al. 2004), with a downregulation of the reuptake protein seen in the SH rat (Rho et al. 1981; Cabassi et al. 2001; Shanks et al. 2013). Our in vivo data in the SH rat show that the decay profile of the VR response was slower in the SH rat (Fig. 8 B), consistent with a decrease in the rate of reuptake of NA in the adult SH rat. Furthermore, when the rate of reuptake was reduced in the model, bursting patterns of stimulation no longer preferentially enhanced VR (Fig. 8 A). Thus, NA reuptake dysfunction may also explain the loss of pattern dependency seen in the adult SH rat – consistent with this strain being characterised by hyper‐responsiveness to sympathetic stimulation, irrespective of stimulation pattern. We note that these findings do not preclude the possibility that other mechanisms may be influencing the change in pattern dependency in the SH rat, for example altered α1‐adrenoreceptor sensitivity (Supiano et al. 1994; Supiano et al. 1999) or NPY signalling (Westfall et al. 1990). Indeed, whether this loss of pattern dependency is due to faulty NA reuptake, vascular remodelling or other mechanisms, remains to be validated experimentally in animals.
Concluding remarks
We have for first time shown that vascular resistance depends critically on respiratory modulation using both mathematical modelling and in vivo techniques, and revealed that this preferential response to respiratory bursting in the Wistar (but not SH rat) is due to a noradrenergic mechanism. We suggest that an amplification of this respiratory component would be an important contributor to the development of hypertension in the pre‐hypertensive SH rat to raise vascular tone and contribute to vascular smooth muscle remodelling (Zoccal et al. 2009; Simms et al. 2010). Why adult SH rats do not exhibit a pattern‐dependent response is not known, but may be due to dysfunctional NA reuptake mechanisms and/or vascular remodelling in the adult SH rat.
Additional information
Competing interests
None declared.
Author contributions
The experiments were conducted in the laboratory of J.F.R.P. All authors designed the work. E.L.O. and L.J.B.B. acquired and analysed the data. All authors interpreted the data. L.J.B.B. and A.R.C. designed and built the mathematical model. All authors interpreted output from model simulations. All authors helped draft the manuscript and revise it critically for intellectual content. All authors have read and approve the final version of the manuscript and agree to be accountable for all aspects of the work and in ensuring that questions related to the accuracy or integrity of any part of the work are appropriately investigated and resolved. All persons designated as authors qualify for authorship, and all those who qualify for authorship are listed.
Funding
This study was supported by the British Heart Foundation (Grant RG/12/6/29670, PI: JFRP). LJBB is supported by Biotechnology and Biological Sciences Research Council/Engineering and Physical Sciences Research Council PhD Studentship. EOC is supported by a BHF Horizon Grant (NH/14/1/30761).
References
- Andersson PO (1983). Comparative vascular effects of stimulation continuously and in bursts of the sympathetic‐nerves to cat skeletal‐muscle. Acta Physiol Scand 118, 343–348. [DOI] [PubMed] [Google Scholar]
- Ando S, Imaizumi T & Takeshita A (1993). Effects of patterns of sympathetic‐nerve stimulation on vasoconstricting responses in the hindquarter of rabbits. J Auton Nerv Syst 45, 225–233. [DOI] [PubMed] [Google Scholar]
- Astrand P & Stjarne L (1989). On the secretory activity of single varicosities in the sympathetic nerves innervating the rat tail artery. J Physiol 409, 207–220. [DOI] [PMC free article] [PubMed] [Google Scholar]
- Bao JX, Gonon F & Stjarne L (1993). Kinetics of ATP‐mediated and noradrenaline‐mediated sympathetic neuromuscular‐transmission in rat tail artery. Acta Physiol Scand 149, 503–519. [DOI] [PubMed] [Google Scholar]
- Bennett MR, Farnell L & Gibson WG (2005). A quantitative description of the contraction of blood vessels following the release of noradrenaline from sympathetic varicosities. J Theor Biol 234, 107–122. [DOI] [PubMed] [Google Scholar]
- Birks RI & Isacoff EY (1988). Burst‐patterned stimulation promotes nicotinic transmission in isolated perfused rat sympathetic ganglia. J Physiol 402, 515–532. [DOI] [PMC free article] [PubMed] [Google Scholar]
- Birks RI, Laskey W & Polosa C (1981). The effect of burst patterning of preganglionic input on the efficacy of transmission at the cat stellate ganglion. J Physiol 318, 531–539. [DOI] [PMC free article] [PubMed] [Google Scholar]
- Bloom SR, Edwards AV & Garrett JR (1987). Effects of stimulating the sympathetic innervation in bursts on submandibular vascular and secretory function in cats. J Physiol 393, 91–106. [DOI] [PMC free article] [PubMed] [Google Scholar]
- Bratton BO, Davies P, Janig W & McAllen RM (2010). Ganglionic transmission in a vasomotor pathway studied in vivo . J Physiol 588, 1647–1659. [DOI] [PMC free article] [PubMed] [Google Scholar]
- Briant LJ, Paton JF, Pickering AE & Champneys AR (2015). Modelling the vascular response to sympathetic postganglionic nerve activity. J Theor Biol 371, 102–116. [DOI] [PMC free article] [PubMed] [Google Scholar]
- Briant LJ, Stalbovskiy AO, Nolan MF, Champneys AR & Pickering AE (2014). Increased intrinsic excitability of muscle vasoconstrictor preganglionic neurons may contribute to the elevated sympathetic activity in hypertensive rats. J Neurophysiol 112, 2756–2778. [DOI] [PMC free article] [PubMed] [Google Scholar]
- Brock JA, Dunn WR, Boyd NSF & Wong DKY (2000). Spontaneous release of large packets of noradrenaline from sympathetic nerve terminals in rat mesenteric arteries in vitro. Br J Pharmacol 131, 1507–1511. [DOI] [PMC free article] [PubMed] [Google Scholar]
- Burnstock G (2009). Purinergic cotransmission. Exp Physiol 94, 20–24. [DOI] [PubMed] [Google Scholar]
- Burnstock G & Costa M (1975). Adrenergic Neurons: Their Organization, Function, and Development in the Peripheral Nervous System. Chapman and Hall; distributed by Halsted Press, London, New York. [Google Scholar]
- Cabassi A, Vinci S, Quartieri F, Moschini L & Borghetti A (2001). Norepinephrine reuptake is impaired in skeletal muscle of hypertensive rats in vivo . Hypertension 37, 698–702. [DOI] [PubMed] [Google Scholar]
- Chiti Z & Teschemacher AG (2007). Exocytosis of norepinephrine at axon varicosities and neuronal cell bodies in the rat brain. Faseb J 21, 2540–2550. [DOI] [PubMed] [Google Scholar]
- Cifuentes F, Montoya M & Morales MA (2008). High‐frequency stimuli preferentially release large dense‐core vesicles located in the proximity of nonspecialized zones of the presynaptic membrane in sympathetic ganglia. Dev Neurobiol 68, 446–456. [DOI] [PubMed] [Google Scholar]
- Dahlstrom A & Haggendal J (1966). Some quantitative studies on the noradrenaline content in the cell bodies and terminals of a sympathetic adrenergic neuron system. Acta Physiol Scand 67, 271–277. [DOI] [PubMed] [Google Scholar]
- DePotter WP, Partoens P, Schoups A, Llona I & Coen EP (1997). Noradrenergic neurons release both noradrenaline and neuropeptide Y from a single pool: The large dense cored vesicles. Synapse 25, 44–55. [DOI] [PubMed] [Google Scholar]
- DiBona GF & Sawin LL (1999). Functional significance of the pattern of renal sympathetic nerve activation. Am J Physiol Regul Integr Comp Physiol 277, R346–R353. [DOI] [PubMed] [Google Scholar]
- Dick TE, Hsieh YH, Morrison S, Coles SK & Prabhakar N (2004). Entrainment pattern between sympathetic and phrenic nerve activities in the Sprague‐Dawley rat: hypoxia‐evoked sympathetic activity during expiration. Am J Physiol Regul Integr Comp Physiol 286, R1121–R1128. [DOI] [PubMed] [Google Scholar]
- Gilbey MP (2001). Multiple oscillators, dynamic synchronization and sympathetic control. Clin Exp Pharmacol 28, 130–137. [DOI] [PubMed] [Google Scholar]
- Gonon F, Msghina M & Stjarne L (1993). Kinetics of noradrenaline released by sympathetic‐nerves. Neuroscience 56, 535–538. [DOI] [PubMed] [Google Scholar]
- Guyenet PG (2000). Neural structures that mediate sympathoexcitation during hypoxia. Resp Physiol 121, 147–162. [DOI] [PubMed] [Google Scholar]
- Habler HJ, Janig W & Michaelis M (1994). Respiratory modulation in the activity of sympathetic neurones. Prog Neurobiol 43, 567–606. [DOI] [PubMed] [Google Scholar]
- Hardebo JE (1992). Influence of impulse pattern on noradrenaline release from sympathetic‐nerves in cerebral and some peripheral vessels. Acta Physiol Scand 144, 333–339. [DOI] [PubMed] [Google Scholar]
- Haselton JR & Guyenet PG (1989). Central respiratory modulation of medullary sympathoexcitatory neurons in rat. Am J Physiol Regul Integr Comp Physiol 256, R739–R750. [DOI] [PubMed] [Google Scholar]
- Hillarp NA & Olivecrona H (1946). The role played by the axon and the Schwann cells in the degree of myelination of the peripheral nerve fibre. Acta Anatom 2, 17–32. [DOI] [PubMed] [Google Scholar]
- Huidobro‐Toro JP & Donoso MV (2004). Sympathetic co‐transmission: the coordinated action of ATP and noradrenaline and their modulation by neuropeptide Y in human vascular neuroeffector junctions. Eur J Pharmacol 500, 27–35. [DOI] [PubMed] [Google Scholar]
- Intengan HD, Deng LY, Li JS & Schiffrin EL (1999). Mechanics and composition of human subcutaneous resistance arteries in essential hypertension. Hypertension 33, 569–574. [DOI] [PubMed] [Google Scholar]
- Intengan HD & Schiffrin EL (2001). Vascular remodeling in hypertension – roles of apoptosis, inflammation, and fibrosis. Hypertension 38, 581–587. [DOI] [PubMed] [Google Scholar]
- Iversen LL (1967). The Uptake and Storage of Noradrenaline in Sympathetic Nerves. Cambridge University Press, London. [Google Scholar]
- Janig W (2006). The Integrative Action of the Autonomic Nervous System. Cambridge University Press, Cambridge, UK. [Google Scholar]
- Joseph CN, Porta C, Casucci G, Casiraghi N, Maffeis M, Rossi M & Bernardi L (2005). Slow breathing improves arterial baroreflex sensitivity and decreases blood pressure in essential hypertension. Hypertension 46, 714–718. [DOI] [PubMed] [Google Scholar]
- Julien C, Malpas SC & Stauss HM (2001). Sympathetic modulation of blood pressure variability. J Hypertens 19, 1707–1712. [DOI] [PubMed] [Google Scholar]
- Klein RL & Lagercrantz H (1981). Noradrenergic vesicles: composition and function In Chemical Neurotransmission: 75 Years, eds Stjarne L, Hedqvist P, Lagercrantz H. & Wennmalm A, pp. 69–83. Academic Press, London. [Google Scholar]
- Krizmanich WJ & Lee RM (1993). Scanning electron microscopy of vascular smooth muscle cells from spontaneously hypertensive rats. Scanning Microsc 7, 129–134; discussion 134–125. [PubMed] [Google Scholar]
- Kunimoto M, Kirno K, Elam M, Karlsson T & Wallin BG (1992). Neuroeffector characteristics of sweat glands in the human hand activated by irregular stimuli. Acta Physiol Scand 146, 261–269. [DOI] [PubMed] [Google Scholar]
- Lacroix JS, Stjarne P, Anggard A & Lundberg JM (1988). Sympathetic vascular control of the pig nasal‐mucosa .1. Increased resistance and capacitance vessel responses upon stimulation with irregular bursts compared to continuous impulses. Acta Physiol Scand 132, 83–90. [DOI] [PubMed] [Google Scholar]
- Lambert EA, Schlaich MP, Dawood T, Sari C, Chopra R, Barton DA, Kaye DM, Elam M, Esler MD & Lambert GW (2011). Single‐unit muscle sympathetic nervous activity and its relation to cardiac noradrenaline spillover. J Physiol 589, 2597–2605. [DOI] [PMC free article] [PubMed] [Google Scholar]
- Lemon G, Gibson WG & Bennett MR (2003. a). Metabotropic receptor activation, desensitization and sequestration‐I: modelling calcium and inositol 1,4,5‐trisphosphate dynamics following receptor activation. J Theor Biol 223, 93–111. [DOI] [PubMed] [Google Scholar]
- Lemon G, Gibson WG & Bennett MR (2003. b). Metabotropic receptor activation, desensitization and sequestration‐II: modelling the dynamics of the pleckstrin homology domain. J Theor Biol 223, 113–129. [DOI] [PubMed] [Google Scholar]
- Lisman JE (1997). Bursts as a unit of neural information: Making unreliable synapses reliable. Trends Neurosci 20, 38–43. [DOI] [PubMed] [Google Scholar]
- Luff SE (1996). Ultrastructure of sympathetic axons and their structural relationship with vascular smooth muscle. Anat Embryol 193, 515–531. [DOI] [PubMed] [Google Scholar]
- Lundberg JM, Rudehill A, Sollevi A, Fried G & Wallin G (1989). Co‐release of neuropeptide‐Y and noradrenaline from pig spleen in vivo – importance of subcellular storage, nerve impulse frequency and pattern, feedback‐regulation and resupply by axonal‐transport. Neuroscience 28, 475–486. [DOI] [PubMed] [Google Scholar]
- McLachlan EM, Habler HJ, Jamieson J & Davies PJ (1998). Analysis of the periodicity of synaptic events in neurones in the superior cervical ganglion of anaesthetized rats. J Physiol 511, 461–478. [DOI] [PMC free article] [PubMed] [Google Scholar]
- Malpas SC (1998). The rhythmicity of sympathetic nerve activity. Prog Neurobiol 56, 65–96. [DOI] [PubMed] [Google Scholar]
- Malpas SC (2010). Sympathetic nervous system overactivity and its role in the development of cardiovascular disease. Physiol Rev 90, 513–557. [DOI] [PubMed] [Google Scholar]
- Mandel DA & Schreihofer AM (2009). Modulation of the sympathetic response to acute hypoxia by the caudal ventrolateral medulla in rats. J Physiol 587, 461–475. [DOI] [PMC free article] [PubMed] [Google Scholar]
- Moraes DJA, Dias MB, Cavalcanti‐Kwiatkoski R, Machado BH & Zoccal DB (2012). Contribution of the retrotrapezoid nucleus/parafacial respiratory region to the expiratory–sympathetic coupling in response to peripheral chemoreflex in rats. J Neurophysiol 108, 882–890. [DOI] [PubMed] [Google Scholar]
- Moraes DJA, Machado BH & Paton JFR (2014). Specific respiratory neuron types have increased excitability that drive presympathetic neurones in neurogenic hypertension. Hypertension 63, 1309–1318. [DOI] [PubMed] [Google Scholar]
- Mulvany MJ (1983). Do resistance vessel abnormalities contribute to the elevated blood‐pressure of spontaneously‐hypertensive rats – a review of some of the evidence. Blood Vessels 20, 1–22. [DOI] [PubMed] [Google Scholar]
- Mulvany MJ (1984). Resistance vessel abnormalities in spontaneously hypertensive rats. J Cardiovasc Pharm 6, S656–S665. [DOI] [PubMed] [Google Scholar]
- Mulvany MJ, Baumbach GL, Aalkjaer C, Heagerty AM, Korsgaard N, Schiffrin EL & Heistad DD (1996). Vascular remodeling. Hypertension 28, 505–506. [PubMed] [Google Scholar]
- Nicholson C (1995). Interaction between diffusion and Michaelis‐Menten uptake of dopamine after iontophoresis in striatum. Biophys J 68, 1699–1715. [DOI] [PMC free article] [PubMed] [Google Scholar]
- Nilsson H, Ljung B, Sjoblom N & Wallin BG (1985). The influence of the sympathetic impulse pattern on contractile responses of rat mesenteric arteries and veins. Acta Physiol Scand 123, 303–309. [DOI] [PubMed] [Google Scholar]
- Nyborg NCB & Bevan JA (1988). Increased α‐adrenergic receptor affinity in resistance vessels from hypertensive rats. Hypertension 11, 635–638. [DOI] [PubMed] [Google Scholar]
- Okamoto K & Aoki K (1963). Development of a strain of spontaneously hypertensive rats. Jpn Circ J 27, 282–293. [DOI] [PubMed] [Google Scholar]
- Paton JF (1996). A working heart–brainstem preparation of the mouse. J Neurosci Methods 65, 63–68. [DOI] [PubMed] [Google Scholar]
- Pilowsky PM (2009). Every breath you take: why sympathetic nerve activity comes in bursts. J Physiol 587, 297–297. [DOI] [PMC free article] [PubMed] [Google Scholar]
- Rathner JA & McAllen RM (1998). The lumbar preganglionic sympathetic supply to rat tail and hindpaw. J Auton Nerv Syst 69, 127–131. [DOI] [PubMed] [Google Scholar]
- Rho JH, Newman B & Alexander N (1981). Altered in vitro uptake of norepinephrine by cardiovascular tissues of spontaneously hypertensive rats. Part 2. Portal‐mesenteric veins and atria. Hypertension 3, 710–717. [DOI] [PubMed] [Google Scholar]
- Rumantir MS, Kaye DM, Jennings GL, Vaz M, Hastings JA & Esler MD (2000). Phenotypic evidence of faulty neuronal norepinephrine reuptake in essential hypertension. Hypertension 36, 824–829. [DOI] [PubMed] [Google Scholar]
- Schlaich MP, Lambert E, Kaye DM, Krozowski Z, Campbell DJ, Lambert G, Hastings J, Aggarwal A & Esler MD (2004). Sympathetic augmentation in hypertension: role of nerve firing, norepinephrine reuptake, and angiotensin neuromodulation. Hypertension 43, 169–175. [DOI] [PubMed] [Google Scholar]
- Shanks J, Mane S, Ryan R & Paterson DJ (2013). Ganglion‐specific impairment of the norepinephrine transporter in the hypertensive rat. Hypertension 61, 187–193. [DOI] [PubMed] [Google Scholar]
- Simms AE, Paton JF, Allen AM & Pickering AE (2010). Is augmented central respiratory–sympathetic coupling involved in the generation of hypertension? Respir Physiol Neurobiol 174, 89–97. [DOI] [PubMed] [Google Scholar]
- Simms AE, Paton JF, Pickering AE & Allen AM (2009). Amplified respiratory–sympathetic coupling in the spontaneously hypertensive rat: does it contribute to hypertension? J Physiol 587, 597–610. [DOI] [PMC free article] [PubMed] [Google Scholar]
- Sittiracha T, McLachlan EM & Bell C (1987). The innervation of the caudal artery of the rat. Neuroscience 21, 647–659. [DOI] [PubMed] [Google Scholar]
- Springer MG, Kullmann PH & Horn JP (2015). Virtual leak channels modulate firing dynamics and synaptic integration in rat sympathetic neurons: implications for ganglionic transmission in vivo . J Physiol 593, 803–823. [DOI] [PMC free article] [PubMed] [Google Scholar]
- Stalbovskiy AO, Briant LJ, Paton JF & Pickering AE (2014). Mapping the cellular electrophysiology of rat sympathetic preganglionic neurones to their roles in cardiorespiratory reflex integration: a whole cell recording study in situ . J Physiol 592, 2215–2236. [DOI] [PMC free article] [PubMed] [Google Scholar]
- Stauss HM & Kregel KC (1996). Frequency response characteristic of sympathetic‐mediated vasomotor waves in conscious rats. Am J Physiology Heart Circ Physiol 271, H1416–H1422. [DOI] [PubMed] [Google Scholar]
- Stjarne L (1989). Basic mechanisms and local modulation of nerve impulse‐induced secretion of neurotransmitters from individual sympathetic nerve varicosities. Rev Physiol Biochem Pharmacol 112, 1–137. [DOI] [PubMed] [Google Scholar]
- Stjarne L (2000). Do sympathetic nerves release noradrenaline in “quanta”? J Auton Nerv Syst 81, 236–243. [DOI] [PubMed] [Google Scholar]
- Stjarne L, Bao JX, Gonon F & Msghina M (1994). Nerve activity‐dependent variations in clearance of released noradrenaline – regulatory roles for sympathetic neuromuscular‐transmission in rat tail artery. Neuroscience 60, 1021–1038. [DOI] [PubMed] [Google Scholar]
- Stjarne L & Stjarne E (1995). Geometry, kinetics and plasticity of release and clearance of ATP and noradrenaline as sympathetic cotransmitters – roles for the neurogenic contraction. Prog Neurobiol 47, 45–94. [DOI] [PubMed] [Google Scholar]
- Supiano MA, Hogikyan RV & Sidani MA (1994). Heightened sympathetic nervous‐system activity and α‐adrenergic responsiveness in older hypertensive humans. Clin Res 42, A214–A214. [DOI] [PubMed] [Google Scholar]
- Supiano MA, Hogikyan RV, Sidani MA, Galecki AT & Krueger JL (1999). Sympathetic nervous system activity and alpha‐adrenergic responsiveness in older hypertensive humans. Am J Physiol Endocrinol Metab 276, E519–E528. [DOI] [PubMed] [Google Scholar]
- Wadsworth RM, Berezin I, Crankshaw J, Kwan CY & Daniel EE (1988). Morphology and contractile properties of smooth muscle cells isolated from the dog carotid artery. Blood Vessels 25, 166–184. [DOI] [PubMed] [Google Scholar]
- Walsh GM (1983). Increased systemic vascular responsiveness to catecholamines in spontaneously hypertensive rats. Clin Exp Hypertens A 5, 577–601. [DOI] [PubMed] [Google Scholar]
- Westfall TC, Han SP, Knuepfer M, Martin J, Chen XL, Delvalle K, Ciarleglio A & Naes L (1990). Neuropeptides in hypertension – role of neuropeptide‐Y and calcitonin gene related peptide. Brit J Clin Pharmacol 30, S75–S82. [DOI] [PMC free article] [PubMed] [Google Scholar]
- Wier WG, Zang WJ, Lamont C & Raina H (2009). Sympathetic neurogenic Ca2+ signalling in rat arteries: ATP, noradrenaline and neuropeptide Y. Exp Physiol 94, 31–37. [DOI] [PMC free article] [PubMed] [Google Scholar]
- Yagi S, Becker PL & Fay FS (1988). Relationship between force and Ca2+ concentration in smooth‐muscle as revealed by measurements on single cells. Proc Natl Acad Sci USA 85, 4109–4113. [DOI] [PMC free article] [PubMed] [Google Scholar]
- Zoccal DB, Furuya WI, Bassi M, Colombari DSA & Colombari E (2014). The nucleus of the solitary tract and the coordination of respiratory and sympathetic activities. Front Physiol 5 238. [DOI] [PMC free article] [PubMed] [Google Scholar]
- Zoccal DB & Machado BH (2011). Coupling between respiratory and sympathetic activities as a novel mechanism underpinning neurogenic hypertension. Curr Hypertens Rep 13, 229–236. [DOI] [PubMed] [Google Scholar]
- Zoccal DB, Paton JFR & Machado BH (2009). Do changes in the coupling between respiratory and sympathetic activities contribute to neurogenic hypertension? Clin Exp Pharmacol P 36, 1188–1196. [DOI] [PubMed] [Google Scholar]