

Key points
It is generally assumed that muscle fibres go through atrophy following disuse with a loss of specific force and an increase in unloaded shortening velocity. However, the underlying mechanisms remain to be clarified.
Most studies have focused on events taking place during the development of disuse, whereas the subsequent recovery phase, which is equally important, has received little attention.
Our findings support the hypotheses that the specific force of muscle fibres decreased following unilateral lower limb suspension (ULLS) and returned to normal after 3 weeks of active recovery as a result of a loss and recovery of myosin and actin content.
Furthermore, muscle fibres went through extensive qualitative changes in muscle protein pattern following ULLS, and these were reversed by active recovery.
Resistance training was very effective in restoring both muscle mass and qualitative muscle changes, indicating that long‐term ULLS did not prevent the positive effect of exercise on human muscle.
Abstract
Following disuse, muscle fibre function goes through adaptations such as a loss of specific force (P O/CSA) and an increase in unloaded shortening velocity, which could be a result of both quantitative changes (i.e. atrophy) and qualitative changes in protein pattern. The underlying mechanisms remain to be clarified. In addition, little is known about the recovery of muscle mass and strength following disuse. In the present study, we report an extensive dataset describing, in detail,the functional and protein content adaptations of skeletal muscle in response to both disuse and re‐training. Eight young healthy subjects were subjected to 3 weeks of unilateral lower limb suspension (ULLS), a widely used human model of disuse skeletal muscle atrophy. Needle biopsies samples were taken from the vastus lateralis muscle Pre‐ULLS, Post‐ULLS and after 3 weeks of recovery during which heavy resistance training was performed. After disuse, cross‐sectional area (CSA), P O/CSA and myosin concentration (MC) decreased in both type 1 and 2A skinned muscle fibres. After recovery, CSA and MC returned to levels comparable to those observed before disuse, whereas Po/CSA and unloaded shortening velocity reached a higher level. Myosin heavy chain isoform composition of muscle samples did not differ among the experimental groups. To study the mechanisms underlying such adaptations, a two‐dimensional proteomic analysis was performed. ULLS induced a reduction of myofibrillar, metabolic (glycolytic and oxidative) and anti‐oxidant defence system protein content. Resistance training was very effective in counteracting ULLS‐induced alterations, indicating that long‐term ULLS did not prevent the positive effect of exercise on human muscle.
Key points
It is generally assumed that muscle fibres go through atrophy following disuse with a loss of specific force and an increase in unloaded shortening velocity. However, the underlying mechanisms remain to be clarified.
Most studies have focused on events taking place during the development of disuse, whereas the subsequent recovery phase, which is equally important, has received little attention.
Our findings support the hypotheses that the specific force of muscle fibres decreased following unilateral lower limb suspension (ULLS) and returned to normal after 3 weeks of active recovery as a result of a loss and recovery of myosin and actin content.
Furthermore, muscle fibres went through extensive qualitative changes in muscle protein pattern following ULLS, and these were reversed by active recovery.
Resistance training was very effective in restoring both muscle mass and qualitative muscle changes, indicating that long‐term ULLS did not prevent the positive effect of exercise on human muscle.
Abbreviations
- ABC
ammonium bicarbonate
- ACN
acetonitrile
- Act
actin
- ADK
adenylate kinase
- Akt
protein kinase B
- AMPK
AMP‐activated protein kinase
- BAP
brightness–area product
- CAH III
carbonic anhydrase‐3
- CK
creatine kinase
- CSA
cross‐sectional area
- DNP
2,4‐dinitrophenylhydrazone
- DNPH
2,4‐dinitrophenylhydrazine
- DTT
dithiothreitol
- DVT
deep vein thrombosis
- 4EBP1
eukaryotic translation initiation factor 4E‐binding protein 1
- FA
formic acid
- FoxO
Forkhead box
- IGF
insulin‐like growth factor
- LDHA
lactate dehydrogenase A
- MALDI
matrix assisted laser desorption ionization
- MHC
myosin heavy chain
- MLC
myosin light chain
- MS
mass spectrometry
- mTOR
mechanistic target of rapamycin
- MuRF‐1
muscle‐specific ring finger protein‐1
- NRF2
nuclear factor (erythroid‐derived 2)‐like 2
- PCSA
physiological cross‐sectional area
- PGC‐1α
peroxisome proliferative activated receptor‐γ coactivator 1α
- PO/CSA
specific force
- PRDX3
peroxiredoxin‐3
- 1RM
one repetition maximum
- ROS
reactive oxygen species
- RT
resistance training
- S6Rp
S6 ribosomal protein
- SOD1
Cu/Zn superoxide dismutase
- SREBP‐1
sterol regulatory element binding protein‐1
- TFA
trifluoroacetic acid
- TnIf
troponin‐T fast
- TnTf
troponin‐T fast
- TOF
time‐of‐flight
- V0
unloaded shortening velocity
- ULLS
unilateral lower limb suspension
Introduction
In disuse, muscle weakness and loss of power occur and have dramatic consequences on health and quality of life, especially in the elderly population (Adams et al. 2003; D'Antona et al. 2003). Although the loss in muscle mass is well known to be the major cause of loss of force and power, it has become increasingly clear that changes in muscle quality also play a very relevant role. Indeed, the loss of strength and power mostly exceeds the loss in muscle mass (Berg et al. 1997; Fitts et al. 2001; di Prampero & Narici, 2003).
Disuse can affect the whole body, as in spaceflight or bed rest, or be limited to one limb, as occurs following immobilization or unilateral lower limb suspension (ULLS). We have recently studied the adaptations of muscle proteome and of the underlying intracellular signalling pathways to bed rest as a model of whole body deconditioning (Brocca et al. 2012). The adaptations of skeletal muscle to disuse and the underlying mechanisms widely vary through disuse models (Pellegrino et al. 2011 a). In the present study, we investigate the changes in muscle quality following ULLS, which has been successfully used to induce disuse atrophy in one limb for decades.
Muscle fibres themselves were found to go through not only atrophy, but also qualitative changes following disuse. A disproportionate loss of force compared to cross‐sectional area (CSA) (i.e. a loss of specific force; P O/CSA) (Larsson et al. 1996; Widrick et al. 1999 b; Widrick et al. 2002 b) and an increase in unloaded shortening velocity (V 0)(Widrick et al. 1997; Widrick et al. 1999 a; Widrick et al. 2001) have been observed. However, contradictory findings have been reported (Widrick et al. 1997; Widrick et al. 2002 b; Trappe et al. 2004; Canepari et al. 2010; Fitts et al. 2010) and there is no general consensus on the consequences of disuse on muscle fibre structure and function. Moreover, in most studies conducted so far, in vivo and ex vivo analysis have been performed on different subjects groups, hindering the possibility of relating adaptations observed at individual muscle fibre levels studied ex vivo to those occurring in whole muscles in vivo.
Importantly, the mechanisms underlying the potential loss of P O/CSA and increase in V 0 at muscle fibre level have not been settled either. A decrease in myosin concentration within individual muscle fibres, and therefore a decrease in the number of force developing cross‐bridges, has been suggested as a potential cause of P O/CSA loss (D'Antona et al. 2003; Borina et al. 2010). However, no analysis of P O/CSA and myosin concentration of muscle fibres pre‐ and post‐disuse in young healthy subjects has yet been performed. Moreover, it was recently suggested that impairment of muscle fibre specific force and power as a result of disuse in elderly subjects could depend on altered acto‐myosin kinetics, which in turn are a result of post‐translational modifications of myosin (Callahan et al. 2014).
The observations of a decrease in myosin concentration and of myosin post‐translational modifications highlight the potential occurrence of qualitative adaptations of the whole muscle protein pattern and their potential functional relevance in disuse. In bulk vastus lateralis muscle samples, protein fractions of myosin and actin were found to be unchanged after 35 days of ULLS, notwithstanding significant atrophy (9%)(Carrithers et al. 2002; Haus et al. 2007). By contrast, there is evidence available indicating a loss of myofibrillar proteins and a profound alteration in their relative content in muscle fibres (Riley et al. 2002; Haddad et al. 2005; Borina et al. 2010). Importantly, recent time course analysis of muscle proteome of vastus lateralis following bed rest has confirmed an early and persistent down‐regulation not only of many myofibrillar proteins (Brocca et al. 2012), but also of several other functional groups of proteins (e.g. metabolic enzymes and anti‐oxidant defence systems) underlying the complexity of the qualitative adaptations in muscle protein pattern to disuse and the relevance of a global proteome analysis.
Most studies have focused on events occurring during the development of disuse, whereas the subsequent recovery phase, which is equally important, has received little attention(Berg et al. 1991; Berg & Tesch, 1996; Suetta et al. 2009). Importantly, (Hvid et al.(2014) recently showed that 4 days of lower limb disuse led to marked decrements in knee extensor mechanical muscle function and 7 days of recovery completely restored mechanical function in young individuals.
We recently showed that the loss in isometric torque (26%) and quadriceps volume (10%) and the decrease in fascicle length and pennation angle occurringafter 3 weeks of ULLS were fully restored through active recovery (Campbell et al. 2013). However, it is still unclear whether and to what extent the recovery of in vivo muscle function and muscle architecture was paralleled by the recovery of singlemuscle fibre structure and function, as well as muscle protein pattern, because such adaptations have not been studied following recovery.
The general goal of the present study was to clarify the nature of the qualitative changes of skeletal muscle following disuse and rehabilitation, as well as the underlying mechanisms responsible. The study had two specific and strictly inter‐related aims: (1) to define the adaptations in CSA, P O/CSA and V 0 of identified types of single muscle fibres to disuse and re‐training and to clarify the underlying mechanisms and (2) to define the adaptations of the global muscle protein pattern to disuse and recovery. The study could take advantage of the availability of muscle samples from the same population of young healthy subjects, which we studied in vivo with respect to muscle function, size and architecture (Campbell et al. 2013). The adaptations at the cellular and molecular levels could therefore be related to those occurring in vivo.
Methods
Subjects
Eight healthy young men, aged 18–25 years, with no previous history of traumatic lesions or muscular diseases, were enrolled in the study and subjected to a 3 week ULLS programme followed by a 3 week resistance training programme. All participants provided their written informed consent and the study was approved by the Manchester Metropolitan Faculty of Science and Engineering Ethics Committeeand conformed with the principles of the Declaration of Helsinki on human experimentation.
ULLS
In ULLS, the treated limb is flexed and suspended above the ground by the use of a shoulder harness. The procedure reduces many of the expenses and logistical problems associated with other unloading conditions (bed rest or space flight) (Hackney & Ploutz‐Snyder, 2012). Moreover, confining disuse muscle atrophy to the unloaded limb, it closely resembles joint unloading following muscle and skeletal injuries, a very frequent and relevant condition in clinical practice. ULLS causes a loss of muscle mass, similar to other disuse models of ∼0.44% day–1 in the vastus lateralis, which is among the most affected muscles (Hackney & Ploutz‐Snyder, 2012). Because it was shown previously (Bleeker et al, 2004) that ULLS can be associated with an increased risk of deep vein thrombosis (DVT), the following precautions were used: participants were screened by physicians and excluded if any risk factor for DVT was present; because women, particularly if smokers, are more at risk of DVT, only male subjects were recruited; and participants were monitored every 2 days by measuring the plasma D‐dimer concentration and performing colour coded Doppler sonography to detect development of DVT in the early, subclinical phase.
Resistence training protocol
Following the ULLS, participants attended the laboratory 3 days week–1 for a period of 3 weeks to undergo a resistance training (RT) programme. Quadriceps extensions were performed at 80% of participants’ one repetition maximum (1RM). The 1RM was assessed weekly and the resistance level was adjusted accordingly. Participants first warmed up with a series of submaximal contractions, after which the resistance was increased to find the maximum. The training load was set at 80% of 1RM, and three sets of 10 contractions were performed during each training session using a knee extension machine (Technogym, Cesena, Italy.).
Muscle biopsies
Using a procedure described previously (Bergstrom, 1979; Bottinelli et al. 1996), three needle biopsies were taken from vastus lateralis muscle of all subjects: one pre suspension (Pre‐ULLS), one post suspension (Post‐ULLS) and one post‐exercise recovery (Post‐RT). Muscle biopsies were divided into several portions, and a tissue sharing approach among several laboratories collaborating in the MYOAGE consortium, supported by European Community, was used to optimize, for ethical and economic reasons, the burden on the volunteers. Two, 20 mg portions were used in the present study. One was stored at –20°C in a skinning solution plus glycerol (50% v/v) and used for functional analysis of individual muscle fibres. One was frozen in liquid nitrogen and stored at –80°C for proteomic, gene expression and myosin heavy chain (MHC) isoform distribution analysis. For technical reasons, two glycerinated Post‐ULLS biopsies deteriorated during shipping at –20°C from Manchester, where they were taken, to Pavia, where the analysis was performed, and could not be used for functional analysis of individual muscle fibres. Therefore, only fibres from six subjects were included in the analysis of force and V 0. Proteomic analysis was performed on muscle samples stored and shipped at –80°C from all eight subjects.
Singlefibre analysis
CSA, force and maximum shortening velocity of single muscle fibres were analysed as described in detail previously(Bottinelli et al. 1996). Briefly, segments of single fibres were manually isolated from muscle bundles with the help of a stereomicroscope at 20–40 × magnifications in a muscle chamber containing skinning solution: K‐P 150 mm, KH2PO4 5 mm, MgAc 5 mm, dithiothreitol (DTT) 1 mm, EGTA 5 mm, Na2‐ATP 3 mm, pH 7, leupeptine hydrochloride 20 μg ml–1, E64 10 μm. The fibres were immersed for 1 h in skinning solution containing 0.1% Triton X‐100 and subsequently returned to the previous skinning solution. Each fibre was then mounted between two hooks on a stage of an inverted microscope. Isometric force (P O) and V 0 were measured by the slack test technique, placing each fibre in activating solution: 100 mm KCl, 20 mm imidazole, 5 mm MgCl2, 5 mm Na2ATP, 5 mm EGTA, 25 mm creatine phosphate, 300 U ml−1 creatine kinase (CK), leupeptine hydrochloride 20 μg ml–1, E64 10 μm. Experiments were performed at 12°C, under conditions of maximal activation (pCa 4.5) and at optimal sarcomere length for force developing (Bottinelli & Reggiani, 2000; D'Antona et al. 2003).
For each fibre, length and diameter was measured using the same experimental apparatus; the width and the depth of every fibre was determined at 320 × magnification on 10 different positions on the fibre, rotating the hooks. Assuming fibre section as an ellipse, the CSA was calculated and then the volume was estimated by multiplying CSA and length. Fibres were finally characterized on the basis of MHC isoform.
Myosin concentration analysis
Myosin content analysis was performed using an approach previously described in detail (D'Antona et al. 2003; Borina et al. 2010) with some modifications. After mechanical experiment, the fibres were placed in 30 μl of lysis buffer (Laemmli, 1970) at 4°C for 18 h to complete myosin extraction. Subsequently, for each fibre, 10 and 20 μl of lysis buffer in which the fibre segment was dissolved were loaded onto a 12% linear polyacrylamide gel, run at 16 mA for 4 h at 4°C and stained with Colloidal Coomassie (Gelcode Blue Stain Reagent; Pierce, Rockford, MD, USA). In the same gel, a known amount of myosin standard was loaded to determine a standard curve.
Gels were then imaged using a high‐resolution scanner (Expression 1680 Pro; Epson Corp., Long Beach, CA, USA). The brightness–area product (BAP) of the myosin bands was determined using Photoshop CS5 (Adobe Systems, San Jose, CA, USA). BAP corresponds to the product of the number of pixels of the whole MHC band for the mean intensity level of the pixels. The myosin concentration standard curve was built plotting together BAP values from myosin standard and the known amount of myosin loaded. Finally, BAP values evaluated for a single fibre were inserted into the standard curve, obtaining their myosin concentration.
Analysis of MHC isoform content
Separation and identification of MHC isoforms in single fibres and in the whole biopsy was performed as described previously (Bottinelli et al. 1996; D'Antona et al. 2003). Single muscle fibre segments used for mechanical experiments and a part of the biopsy were dissolved in Laemmli solution (Laemmli, 1970) and loaded onto 6% SDS‐PAGE polyacrylamide gels. Electrophoresis was run overnight at 100 V; following silver stain, three bands were separated in the region of MHC isoforms. In relation to the presence of one or two bands in the MHC region, single fibres can be classified as one of the following types: 1, 2A, 2X (pure fibres) and 1–2A, 2A–2X (mixed fibres). Densitometric analysis of MHC bands was performed to assess the relative proportion of MHC isoforms in the muscle biopsies (Pellegrino et al. 2003).
Two‐dimensional proteome analysis
Sample preparation
Muscle samples were prepared with the same procedures used previously (Brocca et al. 2010). A frozen portion of biopsy was pulverized in a steel mortar with liquid nitrogen to obtain a powder that was immediately resuspended in a lysis buffer (8 m urea, 2 m thiourea, 4% Chaps, 65 mm DTT and 40 mm Tris base). The samples were vortexed, frozen with liquid nitrogen, thawed at room temperature four times, incubated with DNase and RNase for 45 min at 4°C to separate proteins from nucleic acids, and finally spun at 18,000 g for 30 min. The protein concentration in the dissolved samples was determined with a protein assay kit (2D Quant Kit; GE Healthcare Ltd, Little Chalfont, UK). A sample mix was obtained for each experimental group (Pre‐ULLS, Post‐ULLS and Post‐RT). The sample mix contained an equal protein quantity taken from each muscle sample of Pre‐ULLS, Post‐ULLS and Post‐RT.
Two‐dimensional electrophoresis
First‐dimension isoelectrofocusing was carried out using an IPGphor system (Ettan IPGphor isoelectric Focusing System; GE Healthcare). In total, 150 μg of protein was loaded onto IPG gel strips, pH 3–11 NL (non‐linear) 13 cm, which were rehydrated for 14 h, at 30 Vand 20 °C, in 250 μl of reswelling buffer [8 m urea, 2 m thiourea, 2% (w/v) Chaps, 0.1% (v/v) tergitol NP7 (Sigma, St Louis, MO, USA), 65 mm DTT, 0.5% (v/v) pharmalyte 3–11NL (GE Healthcare)]. Strips were focused at 20,000 Vhr, at a constant temperature of 20°C and limiting the current to 50 μA per IPG gel strip. After isoelectrofocusing, the strips were stored at –80°C until use or equilibrated immediately for 10–12 min in 5 ml of equilibration buffer [50 mm Tris, pH 6.8, 6 m urea, 30% (v/v) glycerol, 2% (w/v) SDS, 3% (w/v) iodoacetamide]. Then, the immobiline IPG gel strips were applied to 15% T, 2.5% C polyacrylamide gels without a stacking gel. The separation was performed at 80 V for 17 h at room temperature. 2D gels were fixed for 2 h in fixing solution [ethanol 40% (v/v) acetic acid 10% (v/v)], stained with fluorescence staining (Flamingo Fluorescent Gel Stain; Bio‐Rad, Hercules, CA, USA) for 3 h and destained with 0.1% (w/v) Tween 20 solution for 10 min.
Triplicate gels of each sample group were obtained, visualized using a Typhoon laser scanner (GE Healthcare) and analysed with Platinum Software (GE Healthcare). For the analysis, we considered only spots present in all gels. The software provided the normalized volume for each spot (representing the protein amount). The volumes of each of the spots in the triplicate gels were averaged and spots that were changed statistically (P < 0.05)were obtained.
Protein identification by mass spectrometry and database searching
Mass spectrometry (MS) was performed as previously described (Brocca et al. 2010). 2D gels were loaded with 300 μg of proteins per strip and the electrophoretic run was carried out using the same conditions described above. After staining with Colloidal Coomassie, spots of interest were excised from the gel, destained [100 mm ammonium bicarbonate (ABC) and 50% (v/v) acetonitrile (ACN)] for 45 min at 22°C and dried (100% ACN for 15 min). Protein spots were then reduced with 25 mm ABC containing 10 mm DTT for 1 h at 60°C and then alkylated with 55 mm iodoacetamide in 25 mm ABC for 30 min in the dark at 22°C. Gels pieces were washed and dried using 100% ACN for 10 min. After dehydratation for 1 h at 60°C, gel pieces were incubated with 13 μl of sequencing grade modified trypsin (Promega, Madison, WI, USA; 12.5 μg ml−1 in 40 mm ABC with 10% ACN, pH 8.0) overnight at 40°C (Shevchenko et al. 1996). After digestion, peptides were washed with 30 μl of 25 mm ABC, shrunk with 100% ACN and extracted twice with a mixture of 50% ACN–5% formic acid (FA). For MS and MS/MS matrix assisted laser desorption ionization (MALDI) analysis, peptides were redissolved in 4 μl of α‐CHCA [2.5 mg ml−1 in 70% ACN‐0.1% trifluoroacetic acid (TFA)]. Next, 1.5 μl of each sample was spotted directly onto a dry MALDI plate (ABSciex, Foster City, CA, USA). Peptides on the MALDI plate were then desalted with a cold solution of 10 mm ammonium phosphate and 0.1% TFA. The analysis of samples was performed using a MALDI‐time‐of‐flight (TOF)‐TOF 4800 mass spectrometer (ABSciex). Spectra acquisition and processing was performed using the 4000 series explorer software (ABSciex), version 3.5.28193, in positive reflectron mode at fixed laser fluency with low mass gate and delayed extraction. Peptide masses were acquired by steps of 50 spectra for the range 900–4000 Da. MS spectra were summed from 500 laser shots from an Nd‐YAG laser operating at 355 nm and 200 Hz. After filtering tryptic‐, keratin‐ and matrix‐contaminant peaks up to 15 parent ions were selected for subsequent MS/MS fragmentation according to mass range, signal intensity, signal to noise ratio and absence of neighbouring masses in the MS spectrum. MS/MS spectra were acquired in 1 kV positive mode and 1000 shots were summed by increment of 50. Database searching was carried out using Mascot, version 2.2 (MatrixScience, London, UK) combining MS and MS/MS interrogations on human from SwissProt databank (20 321 sequences, March 2012; http://www.expasy.org). Positive identification was based on a Mascot score above the significance level (i.e. <5%). MS and MS/MS Orbitrap analyses were realized using an Ultimate 3000 Rapid Separation Liquid Chromatographic system (Thermo Fisher Scientific, Waltham, MA, USA) online with a hybrid LTQ‐Orbitrap‐Velos mass spectrometer (Thermo Fisher Scientific). Briefly, peptides were loaded and washed on a C18 reverse phase precolumn (3 μm particle size, 100 Å pore size, inner diameter 150 μm, length 1 cm). The loading buffer contains 98% H2O, 2% ACN and 0.1% TFA. Peptides were then separated on a C18 reverse phase resin (2 μm particle size, 100 Å pore size, inner diameter 75 μm, length 15 cm) with a 4 min ‘effective gradient’ from 100% A (0.1% FA and 100% H2O) to 50% B (80% ACN, 0.085% FA and 20% H2O). The Linear Trap Quadrupole Orbitrap mass spectrometer acquired data throughout the elution process and operated in a data‐dependent scheme with full MS scans acquired with the Orbitrap, followed by up to 20 LTQ MS/MS CID spectra on the most abundant ions detected in the MS scan. Mass spectrometer settings were: full MS (AGC: 1 × 10⁶, resolution: 6 × 10⁴, m/z range 400–2000, maximum ion injection time: 500 ms); MS/MS (AGC: 5 × 10³, maximum injection time: 50 ms, minimum signal threshold: 500, isolation width: 2 Da, dynamic exclusion time setting: 15 s). Fragmentation was permitted of precursor with a charge state of 2, 3, 4 and up. For database searching, all search parameters were the same as those used for the MALDI search, except the precursor mass tolerance, which was set to 5 p.p.m. and the fragment mass tolerance, which was set to 0.45 Da.
Immunoblot analysis
Some spots showing expression changes with proteomic analysis and catalase, which do not appear in 2D maps, were subsequently tested by comparative immunoblotting analysis as described previously (Brocca et al. 2012).Accordingly, 20 μg of muscle samples, prepared and used for 2D electrophoresis, were loaded ontoAny kD precast polyacrylamide gel (Bio‐Rad). The proteins were electrotransferred from gels to nitrocellulose membranes at 100 V for 2 h and western blot analysis was performed. Nitrocellulose membranes were blocked in 5% milk in TBST (Tris 0.02M, NaCl 0.05 M pH 7.4‐7.6, 0.1% Tween20) for 1 h and then incubated in primary antibody at 4°C overnight. The membranes were probed with antibody specific to catalase (rabbit‐anti‐Catalase; Abcam, Cambridge, MA, USA), triosephosphate isomerase (mouse‐anti‐Trioseph isom; Abcam), β‐enolase (mouse‐anti‐β‐enolase; Abnova, Taipei, Taiwan), lactate dehydrogenase (rabbit‐anti‐LDH; Abcam), superoxide dismutase 1 (rabbit‐anti‐SOD1; Abcam), peroxiredoxin 3 (mouse‐anti‐PRDX3; Abcam), heat shock protein B1 (mouse‐anti‐Hsp27; Abcam), α‐β crystallin (rabbit‐anti‐α‐β crystallin; Abcam) andaldolase A (mouse‐anti‐aldolase A; Abcam). After several rinses in TTBS (0.1% Tween‐20 in TBS), the membranes were incubated in HRP‐conjugated secondary antibody, rabbit‐anti‐mouse (Dako, Glostrup, Denmark) or goat‐anti‐rabbit (Cell Signaling Technology, Beverly, MA, USA) for 1 h at room temperature. The protein bands were visualized by an enhanced chemiluminescence method (ECL Advance; GE Healthcare). The content of the single protein investigated was assessed by determining the BAP of the protein bands.
Some proteins involved in muscle protein synthesis signalling pathway were investigated by western blotting analysis and the muscular samples from each sample group were probed with specific antibodies. For this purpose, muscle samples (stored at –80°C) were pulverized with liquid nitrogen and immediately resuspended in a lysis buffer [20 mmTris‐HCl, 1% Triton X‐100, 10% glycerol, 150 mm NaCl, 5 mm EDTA, 100 mm NaF and 2 mm NaPPi supplemented with protease inhibitor cocktail and phosphatase inhibitor cocktail (Sigma) and 1 mm PMSF]; lysis tissue was performed on ice for 20 min and the homogenate obtained was centrifuged at 18,000 g for 20 min at 4°C and the supernatant was transferred to a clean Eppendorf tube and stored at –80°C until ready to use. Protein concentration was determined using the RC DC protein assay kit (Bio‐Rad). Next, 40 μg of muscle samples were added to the loading buffer (8% SDS, 20% 2‐mercaptoehtanol, 40% glycerol, bromophenol blue traces, 0.25 m Tris HCl, pH 6.8) and finally loaded onto Any kD precast polyacrylamide gel (Bio‐Rad). The proteins were electrotransferred to nitrocellulose membranes at 35 mA overnight. After blocking in 5% milk in TBST for 1 h, the membranes were incubated overnight in primary antibody diluted with 5% milk or 5% BSA (only for the phosphor‐specific antibodies) in TBST. The membranes were probed with antibody specific to protein kinase B (Akt) (rabbit‐anti‐Akt; Millipore, Billerica, MA, USA), p‐Akt (Ser473)(rabbit‐anti‐p‐Akt; Millipore), eukaryotic translation initiation factor 4E‐binding protein 1 (4EBP1) (rabbit‐anti‐4EBP1; Cell Signaling), p4EBP1 (rabbit‐anti‐p4EBP1; Cell Signaling), S6 ribosomal protein (S6Rp) (rabbit‐anti‐S6Rp; Cell Signaling), p‐S6Rp(Ser235/236) (rabbit‐anti‐p‐S6Rp; Cell Signaling), AMP‐activated protein kinase (AMPK) (rabbit‐anti‐AMPK; Cell Signaling) and p‐AMPK(Thr172) (rabbit‐anti‐p‐AMPK; Cell Signaling). Finally, the membranes were incubated in HRP‐conjugated secondary antibody, goat‐anti‐rabbit (Millipore), diluted in 5% milk, for 1 h at room temperature; the protein bands were visualized by an enhanced chemiluminescence (ECL Advance; GE Healthcare) and the protein content was determined by the BAP of the protein band normalized to the tubulin.
RT‐PCR analysis
RT‐PCR analysis was carried out as described previously (Cannavino et al. 2014). Total RNA, from skeletal samples, wasextracted using the Promega SV Total RNA isolation kit; the concentration of RNA was evaluated using a NanoDrop instrument (Thermo Fisher Scientific). Next, 300 ng of RNA were reverse‐transcribed with SuperScript III reverse transcriptase (Invitrogen, Carlsbad, CA, USA) to obtain cDNA. The cDNA was analysed by RT‐PCR with the SYBR Green PCR kit (Applied Biosystems, Foster City, CA, USA) and data were normalized to β2‐microglobulin expression. The forward (FP) and reverse (RP) primers used for RT‐PCR were:
MuRF‐1 FP: 5′‐CCTGAGAGCCATTGACTTTGG‐3′, RP: 5′‐CTTCCCTTCTGTGGACTCTTCCT‐3′; Atrogin‐1FP: 5′‐GCAGCTGAACAACATTCAGATCAC‐3′, RP: 5′‐CAGCCTCTGCATGATGTTCAGT‐3′; p62 FP: 5′‐GCTTCCAGGCGCACTACC‐3′, RP: 5′‐CATCCTCACGTAGGACATGG‐3′; Beclin‐1 FP: 5′‐TGGAAGGGTCTAAGACGT‐3′, RP:5′‐GGCTGTGGTAAGTAATGGA‐3′; PGC1alpha FP: 5′‐CAGGATTTCATCTGAGTGTGGA‐3′, RP: 5′‐GCGAGAGAGAAAGGAAAAGAACAA‐3′; SREBP‐1 FP: 5′‐CGTCCCTCCTGTTGTGAAAT‐3′, RP: 5′‐AGTGTTTTCACGGGACCAAG‐3′; NRF2 FP: 5′‐CACAGAAGACCCCAACCAGT‐3′, RP: 5′‐CTGTGCTTTCAGGGTGGTTT‐3′; β2‐microglobulin FP: 5′‐GCTGTGCTCGCGCTACTCTCTCT‐3′, RP: 5′‐TCTGCTGGATGACGTGAGTAAAC‐3′.
Carbonylated proteins
Carbonylated proteins were analysed based on the method previously reported (Brocca et al. 2010). Frozen samples from each subject group were suspended in lysis buffer (50 mm Tris‐HCl pH7.6, 250 mm NaCl, 5 mm EDTA protease inhibitor cocktail and phosphatase inhibitor cocktail), left on ice for 20 min and finally centrifuged at 18,000 g for 20 min at 4°C. The protein concentration was determined using the RC DC protein assay kit (Bio‐Rad).
The protein carbonylation level was detected using the OxyBlot Kit (Millipore), which provides reagents for sensitive immunodetection of carbonyl groups. Carbonyl groups in the protein side chains were derivatized to 2,4‐dinitrophenylhydrazone (DNP) by reaction with 2,4‐dinitrophenylhydrazine (DNPH). In detail, 10 μg of proteins for each muscle sample were denatured with SDS solution at a final concentration of 6%. The DNPH solution was added to obtain the derivation; the reaction was stopped after 15 min of incubation at room temperature. The DNP‐derivatized protein samples were separated by PAGE (AnykD Bio‐Rad gels) followed by western blotting.Proteins were transferred to nitrocellulose membranes at 100 V for 2 h, stained with Ponceau Red (Sigma) and then scanned. The membranes were blocked by incubation with 3% BSA for 1 h. Next, the membranes were incubated with rabbit anti‐DNP antibody for 1 h at room temperature and subsequently with a horseradish peroxidase‐antibody conjugate (goat anti‐rabbit IgG). The membranes are treated with chemiluminescent reagents (ECL Advance; GE Healthcare). The positive bands emitting light were detected by short exposure to photographic films.
The oxidative status of Pre‐ULLS, Post‐ULLS and Post‐RT groups was analysed quantitatively by comparison of the signal intensity of immunopositive proteins normalized to the total protein amount loaded onto gels (Ponceau staining signal).
Myosin light chain phosphorylation analysis
The same samples used for proteomic analysis were utilized to assessmyosin light chain(MLC) phosphorylation. In this regard, 20 μg of protein was delipidated and desalted by adding methanol and chloroform, followed by centrifugation at 18,000 g for 5 min, to allow adequate separation by electrophoresis and subsequent staining by phosphoprotein gel stain (Pro‐Q®Diamond; Life Technologies, Grand Island, NY, USA). The proteins were loaded on Any kD precast polyacrylamide gel and the electrophoresis was run at 100 V for 1.5 h. The gel was immersed in fix solution (50% methanol and 10% acetic acid) overnight and then washed three times for 10 min in ultrapure water to remove all of the methanol and acetic acid from the gel. The gel was incubated in Pro‐Q®Diamond phosphoprotein gel stain with gentle agitation for 90 min, destained in destaining solution (20% acetonitrile, 50 mm sodium acetate, pH 4.0) to reduce gel background, and then washed twice with ultrapure water. Finally, MLC bands were visualized using a Typhoon laser scanner (GE Healthcare) and analysed with Platinum software (GE Healthcare). The same gel was also stained with Coomassie Blue to analyse total MLC content. MLC phosphorylation was assessed by normalizing MLC phosphorylation degree against total MLC content.
Statistical analysis
Data are expressed as the mean ± SEM. Statistical significance of the differences between means was assessed by one‐way ANOVA followed by the Student–Newman–Keuls test. P < 0.05 was considered statistically significant.
Results
Muscle biopsy samples were divided into three parts: one was put in skinning solution and glycerol and used for single muscle fibre analysis; two were immediately frozen in liquid nitrogen and used for proteomic and intracellular signalling analyses.
Fibre size, force and V 0 of single muscle fibres
Forty‐five fibres per subject were successfully studied (i.e. 15 single muscle fibres Pre‐ULLs, Post‐ULLS and Post‐RT). Hybrid fibres (type 1–2A Pre‐ULLS, n = 6; Post‐ULLS, n = 1; Post‐RT, n = 4 and 2AX Pre‐ULLS, n = 10; Post‐ULLS, n = 4; Post‐RT, n = 27) were not included in the analysis because their force and velocity could be affected by the presence of more than one MHC isoform with different functional properties. There were insufficent type 2X fibres (Pre‐ULLS, n = 0; Post‐ULLS, n = 0; Post‐RT, n = 6) to provide statistically significant comparisons. Only type 1 and type 2A fibres, which provided reliable values for all parameters studied (i.e. CSA, P O/CSA, V 0 and myosin content), are used and reported in the figures, and refer to 121 type 1 fibres (38 Pre‐ULLS, 47 Post‐ULLS, 36 Post‐RT) and 131 type 2A fibres (44 Pre‐ULLS, 43 Post‐ULLS, 44 Post ULLs).
CSA of type 1 fibres was lower (–22%) Post‐ULLS than Pre‐ULLS and recovered (+17%) Post‐RT compared to Post‐ULLS. CSA of type 1 fibres Post‐RT was not significantly different from CSA of type 1 fibres Pre‐ULLS (i.e. recovery was complete). Type 2A fibres showed the same extent of atrophy as type 1 (–23%) after suspension and no complete recovery (+8%) after re‐training.
P O/CSA was lower in both type 1 (–13%) and type 2A (–16%) fibres Post‐ULLS (Fig. 1 B) than Pre‐ULLS. The recovery of Po/CSA following RT was very large in both type 1 (+50%) and type 2A (+37%) compared to Post‐ULLS overcoming the Pre‐ULLS values (Fig. 1 B).
Figure 1. Structure and function of single muscle fibres from vastus lateralis are affected by disuse and active recovery .
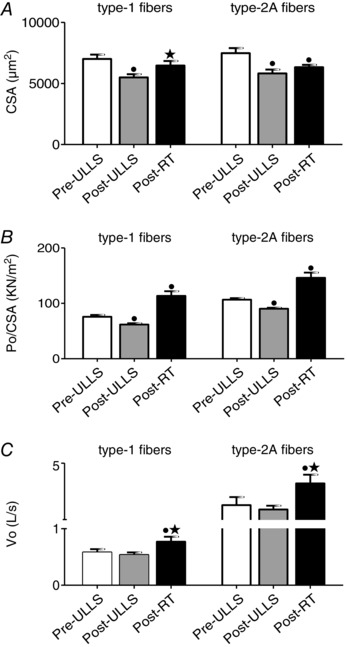
CSA (A), P O/CSA (B) and V 0 (C) of type‐1 and type‐2A fibres dissected from vastus lateralis muscles of Pre‐ULLS, Post‐ULLS and Post‐RT groups. CSA is expressed in μm2, P O/CSA is expressed in k Nm−2 and V 0 is expressed in LS−1. • P < 0.05, significantly different from Pre‐ULLS; *P < 0.05, significantly different from Post‐ULLS. Data are themean ± SEM.
V 0 was unchanged Post‐ULLS in both fibre types, whereas it was higher in both type 1 (+32%) and type 2A (+53%) Post‐RT than Post‐ULLS (Fig. 1 C).
Adaptations in muscle proteins
MHC, MLC isoform distribution, myosin/actin ratio and myosin concentration in individual muscle fibres
MHC and MLC isoform composition were determined in biopsy samples from vastus lateralis muscle of all subjects from each groups. No significant differences were found in any condition for both MHC (Fig. 2 A) and MLC (Fig. 2 B) isoform distribution. Only some non‐significant trendswere observed, among which there was a higher MHC‐2A content Post‐RT than Pre‐ULLS.
Figure 2. Myosin concentration and myosin/actin ratio decreased after 3 weeks of disuse and returned to control values after active recovery .
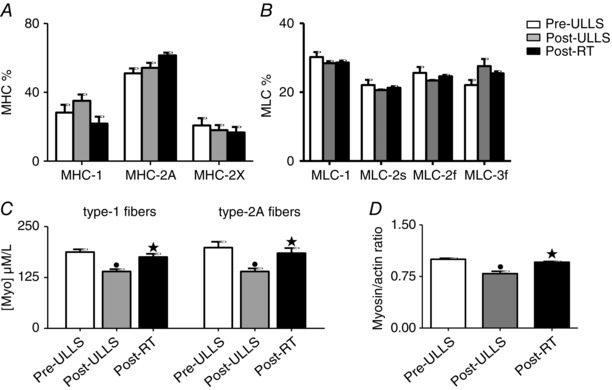
MHC isoform composition (A), MLC isoform composition (B) and myosin concentration (C) in type‐1 and type‐2A fibres dissected from vastus lateralis muscles, and myosin/actin ratio (D) in Pre‐ULLS, Post‐ULLS and Post‐RT groups. • P < 0.05, significantly different from Pre‐ULLS; *P < 0.05, significantly different from Post‐ULLS. Data are themean ± SEM.
Myosin concentration was evaluated in all individual muscle fibres whose CSA, P O/CSA and V 0 are reported. Myosin concentration was significantly lower Post‐ULLS than Pre‐ULLS in both fibre types (–26% for type 1 fibres and –30% for type 2A fibres) and showed a complete recovery after re‐training (Fig. 2 C). Interestingly, although P O/CSA was higher Post‐RT than Pre‐ULLS (Fig. 1 B), myosin concentration was not. The ratio between myosin and actin content (M/A) was determined by the densitometry of the two proteins bands. The M/A ratio was significantly decreased after disuse and returned to the Pre‐ULLS level after exercise (Fig. 2 D).
Proteomic analysis
Proteomic maps of vastus lateralis muscle, for each experimental condition, were obtained using 2D gel electrophoresis. In each 2Dgel, more than 800 protein spots were detected and analysed for differential expression. Differentially expressed protein spots were subsequently identified by MALDI‐TOF (Table 1). Identified proteins were grouped based on their functional role in the categories: myofibrillar proteins, metabolic enzymes [oxidative, glycolytic, CK, adenylate kinase (ADK)], anti‐oxidant defence systems and other proteins. Identified spots are indicated in the 2D map shown in Fig. 3.
Table 1.
Differentially expressed proteins in vastus lateralis muscles in Pre‐ULLS, Post‐ULLS and Post‐RT groups
| Spot | Accession | Estimated pI | Estimated MW | |||
|---|---|---|---|---|---|---|
| number | Protein | Abbreviation | number | in 2D gels | in 2D gel | Score |
| Myofibrillar proteins | ||||||
| 1 | Troponin I fast | TnIf | P48788 | 8.9 | 20 | 124 |
| 2 | Troponin I fast | TnIf | P48788 | 8.9 | 21 | 88 |
| 3 | Troponin I fast | TnIf | P48788 | 9.0 | 20 | 246 |
| 4 | Troponin I fast | TnIf | P48788 | 9.0 | 21 | 263 |
| 5 | Troponin I fast | TnIf | P48788 | 9.36 | 21 | 297 |
| 6 | Troponin T fast | TnTf | P45378 | 6.7 | 40 | 429 |
| 7 | Tropomyosin alpha chain | Tpm1 | P09493 | 4.7 | 30 | 203 |
| 8 | Myosin light chain 2, fast | MLC‐2f | Q96A32 | 4.8 | 17 | 98 |
| 9 | Actin | Act | P68133 | 5 | 44 | 350 |
| 10 | Myozenin‐1 | Myoz‐1 | Q9NP98 | 6.7 | 32 | 179 |
| Energy production system | ||||||
| Glycolytic metabolism | ||||||
| 11 | Triose phosphate isomerase | TPI | P60174 | 6.8 | 26 | 89 |
| 12 | Triose phosphate isomerase | TPI | P60174 | 6.8 | 26 | 788 |
| 13 | Triose phosphate isomerase | TPI | P60174 | 6.7 | 26 | 150 |
| 14 | Triose phosphate isomerase | TPI | P60174 | 6.2 | 26 | 547 |
| 15 | Triose phosphate isomerase | TPI | P60174 | 6.7 | 26 | 152 |
| 16 | β enolase | ENO | P13929 | 6.1 | 40 | 531 |
| 17 | β enolase | ENO | P13929 | 6.8 | 53 | 148 |
| 18 | β enolase | ENO | P13929 | 6.7 | 53 | 786 |
| 19 | β enolase | ENO | P13929 | 6.2 | 40 | 656 |
| 20 | Lactate dehydrogenase A | LDHA | P00338 | 9 | 30 | 97 |
| 21 | Lactate dehydrogenase A | LDHA | P00338 | 8.9 | 32 | 198 |
| 22 | Lactate dehydrogenase A | LDHA | P00338 | 8.6 | 30 | 227 |
| 23 | Aldolase A | ALDOA | P04075 | 8.5 | 40 | 528 |
| Oxidative metabolism | ||||||
| 24 | NADH dehydrogenase Fe‐S protein 3 | NDUFS3 | O75489 | 5.4 | 26 | 506 |
| 25 | ATP synthase β chian | ATPβ | P06576 | 4.9 | 60 | 117 |
| Other metabolism | ||||||
| 26 | Creatine kinase M‐type | CK | P06732 | 6.7 | 44 | 120 |
| 27 | Creatine kinase M‐type | CK | P06732 | 6.8 | 44 | 240 |
| 28 | Adenilate kinase 1 | ADK1 | P00568 | 8.9 | 18 | 282 |
| 29 | Adenilate kinase | ADK1 | P00568 | 8.9 | 22 | 530 |
| Redox imbalance | ||||||
| 30 | Superoxide dismutase 1 | SOD1 | P00441 | 5.8 | 18 | 320 |
| 31 | Glutathione ‐S‐transferase P | GSTP1 | P09211 | 5.4 | 23 | 500 |
| 32 | Glutathione‐S‐transferase Mu 2 isoform 1 | GSTM1 | P28161 | 6.2 | 26 | 902 |
| 33 | Carbonic anhydrase 3 | CAIII | P07451 | 6.5 | 33 | 198 |
| 34 | Peroxiredoxin 3 | PRDX3 | P30048 | 6.2 | 22 | 247 |
| 35 | αβ‐crystallin | αβ‐cry | P02511 | 6.7 | 20 | 408 |
| 36 | αβ‐crystallin | αβ‐cry | P02511 | 6.7 | 21 | 213 |
| 37 | αβ‐crystallin | αβ‐cry | P02511 | 6.9 | 20 | 588 |
| 38 | Heat shock protein beta1 | HSPb1 | P04792 | 5.1 | 28 | 302 |
| 39 | Heat shock protein beta1 | HSPb1 | P04792 | 6 | 26 | 444 |
| Other proteins | ||||||
| 40 | Proteasome subunit alpha isoform 2 | Prot‐α‐sub | P25787 | 6.2 | 30 | 142 |
| 41 | Four and a half LIM domains protein 1 | FHL1 | Q13642 | 6.8 | 30 | 56 |
| 42 | Parkinson disease protein7 | DJ‐1 | Q99497 | 6.1 | 22 | 56 |
| 43 | Elongation factor Tu, mitochondrial | EF‐tu | P49411 | 6.2 | 53 | 250 |
The spot number corresponding to the number reported in Fig. 3, the protein name, abbreviation, accession number corresponding to Expasy, estimated pI in 2D gel, estimated molecular weight in 2D gel, and MOWSE (MOlecular Weight SEarch) score are shown.
Figure 3. Representative two‐dimensional gels of vastus lateralis muscle .
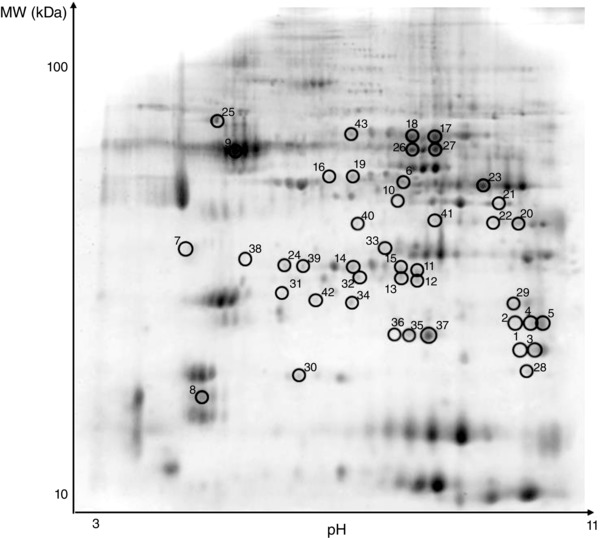
Thirteen centimeter IPG gel strips, pH 311 NL (non‐linear), were used in the first dimension, and SDS gels (15% T, 2.5% C) were used in the second dimension. The protein spots, which were found to be differentially expressed, are circled and numbered. The numbers enable to identify the spots in Table 1.
A general trend in adaptations of protein pattern was observed: a protein down‐regulation in Post‐ULLS respect to Pre‐ULLS and a protein up‐regulation in Post‐RT respect to Post‐ULLS.
Among myofibrillar proteins, five spots identified as troponin‐I fast (TnIf), one spot identified as troponin‐T fast (TnTf), one spot as myosin light chain 2s (MLC‐2s) and one as myozenin‐1 were significantly down‐regulated Post‐ULLS vs. Pre‐ULLS, and a trend for a lower content of tropomyosin and actin was observed (Fig. 4). Post‐RT, the content of the same proteins was up‐regulated towards the Pre‐ULLS levels. None of the proteins significantly down‐regulated Post‐ULLS vs. Pre‐ULLS was still significantly down‐regulated Post‐RT vs. Pre‐ULLS, although only three were significantly up‐regulated Post‐RT vs. Post‐ULLS (tropomyosin, MLC‐2s and actin). One spot corresponding to MLC‐2s was significantly up‐regulated also Post‐RT vs. Pre‐ULLS.
Figure 4. Myofibrillar protein content decreased after 3 weeks of muscle disuse and partially recovered after exercise .
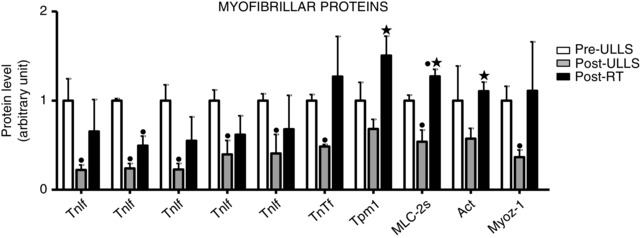
Histogram representing the volume of 2DE spots of differentially expressed myofibrillar proteins in Pre‐ULLS, Post‐ULLS and Post‐RT groups. • P < 0.05, significantly different from Pre‐ULLS; *P < 0.05, significantly different from Post‐ULLS. Data are themean ± SEM. Full information on the proteins and the numerical ratios between volumes is provided in Table 1.
Several expression adaptations in metabolic enzymes were identified following ULLS and resistance training. After disuse, a general down‐regulation in glycolytic enzymes, in two oxidative enzymes and in two enzymes involved in the balance between ATP, ADP and AMP, CK and ADK, was observed (Fig. 5). Spots relative to triosephosphate isomerase, β‐enolase, lactate dehydrogenase A(LDHA), CK and ADK were statistically down‐regulated Post‐ULLS vs. Pre‐ULLS. Post‐RT, all such proteins, except two (CK and ADK), showed a trend for a recovery towards Pre‐ULLS levels and most of them were, indeed, significantly higher Post‐RT vs. Post‐ULLS. Both spots of CK did not recover, although they were even lower Post‐RT vs. Pre‐ULLS and only one of the two ADK spots recovered Post‐RT. Of the four LDHA spots, three were down‐regulated Post‐ULLS vs. Pre‐ULLS. The one that was not down‐regulated Post‐ULLS was three‐fold up‐regulated Post‐RT vs. Pre‐ULLS. Some key spots showing expression changes with the proteomic analysis were subsequently tested by comparative immunoblotting to confirm their variations. Among energy production systems, the approach was applied to triosephosphate isomerase, β‐enolase, LDHA, and aldolase A (Fig. 7). The results confirmed the behaviour described by the proteomic analysis.
Figure 5. Metabolic protein expression decreased after 3 weeks of muscle disuse and partially recovered after exercise .
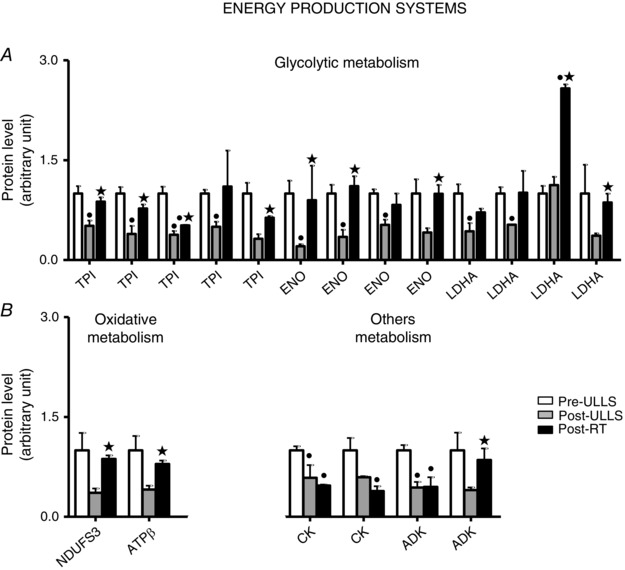
Volume of 2DE spots of differentially expressed metabolic proteins. Glycolytic proteins (A) and oxidative proteins, CK and ADK (B) in Pre‐ULLS, Post‐ULLS and Post‐RT groups. • P < 0.05, significantly different from Pre‐ULLS; *P < 0.05, significantly different from Post‐ULLS. Data are themean ± SEM. Full information on the proteins and the numerical ratios between volumes is provided in Table 1.
Figure 7. Validation of anti‐oxidant and metabolic protein expression changes by western blot analysis .
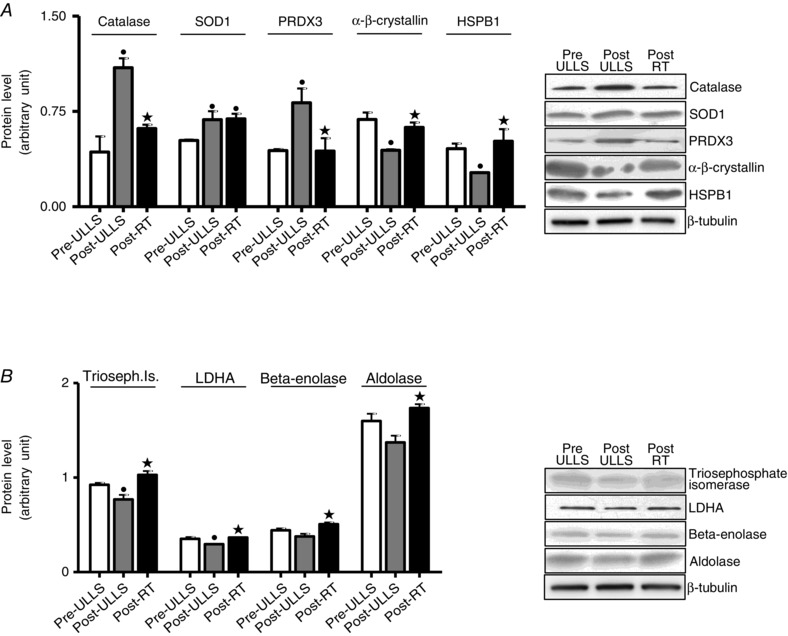
Quantification of protein levels by western blot analysis of (A) catalase, SOD1, PRDX3, α‐β‐crystallin and HSPB1 and (B) triosephosphate isomerase, lactate dehydrogenase, β‐enolase and aldolase in Pre‐ULLS, Post‐ULLS and Post‐RT groups. • P < 0.05, significantly different from Pre‐ULLS; *P < 0.05, significantly different from Post‐ULLS. Data are themean ± SEM.
Anti‐oxidant defence systems were a major functional group differentially expressed following disuse and rehabilitation (Fig. 6 A). A significantdown‐regulation in gluthatione S‐transferase P, in carbonic anhydrase‐3 (CAH III), in two spots of α‐β‐crystallin and in one spot of HSPB1 was detected Post‐ULLS vs.Pre‐ULLS, whereas Cu/Zn superoxide dismutase (SOD1) and peroxiredoxin‐3 (PRDX3) were up‐regulated. In Post‐RT, a general up‐regulation of anti‐oxidant defence systems was observed with respect to Post‐ULLS, with the exception of PRDX3 and gluthatione S‐transferase M, which were down‐regulated. SOD1, gluthatione S‐transferase P and HSPB1 showed significantly higher content Post‐RT than Pre‐ULLS; CAH III and α‐β‐crystallin showed significantly higher content Post‐RT than Post‐ULLS recovering to control values. Western blot analysis confirmed the adaptations in SOD1, PRDX3, α‐β‐crystallin and HSP1 shown by proteomic analysis (Fig. 7). Moreover, given its relevance among the anti‐oxidant defence systems, catalase, which is not identified by proteomic analysis, was studied by western blotting. Catalase was up‐regulated Post‐ULLS and returned towards Pre‐ULLS levels following rehabilitation.
Figure 6. Anti‐oxidant defence systems content efficiently adapted to ROS production induced by disuse and resistance training .
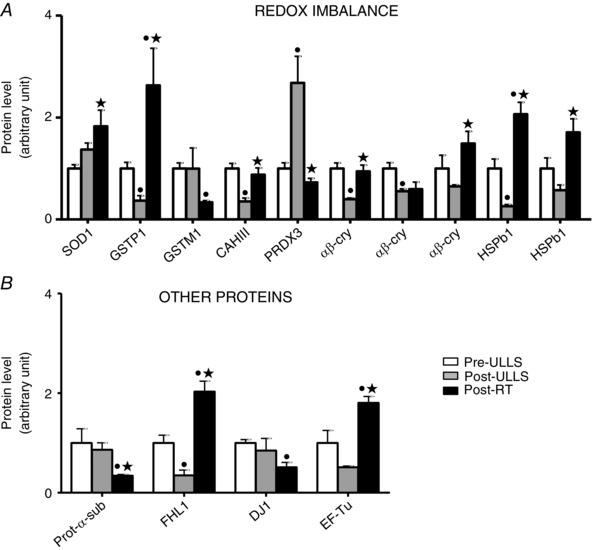
Volume of 2de spots of differentially expressed proteins of (A) anti‐oxidant defence systemsand (B) other proteins in Pre‐ULLS, Post‐ULLS and Post‐RT groups. • P < 0.05, significantly different from Pre‐ULLS; *P < 0.05, significantly different from Post‐ULLS. Data are themean ± SEM. Full information on the proteins and the numerical ratios between volumes is provided in Table 1.
Several proteins, which could not be ascribed to a specific functional group, also went through significant
adaptations (Fig. 6 B). Four and half LIM domain (FHL1) was significantly down‐regulated in Post‐ULLS compared to Pre‐ULLS. After training, an increase in FHL1 and EF‐Tu was found, together with a decrease in proteasome α‐sub isoform‐2 and DJ‐1 protein.
Post‐translational modifications
The adaptations in anti‐oxidant defence systems suggested that ULLS and subsequent RT could affect redox balance. To further evaluate the redox state, we performed immunoblot detection (Oxyblot) of carbonyl groups introduced into proteins by oxidative reactions. This analysis was carried out separately for both total protein content and MHC isoforms (Fig. 8). The results showed no variations in total protein oxidation index after suspension and recovery. The oxidation of myosin was significantly lower Post‐ULLS and Post‐RT than Pre‐ULLS. No significant difference in myosin oxidation was observed Post‐RT compared to Post‐ULLS, although a trend towards an increase was observed.
Figure 8. Determination of post‐translational modifications after disuse and active recovery .
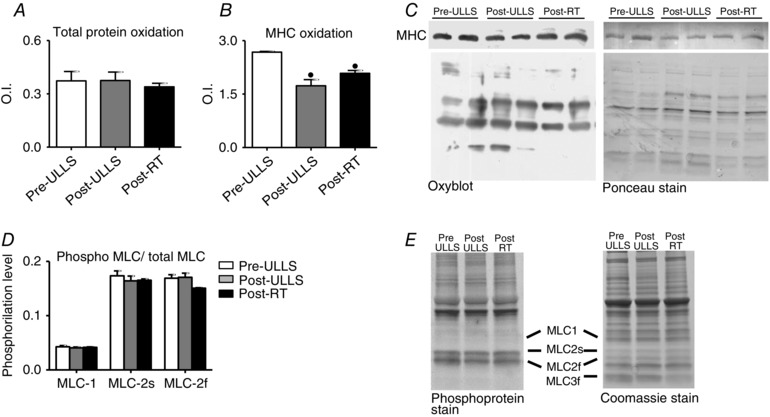
Mean ± SEM of total carbonylated protein (A) and MHC carbonylation level (B) assessed by Oxyblot analysis of vastus lateralis in Pre‐ULLS, Post‐ULLS and Post‐RT groups. C, example of Oxyblot assay and relative red Ponceau stain. D, mean ± SEM of MLC phosphorylation in vastus lateralis in Pre‐ULLS, Post‐ULLS and Post‐RT groups. E, phosphoprotein stain and relative Coomassie stain. • P < 0.05, significantly different from Pre‐ULLS.
To clarify the variations observed in V 0, not only MLC composition (Fig. 2 B), but also MLC phosphorylation was investigated. No variations were observed in the phosphorylation degree of MLC‐1, MLC‐2s and MLC‐2f (Fig. 8 C).
Intracellular signalling pathway analysis
To understand the mechanisms underlying changes in fibre size and in protein expression, the major intracellular pathways potentially involved were studied in each subject group. We analysed some master controllers of pathways controlling muscle mass, namely muscle‐specific ring finger protein‐1 (MuRF1) and Atrogin1 ubiquitin ligases (ubiquitin proteasome system), Beclin1 and p62 (autophagy system), and Akt, S6Rp and 4EPB1 [insulin‐like growth factor (IGF)‐1/Akt/mechanistic target of rapamycin(mTOR) pathway]; muscle metabolism, namely peroxisome proliferative activated receptor‐γ coactivator 1α (PGC‐1alpha) and sterol regulatory element binding protein‐1 (SREBP‐1); energy balance (AMPK); and anti‐oxidant defence systems [nuclear factor (erythroid‐derived 2)‐like 2 (NRF2)].
No changes were found for MuRF1 and Atrogin1 mRNA levelsunder all conditions. Post‐RT, we reported a trend for a decreased expression in both gene levels, although the variation did not reach statistical significance (Fig. 9 A). Beclin1 expression showed no significant differences under all conditions, whereas the p62 mRNA level Post‐RT was significantly lower compared to both Pre‐ULLS and Post‐ULLS (Fig. 9 B). Concerning protein synthesis, the phosphorylation level of AKT, 4EBP1 and S6 was significantly reduced after disuse and then returned to Pre‐ULLS values after exercise, except for AKT, which showed low levels of phosphorylation even after exercise (Fig. 9 C).
Figure 9. Protein synthesis pathway was down‐regulated after muscle disuse and recovered following exercise .
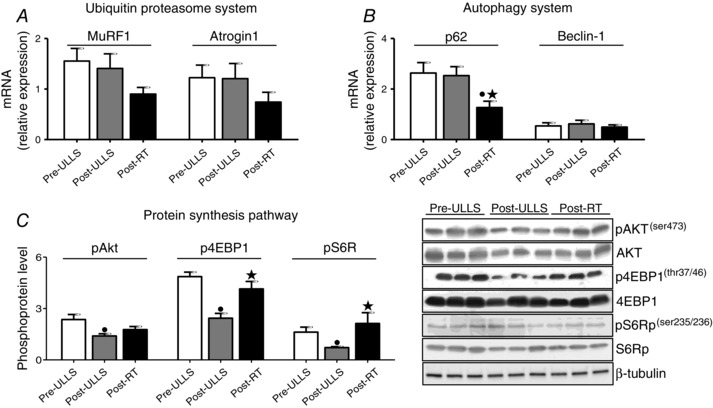
Quantification of mRNA level of two major atrogenes (MuRF1 and atrogin1) (A) and autophagy markers (p62 and Beclin‐1)(B). mRNA expression was assessed by quantitative RT‐PCR in vastus lateralis of Pre‐ULLS, Post‐ULLS and Post‐RT groups. C, determination of phosphorylation levels of AKT, 4EBP1 and S6R and relative representative western blot in vastus lateralis of Pre‐ULLS, Post‐ULLS and Post‐RT groups. Data are the mean ± SEM. • P < 0.05, significantly different from Pre‐ULLS; *P < 0.05, significantly different from Post‐ULLS.
AMPK activation and mRNA expression of PGC1α and SREBP1 were analysed (Fig. 10). The phosphorylation level of AMPK and the expression of SREBP1 were significantly down‐regulated Post‐ULLS compared to Pre‐ULLS and significantly up‐regulated Post‐RT compared to Post‐ULLS. No differences were found in PGC1α mRNA expression.
Figure 10. Disuse and resistance training affected the AMPK pathway and lipid metabolism .
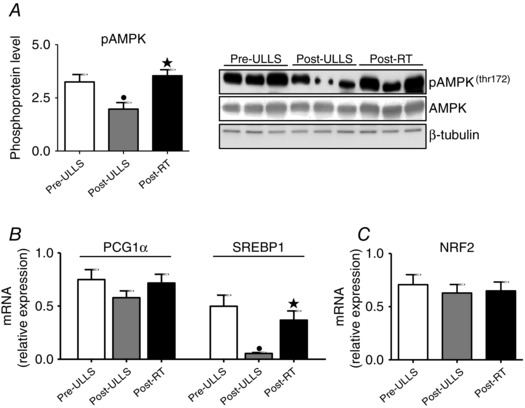
A, determination of phosphorylation levels of AMPK and relative representative western blot. B and C, mRNA level of PCG1α, SREBP1 and NRF2 in vastus lateralis of Pre‐ULLS, Post‐ULLS and Post‐RT groups subjects. Data are the mean ± SEM. • P < 0.05, significantly different from Pre‐ULLS; *P < 0.05, significantly different from Post‐ULLS.
Finally, the regulation of anti‐oxidant defence systems was assessed by analysing NRF2, a sensor of redox balance and the major transcription nuclear factor involved in modifying anti‐oxidants expression. The NRF2 mRNA level showed no significant changes after suspension and recovery (Fig. 10 C).
Discussion
Qualitative changes in muscle function following disuse and re‐training: force and velocity of shortening of identified types of muscle fibres
In the present study, the functional properties of single skinned muscle fibres from vastus lateralis muscle of young males subjected to ULLS and active recovery were studied. Maximally activated skinned muscle fibres enable direct analysis of the adaptation of the contractile apparatus itself because excitation–contraction coupling is missing (Bottinelli et al. 1996; Widrick et al. 1997). As expected, ULLS was able to induce significant atrophy (Fig. 1) in agreement with previous studies on whole muscle and muscle fibres following several models of disuse in humans (Fitts et al. 2001; Adams et al. 2003; di Prampero & Narici, 2003). The post training recovery of CSA (Fig. 1) is expected because it is well known that resistance training induces skeletal muscle fibre hypertrophy (Jones et al. 1989; Green et al. 1999; Widrick et al. 2002 a; D'Antona et al. 2006), increases protein translation (Bodine, 2006; Coffey & Hawley, 2007) and enhances the expression of genes involved in anabolic mechanisms (Bickel et al. 2005; Kosek et al. 2006; Kvorning et al. 2007).
The difference in the relative loss of CSA of muscle fibres (22–23%) and of vastus lateralis volume (12%) Post‐ULLS observed in the same subjects (Campbell et al. 2013) is not unexpectedbecause the impact of muscle fibres CSA on muscle volume is complex depending on pennation angle and intramuscular fat and connective tissue content, both of which change with inactivity. Chronic inactivity has been shown to lead to an increase in intramuscular fat (Manini et al. 2007), which may have partially masked the actual decrease in muscle tissue volume. The same reasoning could explain the full recovery of vastus lateralis volume compared to a lack of complete recovery in CSA of muscle fibres (Campbell et al. 2013).
Specific force
The lower P O/CSA of muscle fibres Post ULLS (Fig. 1) is expected based on several previous observations (Larsson et al. 1996; Widrick et al. 1999 b; Widrick et al. 2001; Canepari et al. 2010), although it has not been seen in all disuse studies in humans, including in bed rest (Widrick et al. 1997) and spaceflight studies (Fitts et al. 2010). It is also broadly consistent with a previous muscle fibre analysis following ULLS (Widrick et al. 2002 b). The recovery of P O/CSA Post‐RT is probably not a consequence of a simple impact of RT on single muscle fibre properties. Indeed, no impact of short‐term RT training on P O/CSA of individual muscle fibres has been shown so far in healthy young subjects (Widrick et al. 2002 a; Shoepe et al. 2003; Malisoux et al. 2006; Claflin et al. 2011), notwithstanding an increase in CSA following training (Claflin et al. 2011). It appears, therefore, that the impact of RT on P O/CSA (Fig. 1) is linked to the previous loss, which occurred during ULLS. Indeed, the extent of the gain in force following RT was rather impressive, suggesting that muscle fibres, which went through disuse atrophy, are very responsive to resistance exercise (Trappe, 2009). The latter phenomenon could be a result of the phenomenon of ‘muscle memory’, which describes a faster recovery of muscle mass post inactivity because of the preservation of myonuclei during the unloading period (Bruusgaard et al. 2012). Although a disproportionate loss of force compared to CSA in individual muscle fibres can be considered to represent a major determinant of the lower specific force of whole muscles in vivo following disuse (Dudley et al. 1992; Adams et al. 1994; Schulze et al. 2002; di Prampero & Narici, 2003; Narici et al. 2003), a direct demonstration could not be provided because in vivo and in vitro analyses were performed in different subjects. In the present study, analysis of muscle fibre P O/CSA was performed on muscle samples from the same experiment and subjects in whom we determined structure and function of quadriceps muscles in vivo (Campbell et al. 2013). Collectively, the results indicate that the loss of P O/CSA at the muscle fibre level (22–23%) can play a relevant role in the decrease in specific force (19–24%) of the quadriceps muscles in vivo. Importantly, in vivo physiological cross‐sectional area (PCSA), and maximal voluntary activation and neural drive, which could also contribute to the phenomenon, did not change following ULLS in this specific experiment (Campbell et al. 2013). The lack of a significant decrease in PCSA following disuse might appear to be unexpected. However, because PCSA is derived from the ratio of muscle volume (Vol) to fascicle length (Lf) and Vol and Vf decreased of very similar amount (∼10%), a very small (3%) and non‐significant change in PCSA actually occurred (Campbell et al. 2013).
In the present study, myosin content was determined in the same muscle fibres as those used for P O/CSA determination in young subjects. Importantly, the parallel changes observed in P O/CSA and myosin concentration in both type 1 and 2A fibres following disuse and rehabilitation strongly support the role of changes in myosin content with respect to accounting for the changes in P O/CSA in disuse and recovery. However, notwithstanding the linear relationship previously observed between P O/CSA and myosin concentration by D'Antona et al. (2003) and the parallel changes in P O/CSA and myosin concentration observed in the present study, it still remains unresolved whether changes in myosin concentration can account for the all adaptations in P O/CSA. Indeed, a loss of P O/CSA could depend not only on a decrease in the number of myosin heads in the CSA, but also on lower force generated per myosin head or on a lower fraction of myosin heads interacting with actin at any given time. Interestingly, myosin content Post‐RT was the same as Pre‐ULLS (Fig. 2), whereas P O/CSAPost‐RT recovered above Pre‐ULLS levels (Fig. 1). It was recently suggested that disuse in elderly subjects can alter acto‐myosin kinetics, which in turn affectsP O/CSA regardless of changes in myosin quantity (Callahan et al. 2014).
Unloaded shortening velocity
V 0 has been shown to be higher, lower or unchanged following disuse in humans (i.e. the adaptations of V 0 varied according to models of disuse, subjects groups, muscles and fibre types)(Larsson et al. 1996; Widrick et al. 1999 b; Widrick et al. 2001; Trappe et al. 2004). Following ULLS, V 0 was lower in type 1 fibres from soleus and higher in type 2A fibres from the gastrocnemius, whereas no changes were observed in type 2A fibres from the soleus and type 1 and 2X fibres from the gastrocnemius (Widrick et al. 2002 b). In the present study, ULLS did not induce changes in shortening velocity in both fibre types (Fig. 1). Interestingly, following rehabilitation, V 0 of both type 1 and 2A fibres increased above Pre‐ULLS values (Fig. 1). The impact of resistance training on V 0 in young subjects has not yet been clearly established. In most training studies, no change in V 0 was observed (Harridge et al. 1998; Widrick et al. 2002 a). Conversely, young women showed a higher V 0 in both type 1 and type 2A fibres after 1 year of resistance training (Pansarasa et al. 2009) and highly trained male swimmers had a 32% and 67% higher V 0 in slow and fast fibres, respectively, after tapering (Trappe et al. 2000).
In an attempt to clarify the mechanisms underlying the higher V 0 of muscle fibres Post‐RT than Pre‐ULLS, several hypothesis have been proposed (Bottinelli & Reggiani, 2000; Canepari et al. 2010) and confirmed: changes in MLC isoform content; changes in regulatory MLC phosphorylation; and post‐translational modification of myosin. V 0 has been shown to be modulated by the MLC3f/MLC2f ratio (Bottinelli et al. 1994) and to be possibly affected by the MLC2s and MLC2f content in human fibres (Bottinelli & Reggiani, 2000). Moreover, regulatory light chain phosphorylation‐induced decreased velocity was observed in single muscle fibres and in isolated myosin in an in vitro motility assay (Diffee et al. 1996; Olsson et al. 2004; Greenberg et al. 2009). No differences were found either in MLC content (Fig. 2) or in phosphorylation (Fig. 8) among Pre‐ULLS, Post‐ULLS and Post‐RT muscle samples.
Myosin oxidation has been shown to decrease actin‐sliding velocity in in vitro motility assays (Coirault et al. 2007; Maffei et al. 2014). It could be hypothesized that RT determined a higher V 0 causing a decrease in myosin oxidation. However, myosin was less oxidized Post‐ULLS and slightly more Post‐RT (Fig. 8). It is therefore not probable that MLC composition or phosphorylation together with myosin oxidation can account for the higher V 0 Post‐RT. However, a potential role of a change in the properties of myosin itself in causing the latter phenomenon can still be hypothesized based on the observation that RT increased actin‐sliding velocity on pure myosin isoforms in in vitro motility assays in both young and old subjects (Canepari et al. 2005).
Qualitative changes following disuse and re‐training: myosin and myofibrillar proteins
MHC composition
Although a slow to fast shift in MHC isoform distribution is generally considered to occur in disuse, such a phenomenon has not been seen in all conditions of decreased neuromuscular activity (di Prampero & Narici, 2003). The lack of any significant MHC isoform shift after 3 weeks of ULLS (Fig. 2) is therefore consistent with previous results.
Thin filament proteins
The proteomic analysis showed two major phenomena at the level of myofibrillar proteins: a down‐regulation of several thin filament spots protein and no shift from slow to fast isoforms. The large changes in Tn spots abundance, as determined by 2D gels,would suggest a major loss of the thin filament. Because we have not been able to confirm the levels of Tn spots expression via immunoblotting, it is possible that the large down‐regulation of TnIf and TnTf spots after disuse did not strictly reflect the actual expression levels of troponin. Consistently, the assessment of myosin actin ratio has suggested a greater loss of myosin content than actin (Fig. 2 D). The down‐regulation of thin filament proteins is consistent with the lower myosin content and indicates a disproportionate loss of myofibrils compared to the remainder muscle proteins in the atrophic muscle fibres. The latter observation is not in agreement with an analysis of myosin and myofibrillar content after 35 days of ULLS (Carrithers et al. 2002; Haus et al. 2007), although it is broadly consistent with several previous findings: the analysis of total mRNA and mRNA for actin and myosin heavy chain isoforms has indicated a preferential decrease in myosin and actin transcription within an overall decrease in muscle protein transcription after 5 weeks of ULLS (Haddad et al. 2005); the analysis of thin filament density has confirmed a loss of actin (Riley et al. 2002)after 17 days of spaceflight.
Among the down‐regulated myofibrillar proteins, myozenin‐1 is particularly interesting. It binds Z‐disk proteins, α‐actinin and γ‐filamin, affecting the dimerization of these proteins and modulating the spacing between monomers and hence the spacing between actin‐thin filaments (Thompson et al. 2000; van der Ven et al. 2000). Interestingly, the density of thin filaments has been seen to decrease following disuse (Riley et al. 2000).
The observation that 3 weeks of RT mostly counteracted the down‐regulation of myofibrillar proteins after 3 weeks of ULLS indicates that skeletal muscle following disuse can still respond to training and highlights the relevance of rehabilitation.
Qualitative changes following disuse and re‐training: metabolic enzymes
A global down‐regulation of glycolytic enzymes and other metabolic systems such as CK and ADK was found after lower limb suspension by proteomic analysis (Fig. 5). The down‐regulation of two oxidative enzymes, NADH dehydrogenase Fe‐S and ATPsynthase, Post‐ULLS did not reach statistical significance.
CK plays an important role in high energy phosphoryl transfer and cellular energy buffering (Bessman & Carpenter, 1985; Wallimann et al. 1992; van Deursen et al. 1993) and ADK is implicated in cellular adenine nucleotide homeostasis (Walker‐Simmons & Atkinson, 1977). CK and ADK, in concert with enzymes that function in glycolytic phosphotransfer pathway, form the cellular energetic infrastructure responsible for handling and distribution of high energy phosphoryl groups throughout the structured muscle environment (Bessman & Carpenter, 1985; van Deursen et al. 1993; Janssen et al. 2000; Abraham et al. 2002). Altogether, our data indicate a general impairment in energy production after 3 weeks ofULLS.
Resistance training has been shown to enhance glycolytic metabolism (Holloway et al. 2009; Friedmann‐Bette et al. 2010). Consistently glycolytic enzymes, which were down‐regulated following disuse, were up‐regulated Post‐RT and their content was mostly restored to Pre‐ULLS levels (Fig. 5). RT determined also an increase in two oxidative enzymes (NADH dehydrogenase Fe‐S and ATPsynthase) (Fig. 5), consistent with that observed by proteomic analysis after 6 weeks of RT (Holloway et al. 2009). Therefore, although CK content expression was unaffected by RT, it appears that RT was able to counteract the derangement of energy metabolism observed following ULLS restoring a normal energy metabolism. The up‐regulation of oxidative enzymes is probably not attributed to PGC‐1alpha because only a trend towards its increased expression was observed (Fig. 10).
Response of intracellular signalling pathways controlling muscle mass and metabolism following disuse and re‐training
Pathways controlling muscle mass
Muscle fibre atrophy and loss of myosin, myofibrillar proteins and metabolic enzymes following ULLS prompted the analysis of the ubiquitin–proteasome and autophagy systems, which are the two major, ATP‐dependent intracellular signalling pathways controlling muscle protein breakdown and muscle protein synthesis (Sandri, 2008).
MuRF1 and atrogin1 are key ubiquitin ligases and are the atrogenes most widely used as markers of the ubiquitin‐proteasome activity (Sandri et al. 2004; Brault et al. 2010; Romanello et al. 2010). The unchanged expression of MuRF1 and atrogin1 after 3 weeks of disuse (Fig. 9) is not unexpected and is consistent with several previous observations in humans (de Boer et al. 2007; Alibegovic et al. 2010). It is has become increasingly clear that atrogene activation occurs transiently and at early times in disuse atrophy of both human (de Boer et al. 2007; Urso et al. 2007; Sakuma et al. 2009; Gustafsson et al. 2010) and mice (Cannavino et al. 2014) limb muscles. Collectively, the present findings do not support a significantcontributionof the ubiquitin–proteasome system in the progression of muscle atrophy at late stages of ULLS, allthough they do not rule out the possibility that the early development of muscle atrophy depended on such a system. This conclusion is consistent with that observed at late stages of bed rest (Brocca et al. 2012).
The autophagy system is constitutively active in skeletal muscle to remove protein aggregates and old or damaged organelles (Sandri, 2010). Moreover, it is understood that the autophagy system can play a relevant role in protein degradation and in muscle atrophy (Sandri, 2010). In a recent study, an up‐regulation of autophagy was suggested to contribute to the progression of muscle atrophy at late stages (23 days) of bed rest (Brocca et al. 2012). By contrast, the unchanged expression of Beclin‐1 and p62 (Fig. 9 B) does not support a role of autophagy in ULLS.
There is evidence to suggest a major role for decreased protein synthesis in disuse atrophy in humans (de Boer et al. 2007; Glover et al. 2010; Rennie et al. 2010). Among the different pathways controlling muscle size (Glass, 2003, 2005, 2010; Lee & Glass, 2011), the IGF‐1/Akt/mTOR pathway is central and is mainly recruited upon IGF‐1/insulin stimuli to promote protein synthesis and to block protein degradation (Rommel et al. 2001). After unloading, we found changes in the phosphorylation level of Akt, 4EBP1 and S6 suggesting that a decline in protein synthesis could contribute to the progression of muscle atrophy at late stages of ULLS, in agreement with previous observations (de Boer et al. 2007; Glover et al. 2010; Rennie et al. 2010). Interestingly, at late stages of bed rest, no significant changes in the IGF‐1/Akt/mTOR pathway were observed (Brocca et al. 2012).
It is well known that resistance trainingcauses muscle hypertrophy and enhanced rates of protein synthesis (Murton et al. 2008)(Rennie & Tipton, 2000). After exercise, a transient increase in phosphorylation of AKT, mTOR, PKB, 4EBP1 and p70/S6K wasreported (Baar & Esser, 1999; Nader & Esser, 2001; Bolster et al. 2003; Parkington et al. 2003; Kubica et al. 2005; Cuthbertson et al. 2006).Consistently, we show an increase of phosphorylation of 4EBP1 and S6K; no changes were found for AKT (Fig. 9).
It is still unclear whether the activity of the ubiquitin proteasome system is enhanced (Yang et al. 2006; Louis et al. 2007; Raue et al. 2007; Deldicque et al. 2008; Mascher et al. 2008) or inhibited (Baar et al. 2006) by resistance exercise. Furthermore, recent studies have illustrated a down‐regulation of several markers of autophagy (such as LC3 and GABARAP) following resistance training in humans(Glynn et al. 2010; Fry et al. 2012), suggesting a decrease in autophagy flux. The trend towards a down‐regulation of MuRF1, atrogin1 and the reduction of p62 mRNA (Fig. 9) in Post‐RT suggests that muscle mass recovery following ULLS could be the result of both enhanced protein synthesis and decreased protein degradation.
Pathways controlling muscle metabolism
PCG‐1alpha is a master controller of mitochondrial biogenesis and oxidative metabolism (Lin et al. 2002). Moreover, because it inhibits the FoxO proteolytic pathway, lower PGC‐1α expression can be associated with muscle wasting (Sandri et al. 2006; Sacheck et al. 2007) and occurs after disuse in both humans(Brocca et al. 2012) and mice (Cannavino et al. 2014). In human bed rest, PGC‐1alpha down‐regulation has been suggested to be a major determinant of the disuse induced metabolic derangement, whereas no clear role has been established with respect to muscle atrophy (Brocca et al. 2012). In mice, PCG‐1alpha down‐regulation following hind‐limb unloading has been shown to play a major role not only in metabolic derangement, but also in muscle mass loss (Cannavino et al. 2014).
In the present study, the lack of PCG‐1alpha down‐regulation suggests that, in contrastto what happens in human bed rest (Brocca et al. 2012) and in mice hindlimb unloading (Cannavino et al. 2014), PCG‐1alpha does not play a significant role in muscle adaptations after 3 weeks of ULLS (i.e. at least in the late stages of disuse). The observation is consistent with the lack of a significant impairment of oxidative metabolism (Fig. 5). Exercise training is known to enhance PGC‐1alpha expression (Pilegaard et al. 2003). The lack of an effect of a resistance training programme on PGC‐1α expression suggests that disuse blunts the PGC‐1alpha response to exercise, consistent with previous observations (Ringholm et al. 2011).Notwithstanding the resistance to up‐regulation of PGC‐1alpha, resistance exercise was able to counteract the negative effects induced by unilateral lower leg suspension on energy production systems.
SREBPs are master regulators of lipid homeostasis, inducing the transcription of many genes involved in lipid biosynthesis (Horton et al. 2002). SREBP‐1 stimulates lipogenesis and triglyceride deposition and plays an important role in regulating lipid metabolism in skeletal muscle (Horton et al. 2002; Commerford et al. 2004). An increase in SREBP‐1 expression was observed after 23 days of bed rest and was suggested to be involved in the intramuscular accumulation of lipids and in impaired mitochondrial function (Brocca et al. 2012). The lower expression of SREBP‐1 following ULLS suggests a differential response of lipid metabolism of human skeletal muscle to ULLS and bed rest. The up‐regulation of SREBP‐1 Post‐RT counterbalances the down‐regulation observed in disuse and suggests an exercise‐induced modulation of lipid metabolism and an enhancement of lipid accumulation.
The AMPK system senses the energy level of the cell (i.e. the ratio between AMP and ATP) and counteracts energy imbalance increasing protein breakdown via FoxO activation and decreasing protein synthesis via inhibition of the IGF‐1/Akt/mTOR pathway. We have previously shown no changes of the AMPK system after 23 days of bed rest, suggesting that no energy stress occurred late in bed rest, notwithstanding an impairment of energy metabolism (Brocca et al. 2012). By contrast to the bed rest model, in the present study, we found low levels of activation of AMPK pathway after disuse (Fig. 10). The same finding was observed in the vastus lateralis of individuals with extreme muscular disuse, indicating a deregulated fatty acid oxidation (Kostovski et al. 2013). After exercise, the level of AMPK activation returned to control values in accordance with the known role of muscular contraction in AMPK activation (Nielsen et al. 2003).
Redox balance following disuse and re‐training
Oxidative stress is widely considered to be a major trigger of muscle adaptations to disuse. Although its role has been elegantly defined in the dramatic (50%) and fast developing (12–18 h) diaphragm atrophy following mechanical ventilation (Levine et al. 2008), in human limb muscles, analyses of redox status are few and contradictory results have been reported (Pellegrino et al. 2011 b). After 35 days of bed rest, an impairment of anti‐oxidant defence system and increased protein carbonylation was found in vastus lateralis muscle (Dalla Libera et al. 2009; Brocca et al. 2012). Moreover, a recent analysis of gene expression (Reich et al. 2010) has shown an up‐regulation of the pathways involved in oxidative stress after 48 h of unilateral lower leg suspension. The concomitant increase of SOD1, catalase and PRDX3 Post‐ULLS (Fig. 6) could be part of successful compensatory mechanisms against increased reactive oxygen species (ROS) production. The latter hypothesis is supported by an absence of protein carbonylation (Fig. 8), as well as by an unchanged expression of NRF2 (Fig. 10), one of the most important transcription factors responsible for expression of detoxification enzymes, which is indirectly activated by ROS overproduction. Muscular activity promotes ROS production in contracting skeletal muscle fibres from a variety of cellular locations (Powers et al. 2009). Early studies focused on the damaging effects of ROS, although more recent studies have shown that ROS production is necessary to enable muscle adaptations to exercise (Powers & Jackson, 2008). Moreover, physiological levels of ROS are essential for optimal force production in skeletal muscle, whereas high levels of ROS promote skeletal muscle contractile dysfunction resulting in muscle fatigue (Powers et al. 2007).
Following exercise, the imbalance between ROS levels and anti‐oxidant systems can cause oxidative protein modifications including protein carbonylation (Barreiro & Hussain, 2010). Consistent with an alteration of redox balance Post‐RT, SOD 1, CAHIII and twoheat shock protein (HSPB1, α‐β‐crystallin) were up‐regulated and PRDX3 and catalase were down‐regulated compared to Post‐ULLS (Fig. 6). The up‐regulation of heat shock proteins Post‐RT is consistent with previous findings (Fujino et al. 2009)(Powers et al. 2009)(McArdle & Jackson, 2000). It could be involved in the localization of newly synthesized proteins following exercise and provide cytoprotection against subsequent stresses. These latter findings suggest that human skeletal muscle following long‐term disuse can still effectively respond to enhanced ROS production as a result of exercise. The latter hypothesis is supported by a lack of up‐regulation of NRF2 (Fig. 10), as well as a lack of protein carbonylation Post‐RT (Fig. 8).
Conclusions
Our findings support the hypotheses that (1) specific force of muscle fibres decreased following ULLS and returned to normal following 3 weeks of active recovery as a result of the loss and recovery of myosin and actin content and (2) profound alterations of muscle protein pattern occurred during ULLS and were reversed during recovery; however, they do not support the hypothesis that (3) oxidative stress and protein carbonylation occurred during ULLS and redox balance was restored by active recovery. Indeed, adaptations of anti‐oxidant defence systems were observed following ULLS, and were reversed by active recovery, although no sign of oxidative stress and protein carbonylation were found in either condition, suggesting an effective cellular response to redox imbalance. The latter observations do not support a major role of oxidative stress in ULLS.
Muscle atrophy following ULLS could not be related to activation of pathways causing muscle protein breakdown (ubiquitin‐proteasome and autophagy systems), whereas a down‐regulation of protein synthesis could be hypothesized.
Resistance training was very effective in restoring both muscle atrophy and qualitative muscle changes, indicating that long‐term ULLS did not prevent the positive effect of exercise on human muscle.
Interestingly, the response to 3 weeks of ULLS showed similarities and differences compared to the response to 23 days of bed rest (Borina et al. 2010; Brocca et al. 2012). The loss in muscle fibres CSA (23%) and myosin concentration (28%) was very similar. In both conditions, profound qualitative adaptations occurred in both the pattern of myofibrillar proteins and metabolic enzymes. In both conditions, adaptations of anti‐oxidant defence systems were observed. In bed rest, all defence systems were down‐regulated, NRF2 was consistently up‐regulated and protein carbonylation occurred, indicating that oxidative stress developed; in ULLS, anti‐oxidant defence systems were up‐regulated, NRF2 was unchanged and no protein carbonylation occurred, indicating an effective cellular response to redox imbalance. Moreover, in bed rest, autophagy was up‐regulated potentially contributing to atrophy progression and PGC‐1alpha was down‐regulated supporting metabolic derangement; in ULLS, no autophagy activation and no PGC‐alpha down‐regulation occurred.
Additional information
Competing interests
The authors declare that they have no competing interests.
Author contributions
RB, MAP and LB conceived and designed the experiments. LB, EL, JC, OS and JMP collected, analysed and interpretatedthe data. GdVcollected biopsies and supervised the in vivo experiment. LB, MAP, MN and RB drafted the article and revised it critically for important intellectual content.The biopsies were performed at Institute for Biomedical Research into Human Movement and Health, Manchester Metropolitan University, Manchester, UK; all other experiments were performed at the Department of Molecular Medicine, University of Pavia, Italy. All authors have approved the final version of the manuscript and agree to be accountable for all aspects of the work. All persons designated as authors qualify for authorship, and all those who qualify for authorship are listed.
Funding
This study was supported by the European Commission for the MYOAGE grant (no. 22 3576) funded under FP7. The funders had no role in the study design, data collection and analysis, decision to publish or preparation of the manuscript.
Translational perspective
It is well known that, when skeletal muscles are not used or are used against a low load, they loose mass (i.e. muscle ‘quantity’ changes). Muscle mass loss plays a major role in muscle strength loss. Here, we focus on the role of muscle ‘quality’ [i.e. on alterations in the force developed per unit of muscle mass (specific force) and on alterations in the relative distribution of proteins within a given mass of muscle]. Young healthy subjects were subjected to unilateral lower limb suspension (ULLS), a widely used model of singlelimb disuse, and individual muscle fibre structure and function were studied. Profound alterations of specific force and of whole protein content comprising proteins involved in muscle contraction, metabolic enzymes and anti‐oxidant defence systems were found. We conclude that, in addition to changes in muscle quantity, those qualitative adaptations, and especially the disproportionate loss of cellular proteins involved in muscle contraction, played a major role in impairing muscle function in vivo. Importantly, active recovery could promptly restore muscle fibre protein content and strength, indicating that ULLS did not prevent the positive effect of exercise on human muscle. Consistent with previous findings, activation of the protein kinase B/mechanistic target of rapamycinsignalling pathway controlling protein synthesis was lower following disuse and could contribute to disuse muscle atrophy. Interestingly, in contrastto that shown in bed rest and other models of disuse, the adaptations of anti‐oxidant defence systems appear to be sufficient for preventing oxidative stress, which probably did not play a major role in ULLS atrophy.
Acknowledgements
We are grateful to Professors Gianni Biolo, Bruno Grassi, Marco Sandri and Carlo Reggiani for helpful discussions on skeletal muscle disuse. We wish to thank Mr Luigi Guidotti for technical help.
References
- Abraham MR, Selivanov VA, Hodgson DM, Pucar D, Zingman LV, Wieringa B, Dzeja PP, Alekseev AE & Terzic A (2002). Coupling of cell energetics with membrane metabolic sensing. Integrative signaling through creatine kinase phosphotransfer disrupted by M‐CK gene knock‐out. J Biol Chem 277, 24427–24434. [DOI] [PubMed] [Google Scholar]
- Adams GR, Caiozzo VJ & Baldwin KM (2003). Skeletal muscle unweighting: spaceflight and ground‐based models. J Appl Physiol 95, 2185–2201. [DOI] [PubMed] [Google Scholar]
- Adams GR, Hather BM & Dudley GA (1994). Effect of short‐term unweighting on human skeletal muscle strength and size. Aviat Space Environ Med 65, 1116–1121. [PubMed] [Google Scholar]
- Alibegovic AC, Sonne MP, Hojbjerre L, Bork‐Jensen J, Jacobsen S, Nilsson E, Faerch K, Hiscock N, Mortensen B, Friedrichsen M, Stallknecht B, Dela F & Vaag A (2010). Insulin resistance induced by physical inactivity is associated with multiple transcriptional changes in skeletal muscle in young men. Am J Physiol Endocrinol Metab 299, E752–E763. [DOI] [PubMed] [Google Scholar]
- Baar K & Esser K (1999). Phosphorylation of p70(S6k) correlates with increased skeletal muscle mass following resistance exercise. Am J Physiol Cell Physiol 276, C120–C127. [DOI] [PubMed] [Google Scholar]
- Baar K, Nader G & Bodine S (2006). Resistance exercise, muscle loading/unloading and the control of muscle mass. Essays Biochem 42, 61–74. [DOI] [PubMed] [Google Scholar]
- Barreiro E & Hussain SN (2010). Protein carbonylation in skeletal muscles: impact on function. Antioxid Redox Signal 12, 417–429. [DOI] [PubMed] [Google Scholar]
- Berg HE, Dudley GA, Haggmark T, Ohlsen H & Tesch PA (1991). Effects of lower limb unloading on skeletal muscle mass and function in humans. J Appl Physiol 70, 1882–1885. [DOI] [PubMed] [Google Scholar]
- Berg HE, Larsson L & Tesch PA (1997). Lower limb skeletal muscle function after 6 wk of bed rest. J Appl Physiol 82, 182–188. [DOI] [PubMed] [Google Scholar]
- Berg HE & Tesch PA (1996). Changes in muscle function in response to 10 days of lower limb unloading in humans. Acta PhysiolScand 157, 63–70. [DOI] [PubMed] [Google Scholar]
- Bergstrom J (1979). Muscle‐biopsy needles. Lancet 1, 153. [DOI] [PubMed] [Google Scholar]
- Bessman SP & Carpenter CL (1985). The creatine‐creatine phosphate energy shuttle. Annu Rev Biochem 54, 831–862. [DOI] [PubMed] [Google Scholar]
- Bickel CS, Slade J, Mahoney E, Haddad F, Dudley GA & Adams GR (2005). Time course of molecular responses of human skeletal muscle to acute bouts of resistance exercise. J Appl Physiol (1985) 98, 482–488. [DOI] [PubMed] [Google Scholar]
- Bleeker MW, Hopman MT, Rongen GA, Smits P (2004). Unilateral lower limb suspension can cause deep venous thrombosis. Am J Physiol Regul Integr Comp Physiol 286, 6, R1176–R1177 [DOI] [PubMed] [Google Scholar]
- Bodine SC (2006). mTOR signaling and the molecular adaptation to resistance exercise. Med Sci Sports Exerc 38, 1950–1957. [DOI] [PubMed] [Google Scholar]
- Bolster DR, Kubica N, Crozier SJ, Williamson DL, Farrell PA, Kimball SR & Jefferson LS (2003). Immediate response of mammalian target of rapamycin (mTOR)‐mediated signalling following acute resistance exercise in rat skeletal muscle. J Physiol 553, 213–220. [DOI] [PMC free article] [PubMed] [Google Scholar]
- Borina E, Pellegrino MA, D'Antona G & Bottinelli R (2010). Myosin and actin content of human skeletal muscle fibers following 35 days bed rest. Scand J Med Sci Sports 20, 65–73. [DOI] [PubMed] [Google Scholar]
- Bottinelli R, Betto R, Schiaffino S & Reggiani C (1994). Maximum shortening velocity and coexistence of myosin heavy chain isoforms in single skinned fast fibres of rat skeletal muscle. J Muscle Res Cell Motil 15, 413–419. [DOI] [PubMed] [Google Scholar]
- Bottinelli R, Canepari M, Pellegrino MA & Reggiani C (1996). Force–velocity properties of human skeletal muscle fibres: myosin heavy chain isoform and temperature dependence. J Physiol 495, 573–586. [DOI] [PMC free article] [PubMed] [Google Scholar]
- Bottinelli R & Reggiani C (2000). Human skeletal muscle fibres: molecular and functional diversity. Prog Biophys Mol Biol 73, 195–262. [DOI] [PubMed] [Google Scholar]
- Brault JJ, Jespersen JG & Goldberg AL (2010). Peroxisome proliferator‐activated receptor gamma coactivator 1alpha or 1beta overexpression inhibits muscle protein degradation, induction of ubiquitin ligases, and disuse atrophy. J Biol Chem 285, 19460–19471. [DOI] [PMC free article] [PubMed] [Google Scholar]
- Brocca L, Cannavino J, Coletto L, Biolo G, Sandri M, Bottinelli R & Pellegrino MA (2012). The time course of the adaptations of human muscle proteome to bed rest and the underlying mechanisms. J Physiol 590, 5211–5230. [DOI] [PMC free article] [PubMed] [Google Scholar]
- Brocca L, Pellegrino MA, Desaphy JF, Pierno S, Camerino DC & Bottinelli R (2010). Is oxidative stress a cause or consequence of disuse muscle atrophy in mice? A proteomic approach in hindlimb‐unloaded mice. Exp Physiol 95, 331–350. [DOI] [PubMed] [Google Scholar]
- Bruusgaard JC, Egner IM, Larsen TK, Dupre‐Aucouturier S, Desplanches D & Gundersen K (2012). No change in myonuclear number during muscle unloading and reloading. J Appl Physiol (1985) 113, 290–296. [DOI] [PubMed] [Google Scholar]
- Callahan DM, Miller MS, Sweeny AP, Tourville TW, Slauterbeck JR, Savage PD, Maugan DW, Ades PA, Beynnon BD & Toth MJ (2014). Muscle disuse alters skeletal muscle contractile function at the molecular and cellular levels in older adult humans in a sex‐specific manner. J Physiol 592, 4555–4573. [DOI] [PMC free article] [PubMed] [Google Scholar]
- Campbell EL, Seynnes OR, Bottinelli R, McPhee JS, Atherton PJ, Jones DA, Butler‐Browne G & Narici MV (2013). Skeletal muscle adaptations to physical inactivity and subsequent retraining in young men. Biogerontology 14, 247–259. [DOI] [PubMed] [Google Scholar]
- Canepari M, Pellegrino MA, D'Antona G & Bottinelli R (2010). Single muscle fiber properties in aging and disuse. Scand J Med Sci Sports 20, 10–19. [DOI] [PubMed] [Google Scholar]
- Canepari M, Rossi R, Pellegrino MA, Orrell RW, Cobbold M, Harridge S & Bottinelli R (2005). Effects of resistance training on myosin function studied by the in vitro motility assay in young and older men. J Appl Physiol (1985) 98, 2390–2395. [DOI] [PubMed] [Google Scholar]
- Cannavino J, Brocca L, Sandri M, Bottinelli R & Pellegrino MA (2014). PGC1‐alpha over‐expression prevents metabolic alterations and soleus muscle atrophy in hindlimb unloaded mice. J Physiol 592, 4575–4589. [DOI] [PMC free article] [PubMed] [Google Scholar]
- Carrithers JA, Tesch PA, Trieschmann J, Ekberg A & Trappe TA (2002). Skeletal muscle protein composition following 5 weeks of ULLS and resistance exercise countermeasures. J Gravit Physiol 9, P155‐156. [PubMed] [Google Scholar]
- Claflin DR, Larkin LM, Cederna PS, Horowitz JF, Alexander NB, Cole NM, Galecki AT, Chen S, Nyquist LV, Carlson BM, Faulkner JA & Ashton‐Miller JA (2011). Effects of high‐ and low‐velocity resistance training on the contractile properties of skeletal muscle fibers from young and older humans. J Appl Physiol 111, 1021–1030. [DOI] [PMC free article] [PubMed] [Google Scholar]
- Coffey VG & Hawley JA (2007). The molecular bases of training adaptation. Sports Med 37, 737–763. [DOI] [PubMed] [Google Scholar]
- Coirault C, Guellich A, Barbry T, Samuel JL, Riou B & Lecarpentier Y (2007). Oxidative stress of myosin contributes to skeletal muscle dysfunction in rats with chronic heart failure. Am J Physiol Heart Circ Physiol 292, H1009–H1017. [DOI] [PubMed] [Google Scholar]
- Commerford SR, Peng L, Dube JJ & O'Doherty RM (2004). In vivo regulation of SREBP‐1c in skeletal muscle: effects of nutritional status, glucose, insulin, and leptin. Am J Physiol Regul Integr Comp Physiol 287, R218–R227. [DOI] [PubMed] [Google Scholar]
- Cuthbertson DJ, Babraj J, Smith K, Wilkes E, Fedele MJ, Esser K & Rennie M (2006). Anabolic signaling and protein synthesis in human skeletal muscle after dynamic shortening or lengthening exercise. Am J Physiol Endocrinol Metab 290, E731–E738. [DOI] [PubMed] [Google Scholar]
- D'Antona G, Lanfranconi F, Pellegrino MA, Brocca L, Adami R, Rossi R, Moro G, Miotti D, Canepari M & Bottinelli R (2006). Skeletal muscle hypertrophy and structure and function of skeletal muscle fibres in male body builders. J Physiol 570, 611–627. [DOI] [PMC free article] [PubMed] [Google Scholar]
- D'Antona G, Pellegrino MA, Adami R, Rossi R, Carlizzi CN, Canepari M, Saltin B & Bottinelli R (2003). The effect of ageing and immobilization on structure and function of human skeletal muscle fibres. J Physiol 552, 499–511. [DOI] [PMC free article] [PubMed] [Google Scholar]
- Dalla Libera L, Ravara B, Gobbo V, Tarricone E, Vitadello M, Biolo G, Vescovo G & Gorza L (2009). A transient antioxidant stress response accompanies the onset of disuse atrophy in human skeletal muscle. J Appl Physiol (1985) 107, 549–557. [DOI] [PubMed] [Google Scholar]
- de Boer MD, Maganaris CN, Seynnes OR, Rennie MJ & Narici MV (2007). Time course of muscular, neural and tendinous adaptations to 23 day unilateral lower‐limb suspension in young men. J Physiol 583, 1079–1091. [DOI] [PMC free article] [PubMed] [Google Scholar]
- Deldicque L, Atherton P, Patel R, Theisen D, Nielens H, Rennie MJ & Francaux M (2008). Decrease in Akt/PKB signalling in human skeletal muscle by resistance exercise. Eur J Appl Physiol 104, 57–65. [DOI] [PubMed] [Google Scholar]
- di Prampero PE & Narici MV (2003). Muscles in microgravity: from fibres to human motion. J Biomech 36, 403–412. [DOI] [PubMed] [Google Scholar]
- Diffee GM, Patel JR, Reinach FC, Greaser ML & Moss RL (1996). Altered kinetics of contraction in skeletal muscle fibers containing a mutant myosin regulatory light chain with reduced divalent cation binding. Biophys J 71, 341–350. [DOI] [PMC free article] [PubMed] [Google Scholar]
- Dudley GA, Duvoisin MR, Adams GR, Meyer RA, Belew AH & Buchanan P (1992). Adaptations to unilateral lower limb suspension in humans. Aviat Space Environ Med 63, 678–683. [PubMed] [Google Scholar]
- Fitts RH, Riley DR & Widrick JJ (2001). Functional and structural adaptations of skeletal muscle to microgravity. J Exp Biol 204, 3201–3208. [DOI] [PubMed] [Google Scholar]
- Fitts RH, Trappe SW, Costill DL, Gallagher PM, Creer AC, Colloton PA, Peters JR, Romatowski JG, Bain JL & Riley DA (2010). Prolonged space flight‐induced alterations in the structure and function of human skeletal muscle fibres. J Physiol 588, 3567–3592. [DOI] [PMC free article] [PubMed] [Google Scholar]
- Friedmann‐Bette B, Bauer T, Kinscherf R, Vorwald S, Klute K, Bischoff D, Muller H, Weber MA, Metz J, Kauczor HU, Bartsch P & Billeter R (2010). Effects of strength training with eccentric overload on muscle adaptation in male athletes. Eur J Appl Physiol 108, 821–836. [DOI] [PubMed] [Google Scholar]
- Fry CS, Drummond MJ, Lujan HL, DiCarlo SE & Rasmussen BB (2012). Paraplegia increases skeletal muscle autophagy. Muscle Nerve 46, 793–798. [DOI] [PMC free article] [PubMed] [Google Scholar]
- Fujino H, Ishihara A, Murakami S, Yasuhara T, Kondo H, Mohri S, Takeda I & Roy RR (2009). Protective effects of exercise preconditioning on hindlimb unloading‐induced atrophy of rat soleus muscle. Acta Physiol (Oxf) 197, 65–74. [DOI] [PubMed] [Google Scholar]
- Glass DJ (2003). Signalling pathways that mediate skeletal muscle hypertrophy and atrophy. Nat Cell Biol 5, 87–90. [DOI] [PubMed] [Google Scholar]
- Glass DJ (2005). Skeletal muscle hypertrophy and atrophy signaling pathways. Int J Biochem Cell Biol 37, 1974–1984. [DOI] [PubMed] [Google Scholar]
- Glass DJ (2010). Signaling pathways perturbing muscle mass. Curr Opin Clin Nutr Metab Care 13, 225–229. [DOI] [PubMed] [Google Scholar]
- Glover EI, Yasuda N, Tarnopolsky MA, Abadi A & Phillips SM (2010). Little change in markers of protein breakdown and oxidative stress in humans in immobilization‐induced skeletal muscle atrophy. Appl Physiol Nutr Metab 35, 125–133. [DOI] [PubMed] [Google Scholar]
- Glynn EL, Fry CS, Drummond MJ, Dreyer HC, Dhanani S, Volpi E & Rasmussen BB (2010). Muscle protein breakdown has a minor role in the protein anabolic response to essential amino acid and carbohydrate intake following resistance exercise. Am J Physiol Regul Integr Comp Physiol 299, R533–R540. [DOI] [PMC free article] [PubMed] [Google Scholar]
- Green H, Goreham C, Ouyang J, Ball‐Burnett M & Ranney D (1999). Regulation of fiber size, oxidative potential, and capillarization in human muscle by resistance exercise. Am J Physiol Regul Integr Comp Physiol 276, R591–R596. [DOI] [PubMed] [Google Scholar]
- Greenberg MJ, Mealy TR, Watt JD, Jones M, Szczesna‐Cordary D & Moore JR (2009). The molecular effects of skeletal muscle myosin regulatory light chain phosphorylation. Am J Physiol Regul Integr Comp Physiol 297, R265–R274. [DOI] [PMC free article] [PubMed] [Google Scholar]
- Gustafsson T, Osterlund T, Flanagan JN, von Walden F, Trappe TA, Linnehan RM & Tesch PA (2010). Effects of 3 days unloading on molecular regulators of muscle size in humans. J Appl Physiol (1985) 109, 721–727. [DOI] [PubMed] [Google Scholar]
- Hackney KJ & Ploutz‐Snyder LL (2012). Unilateral lower limb suspension: integrative physiological knowledge from the past 20 years (1991–2011). Eur J Appl Physiol 112, 9–22. [DOI] [PubMed] [Google Scholar]
- Haddad F, Baldwin KM & Tesch PA (2005). Pretranslational markers of contractile protein expression in human skeletal muscle: effect of limb unloading plus resistance exercise. J Appl Physiol 98, 46–52. [DOI] [PubMed] [Google Scholar]
- Harridge SD, Bottinelli R, Canepari M, Pellegrino M, Reggiani C, Esbjornsson M, Balsom PD & Saltin B (1998). Sprint training, in vitro and in vivo muscle function, and myosin heavy chain expression. J Appl Physiol (1985) 84, 442–449. [DOI] [PubMed] [Google Scholar]
- Haus JM, Carrithers JA, Carroll CC, Tesch PA & Trappe TA (2007). Contractile and connective tissue protein content of human skeletal muscle: effects of 35 and 90 days of simulated microgravity and exercise countermeasures. Am J Physiol Regul Integr Comp Physiol 293, R1722–R1727. [DOI] [PubMed] [Google Scholar]
- Holloway KV, O'Gorman M, Woods P, Morton JP, Evans L, Cable NT, Goldspink DF & Burniston JG (2009). Proteomic investigation of changes in human vastus lateralis muscle in response to interval‐exercise training. Proteomics 9, 5155–5174. [DOI] [PubMed] [Google Scholar]
- Horton JD, Goldstein JL & Brown MS (2002). SREBPs: transcriptional mediators of lipid homeostasis. Cold Spring Harb Symp Quant Biol 67, 491–498. [DOI] [PubMed] [Google Scholar]
- Hvid LG, Suetta C, Nielsen JH, Jensen MM, Frandsen U, Ørtenblad N, Kjaer M & Aagaard P (2014). Aging impairs the recovery in mechanical muscle function following 4 days of disuse. Exp Gerontol 52, 1–8. [DOI] [PubMed] [Google Scholar]
- Janssen E, Dzeja PP, Oerlemans F, Simonetti AW, Heerschap A, de Haan A, Rush PS, Terjung RR, Wieringa B & Terzic A (2000). Adenylate kinase 1 gene deletion disrupts muscle energetic economy despite metabolic rearrangement. EMBO J 19, 6371–6381. [DOI] [PMC free article] [PubMed] [Google Scholar]
- Jones DA, Rutherford OM & Parker DF (1989). Physiological changes in skeletal muscle as a result of strength training. Q J Exp Physiol 74, 233–256. [DOI] [PubMed] [Google Scholar]
- Kosek DJ, Kim JS, Petrella JK, Cross JM & Bamman MM (2006). Efficacy of 3 days/wk resistance training on myofiber hypertrophy and myogenic mechanisms in young vs. older adults. J Appl Physiol (1985) 101, 531–544. [DOI] [PubMed] [Google Scholar]
- Kostovski E, Boon H, Hjeltnes N, Lundell LS, Ahlsén M, Chibalin AV, Krook A, Iversen PO & Widegren U (2013). Altered content of AMP‐activated protein kinase isoforms in skeletal muscle from spinal cord injured subjects. Am J Physiol Endocrinol Metab 305, E1071–E1080. [DOI] [PubMed] [Google Scholar]
- Kubica N, Bolster DR, Farrell PA, Kimball SR & Jefferson LS (2005). Resistance exercise increases muscle protein synthesis and translation of eukaryotic initiation factor 2Bepsilon mRNA in a mammalian target of rapamycin‐dependent manner. J Biol Chem 280, 7570–7580. [DOI] [PubMed] [Google Scholar]
- Kvorning T, Andersen M, Brixen K, Schjerling P, Suetta C & Madsen K (2007). Suppression of testosterone does not blunt mRNA expression of myoD, myogenin, IGF, myostatin or androgen receptor post strength training in humans. J Physiol 578, 579–593. [DOI] [PMC free article] [PubMed] [Google Scholar]
- Laemmli UK (1970). Cleavage of structural proteins during the assembly of the head of bacteriophage T4. Nature 227, 680–685. [DOI] [PubMed] [Google Scholar]
- Larsson L, Li X, Berg HE & Frontera WR (1996). Effects of removal of weight‐bearing function on contractility and myosin isoform composition in single human skeletal muscle cells. Pflügers Archiv 432, 320–328. [DOI] [PubMed] [Google Scholar]
- Lee SJ & Glass DJ (2011). Treating cancer cachexia to treat cancer. Skelet Muscle 1, 2. [DOI] [PMC free article] [PubMed] [Google Scholar]
- Levine S, Nguyen T, Taylor N, Friscia ME, Budak MT, Rothenberg P, Zhu J, Sachdeva R, Sonnad S, Kaiser LR, Rubinstein NA, Powers SK & Shrager JB (2008). Rapid disuse atrophy of diaphragm fibers in mechanically ventilated humans. N Engl J Med 358, 1327–1335. [DOI] [PubMed] [Google Scholar]
- Lin J, Wu H, Tarr PT, Zhang CY, Wu Z, Boss O, Michael LF, Puigserver P, Isotani E, Olson EN, Lowell BB, Bassel‐Duby R & Spiegelman BM (2002). Transcriptional co‐activator PGC‐1 alpha drives the formation of slow‐twitch muscle fibres. Nature 418, 797–801. [DOI] [PubMed] [Google Scholar]
- Louis E, Raue U, Yang Y, Jemiolo B & Trappe S (2007). Time course of proteolytic, cytokine, and myostatin gene expression after acute exercise in human skeletal muscle. J Appl Physiol (1985) 103, 1744–1751. [DOI] [PubMed] [Google Scholar]
- Maffei M, Longa E, Qaisar R, Agoni V, Desaphy JF, Camerino DC, Bottinelli R & Canepari M (2014). Actin sliding velocity on pure myosin isoforms from hindlimb unloaded mice. Acta Physiol (Oxf) 212, 316–329. [DOI] [PubMed] [Google Scholar]
- Malisoux L, Francaux M, Nielens H & Theisen D (2006). Stretch‐shortening cycle exercises: an effective training paradigm to enhance power output of human single muscle fibers. J Appl Physiol 100, 771–779. [DOI] [PubMed] [Google Scholar]
- Manini TM, Clark BC, Nalls MA, Goodpaster BH, Ploutz‐Snyder LL & Harris TB (2007). Reduced physical activity increases intermuscular adipose tissue in healthy young adults. Am J Clin Nutr 85, 377–384. [DOI] [PubMed] [Google Scholar]
- Mascher H, Tannerstedt J, Brink‐Elfegoun T, Ekblom B, Gustafsson T & Blomstrand E (2008). Repeated resistance exercise training induces different changes in mRNA expression of MAFbx and MuRF‐1 in human skeletal muscle. Am J Physiol Endocrinol Metab 294, E43–E51. [DOI] [PubMed] [Google Scholar]
- McArdle A & Jackson MJ (2000). Exercise, oxidative stress and ageing. J Anat 197, 539–541. [DOI] [PMC free article] [PubMed] [Google Scholar]
- Murton AJ, Constantin D & Greenhaff PL (2008). The involvement of the ubiquitin proteasome system in human skeletal muscle remodelling and atrophy. Biochim Biophys Acta 1782, 730–743. [DOI] [PubMed] [Google Scholar]
- Nader GA & Esser KA (2001). Intracellular signaling specificity in skeletal muscle in response to different modes of exercise. J Appl Physiol (1985) 90, 1936–1942. [DOI] [PubMed] [Google Scholar]
- Narici M, Kayser B, Barattini P & Cerretelli P (2003). Effects of 17‐day spaceflight on electrically evoked torque and cross‐sectional area of the human triceps surae. Eur J Appl Physiol 90, 275–282. [DOI] [PubMed] [Google Scholar]
- Nielsen JN, Mustard KJ, Graham DA, Yu H, MacDonald CS, Pilegaard H, Goodyear LJ, Hardie DG, Richter EA & Wojtaszewski JF (2003). 5’‐AMP‐activated protein kinase activity and subunit expression in exercise‐trained human skeletal muscle. J Appl Physiol (1985) 94, 631–641. [DOI] [PubMed] [Google Scholar]
- Olsson MC, Patel JR, Fitzsimons DP, Walker JW & Moss RL (2004). Basal myosin light chain phosphorylation is a determinant of Ca2+ sensitivity of force and activation dependence of the kinetics of myocardial force development. Am J Physiol Heart Circ Physiol 287, H2712–H2718. [DOI] [PubMed] [Google Scholar]
- Pansarasa O, Rinaldi C, Parente V, Miotti D, Capodaglio P & Bottinelli R (2009). Resistance training of long duration modulates force and unloaded shortening velocity of single muscle fibres of young women. J Electromyogr Kinesiol 19, e290‐300. [DOI] [PubMed] [Google Scholar]
- Parkington JD, Siebert AP, LeBrasseur NK & Fielding RA (2003). Differential activation of mTOR signaling by contractile activity in skeletal muscle. Am J Physiol Regul Integr Comp Physiol 285, R1086–R1090. [DOI] [PubMed] [Google Scholar]
- Pellegrino MA, Canepari M, Rossi R, D'Antona G, Reggiani C & Bottinelli R (2003). Orthologous myosin isoforms and scaling of shortening velocity with body size in mouse, rat, rabbit and human muscles. J Physiol 546, 677–689. [DOI] [PMC free article] [PubMed] [Google Scholar]
- Pellegrino MA, Desaphy JF, Brocca L, Pierno S, Camerino DC & Bottinelli R (2011. a). Redox homeostasis, oxidative stress and disuse muscle atrophy. J Physiol 589, 2147–2160. [DOI] [PMC free article] [PubMed] [Google Scholar]
- Pellegrino MA, Desaphy JF, Brocca L, Pierno S, Camerino DC & Bottinelli R (2011. b). Redox homeostasis, oxidative stress and disuse muscle atrophy. J Physiol 589, 2147–2160. [DOI] [PMC free article] [PubMed] [Google Scholar]
- Pilegaard H, Saltin B & Neufer PD (2003). Exercise induces transient transcriptional activation of the PGC‐1alpha gene in human skeletal muscle. J Physiol 546, 851–858. [DOI] [PMC free article] [PubMed] [Google Scholar]
- Powers SK & Jackson MJ (2008). Exercise‐induced oxidative stress: cellular mechanisms and impact on muscle force production. Physiol Rev 88, 1243–1276. [DOI] [PMC free article] [PubMed] [Google Scholar]
- Powers SK, Kavazis AN & Levine S (2009). Prolonged mechanical ventilation alters diaphragmatic structure and function. Crit Care Med 37, S347–S353. [DOI] [PMC free article] [PubMed] [Google Scholar]
- Powers SK, Kavazis AN & McClung JM (2007). Oxidative stress and disuse muscle atrophy. J Appl Physiol (1985) 102, 2389–2397. [DOI] [PubMed] [Google Scholar]
- Raue U, Oellerer S & Rospert S (2007). Association of protein biogenesis factors at the yeast ribosomal tunnel exit is affected by the translational status and nascent polypeptide sequence. J Biol Chem 282, 7809–7816. [DOI] [PubMed] [Google Scholar]
- Reich KA, Chen YW, Thompson PD, Hoffman EP & Clarkson PM (2010). Forty‐eight hours of unloading and 24 h of reloading lead to changes in global gene expression patterns related to ubiquitination and oxidative stress in humans. J Appl Physiol (1985) 109, 1404–1415. [DOI] [PMC free article] [PubMed] [Google Scholar]
- Rennie MJ, Selby A, Atherton P, Smith K, Kumar V, Glover EL & Philips SM (2010). Facts, noise and wishful thinking: muscle protein turnover in aging and human disuse atrophy. Scand J Med Sci Sports 20, 5–9. [DOI] [PubMed] [Google Scholar]
- Rennie MJ & Tipton KD (2000). Protein and amino acid metabolism during and after exercise and the effects of nutrition. Annu Rev Nutr 20, 457–483. [DOI] [PubMed] [Google Scholar]
- Riley DA, Bain JL, Thompson JL, Fitts RH, Widrick JJ, Trappe SW, Trappe TA & Costill DL (2000). Decreased thin filament density and length in human atrophic soleus muscle fibers after spaceflight. J Appl Physiol (1985) 88, 567–572. [DOI] [PubMed] [Google Scholar]
- Riley DA, Bain JL, Thompson JL, Fitts RH, Widrick JJ, Trappe SW, Trappe TA & Costill DL (2002). Thin filament diversity and physiological properties of fast and slow fiber types in astronaut leg muscles. J Appl Physiol 92, 817–825. [DOI] [PubMed] [Google Scholar]
- Ringholm S, Bienso RS, Kiilerich K, Guadalupe‐Grau A, Aachmann‐Andersen NJ, Saltin B, Plomgaard P, Lundby C, Wojtaszewski JF, Calbet JA & Pilegaard H (2011). Bed rest reduces metabolic protein content and abolishes exercise‐induced mRNA responses in human skeletal muscle. Am J Physiol Endocrinol Metab 301, E649–E658. [DOI] [PubMed] [Google Scholar]
- Romanello V, Guadagnin E, Gomes L, Roder I, Sandri C, Petersen Y, Milan G, Masiero E, Del Piccolo P, Foretz M, Scorrano L, Rudolf R & Sandri M (2010). Mitochondrial fission and remodelling contributes to muscle atrophy. EMBO J 29, 1774–1785. [DOI] [PMC free article] [PubMed] [Google Scholar]
- Rommel C, Bodine SC, Clarke BA, Rossman R, Nunez L, Stitt TN, Yancopoulos GD & Glass DJ (2001). Mediation of IGF‐1‐induced skeletal myotube hypertrophy by PI(3)K/Akt/mTOR and PI(3)K/Akt/GSK3 pathways. Nat Cell Biol 3, 1009–1013. [DOI] [PubMed] [Google Scholar]
- Sacheck JM, Hyatt JP, Raffaello A, Jagoe RT, Roy RR, Edgerton VR, Lecker SH & Goldberg AL (2007). Rapid disuse and denervation atrophy involve transcriptional changes similar to those of muscle wasting during systemic diseases. FASEB J 21, 140–155. [DOI] [PubMed] [Google Scholar]
- Sakuma K, Watanabe K, Hotta N, Koike T, Ishida K, Katayama K & Akima H (2009). The adaptive responses in several mediators linked with hypertrophy and atrophy of skeletal muscle after lower limb unloading in humans. Acta Physiol (Oxf) 197, 151–159. [DOI] [PubMed] [Google Scholar]
- Sandri M (2008). Signaling in muscle atrophy and hypertrophy. Physiology (Bethesda) 23, 160–170. [DOI] [PubMed] [Google Scholar]
- Sandri M (2010). Autophagy in health and disease. 3. Involvement of autophagy in muscle atrophy. Am J Physiol Cell Physiol 298, C1291–C1297. [DOI] [PubMed] [Google Scholar]
- Sandri M, Lin J, Handschin C, Yang W, Arany ZP, Lecker SH, Goldberg AL & Spiegelman BM (2006). PGC‐1alpha protects skeletal muscle from atrophy by suppressing FoxO3 action and atrophy‐specific gene transcription. Proc Natl Acad Sci USA 103, 16260–16265. [DOI] [PMC free article] [PubMed] [Google Scholar]
- Sandri M, Sandri C, Gilbert A, Skurk C, Calabria E, Picard A, Walsh K, Schiaffino S, Lecker SH & Goldberg AL (2004). Foxo transcription factors induce the atrophy‐related ubiquitin ligase atrogin‐1 and cause skeletal muscle atrophy. Cell 117, 399–412. [DOI] [PMC free article] [PubMed] [Google Scholar]
- Schulze K, Gallagher P & Trappe S (2002). Resistance training preserves skeletal muscle function during unloading in humans. Med Sci Sports Exerc 34, 303–313. [DOI] [PubMed] [Google Scholar]
- Shevchenko A, Wilm M, Vorm O & Mann M (1996). Mass spectrometric sequencing of proteins silver‐stained polyacrylamide gels. Anal Chem 68, 850–858. [DOI] [PubMed] [Google Scholar]
- Shoepe TC, Stelzer JE, Garner DP & Widrick JJ (2003). Functional adaptability of muscle fibers to long‐term resistance exercise. Med Sci Sports Exerc 35, 944–951. [DOI] [PubMed] [Google Scholar]
- Suetta C, Hvid LG, Justesen L, Christensen U, Neergaard K, Simonsen L, Ortenblad N, Magnusson SP, Kjaer M & Aagaard P (2009). Effects of aging on human skeletal muscle after immobilization and retraining. J Appl Physiol 107, 1172–1180. [DOI] [PubMed] [Google Scholar]
- Thompson TG, Chan YM, Hack AA, Brosius M, Rajala M, Lidov HG, McNally EM, Watkins S & Kunkel LM (2000). Filamin 2 (FLN2): a muscle‐specific sarcoglycan interacting protein. J Cell Biol 148, 115–126. [DOI] [PMC free article] [PubMed] [Google Scholar]
- Trappe S, Costill D & Thomas R (2000). Effect of swim taper on whole muscle and single muscle fiber contractile properties. Med Sci Sports Exerc 32, 48–56. [PubMed] [Google Scholar]
- Trappe S, Trappe T, Gallagher P, Harber M, Alkner B & Tesch P (2004). Human single muscle fibre function with 84 day bed‐rest and resistance exercise. J Physiol 557, 501–513. [DOI] [PMC free article] [PubMed] [Google Scholar]
- Trappe T (2009). Influence of aging and long‐term unloading on the structure and function of human skeletal muscle. Appl Physiol Nutr Metab 34, 459–464. [DOI] [PMC free article] [PubMed] [Google Scholar]
- Urso ML, Chen YW, Scrimgeour AG, Lee PC, Lee KF & Clarkson PM (2007). Alterations in mRNA expression and protein products following spinal cord injury in humans. J Physiol 579, 877–892. [DOI] [PMC free article] [PubMed] [Google Scholar]
- van der Ven PF, Obermann WM, Lemke B, Gautel M, Weber K & Furst DO (2000). Characterization of muscle filamin isoforms suggests a possible role of gamma‐filamin/ABP‐L in sarcomeric Z‐disc formation. Cell Motil Cytoskeleton 45, 149–162. [DOI] [PubMed] [Google Scholar]
- van Deursen J, Heerschap A, Oerlemans F, Ruitenbeek W, Jap P, ter Laak H & Wieringa B (1993). Skeletal muscles of mice deficient in muscle creatine kinase lack burst activity. Cell 74, 621–631. [DOI] [PubMed] [Google Scholar]
- Walker‐Simmons M & Atkinson DE (1977). Functional capacities and the adenylate energy charge in Escherichia coli under conditions of nutritional stress. J Bacteriol 130, 676–683. [DOI] [PMC free article] [PubMed] [Google Scholar]
- Wallimann T, Wyss M, Brdiczka D, Nicolay K & Eppenberger HM (1992). Intracellular compartmentation, structure and function of creatine kinase isoenzymes in tissues with high and fluctuating energy demands: the ‘phosphocreatine circuit’ for cellular energy homeostasis. Biochem J 281, 21–40. [DOI] [PMC free article] [PubMed] [Google Scholar]
- Widrick JJ, Knuth ST, Norenberg KM, Romatowski JG, Bain JL, Riley DA, Karhanek M, Trappe SW, Trappe TA, Costill DL & Fitts RH (1999. a). Effect of a 17 day spaceflight on contractile properties of human soleus muscle fibres. J Physiol (Lond) 516, 915–930. [DOI] [PMC free article] [PubMed] [Google Scholar]
- Widrick JJ, Knuth ST, Norenberg KM, Romatowski JG, Bain JL, Riley DA, Karhanek M, Trappe SW, Trappe TA, Costill DL & Fitts RH (1999. b). Effect of a 17 day spaceflight on contractile properties of human soleus muscle fibres. J Physiol 516 ( Pt 3 ), 915–930. [DOI] [PMC free article] [PubMed] [Google Scholar]
- Widrick JJ, Romatowski JG, Bain JL, Trappe SW, Trappe TA, Thompson JL, Costill DL, Riley DA & Fitts RH (1997). Effect of 17 days of bed rest on peak isometric force and unloaded shortening velocity of human soleus fibers. Am J Physiol Cell Physiol 273, C1690–C1699. [DOI] [PubMed] [Google Scholar]
- Widrick JJ, Romatowski JG, Norenberg KM, Knuth ST, Bain JL, Riley DA, Trappe SW, Trappe TA, Costill DL & Fitts RH (2001). Functional properties of slow and fast gastrocnemius muscle fibers after a 17‐day spaceflight. J Appl Physiol 90, 2203–2211. [DOI] [PubMed] [Google Scholar]
- Widrick JJ, Stelzer JE, Shoepe TC & Garner DP (2002. a). Functional properties of human muscle fibers after short‐term resistance exercise training. Am J Physiol 283, R408–R416. [DOI] [PubMed] [Google Scholar]
- Widrick JJ, Trappe SW, Romatowski JG, Riley DA, Costill DL & Fitts RH (2002. b). Unilateral lower limb suspension does not mimic bed rest or spaceflight effects on human muscle fiber function. J Appl Physiol 93, 354–360. [DOI] [PubMed] [Google Scholar]
- Yang Y, Jemiolo B & Trappe S (2006). Proteolytic mRNA expression in response to acute resistance exercise in human single skeletal muscle fibers. J Appl Physiol (1985) 101, 1442–1450. [DOI] [PubMed] [Google Scholar]