

Two transcription factors interact and negatively regulate the plant response to prolonged iron deficiency.
Abstract
Plants grown under iron (Fe)-deficient conditions induce a set of genes that enhance the efficiency of Fe uptake by the roots. In Arabidopsis (Arabidopsis thaliana), the central regulator of this response is the basic helix-loop-helix transcription factor FER-LIKE IRON DEFICIENCY-INDUCED TRANSCRIPTION FACTOR (FIT). FIT activity is regulated by protein-protein interactions, which also serve to integrate external signals that stimulate and possibly inhibit Fe uptake. In the search of signaling components regulating FIT function, we identified ZINC FINGER OF ARABIDOPSIS THALIANA12 (ZAT12), an abiotic stress-induced transcription factor. ZAT12 interacted with FIT, dependent on the presence of the ethylene-responsive element-binding factor-associated amphiphilic repression motif. ZAT12 protein was found expressed in the root early differentiation zone, where its abundance was modulated in a root layer-specific manner. In the absence of ZAT12, FIT expression was upregulated, suggesting a negative effect of ZAT12 on Fe uptake. Consistently, zat12 loss-of-function mutants had higher Fe content than the wild type at sufficient Fe. We found that under Fe deficiency, hydrogen peroxide (H2O2) levels were enhanced in a FIT-dependent manner. FIT protein, in turn, was stabilized by H2O2 but only in the presence of ZAT12, showing that H2O2 serves as a signal for Fe deficiency responses. We propose that oxidative stress-induced ZAT12 functions as a negative regulator of Fe acquisition. A model where H2O2 mediates the negative regulation of plant responses to prolonged stress might be applicable to a variety of stress conditions.
Iron (Fe) is one of the most abundant elements on Earth. However, the availability of Fe to plants, and thus indirectly to both animals and humans, is low due to the presence of Fe in the form of insoluble complexes in the soil. Fe deficiency anemia is the most common and widespread nutritional disorder in the world, which affects millions of people, especially pregnant women and preschool children (Murgia et al., 2012). The mechanisms for the regulation of Fe mobilization in the soil, for entry, and for distribution of Fe in the plant are promising targets for the breeding of Fe-biofortified crops, which is a strategy of high potential for counteracting Fe deficiency in humans. Arabidopsis (Arabidopsis thaliana) serves as a model plant to dissect Fe signaling at the molecular level, and transcription factors have become known as important checkpoints of the regulatory mechanisms controlling Fe homeostasis (Brumbarova et al., 2015).
Dicotyledonous plants like Arabidopsis and nongraminaceous monocots acquire reduced Fe (known as reduction-based strategy I). They acidify the rhizosphere and reduce ferric to ferrous Fe, which are physiological reactions easily made visible at the surface of Fe-deficient roots (Römheld and Marschner, 1986). Fe signaling, originating from the requirement for Fe and the Fe-deficiency status, directs the induction of several clusters of coexpressed genes in roots and leaves. These genes serve to adapt the cells to the consequences of altered external and internal metal availability (Ivanov et al., 2012a). A network of transcription factors, mainly of the basic helix-loop-helix (bHLH) type, and other types of regulators that are responsive to Fe modulate gene expression of the coexpression clusters (Ivanov et al., 2012a).
The FER-LIKE IRON DEFICIENCY-INDUCED TRANSCRIPTION FACTOR (FIT) plays a central role in up-regulating the cluster of root-expressed genes involved in Fe acquisition (Bauer et al., 2004; Colangelo and Guerinot, 2004; Jakoby et al., 2004; Yuan et al., 2005; Ivanov et al., 2012a). Among the FIT targets are the genes encoding FERRIC REDUCTASE-OXIDASE2 (FRO2) and the divalent metal ion transporter IRON-REGULATED TRANSPORTER1 (IRT1), which are required for Fe reduction and the uptake of ferric Fe from the soil (Robinson et al., 1999; Vert et al., 2002; Bauer et al., 2004). Indeed, a fit knockout mutant fails to take up Fe and, consequently, develops a lethal Fe deficiency leaf chlorosis (Bauer et al., 2004; Colangelo and Guerinot, 2004; Jakoby et al., 2004; Yuan et al., 2005). FIT is also a central hub for the input of multiple signaling pathways. FIT action is up-regulated by Fe deficiency (Colangelo and Guerinot, 2004; Jakoby et al., 2004) in response to ethylene (García et al., 2010, 2011; Lingam et al., 2011) and nitric oxide (NO; Chen et al., 2010; Meiser et al., 2011) and is down-regulated by cytokinins (Séguéla et al., 2008) and jasmonic acid (Maurer et al., 2011; for review, see Brumbarova et al., 2015). The cross-link between FIT and diverse signaling pathways allows the plants to modulate Fe nutrition in adaptation to changing growth conditions.
External and internal signals can interfere with FIT regulation at different levels. The FIT gene transcription is elicited by Fe deficiency as part of an autoregulatory loop requiring the FIT protein itself (Wang et al., 2007) and is also modulated by ethylene and NO signaling (García et al., 2010; Lingam et al., 2011; Meiser et al., 2011). Furthermore, ethylene and NO control the levels and stability of the FIT protein (Lingam et al., 2011; Meiser et al., 2011). Since the protein levels of FIT do not correlate with the activity in terms of Fe uptake response activation, we suggested previously that active and inactive pools of FIT exist in the cell, allowing the modulation of Fe uptake strength (Lingam et al., 2011; Meiser et al., 2011). The control of FIT transcription factor activity via protein-protein interactions is a third point of the interference of signaling pathways. Indeed, subgroup Ib (2) bHLH transcription factors, namely bHLH038, bHLH039, bHLH100, and bHLH101, which are all up-regulated by Fe deficiency, interact physically with FIT and promote the induction of downstream targets (Yuan et al., 2008; Wang et al., 2013). In addition, ETHYLENE-INDUCED3 (EIN3) and EIN3-LIKE1 (EIL1) directly interact with FIT and stimulate the responses (Lingam et al., 2011). The FIT-EIN3/EIL1 complex also interacts with the Mediator subunits MED16 and MED25, which promotes the recruitment of RNA polymerase II (Yang et al., 2014; Zhang et al., 2014). The active and inactive FIT pools may arise from differential protein-protein interactions of FIT.
FIT can also be suspected to be the hub for negative regulators. Fe acquisition is down-regulated under conditions of sufficient and excessive Fe supply in order to prevent the detrimental effects of excess free Fe in the cell (Vert et al., 2003; Ivanov et al., 2014). Through its participation in the Fenton chemistry (Fenton, 1894; Winterbourn, 1995), this free excess Fe leads to the generation of reactive oxygen species (ROS), which in turn cause cellular damage. Interestingly, increased production of ROS is part of the signaling for many abiotic stresses, such as drought, salinity, temperature stress, and nutrient deprivation (Mittler, 2002; Mittler and Blumwald, 2015), and in the regulation of processes during plant growth and development (Foreman et al., 2003; Apel and Hirt, 2004; Pitzschke et al., 2006; Tsukagoshi et al., 2010). The role of ROS in Fe response regulation has not been well defined, and it may play multiple roles. Hydrogen peroxide (H2O2) is involved in the regulation of ferritins in response to excess Fe to alleviate the oxidative stress in leaves (Ravet et al., 2009; Briat et al., 2010), flowers (Sudre et al., 2013), and roots (Ravet et al., 2012; Reyt et al., 2015). ROS production has also been shown under Fe deficiency in sunflower (Helianthus annuus) and maize (Zea mays; Ranieri et al., 2001; Sun et al., 2007). ROS could also be linked with Fe deficiency regulation, since they have been found in connection with NO and ethylene in abiotic stress signaling (Brumbarova et al., 2015; Xia et al., 2015).
ZINC FINGER OF ARABIDOPSIS THALIANA12 (ZAT12) is a member of the C2H2-type plant-specific zinc (Zn) finger transcription factor family, subclass C1-2i, containing at least 20 members in Arabidopsis (Englbrecht et al., 2004; Ciftci-Yilmaz and Mittler, 2008; Miller et al., 2008; Kiełbowicz-Matuk, 2012). ZAT12 induction is an abiotic stress marker. The expression of ZAT12 is induced by light (Iida et al., 2000; Davletova et al., 2005b), low temperature (Fowler and Thomashow, 2002; Kreps et al., 2002; Vogel et al., 2005), wounding (Cheong et al., 2002), osmotic and salinity stress (Kreps et al., 2002), and oxidative stress (Rizhsky et al., 2004; Davletova et al., 2005b; Vanderauwera et al., 2005). A connection between ZAT12 and the oxidative stress response was illustrated by the requirement of ZAT12 for the up-regulation of the ROS signal transduction genes APX1, ZAT7, and WRKY25 (Davletova et al., 2005a; Miller et al., 2008). zat12 loss-of-function plants exhibited higher sensitivity to light, H2O2, salinity, osmotic, and heat stress, whereas overexpression of ZAT12 conferred tolerance to high-light, oxidative, osmotic, and cold stress (Rizhsky et al., 2004; Davletova et al., 2005b; Vogel et al., 2005). ZAT12 was identified as a direct target of EIN3, and ZAT12 transcript levels were up-regulated in EIN3ox (Peng et al., 2014).
The role of ZAT proteins in the abiotic stress signaling network is not quite elucidated. ZAT proteins contain an ethylene-responsive element-binding factor-associated amphiphilic repression (EAR) motif with a general consensus sequence of L/FDLNL/F(x)P, and ZAT12 contains an LxLxL-type EAR motif (Kagale and Rozwadowski, 2011). The C-terminal EAR motif of ZAT proteins was shown to confer repressor functions during defense and stress responses (Sakamoto et al., 2000; Ohta et al., 2001; Ciftci-Yilmaz et al., 2007; Kagale et al., 2010). Some types of EAR motif proteins interact through their N terminus with transcription factors and confer repressor activity through the recruitment of epigenetic silencing complexes via the C-terminal EAR motif to the target sites of these transcription factors (Tao et al., 2013). In the case of ZAT proteins, this type of repressor mechanism has not been shown, and for ZAT7, the EAR motif was required for protein-protein interaction with the WRKY70 transcription factor (Ciftci-Yilmaz et al., 2007).
In this work, we report the identification of ZAT12 as a new protein-protein interaction partner of FIT, requiring the EAR motif at the ZAT12 C-terminal site. We show that ZAT12 is a negative regulator of FIT function and Fe uptake under sufficient Fe supply and after prolonged Fe deficiency. Furthermore, we demonstrate that oxidative stress signals are generated upon Fe deficiency in a FIT-dependent manner and that H2O2 may serve as a signal for the regulation of FIT and ZAT12 transcript and protein abundance.
RESULTS
Identification of ZAT12 as a Direct Protein-Protein Interaction Partner of FIT
FIT activity is modulated by protein-protein interactions that FIT undergoes (Yuan et al., 2008; Lingam et al., 2011; Meiser et al., 2011; Wang et al., 2013). In order to identify novel factors responsible for the posttranscriptional regulation of FIT, we previously performed a yeast (Saccharomyces cerevisiae) two-hybrid assay where we were able to identify EIL1 and 13 other putative FIT interaction partners (Lingam et al., 2011).
One of the other putative interaction partners of FIT was ZAT12 (At5g59820), a Zn finger transcription factor responsive to reactive oxygen and abiotic stress signaling (Davletova et al., 2005b). The complementary DNA fragment obtained in the yeast two-hybrid screen represented the last 147 bp of the 489-bp ZAT12 coding sequence, covering the C-terminal part of the protein after the second Zn finger domain and containing the EAR motif characteristic for ZAT proteins (Fig. 1A).
Figure 1.

ZAT12 interaction with FIT and requirement of the EAR motif. A, Schematic representation of the ZAT12 amino acid sequence. The regions encoding the two Zn fingers, the EAR motif with five amino acids removed in the deletion studies, and the ZAT12 fragment of 48 amino acids identified in the yeast two-hybrid screen are indicated. B, Targeted yeast two-hybrid interaction assay for FIT-C and ZAT12 protein interaction. Ten-fold dilutions series (A600 of 1−1–10−4) of the yeast AH109 strain, harboring a combination of a DNA-binding domain (BD) vector and an activation domain (AD) vector, were spotted on synthetic defined (SD) selection medium without Leu and Trp (-LW; selection for positive cotransformants) or without Leu, Trp, and His (-LWH) with added 0.5 or 2.5 mm 3-amino-1,2,4-triazole (3-AT; selection for interaction) and incubated for 5 to 8 d at 30°C. The combination of BD-SNX1 and AD-SNX1 was used as a positive control. BD-FIT-C and AD-ZAT12 or AD-ZAT12ΔEAR were assayed for interaction. Their combinations with the respective empty vectors were used as negative controls. The positive interaction between BD-FIT-C and AD-ZAT12 is indicated by the arrow. C to N, rBiFC analysis on N. benthamiana leaf epidermis cells transiently transformed with nYFP-ZAT12 and cYFP-FIT (C–E), nYFP-ZAT12ΔEAR and cYFP-FIT (F–H), nYFP and cYFP-FIT (I–K), and nYFP-ZAT12 and cYFP-bHLH039 (L–N). Positive YFP signals indicative of a protein-protein interaction were detected in the nuclei of the nYFP-ZAT12 and cYFP-FIT combination but not in the combinations nYFP-ZAT12ΔEAR and cYFP-FIT or nYFP-ZAT12 and cYFP-bHLH039, or in the empty vector control nYFP and cYFP-FIT. The mRFP signal was present in the nuclei and in the cytoplasm of all transformed cells. C, F, I, and L show YFP fluorescence; D, G, J, and M show mRFP fluorescence; and E, H, K, and N show merged YFP, mRFP, and bright-field images. Bars = 50 µm.
In order to reconfirm the interaction between FIT-C and ZAT12 found in the yeast screen, we performed a targeted yeast two-hybrid assay with full-length ZAT12 fused to the activation domain (AD), named AD-ZAT12, and FIT-C fused to the DNA-binding domain (BD), named BD-FIT-C. FIT-C was utilized instead of the full-length FIT protein because it did not cause self-activation, as shown previously (Lingam et al., 2011). When comparing with positive (BD-SNX1 and AD-SNX1; Pourcher et al., 2010) and negative (BD-FIT-C and an empty AD vector as well as an empty BD vector with AD-ZAT12) controls, we could confirm the protein interaction between FIT-C and ZAT12 in yeast (Fig. 1B).
We asked whether the EAR motif contained in ZAT12 was important for the interaction with FIT, as was already shown to be the case for the interaction between ZAT7 and WRKY70 (Ciftci-Yilmaz et al., 2007). For this purpose, we created an AD fusion of a full-length ZAT12 devoid of five amino acids comprising the core of the EAR motif (named AD-ZAT12ΔEAR). In contrast to the full-length ZAT12, ZAT12ΔEAR did not interact with FIT-C in the targeted interaction assay (Fig. 1B).
It then became important to analyze whether an interaction between full-length ZAT12 and full-length FIT would take place in plant cells, where in the cell this interaction would occur, and whether again the EAR motif would be involved. We performed in planta ratiometric bimolecular fluorescence complementation (rBiFC) analysis (Grefen and Blatt, 2012). Following transient transformation of Nicotiana benthamiana leaves, yellow fluorescent protein (YFP) fluorescence signal was detected in the nuclei of leaves expressing nYFP-ZAT12 and cYFP-FIT (Fig. 1, C–E) but not in leaves expressing nYFP-ZAT12ΔEAR and cYFP-FIT (Fig. 1, F–H) or in the negative control nYFP and cYFP-FIT (Fig. 1, I–K). nYFP-ZAT12 was not able to interact with cYFP-bHLH039 (Fig. 1, L–N), showing that the interaction of ZAT12 with FIT is specific. In all of these cases, we were able to detect the monomeric red fluorescent protein (mRFP) that was coexpressed and served as an internal marker for transformation and as an expression control. The mRFP signal was present in the nuclei and in the cytoplasm of all transformed cells, as reported previously (Grefen and Blatt, 2012). Taken together, we have shown here that ZAT12 and FIT could interact physically inside the nucleus of plant cells and that the EAR motif of ZAT12 was required for this interaction.
Inverse ZAT12 and FIT Gene Expression during Prolonged Fe Deficiency
A prerequirement for the interaction of ZAT12 with FIT is that ZAT12 and FIT gene expression share a window of overlap. At first, we investigated whether the ZAT12 gene showed any regulation by Fe supply in wild-type seedlings between 5 and 10 d of growth. We included H2O2 treatment in the presence and absence of Fe, since it was known that ZAT12 was responsive to H2O2 and since we wanted to test whether ZAT12 responsiveness to H2O2 was Fe dependent. The H2O2 treatment consisted of a 1-h treatment of plants with 20 mm H2O2, an experimental condition used previously in several studies to address the effects of H2O2 on gene regulation (Rentel and Knight, 2004; Davletova et al., 2005b). We found that ZAT12 gene expression remained at a similar level in the presence and absence of Fe during the first 8 d of seedling development (Fig. 2A). On day 10 of seedling development, ZAT12 gene expression was increased in response to Fe deficiency versus Fe sufficiency, and it was further increased in the presence of H2O2 compared with untreated controls (Fig. 2A). This experiment confirmed the inducibility of ZAT12 by H2O2 (Rizhsky et al., 2004; Davletova et al., 2005b) and, importantly, it indicated that ZAT12 was also responsive to Fe deficiency, whereby ZAT12 may have a late effect under prolonged Fe deficiency.
Figure 2.

Time-course gene expression analysis of ZAT12 and FIT in wild-type (WT) plants. Gene expression analysis of ZAT12 (A) and FIT (B) was performed on 5-, 7-, 8-, and 10-d-old seedlings grown on Fe-sufficient (+Fe) or Fe-deficient (−Fe) medium with 20 mm H2O2 or water control treatment for 1 h. Error bars represent sd of three biological replicates.
Next, we wondered whether FIT, which is inducible by Fe deficiency already at an early stage (Lingam et al., 2011), also showed a specific expression pattern at the late stage of Fe deficiency and in the presence of H2O2. Surprisingly, the FIT expression pattern was rather contrary to that of ZAT12. Upon Fe deficiency, FIT was induced as expected during the first 8 d but then became down-regulated at day 10 (Fig. 2B). Furthermore, H2O2 treatment prevented the induction of FIT in response to Fe deficiency (Fig. 2B). From the inverse relationship of FIT and ZAT12, we deduced that ZAT12 may be a repressor of FIT function upon prolonged Fe deficiency at day 10 and that H2O2 might be a signal for that.
Effects of MG132 and H2O2 on ZAT12 Protein Abundance and Tissue-Specific Regulation
Next, we investigated whether ZAT12 protein was available in Fe-deficient seedlings for interacting with FIT protein and regulating FIT expression. For this purpose, we generated a ZAT12-GFP Arabidopsis line in which ZAT12-GFP was regulated by the ZAT12 promoter (hereafter referred to as ProZAT12:ZAT12-GFP). When using immunoblot analysis with anti-GFP antibody, we detected a single specific ZAT12-GFP band with the expected molecular mass of 48 kD in transiently transformed N. benthamiana cells (Supplemental Fig. S1A) and stably transformed transgenic ProZAT12:ZAT12-GFP Arabidopsis seedlings (Supplemental Fig. S1B).
We found that in 10-d-old ProZAT12:ZAT12-GFP seedlings, ZAT12-GFP protein abundance was increased by Fe deficiency versus Fe sufficiency. H2O2 application led to increases in ZAT12-GFP levels under both Fe-sufficient and Fe-deficient conditions (Fig. 3, A and B). Thus, H2O2 functions as a signaling molecule, which regulates not only the gene expression of ZAT12 but also the ZAT12 protein.
Figure 3.

ZAT12 protein abundance and regulation. A and B, Anti-GFP immunoblot analysis of ZAT12-GFP in 10-d-old ProZAT12:ZAT12-GFP seedlings grown on Fe-sufficient (+Fe) or Fe-deficient (−Fe) medium. For the H2O2 treatment, seedlings were incubated with 20 mm H2O2 (+) or water (−) for 1 h prior to harvesting for analysis. The arrowhead indicates the position of ZAT12-GFP (48 kD). Wild-type (WT) seedlings were used as a negative control. Ponceau S staining of the membrane was used as a loading control. C to F, Anti-GFP immunoblot analysis of ZAT12-GFP and ZAT12ΔEAR-GFP protein abundance in ProZAT12:ZAT12-GFP and ProZAT12:ZAT12ΔEAR-GFP seedlings grown for 10 d on sufficient (C and D) and deficient (E and F) Fe supply. For the H2O2 treatment, seedlings were incubated with 20 mm H2O2 (+) or water (−) for 1 h prior to harvesting for analysis. For the MG132 treatment, seedlings were incubated with 100 µm MG132 (+) or mock treated (−) for 4 h prior to harvesting for analysis. Arrowheads indicate the positions of the bands corresponding to ZAT12-GFP (48 kD) and ZAT12ΔEAR-GFP (47 kD). Wild-type seedlings were used as a negative control. Ponceau S staining of the membrane was used as a loading control. B, D, and F show quantification of A, C, and E, respectively, based on three independent experiments. Bars represent normalized protein abundance. Error bars represent sd. Different letters indicate statistically significant differences (P < 0.05).
Since proteasomal degradation is crucial for the regulation of FIT (Lingam et al., 2011; Meiser et al., 2011; Sivitz et al., 2011) and many other transcriptional regulators, we examined whether the proteasome might also be involved in the control of ZAT12 protein abundance. We repeated the above experiment and performed treatments with the proteasome inhibitor MG132. To examine whether the EAR motif of ZAT12 was relevant for protein regulation, we generated and included a line expressing ZAT12ΔEAR-GFP (hereafter named ProZAT12:ZAT12ΔEAR-GFP). The ZAT12ΔEAR-GFP protein was also detectable by immunoblot as a single specific protein of the correct size in transgenic plant cells (Supplemental Fig. S1, C and D). We found that ZAT12-GFP signal intensities were increased 2- and 6-fold upon treatment with MG132 compared with the respective untreated controls under both sufficient and deficient Fe supply (Fig. 3, C–F). Application of H2O2 led to 2- and 9-fold increased levels of the fusion protein under both Fe supply conditions, similar to MG132 treatment (Fig. 3, C–F). The positive effects of the two single treatments on the abundance of ZAT12-GFP were additive in the combined treatment, resulting in 7- and 15-fold increases at sufficient and deficient Fe supply in comparison with the untreated controls (Fig. 3, C–F). This suggests that ZAT12 protein abundance is regulated by at least two independent pathways, one proteasome mediated and one H2O2 sensitive that does not rely on the proteasome.
Interestingly, the abundance of the ZAT12ΔEAR-GFP protein was lower compared with ZAT12-GFP in five out of these eight experimental conditions, while it was higher in one case (Fig. 3, C–E). ZAT12ΔEAR-GFP increased 7- and 3-fold after MG132 application and 23- and 7-fold after H2O2 application, relative to the untreated controls under sufficient and deficient Fe supply (Fig. 3, C–F). Thus, unlike ZAT12-GFP, ZAT12ΔEAR-GFP protein abundance was enhanced to a greater extent by H2O2 treatment. The effect of the combined treatment with MG132 and H2O2 was also different from the one observed for ZAT12-GFP. It led to just 13- and 5-fold increases of ZAT12ΔEAR-GFP abundance compared with the untreated controls under sufficient and deficient Fe supply (Fig. 3, C–F). Therefore, ZAT12ΔEAR-GFP signal increases were intermediate when compared with the single treatments, contrary to the additive increase observed for ZAT12-GFP signal intensities under both Fe supply conditions. These results show that the EAR motif is important for ZAT12 protein abundance. In the presence of MG132, the ZAT12ΔEAR protein was found at lower levels than ZAT12-GFP upon Fe supply and Fe deficiency, suggesting that the EAR motif was needed for the stabilization upon proteasomal blocking and, hence, that an additional factor may interact with the EAR motif.
Taken together, ZAT12 protein is present in Fe-deficient and Fe-sufficient seedlings. ZAT12 protein abundance is controlled through the EAR motif by proteasomal degradation and H2O2.
Next, we investigated the presence and stability of ZAT12 at the tissue level in the root. We were specifically interested in whether ZAT12 was localized in the root epidermis of the root zone, where Fe uptake takes place and FIT is expressed (for review, see Ivanov et al., 2012a). ZAT12-GFP and ZAT12ΔEAR-GFP showed nuclear localization (Supplemental Fig. S2), consistent with the above bimolecular fluorescence complementation (BiFC) signals for the ZAT12-FIT interaction in the nucleus (Fig. 1, C–E). Both ZAT12-GFP and ZAT12ΔEAR-GFP fluorescence signals were present in the root early differentiation (Supplemental Fig. S2, E–H) and elongation (Supplemental Fig. S2, I–L) zones but were not detected in the meristematic zone of the root (Supplemental Fig. S2, M–P). The similar localization pattern of the two fusion proteins at the subcellular and tissue levels suggested that the EAR motif had no effect on ZAT12 localization.
In order to verify that ZAT12 and FIT are expressed in the root epidermis of the same root zones so that physical interaction of the two proteins is possible, we compared the reporter activities of ProZAT12:ZAT12-GFP and ProFIT:GUS plants (Jakoby et al., 2004) that were raised in parallel under prolonged Fe deficiency (Supplemental Fig. S3). Both reporters were expressed in the epidermis cells of the early differentiation root zone (Supplemental Fig. S3, B and F), suggesting that ZAT12 and FIT are present together in the outer cell layer of the zone relevant for Fe acquisition under deficient Fe supply (Jakoby et al., 2004; Dinneny et al., 2008; Blum et al., 2014). A difference in reporter activity was seen in the meristematic and elongation zones in the root tips of 10-d-old seedlings, where the FIT promoter was hardly active compared with that of ZAT12 (Supplemental Fig. S3, C, D, and G–H). We treated the ProZAT12:ZAT12-GFP and ProZAT12:ZAT12ΔEAR-GFP plants with H2O2, MG132, or both in order to investigate their effects on ZAT12 abundance. For this analysis, observations were undertaken in the early differentiation zone. Untreated roots of ProZAT12:ZAT12-GFP plants had ZAT12-GFP signals with similar intensity in both epidermis and the central cylinder (Fig. 4, A–F; Supplemental Fig. S4, A and B). Treating the roots with H2O2 resulted in an increased signal intensity in the central cylinder, while the signals in the epidermis were weakly present, as in the control plants (Fig. 4, G–L; Supplemental Fig. S4, C and D). This effect could be observed under both Fe supply conditions (compare Fig. 4, G with A and J with D). MG132 application had the contrary effect, with enhanced GFP signal intensity in the epidermis but not in the central cylinder (Fig. 4, M–R; Supplemental Fig. S4, D and E). This suggests that ZAT12 was not proteasomally regulated in the central cylinder. MG132 can reach the central cylinder, as it was shown to affect the proteasome function in this part of the root (Weijers et al., 2006; Yadav et al., 2008). Combined MG132 and H2O2 treatment resulted in increased nuclear ZAT12-GFP fluorescence in both the epidermis and the central cylinder (Fig. 4, S–X; Supplemental Fig. S4, F and G). This is consistent with the additive effect of the single treatments on ZAT12 abundance already observed by immunoblot (Fig. 3, C–F). These results suggest that ZAT12 underwent degradation whereby its abundance likely depended on different factors in the different layers of the differentiation zone, namely on proteasomal degradation in the epidermis and proteasome-independent regulation by H2O2 in the central cylinder.
Figure 4.

Cellular ZAT12-GFP protein localization in the root. Confocal microscope images show the early differentiation zone of ProZAT12:ZAT12-GFP seedlings grown for 10 d under Fe-sufficient or Fe-deficient conditions, as indicated, and examined for ZAT12-GFP localization. For the H2O2 treatment, seedlings were incubated with 20 mm H2O2 for 1 h; for the MG132 treatment, seedlings were incubated with 100 µm MG132 for 4 h, prior to imaging. Mock-treated plants were used as a control. A, D, G, J, M, P, S, and V are GFP fluorescence images; C, F, I, L, O, R, U, and X are bright-field images (BF); B, E, H, K, N, Q, T, and W are merged GFP and bright-field images. Insets represent optical cross sections of the respective confocal images (for enlarged images, see Supplemental Fig. S3). Closed arrowheads show signal accumulation in the epidermis, and open arrowheads show signal accumulation in the central cylinder. Bars = 50 µm.
The pattern of ZAT12ΔEAR-GFP signals in the epidermis and central cylinder was comparable with that of ZAT12-GFP for the control (Fig. 5, A–F; Supplemental Fig. S4, H and I), for treatment with H2O2 (Fig. 5, G–L; Supplemental Fig. S4, J and K), and for MG132 treatment (Fig. 5, M–R; Supplemental Fig. S4, L and M). Interestingly, combined MG132 and H2O2 treatment led to a signal increase only in the central cylinder, as was the case with the single H2O2 treatment, rather than stabilizing the ZAT12ΔEAR-GFP protein throughout the epidermis and the central cylinder (Fig. 5, S–X; Supplemental Fig. S4, N and O). This result is consistent with the intermediate effect of the combined MG132 and H2O2 treatment on the protein abundance of ZAT12ΔEAR-GFP observed by immunoblot (Fig. 3, C–F).
Figure 5.

Cellular ZAT12ΔEAR-GFP protein localization in the root. Confocal microscope images show the early differentiation zone of ProZAT12:ZAT12ΔEAR-GFP seedlings grown for 10 d under Fe-sufficient or Fe-deficient conditions, as indicated, and examined for ZAT12ΔEAR-GFP localization. For the H2O2 treatment, seedlings were incubated with 20 mm H2O2 for 1 h; for the MG132 treatment, seedlings were incubated with 100 µm MG132 for 4 h, prior to imaging. Mock-treated plants were used as a control. A, D, G, J, M, P, S, and V are GFP fluorescence images; C, F, I, L, O, R, U, and X are bright-field images (BF); B, E, H, K, N, Q, T, and W are merged GFP and bright-field images. Insets represent optical cross sections of the respective confocal images (for enlarged images, see Supplemental Fig. S3). Closed arrowheads show signal accumulation in the epidermis, and open arrowheads show signal accumulation in the central cylinder. Bars = 50 µm.
Taken together, we could demonstrate that ZAT12 was present in the early differentiation zone of the root inside the epidermis and central cylinder, where FIT expression takes place (Jakoby et al., 2004). H2O2 affected the presence and abundance of ZAT12 in the central cylinder, independently of the proteasome. In the epidermis, on the other hand, ZAT12 abundance was controlled by the proteasome, which was differently modulated in the presence and absence of the EAR motif.
FIT Regulation in zat12 Mutants
FIT gene induction is part of an autoregulatory loop mediated by FIT upon Fe deficiency and promoted by activating protein interactions of FIT (Wang et al., 2007, 2013; Yuan et al., 2008). Since we had observed the opposite patterns of down-regulation of FIT and up-regulation of ZAT12 under prolonged Fe deficiency, we investigated whether ZAT12 was required for the down-regulation of FIT. Toward this end, we used homozygous zat12 loss-of-function mutant plants and examined FIT gene expression. In zat12-1 and zat12-2, characterized previously (Davletova et al., 2005b), FIT gene expression was about 3 times enhanced after 10 d of Fe deficiency compared with the wild type (Supplemental Fig. S5, A–C). In zat12-3, carrying a transfer DNA insertion farther upstream in the coding region with suspected strongest zat12 loss-of-function effect among the three alleles (Supplemental Fig. S5, A, D, and E), FIT expression was about 8-fold increased after 10 d of Fe deficiency (Supplemental Fig. S6A). A time-course experiment showed that FIT expression increased in zat12-3 from day 5 until day 10 of Fe deficiency, but not under sufficient Fe supply. Interestingly, H2O2 application abolished the induction of FIT in zat12-3 (Supplemental Fig. S6A). In the vice versa experiment, ZAT12 expression was up-regulated in fit-3 mutant plants, which were highly Fe deficient due to their inability to take up Fe (Jakoby et al., 2004), but only to half the extent as in the wild type (compare Supplemental Fig. S6B with Fig. 2A). In summary, the mutant phenotypes confirm a link between ZAT12 and FIT and support the idea that ZAT12 may act as a repressor of FIT transcript abundance.
Morphological and Physiological Analyses of zat12-3 Mutant Phenotypes in Response to Fe
The repressive effect of ZAT12 on FIT suggests that perhaps Fe uptake responses, which are regulated downstream of FIT, could be affected in the zat12-3 mutant.
At first, we investigated the growth behavior of 10-d-old seedlings. Wild-type and zat12-3 shoots were similar in appearance and exhibited leaf chlorosis upon Fe deficiency, but not Fe sufficiency (Supplemental Fig. S7, A and B). In contrast, fit-3 seedlings were Fe deficient upon sufficient and deficient Fe supply, as expected (Supplemental Fig. S7, A and B; Jakoby et al., 2004). The Fe-deficient wild-type, zat12-3, and fit-3 seedlings were rescued by the resupply of 1, 10, or 50 µm Fe, which showed that upon the 10-d Fe deficiency treatment, the plants were still viable and leaf Fe chlorosis was reversible by Fe supply (Supplemental Fig. S7C).
Fe-deficient wild-type and zat12-3 plants had significantly lower amounts of Fe in their shoots compared with the Fe-sufficient plants (Fig. 6A), showing that Fe deficiency treatment was effective in the two cases. Interestingly, zat12-3 plants grown upon Fe-sufficient conditions had a significantly 2-fold elevated Fe content compared with the wild type (Fig. 6A). This suggests that, in the presence of Fe, ZAT12 might repress Fe uptake responses in the wild type.
Figure 6.
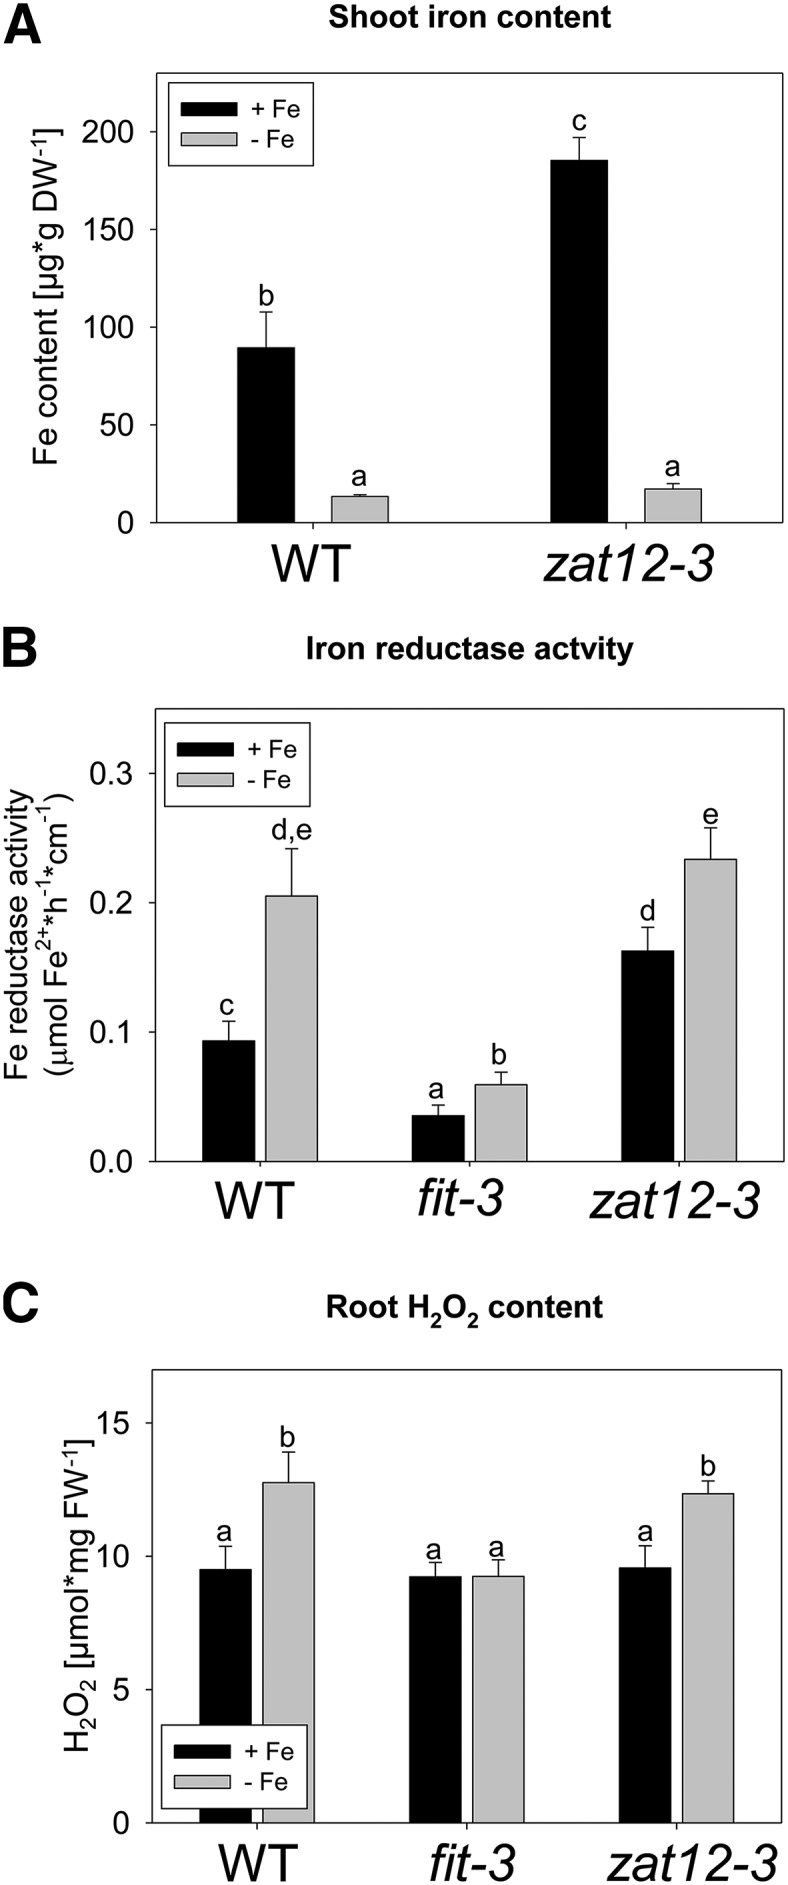
Morphological and physiological phenotypes of zat12-3 seedlings. A, Shoot Fe content. B, Root Fe reductase activity. C, Root H2O2 content. Seedlings of the indicated genotypes were grown for 10 d on Fe-sufficient (+Fe) or Fe-deficient (−Fe) medium. Error bars represent sd. Different letters indicate statistically significant differences (P < 0.05). DW, Dry weight; FW, fresh weight; WT, wild type.
FIT activates FRO2-mediated Fe reduction in the root, a response needed for Fe uptake. Therefore, we investigated whether root Fe reductase activity was altered in the zat12-3 mutant. The wild type and zat12-3 responded to Fe deficiency with an elevated Fe reductase activity (2- and 1.5-fold, respectively) compared with Fe sufficiency, while fit-3 mutant plants displayed only weak Fe reductase activity under both Fe supply conditions, as expected (Fig. 6B). zat12-3 mutant plants induced Fe reductase activity under Fe deficiency to the same level as the wild type. However, under sufficient Fe supply, the activity levels were almost 2-fold higher in zat12-3 compared with the wild type (Fig. 6B). The elevated Fe reductase activity in zat12-3 at sufficient Fe was in agreement with the increased Fe content described above.
The observation that the lack of functional ZAT12 had an impact on Fe uptake suggested that perhaps ZAT12 may play a role in the repression of Fe uptake under excess Fe supply. To test this possibility, wild-type, zat12-3, and fit-3 plants were grown under sufficient (50 µm Fe) and excess (200 µm Fe) Fe supply for 10 d (Supplemental Fig. S8). The root growth of zat12-3 plants was significantly impaired and lower by the excess Fe compared with the wild type (Supplemental Fig. S8, A and B). This observation is consistent with the significantly higher shoot Fe content of zat12-3 compared with wild-type plants under excess Fe (Supplemental Fig. S8C). There were no significant differences in Fe reductase activity between zat12-3 and the wild type under excess Fe (Supplemental Fig. S8D). Gene expression data showed that ZAT12 was significantly up-regulated by Fe excess in wild-type plants. On the other hand, the levels of the Fe deficiency-inducible FIT, IRT1, and BHLH039 transcripts were not increased in the zat12-3 mutant compared with the wild type under excess Fe (Supplemental Fig. S8, E–G) but were even decreased in the case of FIT and IRT1, probably as a consequence of the high Fe content of these plants. These data show that ZAT12 is critical for the adaptation to excess Fe levels but is probably not functioning through the repression of FIT.
ZAT12 is induced by H2O2, and enhanced H2O2 production has been reported previously to occur during different nutrient deprivation conditions such as the lack of potassium, nitrogen, and phosphorus (Shin et al., 2005). Fe deficiency has also been shown to trigger an enhanced H2O2 production and, hence, oxidative stress in sunflower and maize (Ranieri et al., 2001; Sun et al., 2007). In order to determine whether H2O2 was also produced under Fe deficiency in Arabidopsis, we measured H2O2 levels under sufficient and deficient Fe supply in 10-d-old wild-type, fit-3, and zat12-3 seedlings. H2O2 content in both wild-type and zat12-3 roots was significantly higher under Fe deprivation compared with the respective sufficient Fe supply condition, without showing a significant difference between the two genotypes (Fig. 6C). Therefore, even though the ZAT12 gene was induced by H2O2, its function was not required for the increased H2O2 production under Fe deficiency. Interestingly, the H2O2 content did not change in response to Fe deficiency in the fit-3 mutant (Fig. 6C), suggesting that FIT is involved in the Fe deficiency-induced H2O2 production.
The observed increase in H2O2 content in wild-type plants after a prolonged exposure to Fe deficiency led us to the question of whether this elevation was specific for day 10. We performed a time-course study of the root H2O2 content of wild-type, fit-3, and zat12-3 seedlings grown for 5 to 10 d on sufficient and deficient Fe supply. We observed in all tested genotypes under both Fe supply conditions that H2O2 levels increased from day 5 to day 7, then dropped at day 8, followed by a tendency for recovery at day 10 (Supplemental Fig. S9). The H2O2 content was similar in all genotypes at sufficient Fe supply (Supplemental Fig. S9A). Under Fe deficiency, the H2O2 levels were increased in the wild type and zat12-3 but remained at the level of Fe sufficiency in fit-3 (Supplemental Fig. S9B). It is interesting that the increased amount of H2O2 at day 7 in the wild type did not trigger the up-regulation of ZAT12 gene expression at this early stage (compare Supplemental Fig. S9B with Fig. 2A).
Taken together, we showed that physiological reactions of Fe mobilization and Fe uptake are negatively affected by ZAT12 upon Fe supply. ROS produced in roots in the presence of FIT can act as a signal during Fe deficiency and may eventually result in the induction of ZAT12 under prolonged exposure to Fe deficiency.
Expression of Fe Deficiency Response Genes in the zat12-3 Mutant
In the above sections, we have shown that FIT was up-regulated after 10 d of Fe deficiency in zat12-3 (Supplemental Fig. S6A; the 10-d samples are represented again as a control for ZAT12 and FIT in Figure 7, A and B). Therefore, we were interested in examining gene expression changes of Fe deficiency marker genes, namely BHLH039 and the FIT targets FRO2 and IRT1.
Figure 7.

Expression of Fe deficiency response genes. Gene expression analysis of ZAT12 (A), FIT (B), BHLH039 (C), FRO2 (D), and IRT1 (E) in wild-type (WT), zat12-3, and fit-3 seedlings is shown. Seedlings were grown for 10 d under sufficient (+Fe) or deficient (−Fe) Fe supply and then incubated with 20 mm H2O2 (+) or water (−) for 1 h prior to harvesting for analysis. Error bars represent sd. Different letters indicate statistically significant differences (P < 0.05).
A recent study using multiple mutant combinations showed that, among the four largely redundant subgroup Ib bHLH proteins, bHLH039 played the most significant role in Fe uptake regulation (Wang et al., 2013). Since BHLH039 gene induction by Fe deficiency takes place in the absence of FIT (Wang et al., 2007), we tested BHLH039 expression in response to different Fe and H2O2 supply conditions in wild-type, zat12-3, and fit-3 plants. BHLH039 expression was induced in the fit-3 mutant under Fe-sufficient conditions as reported previously (Wang et al., 2007), showing again that fit-3 seedlings were viable in this growth system. The levels of Fe deficiency-induced BHLH039 expression were comparable between the wild type and the fit-3 mutant but significantly lower in zat12-3 mutant plants, with just 7.5% of the wild-type levels (Fig. 7C). H2O2 treatment under Fe deficiency caused a tendency for additional induction of BHLH039 expression in all tested genotypes, with a statistically significant 2-fold increase observed only in fit-3 compared with the untreated mutant plants (Fig. 7C).
The expression of FRO2 and IRT1 was induced by Fe deficiency in both wild-type and zat12-3 mutant plants, but in zat12-3 to a level of only 89% of the respective wild-type level, consistent with the lower BHLH039 expression in zat12-3. At the same time, FRO2 was down-regulated 13- and 17-fold, and IRT1 was down-regulated 7- and 11-fold, by H2O2 treatment in wild-type and zat12-3 plants (Fig. 7, D and E), following the tendency of FIT down-regulation by H2O2. These results are in agreement with the fact that FRO2 and IRT1 expression depend on both FIT and bHLH039. The down-regulation of IRT1 gene expression in the zat12-3 mutant is consistent with the previously observed elevated IRT1 transcript abundance in ZAT12-overexpressing plants (Davletova et al., 2005b).
Taken together, H2O2 and ZAT12 affect the expression of the Fe deficiency marker genes FIT, BHLH039, FRO2, and IRT1.
Influence of ZAT12 and H2O2 on FIT Protein Abundance
The above discrepancies between the gene expression levels of FIT, BHLH039, and the downstream targets FRO2 and IRT1 in response to the presence of ZAT12 and H2O2 suggest that protein regulation might occur. Indeed, FIT protein levels are regulated by NO and ethylene response pathways (Lingam et al., 2011; Meiser et al., 2011). We examined whether altered FIT protein abundance might be conferred by H2O2 and the presence of ZAT12.
Therefore, we investigated whether ZAT12 and H2O2 played a role in FIT protein regulation in 10-d-old seedlings. We monitored FIT protein abundance in selected homozygous lines with wild-type and zat12-3 background, derived from a cross of zat12-3 with hemagglutinin (HA)-FIT9, expressing a triple hemagglutinin-tagged FIT protein (Meiser et al., 2011; hereafter named HA-FIT/WT and HA-FIT/zat12-3). In the absence of H2O2, HA-FIT protein levels were similar in HA-FIT/WT and HA-FIT/zat12-3 under both Fe supply conditions (Fig. 8). Surprisingly, H2O2 application led to 1- to 2-fold and 2- to 3-fold increased HA-FIT abundance in the wild-type background under sufficient and deficient Fe supply (Fig. 8). HA-FIT levels were not up-regulated by H2O2 in the zat12-3 background and were even decreased to 40% of the wild-type levels under sufficient Fe supply (Fig. 8, A and B).
Figure 8.

FIT protein abundance in zat12-3 and in response to H2O2. Anti-HA immunoblot analysis of HA-FIT protein abundance in HA-FIT/WT and HA-FIT/zat12-3 seedlings grown for 10 d on sufficient (+Fe; A and B) and deficient (−Fe; C and D) Fe supply is shown. Plants were incubated with 20 mm H2O2 (+) or water (−) for 1 h prior to harvesting for analysis. Arrowheads indicate the positions of the bands corresponding to HA-FIT (55 kD). Wild-type (WT) seedlings were used as a negative control. Ponceau S staining of the membrane was used as a loading control. B and D show quantification of A and C, respectively, based on three independent experiments. Bars represent normalized protein abundance. Error bars represent sd. Different letters indicate statistically significant differences (P < 0.05).
Therefore, oxidative stress in the form of H2O2 application caused an increased abundance of FIT protein levels in the presence of functional ZAT12.
DISCUSSION
Here, we report the identification of ZAT12 as a FIT interaction partner. We show that ROS are produced as a long-term consequence to Fe deficiency, dependent on FIT. ZAT12 acts in abiotic stress regulation and is induced by ROS. Phenotypical and molecular-genetic analyses suggest that the role of ZAT12 in Fe acquisition is to negatively affect Fe uptake regulation upon Fe deficiency and sufficient Fe supply. Importantly, our data reveal that oxidative stress in the form of H2O2 accumulation provides signaling intermediates for the regulation of Fe deficiency responses. These data suggest that FIT indeed integrates the input from other signaling pathways to adapt Fe uptake to an adverse stress condition, and we present a role for ZAT12 in down-regulating FIT involving H2O2.
ZAT12 Is Part of the FIT Interaction Network and Exerts a Negative Effect on Fe Uptake
FIT is a central element in a regulatory module that governs Fe deficiency responses. It receives regulatory inputs from different signaling pathways for a coordinated interaction with other plant responses (for review, see Brumbarova et al., 2015). To a great extent, this cross talk is achieved through direct protein-protein interactions. FIT was shown to interact with other transcriptional regulators, such as the subgroup Ib bHLH proteins (Yuan et al., 2008; Wang et al., 2013), the ethylene response regulators EIN3 and EIL1 (Lingam et al., 2011), and the Mediator subunit MED16 (Zhang et al., 2014). All these interactions were shown to positively regulate FIT protein activity. Therefore, the identification of ZAT12 as a FIT interacting partner with a negative effect on Fe uptake provides a clue on how these positive effects are counterbalanced at the molecular level, possibly to avoid metal toxicity.
The connection of ZAT12 to the Fe deficiency response regulation is, first, based on the physical interaction on protein level between ZAT12 and FIT, which we could show using different methods. We identified ZAT12 in a yeast screen for FIT C terminus-interacting partners. This interaction was confirmed in a targeted yeast two-hybrid assay. In addition, by BiFC, we reconfirmed the ZAT12-FIT interaction with full-length FIT in planta. The interaction was observed in the nucleus, consistent with the nuclear localization of FIT (Zhang et al., 2006). Both in yeast and in planta, the interaction required the presence of the EAR motif of ZAT12. GFP fusions of both ZAT12 and its deletion form ZAT12ΔEAR had nuclear localization in the two test systems, N. benthamiana leaf epidermis and Arabidopsis roots. FIT and ZAT12 have overlapping expression domains along the root, notably in the epidermis cells of the early differentiation zone, which is relevant for the uptake of Fe. Plants need to cope with the elevated intake of a variety of other, potentially toxic metals, such as manganese and Zn. This underlies the need of a negative regulator of Fe uptake in this zone. Additionally, ZAT12 has other functions, necessitating its expression in different zones of the root.
Second, the role of ZAT12 as a negative regulator of Fe uptake was demonstrated at the molecular and physiological levels. ZAT12 affects the expression levels of the Fe deficiency-responsive genes FIT, BHLH039, FRO2, and IRT1. The increased FIT transcript abundance in the absence of ZAT12 strongly suggests that ZAT12 acts as a negative regulator of FIT transcription. BHLH039 transcript levels, however, were regulated in the opposite manner, showing the specificity of ZAT12 action toward these two bHLH transcription factors. This observation supports an earlier report showing the up-regulation of BHLH039 in ZAT12-overexpressing plants (Vogel et al., 2005). Consistently, the expression levels of the downstream Fe acquisition genes FRO2 and IRT1 in the zat12-3 mutant reflected their dependence on both FIT and bHLH039 action (Yuan et al., 2008).
Third, another Fe-related phenotype of the zat12-3 mutant plants was their elevated Fe reductase activity and shoot Fe content under sufficient Fe supply. This shows that ZAT12 confers a negative effect on Fe uptake at sufficient Fe. Since the expression of IRT1 requires the activity of FIT also under sufficient Fe (Jakoby et al., 2004; Barberon et al., 2011; Lingam et al., 2011), it can be assumed that, under this sufficient Fe condition, a negative regulation of FIT via ZAT12 is needed in order to prevent the uptake of excessive Fe amounts and, therefore, the harmful effects of Fe overaccumulation. Consistent with the role of ZAT12 as a negative regulator of Fe acquisition, zat12 loss-of-function plants grown under excess Fe supply showed reduced root growth and accumulated more Fe in their shoots compared with wild-type plants. However, the lack of significant effects of ZAT12 on the repression of FIT and Fe reductase activity under excess Fe suggests that, under these conditions, ZAT12 could affect the uptake of Fe through other mechanisms. In rice (Oryza sativa), the ZAT12 homolog Os01g0838600 has been shown to be up-regulated by Fe excess (Bashir et al., 2014), similar to our observations. Since no FIT homolog has been identified so far among the bHLH transcription factors involved in rice Fe acquisition, rice ZAT12 may also affect Fe uptake in another manner (Kobayashi and Nishizawa, 2012).
Under conditions of prolonged Fe deficiency, ZAT12 could also be employed as a negative regulator of FIT. Down-regulation of the Fe acquisition machinery is required in order to prevent any damage from the accumulation of other metals, which are imported unspecifically by IRT1 (Korshunova et al., 1999). The manifestation of the ZAT12-FIT regulatory system is relevant after a prolonged, 10-d exposure of the plants to Fe deficiency when ZAT12 is induced. Previously, FIT was shown to interact with the ethylene-responsive transcription factors EIN3 and EIL1, which had a positive effect on Fe uptake after 6 d of Fe deficiency (Lingam et al., 2011). Interestingly, EIN3 and EIL1 are also EAR motif-containing proteins and contribute to the stabilization of FIT. In this respect, the possibility exists that the positive or negative regulation of Fe uptake depends on a competition between the positive regulators EIN3/EIL1 and the negative regulator ZAT12 for the same interaction site in the C terminus of FIT. Additionally, the ZAT12 promoter is a direct target of EIN3 (Peng et al., 2014), which hints toward the existence of multiple level connections between the regulators involved in the FIT interaction network.
The TOPLESS (TPL) corepressor family has been described in plants to participate in transcriptional repression complexes (for review, see Causier et al., 2012; Pieterse et al., 2012). TPL is typically recruited through short repressor domain sequences, such as the EAR motif for epigenetic down-regulation of target gene expression (for review, see Kagale and Rozwadowski, 2011). Here, we report that the ZAT12-FIT interaction is EAR dependent. ZAT family proteins, such as ZAT5, ZAT6, and ZAT10, but not ZAT12, have been shown to belong to the TPL interactome (Causier et al., 2012). ZAT12 may be able to exert its function in regulating Fe acquisition without recruiting TPL, similar to the EAR-containing EIN3 and EIL1 transcription factors (Pieterse et al., 2012).
H2O2 Levels Are Increased upon Fe Deficiency in a FIT-Dependent Manner, and H2O2 Serves as a Signal for FIT and ZAT12 Regulation
Under Fe deficiency, the H2O2 content in the roots was consistently elevated compared with sufficient Fe, which could indicate an oxidative stress condition. After prolonged Fe deficiency, such oxidative stress could be caused by internal remobilization of Fe from Fe stores or by the accumulation of other metals that are unspecifically taken up by IRT1. The H2O2 content under Fe deficiency was elevated in a FIT-dependent manner, since no increase in H2O2 levels could be observed in the roots of fit-3 plants, representing a new phenotype for this loss-of-function mutant. H2O2 production may depend on the ability of plants to take up metals and liberate internal Fe, which is perturbed in fit-3 mutants due to their general inability to take up Fe and adapt to Fe deficiency. Alternatively, FIT may regulate factors required for H2O2 production, such as the respiratory burst oxidase homologs (RBOHs; for review, see Marino et al., 2012). RBOHD has been found up-regulated by Fe deficiency in a FIT-dependent manner (Colangelo and Guerinot, 2004). We have observed that the H2O2 content of plants grown under sufficient and deficient Fe supply followed a pattern of up- and down-regulation, independently of the tested genotypes. This suggests that the observed patterns might have depended on developmental cues. On the other hand, ZAT12 transcript abundance was not elevated until days 8 to 10, even though there was an increase in H2O2 content already at day 7 compared with day 5. Since ZAT12 is a stress response transcription factor, it is possible that ZAT12 regulation depended more on environmental cues and H2O2 signatures, such as prolonged Fe deficiency, than on developmental cues and developmental H2O2 signatures.
H2O2 served as a signal for the up-regulation of ZAT12 transcript and protein levels, which in turn led to a decrease in FIT, FRO2, and IRT1 but not BHLH039 transcript abundance. Since FIT was involved in the Fe deficiency-induced H2O2 accumulation, H2O2 can be considered an intermediate in an autoregulatory suppression of FIT after prolonged Fe deficiency. H2O2 application caused elevated FIT protein levels under both Fe supply conditions in a ZAT12-dependent manner. Previous research has proposed the existence of active and inactive FIT forms (Lingam et al., 2011; Meiser et al., 2011; Sivitz et al., 2011). Our results are consistent with these models, since, despite a higher FIT level after H2O2 application, IRT1 and FRO2 transcript abundances were decreased. Therefore, the elevated FIT was probably not an active transcriptional regulator.
H2O2 also affected ZAT12 protein abundance. H2O2 application, irrespective of Fe supply, led to ZAT12 accumulation in the central cylinder of treated roots. In root epidermis cells, ZAT12 degradation was prevented by the application of MG132, also in the presence of H2O2. The absence of the EAR motif perturbed this stabilization, probably by targeting ZAT12 for nonproteasomal degradation (summarized in Supplemental Fig. S10). The EAR motif- and H2O2-dependent ZAT12 protein abundance regulation in the root epidermis can be explained with the existence of additional ZAT12-interacting partners. In such a case, at least one of the factors needs to be H2O2 responsive, while another one should be a factor for proteasomal degradation (such as an E3-ubiquitin ligase). The composition of the resulting ZAT12 protein complexes could determine the proteasomal or nonproteasomal nature of ZAT12 degradation.
The importance of the EAR motif for protein stability has been demonstrated previously. The phosphorylation of Thr-157 by mitogen-activated protein kinase family kinases within the EAR motif of PtiZFP1, a poplar (Populus spp.) ortholog of ZAT12, partially increases its stability (Hamel et al., 2011). The ZAT12 protein sequence contains a Gly instead of a Thr at this position, and phosphorylation might not be involved in the EAR-mediated degradation control. In our model, we suggest that the EAR motif can be used as a scaffold for different protein-protein interactions, which change the fate of the ZAT12-containing protein complex. This can explain the observed H2O2-dependent, but not the MG132-dependent, stabilization of ZAT12 in the central cylinder, where ZAT12 may participate in protein complexes different from those in the epidermis. Such an interpretation is consistent with the data of Dinneny et al. (2008) showing that Fe deficiency causes different transcriptome changes in the epidermis and the central cylinder. Additionally, H2O2 might affect the protein interaction between ZAT12 and FIT. Further work is required to address such questions.
Taken together, our data demonstrate a role of ZAT12 as a mediator of ROS signals for Fe acquisition. FIT might be a converging point for Fe and ROS-related signals.
Model for the Role of ZAT12 in Regulating Fe Uptake
We propose the following model (Fig. 9) that integrates our findings on the role of ZAT12 and oxidative stress into the currently accepted model of Fe deficiency response regulation. Exposure of Arabidopsis plants to Fe deficiency leads to the induced expression of the Fe uptake regulator gene FIT in root cells. The presence of FIT protein is a prerequisite for the accumulation of H2O2 in Fe-deficient roots, as suggested by the lack of Fe deficiency-induced H2O2 production in fit-3 mutant plants. After 10 d of Fe starvation, H2O2 leads to the repression of FIT and the induction of ZAT12 gene expression, which could represent a feedback repression loop for FIT. Thus, ZAT12 transcript abundance is partially dependent on FIT. ZAT12 engages FIT through its EAR motif in a protein complex. The formation of such FIT-ZAT12 complexes possibly diminishes the pool of FIT available for other protein-protein interactions that activate FIT (Lingam et al., 2011). This eventually leads to reduced FIT transcript levels through lowering the amount of active FIT regulating FIT gene expression (Jakoby et al., 2004). In this model, H2O2 prevents FIT degradation in a ZAT12-dependent manner, possibly due to their interaction. Oxidative stress after prolonged exposure to Fe deficiency would then have a dual function. Oxidative stress regulates FIT availability by establishing a fine-tuned balance at the level of FIT transcripts and active and inactive FIT protein. The suppression of Fe uptake by ZAT12 may allow the plant to prevent deleterious effects of metals in the face of a prolonged Fe starvation or other abiotic stress conditions. At the same time, a pool of transcriptionally inactive but available FIT protein would be maintained as a backup in case favorable conditions arise. Alternatively, prolonged Fe deficiency stress may result in additional internal Fe remobilization associated with that H2O2-mediated oxidative stress. This situation may require a transient block of Fe acquisition via ZAT12.
Figure 9.

Model for the involvement of ZAT12 in the regulation of Fe uptake. Fe deficiency leads to induced expression of FIT, as part of the FIT autoregulatory loop. Active FIT protein confers induction of the genes for the Fe deficiency response (indicated in green; summarized in Brumbarova et al., 2015). The presence of FIT protein is a prerequisite for the accumulation of H2O2 in Fe-deficient roots. After 10 d of Fe starvation, the presence of H2O2 leads to the induction of ZAT12 gene expression and enhanced ZAT12 protein levels. Both FIT and ZAT12 protein levels are controlled in the cell through their degradation. We propose that ZAT12 engages FIT through its EAR motif in a protein complex. H2O2 causes an enhanced FIT protein level despite the decreased gene expression. We suggest that FIT protein could be stabilized but inactivated by H2O2, possibly through interaction with ZAT12. Inactive FIT may eventually also contribute to reduced FIT gene expression levels. Such a control mechanism may allow the plant to keep a backup of FIT protein molecules ready to use in case more favorable conditions arise. Upon Fe resupply, the system is shifted and FIT is active again.
MATERIALS AND METHODS
Yeast Two-Hybrid Assays
The yeast two-hybrid screen in which ZAT12 has been identified as a putative FIT interaction partner was described previously (Lingam et al., 2011). For targeted interaction assays, pGBKT7:FIT-C (BD-FIT-C; Lingam et al., 2011), pACT2-GW:ZAT12 (AD-ZAT12), and pACT2-GW:ZAT12ΔEAR (AD-ZAT12ΔEAR; ZAT12 coding sequence with a deleted EAR motif) constructs were used. ZAT12 and ZAT12ΔEAR sequences with stop codon were amplified using the primers 5′-attB1_ZAT12 and 3′-attB2_ZAT12 (Supplemental Table S1) from pDONR207:ZAT12ns and pDONR207:ZAT12ΔEARns (described in “Plant Material” below) and transferred into pDONR207 (BP reaction; Life Technologies). In an LR Gateway reaction (Life Technologies), ZAT12 and ZAT12ΔEAR were transferred into pACT2-GW to produce the final destination constructs. BD-FIT-C and AD-ZAT12 or AD-ZAT12ΔEAR were cotransformed into the yeast strain AH109 using the lithium acetate method (BD Biosciences). Ten-fold serial dilutions (A600 = 10−1–10−4) of the transformants were assayed for cotransformation by spotting on SD agar plates lacking Leu (pGBKT7 auxotrophy selection) and Trp (pACT2-GW auxotrophy selection). For the presence of an interaction, the transformation mixture was spotted on SD agar plates lacking Leu, Trp, and His supplemented with 0.5 and 2.5 mm 3-amino-1,2,4-triazole (selection for interaction). Plates were incubated at 30°C for 5 to 8 d. AH109 yeast cells cotransformed with pGBKT7-GW:SNX1 (BD-SNX1) and pACT2-GW:SNX1 (AD-SNX1) were used as a positive control (Pourcher et al., 2010). AH109 cotransformed with the combinations BD-FIT-C with empty pACT2-GW, empty pGBKT7 with AD-ZAT12, and empty pGBKT7 with AD-ZAT12ΔEAR were used as negative controls. pACT2-GW was kindly provided by Dr. Yves Jacob. pGBKT7-GW:SNX1 and pACT2-GW:SNX1 were kindly provided by Dr. Thierry Gaude.
BiFC
In planta verification of the FIT-ZAT12 interaction was performed using rBiFC (Grefen and Blatt, 2012). FIT, ZAT12, ZAT12ΔEAR, and BHLH039 coding sequences were amplified using the primers FIT B1 and FITstop B4 (for FIT), ZAT12 B3 and ZAT12stop B2 (for ZAT12 and ZAT12ΔEAR), and 39 B1 and 39stop B4 (Supplemental Table S1). The resulting FIT and BHLH039 PCR fragments were cloned by BP reaction (Life Technologies) into pDONR227 P1-P4 (Invitrogen), and the ZAT12 and ZAT12ΔEAR fragments were cloned into pDONR227 P3-P2 (Invitrogen). Following LR reaction (Life Technologies) with the obtained ENTRY vectors and pBiFC-2in1-NN, ZAT12 and FIT were combined into pBiFC-2in1-NN:ZAT12-FIT; ZAT12ΔEAR and FIT were combined into pBiFC-2in1-NN:ZAT12ΔEAR-FIT. ZAT12 and BHLH039 were combined into pBiFC-2in1-NN:ZAT12-BHLH039. pDONR227 P1-P4:FIT and pBiFC-2in1-NN were used to obtain the negative control pBiFC-2in1-NN:(empty)-FIT. Rhizobium radiobacter strain C58 (pGV2260) cells were transformed with the different plasmids. Transformed cultures were used for infiltration of Nicotiana benthamiana leaves as described previously (Hotzer et al., 2012). After 48 h, YFP fluorescent signals were detected using an LSM 510 Meta confocal laser-scanning microscope (Zeiss). The BiFC experiments were performed in three independent repetitions on a total of six infiltrated leaves. Transformed cells were verified by mRFP fluorescence. The vector pBiFC-2in1-NN was kindly provided by Dr. Christopher Grefen.
Plant Material
Wild-type Arabidopsis (Arabidopsis thaliana) was ecotype Columbia-0 (Col-0). The fit-3 (GABI_108C10) loss-of-function mutant was distinguished from the wild type as described previously (Jakoby et al., 2004). The homozygous zat12-1 (SALK_037357) and zat12-2 (SAIL 792_F04) loss-of-function mutant lines were described previously (Davletova et al., 2005b) and were kindly provided by Ron Mittler. The zat12-3 mutant transfer DNA insertion line (GK-348H06) was obtained from the Nottingham Arabidopsis Stock Centre and selfed to obtain a pure homozygous line, verified by genotyping. ZAT12-GFP fusion constructs were generated using the Gateway cloning system (Life Technologies). The genomic fragment including 1,670 bp upstream of the ZAT12 ATG (ZAT12 promoter region) and the full-length ZAT12 genomic coding region without a stop codon, or the ZAT12 coding region lacking the EAR motif without a stop codon, were introduced into the pDONR207 vector through a BP reaction (Life Technologies), producing pDONR207:ZAT12ns and pDONR207:ZAT12ΔEARns. Following LR reaction (Life Technologies), the two constructs were cloned into pMDC107 (Curtis and Grossniklaus, 2003) in order to generate C-terminal translational fusions with the GFP, hereafter referred to as ProZAT12:ZAT12-GFP and ProZAT12:ZAT12ΔEAR-GFP. ProZAT12:ZAT12 was amplified from Columbia-0 genomic DNA by PCR using 5′attB1-ZAT12 PROMOTER and 3′attB2-ZAT12 NONSTOP primers (Supplemental Table S1). The deletion of the EAR motif was achieved by overlap-extension PCR. In a first round of amplification, two partially overlapping pieces of ZAT12 were generated using 5′attB1-ZAT12 PROMOTER and ZAT12ΔEAR-R1 primers for one piece and ZAT12ΔEAR-F2 and 3′attB2-ZAT12 NONSTOP primers for the other piece. For the second round of amplification, the two obtained PCR products were used as templates for the outer primers 5′attB1-ZAT12 PROMOTER and 3′attB2-ZAT12 NONSTOP, giving as a product ProZAT12:ZAT12ΔEAR. Subsequently, both pMDC107 destination vector constructs containing ProZAT12:ZAT12-GFP and ProZAT12:ZAT12ΔEAR-GFP were transformed into the R. radiobacter strain C58 (pGV2260). Positive clones were used for the verification of proper ZAT12-GFP and ZAT12ΔEAR-GFP fusion protein expression by transient transformation of N. benthamiana leaf epidermal cells. N. benthamiana infiltration was performed as described previously (Hötzer et al., 2012). After confirmation of the vector constructs and protein expression, transgenic plants were obtained by Agrobacterium tumefaciens-mediated floral dip transformation (Clough and Bent, 1998) of wild-type and zat12-3 plants. Positive transformants were selected based on their hygromycin resistance, selfed, and multiplied until homozygous lines containing single insertions were obtained. T3 plants were used for analysis. Several homozygous lines were generated for each transgenic construct: four lines ProZAT12:ZAT12-GFP and three lines ProZAT12:ZAT12ΔEAR-GFP in the wild-type background, and four lines ProZAT12:ZAT12-GFP and two lines ProZAT12:ZAT12ΔEAR-GFP in the zat12-3 background. All generated lines were verified for GFP expression by confocal microscopy, and for all of them, GFP signals could be observed only in the nucleus. One line for each construct was chosen for further experiments. ProFIT:GUS transgenic plants have been described previously (Jakoby et al., 2004).
Wild-type plants expressing Pro-2xCaMV35S:3xHA-FIT were described previously (Meiser et al., 2011; line HA-FIT 9). Three homozygous lines of zat12-3 mutant plants expressing Pro-2xCaMV35S:3xHA-FIT (HA-FIT/zat12-3) were generated by crossing zat12-3 with the HA-FIT9 line. The F2 progeny was screened by PCR to select for zat12-3 homozygosity and HA-FIT (HA-FIT/zat12-3). Additionally, three homozygous lines with HA-FIT in the wild-type background (HA-FIT/WT) were recovered from the cross and used for the comparison.
Plant Growth Conditions and Treatments
Arabidopsis seeds were surface sterilized as described previously (Lingam et al., 2011) and germinated on upright Hoagland medium agar plates (Jakoby et al., 2004) supplemented with 50 µm FeNaEDTA (sufficient Fe supply), 0 Fe, 50 µm ferrozine (deficient Fe supply), or 200 µm Fe (excess Fe supply), as indicated in the Results section. For the seedling growth system, plants were grown under long-day conditions for 10 d before harvesting for analysis or collected at days 5, 7, 8, and 10 for the time-course experiment. For the resupply experiment, 10-d-old Fe-deficient plants were transferred to Hoagland plates containing 1, 10, or 50 µm FeNaEDTA and grown vertically for 7 d. If indicated in the text, seedlings were subjected to 20 mm H2O2 for 1 h prior to harvesting the whole seedlings for gene expression analysis, immunoblotting, or imaging. For MG132 treatment, 10-d-old seedlings were treated for 4 h in liquid Fe-sufficient (50 µm Fe) or Fe-deficient (50 µm ferrozine) Hoagland medium containing 100 µm MG132 (Calbiochem) or dimethyl sulfoxide as a mock control (as in Lingam et al., 2011) and harvested for analysis.
Gene Expression Analysis by Quantitative Reverse Transcription-PCR
Gene expression analysis was performed as described previously (Klatte and Bauer, 2009; Ivanov et al., 2014). Briefly, total RNA was isolated from 100 mg of deep-frozen seedlings using the Spectrum Plant Total RNA Kit (Sigma-Aldrich). One microgram of DNaseI-treated RNA was used for reverse transcription with oligo(dT) primer using the RevertAid First Strand cDNA Synthesis Kit (Fermentas). The obtained complementary DNA was diluted and used as a template according to Klatte and Bauer (2009). Quantitative PCR was performed on the iCycler/MyIQ Single Color Real-Time PCR Detection System (Bio-Rad), and the results were processed on the Bio-Rad iQ5-Standard Edition (version 2.0) software as described previously (Wang et al., 2007; Klatte and Bauer, 2009). Primer pairs used for this study are listed in Supplemental Table S1. Absolute gene expression was determined by mass standard curve analysis and normalized to elongation factor EF1Bα expression as a reference. Each experiment was performed in at least three biological repetitions with two technical quantitative PCR replicates each. For statistical analysis, P values were obtained via Student’s t test on biological replicates using the GraphPad software at http://www.graphpad.com/welcome.htm.
Immunoblot Analysis
Total protein from 10-d-old seedlings was extracted with SDG buffer (62 mm Tris-HCl, pH 8.6, 2.5% (w/v) SDS, 2% (w/v) dithiothreitol, and 10% (w/v) glycerol). Samples containing 5 µg of protein were separated on 12% (w/v) SDS-polyacrylamide gels. Electrophoresis was performed in Tris-Gly buffer (25 mm Tris, 192 mm Gly, and 0.1% (w/v) SDS, pH 8.3) using standard mini gel equipment (Bio-Rad). After electrophoresis, the proteins were transferred in blotting buffer (25 mm Tris, 192 mm Gly, and 20% (v/v) ethanol, pH 8.3) to a Protran nitrocellulose membrane (Schleicher & Schuell) and stained with Ponceau S (Sigma-Aldrich) as a loading control. The nitrocellulose membrane was then blocked for 1 h in 5% (w/v) milk solution (Roth), dissolved in TBST (20 mm Tris-HCl, pH 7.4, 180 mm NaCl, and 0.1% (v/v) Tween 20) to prevent nonspecific binding of the antibody, followed by a 1-h incubation in a dilution of the primary antibody in TBST containing 2.5% (w/v) milk. After three washes with TBST, 10 min each, the membrane was incubated in a dilution of the secondary antibody in TBST containing 2.5% (w/v) milk. The membrane was washed four times with TBST, 10 min each, before detection using the enhanced chemiluminescence system (GE Healthcare). ZAT12-GFP and ZAT12ΔEAR-GFP fusion proteins were probed with mouse anti-GFP (Roche [catalog no. 11814460001]; 1:1,000) followed by goat anti-mouse IgG horseradish peroxidase conjugate (Promega [catalog no. W4021]; 1:5,000). HA-FIT protein was detected in a single-step immunoblot with anti-HA-peroxidase high-affinity monoclonal rat antibody (3F10; Roche [catalog no. 12013819001]; 1:1,000). Images of developed immunoblots were converted to grayscale prior to analysis. Relative quantification of protein bands was performed using ImageJ software (http://rsb.info.nih.gov/ij) and normalization to Ponceau S-stained bands as described previously (Ivanov et al., 2012b). In short, densitometry on the immunoblot images was done by first subtracting the background, followed by lane selection and automatic signal analysis. The surface of the peaks representing the signal intensity was calculated in arbitrary units, and the resulting values were used for the comparison.
Confocal Microscopy
Laser-scanning confocal microscopy (510 Meta; Zeiss) was used for fluorescence imaging of YFP (for rBiFC analysis) and GFP (for confocal imaging of roots from 10-d-old seedlings expressing ZAT12-GFP or ZAT12ΔEAR-GFP) at an excitation wavelength of 488 nm and emission wavelength of 500 to 530 nm. mRFP (for rBiFC analysis) was detected with excitation wavelength at 563 nm and emission wavelength of 560 to 615 nm. For root confocal imaging, multilayer stacks were scanned and full projection images were created.
Histochemical GUS Assay
GUS activity of ProFIT:GUS plants was visualized by histochemical GUS staining as described previously (Jakoby et al., 2004; Ivanov et al., 2014).
Fe Content Determination
To determine the Fe content of seedlings, shoots of plants grown for 10 d were harvested and dried overnight at room temperature and for 1 d at 120°C. After drying, shoots were powdered, and the Fe content was determined using direct solid-sampling graphite furnace atomic absorption spectrometry (contrAAS 700; Analytik Jena) at the Leibniz Institute for New Materials. Reference standards were used for quantification. Each biological sample was measured five times and averaged. The experiment was performed in three biological replicates.
Fe Reductase Activity Measurement
Fe reductase activity was determined spectrophotometrically using 10-d-old seedlings grown on Hoagland agar plates and treated as described. Plants were washed in 100 mm Ca(NO3)2 solution followed by incubation at room temperature in 2 mL of Fe reductase solution (300 μm ferrozine and 100 μm FeNaEDTA) in the dark. After 1 h, the absorbance of the Fe reductase solution was measured at 562 nm using the Safire2 plate reader (Tecan). The Fe reductase activity normalized to root length was calculated as µmol Fe2+ h−1 cm−1 root using the extinction coefficient ε = 28.6 mm−1 cm−1. The assay was performed in three biological replicates. For one biological replicate, the Fe reductase activity of five pools of five plants was averaged.
H2O2 Measurement
Five-, 7-, 8-, and 10-d-old seedlings were used to measure H2O2 content using an Amplex Red H2O2-peroxidase assay kit (Molecular Probes). Root tissue was harvested and ground in liquid nitrogen. A total of 30 mg of ground tissue was diluted in 200 μL of phosphate buffer (20 mm K2HPO4, pH 6.5) and centrifuged; 50 μL of the supernatant was mixed with 100 μL of Amplex Red reagent (10-acetyl-3,7-dihydrophenoxazine) and 0.2 units mL−1 horseradish peroxidase and incubated at room temperature for 30 min in the dark. Resorufin production was quantified at 560 nm using the Safire2 plate reader (Tecan). The experiment was performed in three biological repetitions with three technical replicates each.
Sequence data from this article can be found in the Arabidopsis Genome Initiative or GenBank/EMBL databases under the following accession numbers: FIT (At2g28160), ZAT12 (At5g59820), FRO2 (At1g01580), IRT1 (At4g19690), and BHLH039 (At3g56980).
Supplemental Data
The following supplemental materials are available.
Supplemental Figure S1. Comparison of tissue-level localization of reporter activities in ProZAT12:ZAT12-GFP and ProFIT:GUS plants.
Supplemental Figure S2. Subcellular and tissue-level localization of ZAT12-GFP and ZAT12ΔEAR-GFP.
Supplemental Figure S3. Comparison of tissue-level localization of reporter activities in ProZAT12:ZAT12-GFP and ProFIT:GUS plants.
Supplemental Figure S4. Optical cross sections showing tissue-level localization and accumulation of ZAT12-GFP and ZAT12ΔEAR-GFP.
Supplemental Figure S5. zat12 mutant alleles and their effect on FIT gene expression.
Supplemental Figure S6. Time-course gene expression analysis of FIT and ZAT12.
Supplemental Figure S7. Phenotypes of plants under Fe deficiency and Fe resupply.
Supplemental Figure S8. Phenotypes of plants under sufficient and excess Fe supply.
Supplemental Figure S9. Time-course analysis of root H2O2 content of WT, fit-3, and zat12-3 seedlings.
Supplemental Figure S10. Summary of ZAT12-GFP and ZAT12ΔEAR-GFP protein sensitivity to H2O2 and MG132 application in the early root differentiation zone.
Supplemental Table S1. Primers used in this study.
Acknowledgments
We thank Dr. Yves Jacob (Institut Pasteur), Dr. Thierry Gaude (École Normale Supérieure), Dr. Christopher Grefen (Zentrum für Molekularbiologie der Pflanzen Developmental Genetics), Dr. Francois Parcy (Institut de Recherches en Technologies et Sciences pour le Vivant - Centre d'Etudes Atomiques), and Ron Mittler (University of North Texas) for kindly providing materials; we also thank Angelika Anna, Ulrike Ellersiek, and Elke Wieneke (Heinrich-Heine University) for excellent technical assistance.
Glossary
- Fe
iron
- NO
nitric oxide
- ROS
reactive oxygen species
- H2O2
hydrogen peroxide
- Zn
zinc
- EAR
ethylene-responsive element-binding factor-associated amphiphilic repression
- rBiFC
ratiometric bimolecular fluorescence complementation
- BiFC
bimolecular fluorescence complementation
- SD
synthetic dextrose
Footnotes
This work was supported by the Deutsche Forschungsgeminschaft (grant no. Ba1610/5–1 to P.B.) and by a research fellowship by the Vietnamese government/Deutscher Akademischer Austauschdienst (to C.T.T.L.).
Articles can be viewed without a subscription.
References
- Apel K, Hirt H (2004) Reactive oxygen species: metabolism, oxidative stress, and signal transduction. Annu Rev Plant Biol 55: 373–399 [DOI] [PubMed] [Google Scholar]
- Barberon M, Zelazny E, Robert S, Conéjéro G, Curie C, Friml J, Vert G (2011) Monoubiquitin-dependent endocytosis of the iron-regulated transporter 1 (IRT1) transporter controls iron uptake in plants. Proc Natl Acad Sci USA 108: E450–E458 [DOI] [PMC free article] [PubMed] [Google Scholar]
- Bashir K, Hanada K, Shimizu M, Seki M, Nakanishi H, Nishizawa NK (2014) Transcriptomic analysis of rice in response to iron deficiency and excess. Rice (N Y) 7: 18. [DOI] [PMC free article] [PubMed] [Google Scholar]
- Bauer P, Thiel T, Klatte M, Bereczky Z, Brumbarova T, Hell R, Grosse I (2004) Analysis of sequence, map position, and gene expression reveals conserved essential genes for iron uptake in Arabidopsis and tomato. Plant Physiol 136: 4169–4183 [DOI] [PMC free article] [PubMed] [Google Scholar]
- Blum A, Brumbarova T, Bauer P, Ivanov R (2014) Hormone influence on the spatial regulation of IRT1 expression in iron-deficient Arabidopsis thaliana roots. Plant Signal Behav 9: e287879. [DOI] [PMC free article] [PubMed] [Google Scholar]
- Briat JF, Ravet K, Arnaud N, Duc C, Boucherez J, Touraine B, Cellier F, Gaymard F (2010) New insights into ferritin synthesis and function highlight a link between iron homeostasis and oxidative stress in plants. Ann Bot (Lond) 105: 811–822 [DOI] [PMC free article] [PubMed] [Google Scholar]
- Brumbarova T, Bauer P, Ivanov R (2015) Molecular mechanisms governing Arabidopsis iron uptake. Trends Plant Sci 20: 124–133 [DOI] [PubMed] [Google Scholar]
- Causier B, Ashworth M, Guo W, Davies B (2012) The TOPLESS interactome: a framework for gene repression in Arabidopsis. Plant Physiol 158: 423–438 [DOI] [PMC free article] [PubMed] [Google Scholar]
- Chen WW, Yang JL, Qin C, Jin CW, Mo JH, Ye T, Zheng SJ (2010) Nitric oxide acts downstream of auxin to trigger root ferric-chelate reductase activity in response to iron deficiency in Arabidopsis. Plant Physiol 154: 810–819 [DOI] [PMC free article] [PubMed] [Google Scholar]
- Cheong YH, Chang HS, Gupta R, Wang X, Zhu T, Luan S (2002) Transcriptional profiling reveals novel interactions between wounding, pathogen, abiotic stress, and hormonal responses in Arabidopsis. Plant Physiol 129: 661–677 [DOI] [PMC free article] [PubMed] [Google Scholar]
- Ciftci-Yilmaz S, Mittler R (2008) The zinc finger network of plants. Cell Mol Life Sci 65: 1150–1160 [DOI] [PMC free article] [PubMed] [Google Scholar]
- Ciftci-Yilmaz S, Morsy MR, Song L, Coutu A, Krizek BA, Lewis MW, Warren D, Cushman J, Connolly EL, Mittler R (2007) The EAR-motif of the Cys2/His2-type zinc finger protein Zat7 plays a key role in the defense response of Arabidopsis to salinity stress. J Biol Chem 282: 9260–9268 [DOI] [PubMed] [Google Scholar]
- Clough SJ, Bent AF (1998) Floral dip: a simplified method for Agrobacterium-mediated transformation of Arabidopsis thaliana. Plant J 16: 735–743 [DOI] [PubMed] [Google Scholar]
- Colangelo EP, Guerinot ML (2004) The essential basic helix-loop-helix protein FIT1 is required for the iron deficiency response. Plant Cell 16: 3400–3412 [DOI] [PMC free article] [PubMed] [Google Scholar]
- Curtis MD, Grossniklaus U (2003) A Gateway cloning vector set for high-throughput functional analysis of genes in planta. Plant Physiol 133: 462–469 [DOI] [PMC free article] [PubMed] [Google Scholar]
- Davletova S, Rizhsky L, Liang H, Shengqiang Z, Oliver DJ, Coutu J, Shulaev V, Schlauch K, Mittler R (2005a) Cytosolic ascorbate peroxidase 1 is a central component of the reactive oxygen gene network of Arabidopsis. Plant Cell 17: 268–281 [DOI] [PMC free article] [PubMed] [Google Scholar]
- Davletova S, Schlauch K, Coutu J, Mittler R (2005b) The zinc-finger protein Zat12 plays a central role in reactive oxygen and abiotic stress signaling in Arabidopsis. Plant Physiol 139: 847–856 [DOI] [PMC free article] [PubMed] [Google Scholar]
- Dinneny JR, Long TA, Wang JY, Jung JW, Mace D, Pointer S, Barron C, Brady SM, Schiefelbein J, Benfey PN (2008) Cell identity mediates the response of Arabidopsis roots to abiotic stress. Science 320: 942–945 [DOI] [PubMed] [Google Scholar]
- Englbrecht CC, Schoof H, Böhm S (2004) Conservation, diversification and expansion of C2H2 zinc finger proteins in the Arabidopsis thaliana genome. BMC Genomics 5: 39. [DOI] [PMC free article] [PubMed] [Google Scholar]
- Fenton HJH. (1894) Oxidation of tartaric acid in presence of iron. J Chem Soc Trans 65: 899–910 [Google Scholar]
- Foreman J, Demidchik V, Bothwell JH, Mylona P, Miedema H, Torres MA, Linstead P, Costa S, Brownlee C, Jones JD, et al. (2003) Reactive oxygen species produced by NADPH oxidase regulate plant cell growth. Nature 422: 442–446 [DOI] [PubMed] [Google Scholar]
- Fowler S, Thomashow MF (2002) Arabidopsis transcriptome profiling indicates that multiple regulatory pathways are activated during cold acclimation in addition to the CBF cold response pathway. Plant Cell 14: 1675–1690 [DOI] [PMC free article] [PubMed] [Google Scholar]
- García MJ, Lucena C, Romera FJ, Alcántara E, Pérez-Vicente R (2010) Ethylene and nitric oxide involvement in the up-regulation of key genes related to iron acquisition and homeostasis in Arabidopsis. J Exp Bot 61: 3885–3899 [DOI] [PubMed] [Google Scholar]
- García MJ, Suárez V, Romera FJ, Alcántara E, Pérez-Vicente R (2011) A new model involving ethylene, nitric oxide and Fe to explain the regulation of Fe-acquisition genes in strategy I plants. Plant Physiol Biochem 49: 537–544 [DOI] [PubMed] [Google Scholar]
- Grefen C, Blatt MR (2012) A 2in1 cloning system enables ratiometric bimolecular fluorescence complementation (rBiFC). Biotechniques 53: 311–314 [DOI] [PubMed] [Google Scholar]
- Hamel LP, Benchabane M, Nicole MC, Major IT, Morency MJ, Pelletier G, Beaudoin N, Sheen J, Séguin A (2011) Stress-responsive mitogen-activated protein kinases interact with the EAR motif of a poplar zinc finger protein and mediate its degradation through the 26S proteasome. Plant Physiol 157: 1379–1393 [DOI] [PMC free article] [PubMed] [Google Scholar]
- Hötzer B, Ivanov R, Brumbarova T, Bauer P, Jung G (2012) Visualization of Cu²⁺ uptake and release in plant cells by fluorescence lifetime imaging microscopy. FEBS J 279: 410–419 [DOI] [PubMed] [Google Scholar]
- Iida A, Kazuoka T, Torikai S, Kikuchi H, Oeda K (2000) A zinc finger protein RHL41 mediates the light acclimatization response in Arabidopsis. Plant J 24: 191–203 [DOI] [PubMed] [Google Scholar]
- Ivanov R, Brumbarova T, Bauer P (2012a) Fitting into the harsh reality: regulation of iron-deficiency responses in dicotyledonous plants. Mol Plant 5: 27–42 [DOI] [PubMed] [Google Scholar]
- Ivanov R, Brumbarova T, Blum A, Jantke AM, Fink-Straube C, Bauer P (2014) SORTING NEXIN1 is required for modulating the trafficking and stability of the Arabidopsis IRON-REGULATED TRANSPORTER1. Plant Cell 26: 1294–1307 [DOI] [PMC free article] [PubMed] [Google Scholar]
- Ivanov R, Tiedemann J, Czihal A, Baumlein H (2012b) Transcriptional regulator AtET2 is required for the induction of dormancy during late seed development. J Plant Physiol 169: 501–508 [DOI] [PubMed] [Google Scholar]
- Jakoby M, Wang HY, Reidt W, Weisshaar B, Bauer P (2004) FRU (BHLH029) is required for induction of iron mobilization genes in Arabidopsis thaliana. FEBS Lett 577: 528–534 [DOI] [PubMed] [Google Scholar]
- Kagale S, Links MG, Rozwadowski K (2010) Genome-wide analysis of ethylene-responsive element binding factor-associated amphiphilic repression motif-containing transcriptional regulators in Arabidopsis. Plant Physiol 152: 1109–1134 [DOI] [PMC free article] [PubMed] [Google Scholar]
- Kagale S, Rozwadowski K (2011) EAR motif-mediated transcriptional repression in plants: an underlying mechanism for epigenetic regulation of gene expression. Epigenetics 6: 141–146 [DOI] [PMC free article] [PubMed] [Google Scholar]
- Kiełbowicz-Matuk A. (2012) Involvement of plant C(2)H(2)-type zinc finger transcription factors in stress responses. Plant Sci 185-186: 78–85 [DOI] [PubMed] [Google Scholar]
- Klatte M, Bauer P (2009) Accurate real-time reverse transcription quantitative PCR. Methods Mol Biol 479: 61–77 [DOI] [PubMed] [Google Scholar]
- Kobayashi T, Nishizawa NK (2012) Iron uptake, translocation, and regulation in higher plants. Annu Rev Plant Biol 63: 131–152 [DOI] [PubMed] [Google Scholar]
- Korshunova YO, Eide D, Clark WG, Guerinot ML, Pakrasi HB (1999) The IRT1 protein from Arabidopsis thaliana is a metal transporter with a broad substrate range. Plant Mol Biol 40: 37–44 [DOI] [PubMed] [Google Scholar]
- Kreps JA, Wu Y, Chang HS, Zhu T, Wang X, Harper JF (2002) Transcriptome changes for Arabidopsis in response to salt, osmotic, and cold stress. Plant Physiol 130: 2129–2141 [DOI] [PMC free article] [PubMed] [Google Scholar]
- Lingam S, Mohrbacher J, Brumbarova T, Potuschak T, Fink-Straube C, Blondet E, Genschik P, Bauer P (2011) Interaction between the bHLH transcription factor FIT and ETHYLENE INSENSITIVE3/ETHYLENE INSENSITIVE3-LIKE1 reveals molecular linkage between the regulation of iron acquisition and ethylene signaling in Arabidopsis. Plant Cell 23: 1815–1829 [DOI] [PMC free article] [PubMed] [Google Scholar]
- Marino D, Dunand C, Puppo A, Pauly N (2012) A burst of plant NADPH oxidases. Trends Plant Sci 17: 9–15 [DOI] [PubMed] [Google Scholar]
- Maurer F, Müller S, Bauer P (2011) Suppression of Fe deficiency gene expression by jasmonate. Plant Physiol Biochem 49: 530–536 [DOI] [PubMed] [Google Scholar]
- Meiser J, Lingam S, Bauer P (2011) Posttranslational regulation of the iron deficiency basic helix-loop-helix transcription factor FIT is affected by iron and nitric oxide. Plant Physiol 157: 2154–2166 [DOI] [PMC free article] [PubMed] [Google Scholar]
- Miller G, Shulaev V, Mittler R (2008) Reactive oxygen signaling and abiotic stress. Physiol Plant 133: 481–489 [DOI] [PubMed] [Google Scholar]
- Mittler R. (2002) Oxidative stress, antioxidants and stress tolerance. Trends Plant Sci 7: 405–410 [DOI] [PubMed] [Google Scholar]
- Mittler R, Blumwald E (2015) The roles of ROS and ABA in systemic acquired acclimation. Plant Cell 27: 64–70 [DOI] [PMC free article] [PubMed] [Google Scholar]
- Murgia I, Arosio P, Tarantino D, Soave C (2012) Biofortification for combating ‘hidden hunger’ for iron. Trends Plant Sci 17: 47–55 [DOI] [PubMed] [Google Scholar]
- Ohta M, Matsui K, Hiratsu K, Shinshi H, Ohme-Takagi M (2001) Repression domains of class II ERF transcriptional repressors share an essential motif for active repression. Plant Cell 13: 1959–1968 [DOI] [PMC free article] [PubMed] [Google Scholar]
- Peng J, Li Z, Wen X, Li W, Shi H, Yang L, Zhu H, Guo H (2014) Salt-induced stabilization of EIN3/EIL1 confers salinity tolerance by deterring ROS accumulation in Arabidopsis. PLoS Genet 10: e1004664. [DOI] [PMC free article] [PubMed] [Google Scholar]
- Pieterse CM, Van der Does D, Zamioudis C, Leon-Reyes A, Van Wees SC (2012) Hormonal modulation of plant immunity. Annu Rev Cell Dev Biol 28: 489–521 [DOI] [PubMed] [Google Scholar]
- Pitzschke A, Forzani C, Hirt H (2006) Reactive oxygen species signaling in plants. Antioxid Redox Signal 8: 1757–1764 [DOI] [PubMed] [Google Scholar]
- Pourcher M, Santambrogio M, Thazar N, Thierry AM, Fobis-Loisy I, Miège C, Jaillais Y, Gaude T (2010) Analyses of sorting nexins reveal distinct retromer-subcomplex functions in development and protein sorting in Arabidopsis thaliana. Plant Cell 22: 3980–3991 [DOI] [PMC free article] [PubMed] [Google Scholar]
- Ranieri A, Castagna A, Baldan B, Soldatini GF (2001) Iron deficiency differently affects peroxidase isoforms in sunflower. J Exp Bot 52: 25–35 [PubMed] [Google Scholar]
- Ravet K, Reyt G, Arnaud N, Krouk G, Djouani B, Boucherez J, Briat JF, Gaymard F (2012) Iron and ROS control of the DownSTream mRNA decay pathway is essential for plant fitness. EMBO J 31: 175–186 [DOI] [PMC free article] [PubMed] [Google Scholar]
- Ravet K, Touraine B, Boucherez J, Briat JF, Gaymard F, Cellier F (2009) Ferritins control interaction between iron homeostasis and oxidative stress in Arabidopsis. Plant J 57: 400–412 [DOI] [PubMed] [Google Scholar]
- Rentel MC, Knight MR (2004) Oxidative stress-induced calcium signaling in Arabidopsis. Plant Physiol 135: 1471–1479 [DOI] [PMC free article] [PubMed] [Google Scholar]
- Reyt G, Boudouf S, Boucherez J, Gaymard F, Briat JF (2015) Iron- and ferritin-dependent reactive oxygen species distribution: impact on Arabidopsis root system architecture. Mol Plant 8: 439–453 [DOI] [PubMed] [Google Scholar]
- Rizhsky L, Davletova S, Liang H, Mittler R (2004) The zinc finger protein Zat12 is required for cytosolic ascorbate peroxidase 1 expression during oxidative stress in Arabidopsis. J Biol Chem 279: 11736–11743 [DOI] [PubMed] [Google Scholar]
- Robinson NJ, Procter CM, Connolly EL, Guerinot ML (1999) A ferric-chelate reductase for iron uptake from soils. Nature 397: 694–697 [DOI] [PubMed] [Google Scholar]
- Römheld V, Marschner H (1986) Mobilization of iron in the rhizosphere of different plant species. Adv Plant Nutr 2: 155–204 [Google Scholar]
- Sakamoto H, Araki T, Meshi T, Iwabuchi M (2000) Expression of a subset of the Arabidopsis Cys(2)/His(2)-type zinc-finger protein gene family under water stress. Gene 248: 23–32 [DOI] [PubMed] [Google Scholar]
- Séguéla M, Briat JF, Vert G, Curie C (2008) Cytokinins negatively regulate the root iron uptake machinery in Arabidopsis through a growth-dependent pathway. Plant J 55: 289–300 [DOI] [PubMed] [Google Scholar]
- Shin R, Berg RH, Schachtman DP (2005) Reactive oxygen species and root hairs in Arabidopsis root response to nitrogen, phosphorus and potassium deficiency. Plant Cell Physiol 46: 1350–1357 [DOI] [PubMed] [Google Scholar]
- Sivitz A, Grinvalds C, Barberon M, Curie C, Vert G (2011) Proteasome-mediated turnover of the transcriptional activator FIT is required for plant iron-deficiency responses. Plant J 66: 1044–1052 [DOI] [PubMed] [Google Scholar]
- Sudre D, Gutierrez-Carbonell E, Lattanzio G, Rellán-Álvarez R, Gaymard F, Wohlgemuth G, Fiehn O, Alvarez-Fernández A, Zamarreño AM, Bacaicoa E, et al. (2013) Iron-dependent modifications of the flower transcriptome, proteome, metabolome, and hormonal content in an Arabidopsis ferritin mutant. J Exp Bot 64: 2665–2688 [DOI] [PMC free article] [PubMed] [Google Scholar]
- Sun B, Jing Y, Chen K, Song L, Chen F, Zhang L (2007) Protective effect of nitric oxide on iron deficiency-induced oxidative stress in maize (Zea mays). J Plant Physiol 164: 536–543 [DOI] [PubMed] [Google Scholar]
- Tao Q, Guo D, Wei B, Zhang F, Pang C, Jiang H, Zhang J, Wei T, Gu H, Qu LJ, et al. (2013) The TIE1 transcriptional repressor links TCP transcription factors with TOPLESS/TOPLESS-RELATED corepressors and modulates leaf development in Arabidopsis. Plant Cell 25: 421–437 [DOI] [PMC free article] [PubMed] [Google Scholar]
- Tsukagoshi H, Busch W, Benfey PN (2010) Transcriptional regulation of ROS controls transition from proliferation to differentiation in the root. Cell 143: 606–616 [DOI] [PubMed] [Google Scholar]
- Vanderauwera S, Zimmermann P, Rombauts S, Vandenabeele S, Langebartels C, Gruissem W, Inzé D, Van Breusegem F (2005) Genome-wide analysis of hydrogen peroxide-regulated gene expression in Arabidopsis reveals a high light-induced transcriptional cluster involved in anthocyanin biosynthesis. Plant Physiol 139: 806–821 [DOI] [PMC free article] [PubMed] [Google Scholar]
- Vert G, Grotz N, Dédaldéchamp F, Gaymard F, Guerinot ML, Briat JF, Curie C (2002) IRT1, an Arabidopsis transporter essential for iron uptake from the soil and for plant growth. Plant Cell 14: 1223–1233 [DOI] [PMC free article] [PubMed] [Google Scholar]
- Vert GA, Briat JF, Curie C (2003) Dual regulation of the Arabidopsis high-affinity root iron uptake system by local and long-distance signals. Plant Physiol 132: 796–804 [DOI] [PMC free article] [PubMed] [Google Scholar]
- Vogel JT, Zarka DG, Van Buskirk HA, Fowler SG, Thomashow MF (2005) Roles of the CBF2 and ZAT12 transcription factors in configuring the low temperature transcriptome of Arabidopsis. Plant J 41: 195–211 [DOI] [PubMed] [Google Scholar]
- Wang HY, Klatte M, Jakoby M, Bäumlein H, Weisshaar B, Bauer P (2007) Iron deficiency-mediated stress regulation of four subgroup Ib BHLH genes in Arabidopsis thaliana. Planta 226: 897–908 [DOI] [PubMed] [Google Scholar]
- Wang N, Cui Y, Liu Y, Fan H, Du J, Huang Z, Yuan Y, Wu H, Ling HQ (2013) Requirement and functional redundancy of Ib subgroup bHLH proteins for iron deficiency responses and uptake in Arabidopsis thaliana. Mol Plant 6: 503–513 [DOI] [PubMed] [Google Scholar]
- Weijers D, Schlereth A, Ehrismann JS, Schwank G, Kientz M, Jürgens G (2006) Auxin triggers transient local signaling for cell specification in Arabidopsis embryogenesis. Dev Cell 10: 265–270 [DOI] [PubMed] [Google Scholar]
- Winterbourn CC. (1995) Toxicity of iron and hydrogen peroxide: the Fenton reaction. Toxicol Lett 82-83: 969–974 [DOI] [PubMed] [Google Scholar]
- Xia XJ, Zhou YH, Shi K, Zhou J, Foyer CH, Yu JQ (2015) Interplay between reactive oxygen species and hormones in the control of plant development and stress tolerance. J Exp Bot 66: 2839–2856 [DOI] [PubMed] [Google Scholar]
- Yadav RK, Fulton L, Batoux M, Schneitz K (2008) The Arabidopsis receptor-like kinase STRUBBELIG mediates inter-cell-layer signaling during floral development. Dev Biol 323: 261–270 [DOI] [PubMed] [Google Scholar]
- Yang Y, Ou B, Zhang J, Si W, Gu H, Qin G, Qu LJ (2014) The Arabidopsis Mediator subunit MED16 regulates iron homeostasis by associating with EIN3/EIL1 through subunit MED25. Plant J 77: 838–851 [DOI] [PubMed] [Google Scholar]
- Yuan Y, Wu H, Wang N, Li J, Zhao W, Du J, Wang D, Ling HQ (2008) FIT interacts with AtbHLH38 and AtbHLH39 in regulating iron uptake gene expression for iron homeostasis in Arabidopsis. Cell Res 18: 385–397 [DOI] [PubMed] [Google Scholar]
- Yuan YX, Zhang J, Wang DW, Ling HQ (2005) AtbHLH29 of Arabidopsis thaliana is a functional ortholog of tomato FER involved in controlling iron acquisition in strategy I plants. Cell Res 15: 613–621 [DOI] [PubMed] [Google Scholar]
- Zhang J, Zhu HF, Liang H, Liu KF, Zhang AM, Ling HQ, Wang DW (2006) Further analysis of the function of AtBHLH29 in regulating the iron uptake process in Arabidopsis thaliana. J Integr Plant Biol 48: 75–84 [Google Scholar]
- Zhang Y, Wu H, Wang N, Fan H, Chen C, Cui Y, Liu H, Ling HQ (2014) Mediator subunit 16 functions in the regulation of iron uptake gene expression in Arabidopsis. New Phytol 203: 770–783 [DOI] [PubMed] [Google Scholar]