Abstract
Structured illumination microscopy (SIM) is an established technique that allows sub-diffraction resolution imaging by heterodyning high sample frequencies into the system’s passband via structured illumination. However, until now, SIM has been typically used to achieve sub-diffraction resolution for intensity-based imaging. Here, we present a novel optical setup that uses structured illumination with a broadband-light source to obtain noise-reduced, sub-diffraction resolution, quantitative-phase (QPM) imaging of cells. We compare this with a previous work for sub-diffraction QPM imaging via SIM that used a laser source, and was thus still corrupted by coherent noise.
In optical microscopy, the diffraction limit presents a physical limit to the maximum achievable imaging resolution assuming an aberration-free optical system. For biological imaging, however, this diffraction limit itself is not enough to image many of the finer biological features of the sample. For such cases, there is a direct need to obtain sub-diffraction resolution. Such a need has been recently addressed by a set of “super-resolution” techniques that has found great impact in fluorescent microscopy, and allows visualization of sample features well beyond the diffraction limit by either single-molecule detection, such as in STORM and PALM, or spatially modulated excitation, such as in STED, GSD, and SIM [1–3]. However, such super-resolution techniques require fluorescent samples, and are thus ill suited for samples that are either not fluorescent or cannot be easily fluorescently tagged. To this end, synthetic aperture techniques allow sub-diffraction resolution imaging of non-fluorescent, diffractive samples by acquiring multiple electric-field maps of the sample taken at different illumination angles. Different regions of the sample’s spatial frequency spectrum are covered by each illumination angle, and taken together, an effective optical passband larger than the system’s physical one can be synthesized [4–8]. We introduce a variant of synthetic aperture microscopy that borrows from structured illumination microscopy (SIM) to obtain sub-diffraction resolution imaging of non-fluorescent samples.
Our intended samples to image are unstained cells, which are largely transparent. Several quantitative phase imaging (QPM) techniques have been described previously which provide high contrast visualization of endogenous cellular structures with minimal sample preparation [9–12]. These are distinguished from conventional phase contrast techniques, such as Zernike’s phase-contrast and differential interference contrast (DIC) microscopies, by allowing quantitative reconstruction of optical phase fronts, which in turn allows fast 3D imaging via digital refocusing, determination of feature heights with nanometer accuracy, and measurements of refractive index. However, due to the coherent laser illumination sources typically used in QPM, previous works on this topic suffer from 1) a smaller diffraction resolution limit, compared to its conventional (incoherent) counterparts, as well as 2) fixed coherent noise artifacts arising from stray interferences from imperfections in the optical system [13]. We have recently presented SI-QPM as a technique that uses synthetic aperture via structured illumination to extend all the capabilities of QPM to sub-diffraction levels and regain the resolution lost due to the smaller coherent diffraction limit [14]. We now present a novel extension of SI-QPM that dramatically reduces the coherent imaging artifacts, thus offering superior phase imaging ability. We coin this new technique as structured illumination diffraction phase microscopy (SI-DPM)
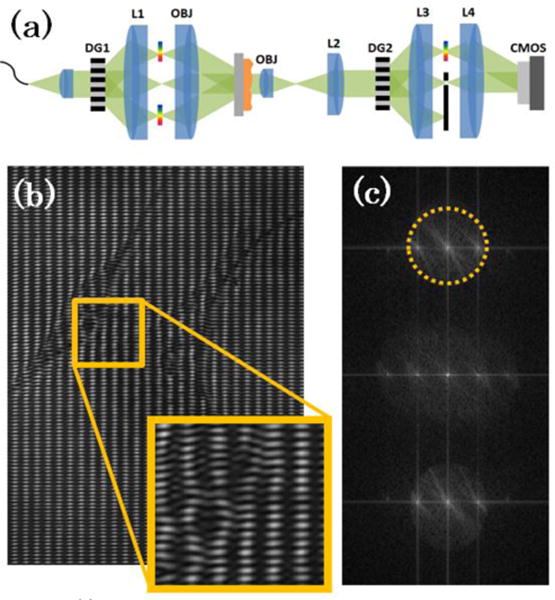
In Figure 1(a) below, we show our system schematic. We note that this system is fundamentally different from SI-QPM and borrows heavily from white-light diffraction phase microscopy [12] in its use of a common-path reference wave for temporally stable off-axis interference and a broadband laser illumination source for reduced coherent noise. Broadband illumination from a singlemode super-continuum source (NKT Photonics, EXW-6) was collimated, spectrally filtered (specific bandwidths of illumination are given later), and transmitted through a diffraction grating (DG1, Edmund Optics, 50 lpmm). The resulting +/−1 and 0 orders from DG1 were imaged onto the sample via a 4f lens system (L1 → OBJ) to create the structured pattern that later allows for subdiffraction resolution reconstruction. Note that, in contrast to previous SIM methods, the 0th order is not blocked and all non-0 orders exhibit spectral spreading in the Fourier planes of the grating. The sample with the structured pattern overlay is then imaged via a second 4f lens system (OBJ → L2) onto a second diffraction grating (DG2, Edmund Optics, 100 lpmm). The diffraction orders emerging from DG2 are sent through a third 4f lens system (L3 → L4), where a pinhole in the Fourier plane spatially filters the 0th order, passes the whole spectral spread of the +1 order, and blocks all other orders. The +1 order, containing the sample information, is then interfered with the filtered 0th order, which now acts as the reference wave for off-axis holography. In Figure 1 (b) and (c), we show an example of a raw interferogram and its associated Fourier spectrum, respectively. Note the inset in Fig 2(b), which shows the spatial frequencies from the structured illumination pattern competing with those from the off-axis interference with the reference wave. The sample field information is retrieved by digitally filtering the region outlined in dashed yellow in Fig. 1(c), DC centering, and inverse Fourier transforming. Because of broadband illumination, SI-DPM has superior coherent noise rejection than SI-QPM, thus offering superior spatial phase sensitivity. We note that simply inserting a broadband source into the SI-QPM setup would not be a feasible solution for reduced coherent noise imaging because of the dramatic decrease in the usable field-of-view (FOV), as was shown in simulation for a source with even a 5 nm bandwidth [10]. The common-path setup of the SI-DPM technique, apart from allowing high temporal phase stability, is crucial for allowing broadband illuminated phase reconstruction over large FOV.
Fig. 1.

(a) Optical schematic for structured illumination diffraction phase microscopy (SI-DPM) system. (b) Raw interferogram taken of endothelial progenitor cells shows the structured illumination pattern overlayed on the carrier spatial frequency. (c) Fourier transform of raw interference pattern is shown with region of frequency-space to be filtered and DC centered outlined by dashed yellow circle.
Fig. 2.

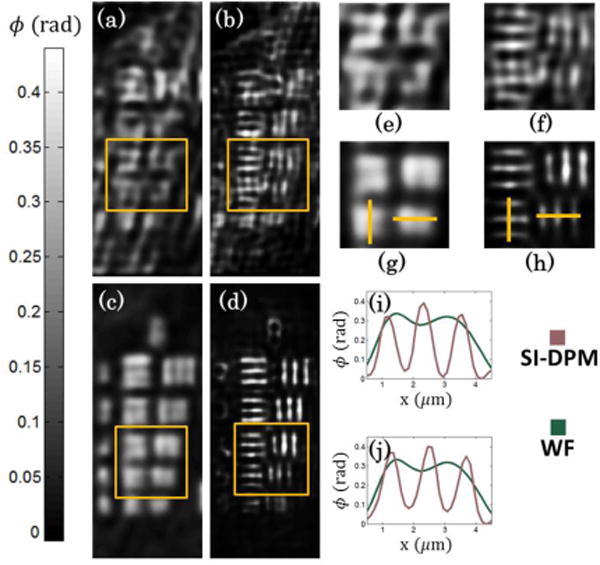
Quantitative phase images using (a,b) laser illumination and (c,d) broadband illumination. (a,c) Diffraction-limited images are also compared to (b,d) enhanced resolution images. (e,f,g,h) Close-ups of Group 8 El 4–5 from (a,b,c,d) respectively. (i,j) vertical and horizontal cross cuts from diffraction-limited (WF) and SI-DPM images in (g,h), respectively.
The image field reconstructed via off-axis digital holographic processing is given by
| (1) |
where is the 2D spatial coordinate vector, is the image at the camera, is the sample’s complex transmittance, is the illumination field at the sample, is the system’s coherent point spread function, and is the convolution operator. Fourier transforming Eq. (1) leads to
| (2) |
where is the spatial coordinate vector, are the Fourier transforms of respectively, and is defined as the system’s transfer function. In the case of plane wave illumination, , , and Eq. (2) becomes a spatially low pass filtering equation, , and sets the system’s diffraction limit by rejecting all spatial frequencies with magnitude beyond some cutoff, say .
In the case of SI-DPM, where the +/−1 and 0 diffraction orders from DG1 interfere at the sample, the illumination field is , where is the illumination’s frequency vector, and is the modulation depth of the pattern. Fourier transforming and substituting into Eq. (2), a single acquisition will have a Fourier distribution of the form,
| (3) |
Thus, a single raw acquisition is a superposition of diffraction-limited information and sub-diffraction content, incorporated into terms and , which are frequency shifted into the system’s passband. As in conventional SIM, SI-DPM phase-steps to linearly solve for , , and before demodulating them back to their appropriate positions in Fourier space. Rotating allows reconstruction of the final image with isotropic sub-diffraction resolution. For the experimental results below, the final sub-diffraction resolution reconstructions use two orthogonal rotations with 3 phase steps per rotation. Sub-diffraction resolution phase imaging via SI-DPM (broadband illumination) is compared to that via SI-QPM (laser illumination) and the increase in image quality is emphasized.
We first show phase imaging of a calibration target, taken with a 10x imaging objective (Newport, NA 0.25). We compare diffraction-limited and sub-diffraction resolution imaging with laser illumination (λ = 632 nm) and broadband illumination (λ = 632 ± 10 nm). In both cases, the diffraction limited resolution is 2.0 μm. With structured illumination, the maximum achievable resolution is enhanced by a factor of two over the diffraction limit to 1.0 μm. The target was a transparent PDMS mold ( ) of the surface of a high-res USAF test chart (Edmund Optics), mounted in air ( ). The chrome deposits on the USAF test chart are high, and leave imprints in the PDMS mold. Thus, the PDMS mold acts as a calibrated phase target, where the imprints are the phase features of interest. The expected phase delay imparted by these features is . In Figure 2 below, we compare the quantitative phase images under laser illumination (Figure 2(a,b)) with those under broadband illumination (Figure 2(c,d)). Figures 2(a,c) are typical diffraction-limited phase images but Figures 2(b,d) are specifically the sub-diffraction resolution reconstructions via SI-QPM and SI-DPM, respectively. Close up views of the Group 8 Elements 4–5 in Figure 2(a,b,c,d) are shown in Figure 2(e,f,g,h), respectively. As seen, images taken with broadband illumination show far superior quality compared to their counterparts taken with laser illumination, which are significantly corrupted by coherent noise such as speckle or Airy patterns from imperfections in the system. The benefits of SI-DPM over SI-QPM are especially visible when comparing Figures 2(f,h) – the coherent artifacts from laser illumination are indistinguishable from the actual features on the sample (assuming no prior knowledge of sample structure) because they both impart comparable phase delays to the image. Thus, though the sample features theoretically lie within the frequency support of the enhanced resolution image, they require low phase noise for visualization and are effectively irresolvable with laser illumination. The variance of phase noise is decreased from 0.06 rad in the case of SI-QPM to 0.001 rad in the case of SI-DPM. We note that the phase noise can be further decreased if broader illumination bandwidth is used. Figures 2(i,j) compare diffraction-limited (WF) and SI-DPM cross cut phase profiles from Figures 2(g,h) that demonstrate sample path lengths with phase differences well matched with the expected .
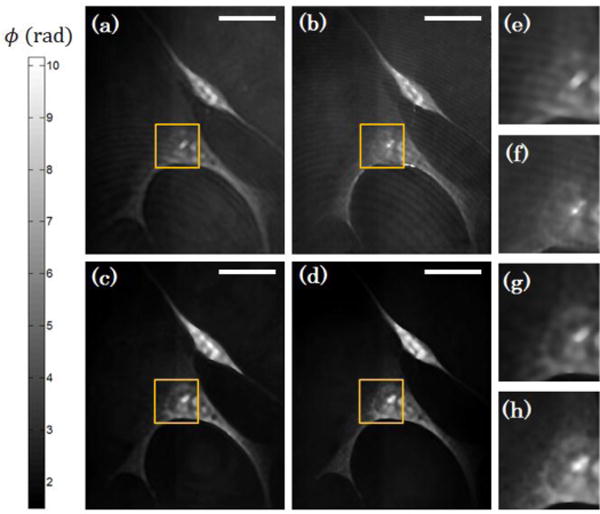
Figure 3 below demonstrates SI-DPM in imaging endothelial progenitor cells (EPC). We used a 20× imaging objective (Newport, NA 0.4), resulting in a diffraction limited resolution of 1.2 μm. Scale bars in the upper right correspond to 10 um. Due to their high transmittance and low absorption, these cells act as biologically relevant phase samples. Figure 3 compares diffraction limited and sub-diffraction resolution phase imaging of the cells under laser and broadband illumination conditions. As expected, much of the coherent noise in Figures 3(a,b) is suppressed, leading to much cleaner phase images in Figures 3(c,d). Figures 3(e,f,g,h) show zoomed-in views of a select intracellular region-of-interest (ROI) from Figures 3(a,b,c,d), respectively, that allow close inspections of the image quality near the nucleus of an EPC. We note that in the diffraction-limited and sub-diffraction resolution images via laser illumination (Figures 3(e,f)), a significant contribution to the overall signal is the Airy rings from imperfections in the optical system. Especially in Figure 3f, much of the sub-diffraction resolution information is drowned out by the coherent noise background. In contrast, Figure 3h shows significant decrease in coherent noise via broadband illumination and allows easy and high contrast visualization of many of the sub-diffraction resolution features.
Fig. 3.

Quantitative phase images of endothelial progenitor cells using (a,b) broadband and (c,d) laser illumination. (a,c) Diffraction-limited images are also shown and compared to (b,d) sub-diffraction resolution images. Insets outlined in yellow shown in (a,b,c,d) are magnified and shown in (e,f,g,h), respectively. Scale bar on top right corresponds to 10 μm.
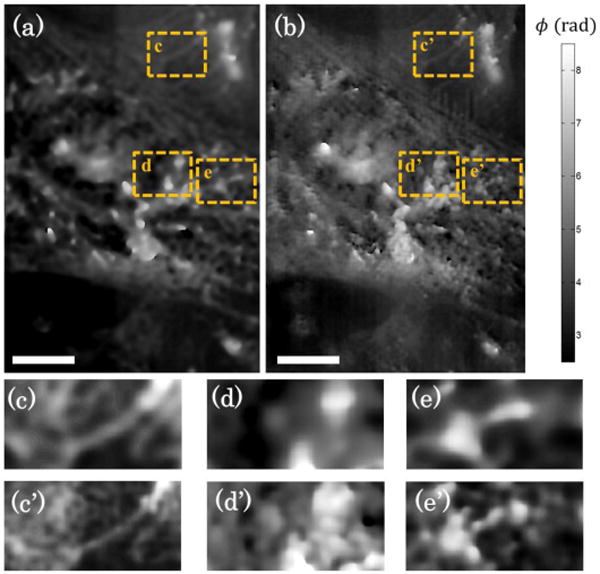
Another example of SI-DPM is shown in Fig. 4 that emphasizes the effects of sub-diffraction resolution in the presence of reduced coherent noise. Mesenchymal stem cells were imaged under blue broadband (450 ± 20 nm) illumination with a 40× imaging objective (Zeiss, NA 0.6). These cells were isolated from umbilical cord blood obtained from the Carolina Cord Blood Bank at Duke University following policies set by the Duke University Institutional Review Board. The cells were seeded using a density of 50 × 104 cells/cm2 on 4-well glass chambers (Lab-Tek), incubated with 3.3 μg/ml of fibronectin for one hour prior to seeding, and cultured in Minimum Essential Medium Alpha Medium (Gibco) supplemented with 20% fetal bovine serum, 1% antibiotic-antimycotic solution, and 1% L-Glutamine. After 48 hours of culture, the cells were fixed with cold methanol for 5 minutes. Figure 4(a,b) below compares diffraction-limited and sub-diffraction resolution phase imaging, respectively, of the intracellular components of a single mesenchymal stem cell under broadband illumination. The resulting low coherent noise allows clear comparisons of the resolution improvements when comparing between Figure 4a and 4b, where the resolution enhancement in 4b allows clear and high-contrast visualization of sub-diffraction features with less than 0.1 radians of phase shift. With laser illumination, such slight shifts would be significantly corrupted by coherent noise. Close-up views are shown for three select regions-of-interest (ROIs) that highlight the enhanced visualization capability for intracellular structures. ROIs shown in Figures 4(c,c’), 4(d,d’), and 4(e,e’) compare the diffraction-limited and sub-diffraction resolution images of an extension of the cellular matrix, boundary of the cell nucleus, and a cluster of cellular protein, respectively. In all cases, the benefits of sub-diffraction resolution imaging are evident, and are possible mainly due to reduced coherent noise.
Fig. 4.

Quantitative phase images of mesenchymal stem cells using broadband illumination are shown. (a) Diffraction-limited images are compared to (b) sub-diffraction resolution images. Select regions-of-interest are compared between the (c,d,e) diffraction-limited image and (c’,d’,e’) sub-diffraction resolution image. Scale bar on bottom left corresponds to 5 μm
We now mention an important point about coherent-noise reduction – although we reduce noise primarily through broadband illumination, one could also achieve comparable noise reductions (and resolution improvements) with monochromatic light through increased angular incidences at the sample. However, such techniques would require acquiring many raw images with varying illumination angles for an acceptable level of coherent noise reduction, most of which would be unnecessary from the point of view of resolution enhancement. Previous reports using such technologies have synthesized final noise-reduced, resolution enhanced, images from ~100 raw acquisitions [7, 9]. Because our system uses broadband illumination as the main work-horse for noise reduction, we can achieve similar results with only 4–6 raw acquisitions (as is done in conventional SIM). Thus, especially for studies regarding the biological dynamics of living cells, this technique could allow all the benefits of faster acquisition.
In summary, this work introduces SI-DPM as a technique to get sub-diffraction resolution phase imaging with broadband illumination, which dramatically reduces coherent noise and thus allows better phase sensitivity. This allows high contrast, sub-diffraction resolution, quantitative visualization of phase structures imparting phase shifts on the order of nanometers. Furthermore, this high-contrast visualization is accomplished without use of any extrinsic contrast agents and comes from purely the intrinsic optical path delays in the cell due to cellular structure.
This project was funded by NSF Grant CBET-0933059 and NIH Grant T32 EB001040. We would also like to thank Erica Brown Peters and Professor Jennifer West for assistance in selection and preparation of the endothelial progenitor and mesenchymal stem cell samples.
References
- 1.Gustafsson MG. Surpassing the lateral resolution limit by a factor of two using structured illumination microscopy. J Micros. 2000;198:82–87. doi: 10.1046/j.1365-2818.2000.00710.x. [DOI] [PubMed] [Google Scholar]
- 2.Hell SW, Wichmann J. Breaking the diffraction resolution limit by stimulated emission: stimulated-emission-depletion fluorescence microscopy. J Opt Lett. 1994;19:780–782. doi: 10.1364/ol.19.000780. [DOI] [PubMed] [Google Scholar]
- 3.Huang B, Bates M, Zhuang X. Super-Resolution Fluorescence Microscopy. Annu Rev Biochem. 2009;78:993–1016. doi: 10.1146/annurev.biochem.77.061906.092014. [DOI] [PMC free article] [PubMed] [Google Scholar]
- 4.Lukosz W. Optical Systems with Resolving Powers Exceeding the Classical Limit. J Opt Soc Am. 1966;56(11):1463–1471. [Google Scholar]
- 5.Sun P, Leith E. Superresolution by spatial-temporal encoding methods. Appl Opt. 1992;31:4857–4862. doi: 10.1364/AO.31.004857. [DOI] [PubMed] [Google Scholar]
- 6.Chowdhury S, Dhalla A, Izatt J. Structured oblique illumination microscopy for enhanced resolution imaging of non-fluorescent, coherently scattering samples. Biomed Opt Express. 2012;3:1841–1854. doi: 10.1364/BOE.3.001841. [DOI] [PMC free article] [PubMed] [Google Scholar]
- 7.Park Y, Choi W, Yaqoob Z, Dasari R, Badizadegan K, Feld M. Speckle-field digital holographic microscopy. Opt Express. 2009;17:12285–12292. doi: 10.1364/oe.17.012285. [DOI] [PMC free article] [PubMed] [Google Scholar]
- 8.von Olshausen P, Rohrbach A. Coherent total internal reflection dark-field microscopy: label-free imaging beyond the diffraction limit. Opt Lett. 2013;38:4066–4069. doi: 10.1364/OL.38.004066. [DOI] [PubMed] [Google Scholar]
- 9.Kim M, Choi Y, Fang-Yen C, Sung Y, Dasari R, Feld M, Choi W. High-speed synthetic aperture microscopy for live cell imaging. Opt Lett. 2011;36:148–150. doi: 10.1364/OL.36.000148. [DOI] [PMC free article] [PubMed] [Google Scholar]
- 10.Rinehart M, Zhu Y, Wax A. Quantitative phase spectroscopy. Biomed Opt Express. 2012;3:958–965. doi: 10.1364/BOE.3.000958. [DOI] [PMC free article] [PubMed] [Google Scholar]
- 11.Charrière F, Marian A, Montfort F, Kuehn J, Colomb T, Cuche E, Marquet P, Depeursinge C. Cell refractive index tomography by digital holographic microscopy. Opt Lett. 2006;31:178–180. doi: 10.1364/ol.31.000178. [DOI] [PubMed] [Google Scholar]
- 12.Bhaduri B, Pham H, Mir M, Popescu G. Diffraction phase microscopy with white light. Opt Lett. 2012;37:1094–1096. doi: 10.1364/OL.37.001094. [DOI] [PubMed] [Google Scholar]
- 13.Goodman JW. Introduction to Fourier Optics. Mc-Graw-Hill; New York: 1968. [Google Scholar]
- 14.Chowdhury S, Izatt J. Structured illumination quantitative phase microscopy for enhanced resolution amplitude and phase imaging. Biomed Opt Express. 2013;4:1795–1805. doi: 10.1364/BOE.4.001795. [DOI] [PMC free article] [PubMed] [Google Scholar]


