

Abstract
Aberrant transcription induced by DNA damage may confer risk for the development of cancer and other human diseases. Traditional methods for measuring lesion-induced transcriptional alterations often involve extensive colony screening and DNA sequencing procedures. Here we describe a protocol for the quantitative assessment of the effects of DNA lesions on the efficiency and fidelity of transcription in vitro and in mammalian cells. The method is also amenable to investigating the influence of specific DNA repair proteins on the biological response toward DNA damage during transcription by manipulating their gene expression. Specifically, we present detailed, step-by-step procedures, including DNA template preparation, in vitro and in vivo transcription, RNA purification, reverse-transcription PCR (RT-PCR) and restriction digestion of RT-PCR products. Analyses of restriction fragments of interest are performed by liquid chromatography–tandem mass spectrometry (LC-MS/MS) and polyacrylamide gel electrophoresis (PAGE). The entire procedure described in this protocol can be completed in 15–20 d.
INTRODUCTION
The human genome is constantly threatened by multiple types of environmental and endogenous DNA-damaging agents. Unrepaired DNA damage may compromise DNA replication and transcription and elicit cytotoxic and mutagenic effects, which may eventually contribute to the development of cancer and other human diseases1–5. Most of the cells in the body exist in a slow-cycling or quiescent state, in which they exhibit very slow or no DNA replication. In these cells, it is of greater concern to understand how DNA damage interferes with the flow of genetic information during DNA transcription1,2. To address this question, suitable methods for measuring the effects of DNA lesions on transcription are required.
Development of the protocol
Traditionally, lesion-induced perturbations on transcription can be determined by PAGE analysis of the in vitro transcription products of a lesion-bearing DNA template, or by in vivo measurement of the biochemical activity of a reporter gene containing a site-specific lesion in its transcribed strand. These conventional assays, however, often require extensive colony screening and Sanger sequencing for providing statistically robust information about the identities and frequencies of mutations induced during transcription1,6,7.
We recently developed a competitive transcription and adduct bypass (CTAB) assay to quantitatively assess how a site-specifically incorporated DNA lesion compromises the efficiency and fidelity of transcription in vitro and in mammalian cells8 (Fig. 1). The CTAB method is based on RT-PCR amplification of RNA products that result from competitive transcription of lesion-bearing or lesion-free control plasmids together with a nonlesion competitor vector in the same reaction. This is followed by PAGE and LC-MS/MS analyses of short DNA fragments released from the restriction digestion of RT-PCR products8. This method was inspired by the lesion bypass and mutagenesis assays that have been successfully used for determining the effects of DNA lesions on replication in Escherichia coli cells9–12, and it has been used for determining the effects of a variety of DNA lesions on transcription in vitro and in mammalian cells8,13–16.
Figure 1.
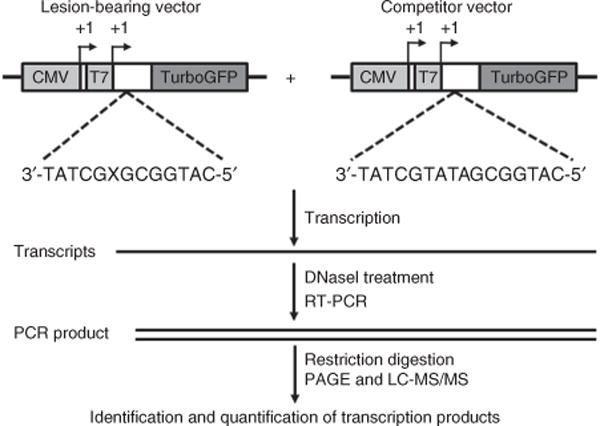
A schematic diagram illustrating the CTAB assay system. ‘X’ indicates a lesion base or the corresponding unmodified base, which is located on the transcribed strand of the TurboGFP gene downstream of the CMV and T7 promoters. The arrowheads indicate the +1 transcription start sites of the CMV and T7 promoters. Adapted from You et al.15, Transcriptional inhibition and mutagenesis induced by N-nitroso compound– derived carboxymethylated thymidine adducts in DNA. Nucleic Acids Res. (2015) 43, 1012–1018, by permission of Oxford University Press.
Overview of the procedure
Here we describe the application of the CTAB method for assessing the effects of the N-nitroso compound–derived lesions, including N3- and O4-carboxymethylthymidine (N3-CMdT and O4-CMdT; Fig. 2), on DNA transcription as a representative procedure15. We first site-specifically incorporate a single DNA lesion into the transcribed strand of a nonreplicating double-stranded plasmid using the gapped vector–based strategy (Fig. 3a,b). Briefly, we nick a parent vector (i.e., pTGFP-T7-Hha10T) with Nt.BstNBI (Fig. 4a,b), followed by removing the 25-mer oligodeoxyribonucleotide (ODN) from the nicked plasmid to generate a gapped vector. We ligate the gapped vector with a 13-mer lesion-free ODN (5′-AATTGAGTCGATG-3′) and a 12-mer lesion-carrying ODN (5′-ATGGCGXGCTAT-3′, where X = N3-CMdT, O4-CMdT or dT)17. We then purify the supercoiled plasmid DNA from the ligation mixture by agarose gel electrophoresis in the presence of ethidium bromide. We subsequently premix the lesion-bearing or lesion-free control plasmid with a competitor vector (i.e., pTGFP-T7-Hha10comp; Fig. 4a,b) and use them as DNA templates for transcription assays in vitro and in cells. We then purify the resulting transcription products and remove residual DNA contamination by DNase treatment. Next, we amplify the transcripts of interest by RT-PCR, digest the RT-PCR products with appropriate restriction enzymes and subject the restriction fragments to PAGE and LC-MS/MS analyses (Fig. 1).
Figure 2.
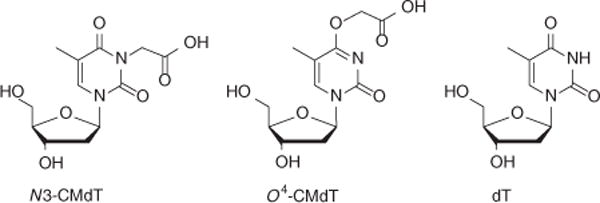
Chemical structures of N3-CMdT, O4-CMdT and dT. Adapted from You et al.15, Transcriptional inhibition and mutagenesis induced by N-nitroso compound–derived carboxymethylated thymidine adducts in DNA. Nucleic Acids Res. (2015) 43, 1012–1018, by permission of Oxford University Press.
Figure 3.
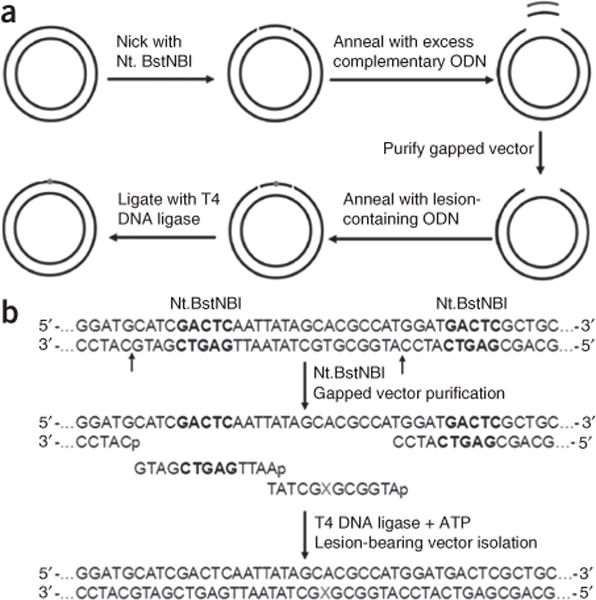
Construction of lesion-bearing plasmids. (a) A schematic diagram illustrating the procedures for the construction of the plasmids harboring a site-specifically incorporated DNA lesion. (b) Enzymatic digestion and ligation for the insertion of X-bearing ODNs into the gapped vector. ‘X’ indicates dT, N3-CMdT or O4-CMdT. The Nt.BstNBI recognition sequences are highlighted in bold. Adapted from You et al.14, Transcriptional bypass of regioisomeric ethylated thymidine lesions by T7 RNA polymerase and human RNA polymerase II. Nucleic Acids Res. (2014) 42, 13706–13713; and from You et al.15, Transcriptional inhibition and mutagenesis induced by N-nitroso compound–derived carboxymethylated thymidine adducts in DNA. Nucleic Acids Res. (2015) 43, 1012–1018, both by permission of Oxford University Press.
Figure 4.
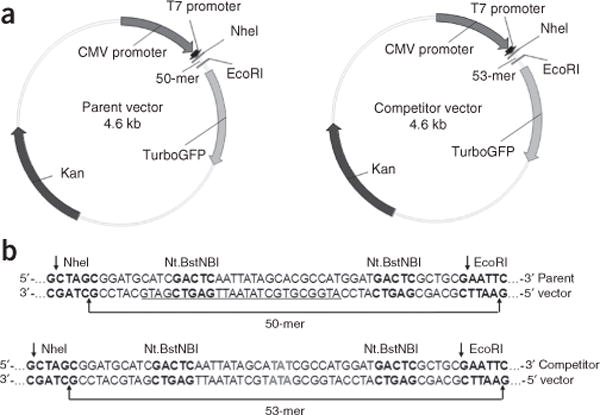
The parent vector and competitor vector used in this study. (a) Plasmid maps of the parent vector (i.e., pTGFP-T7-Hha10T) and the competitor vector (i.e., pTGFP-T7-Hha10comp). (b) Sequences of the parent and competitor vectors between the NheI and EcoRI sites. The recognition sites of Nt.BstNBI, EcoRI and NheI are highlighted in bold. The cleavage sites of EcoRI and NheI are indicated by arrows. The sequence between the cleavage sites of Nt.BstNBI in the parent vector is underlined.
Comparison with other methods
Compared with conventional transcriptional lesion bypass and mutagenesis assays, our CTAB method is more efficient, as it obviates the time-consuming colony screening and sequencing procedures that traditional methods require. The CTAB method enables a rapid and unambiguous identification of mutant transcripts via the incorporation of LC-MS/MS into the workflow. More importantly, the CTAB method uses the entire population of RNA progeny for lesion bypass and mutagenesis analysis, thereby enabling researchers to obtain statistically robust and quantitative conclusions regarding the ability of RNA polymerases to bypass the lesions and induce mutations during the bypass8.
Alternatively, a next-generation sequencing–based host cell reactivation assay was recently introduced for high-throughput measurements of lesion-induced transcriptional alterations and cellular DNA repair capacity18. However, this method requires an advanced computational infrastructure, and it involves comprehensive analysis and interrogation of large volumes of next- generation sequencing data, which is often time-consuming and is sometimes limited by the lack of technical expertise19.
Applications of the method
To date, our CTAB assay has been successfully used to evaluate the transcriptional blocking and miscoding potentials of 14 distinct DNA lesions, including alkylative and oxidative damage, and so on8,13–16. As an example, we have recently observed that N3-CMdT and O4-CMdT substantially inhibited DNA transcription and induced transcriptional mutagenesis in vitro and in mammalian cells by using the CTAB assay18 (Fig. 5). More importantly, our method can also be used to assess the influence of various repair proteins on the biological response toward DNA damage during transcription by manipulating their gene expression8,13–16. For example, we found that depletion of XPA, a key protein factor involved in the nucleotide excision repair pathway, exacerbated the deleterious effects of N3-CMdT and O4-CMdT on transcription in human cells16 (Fig. 5d–f).
Figure 5.
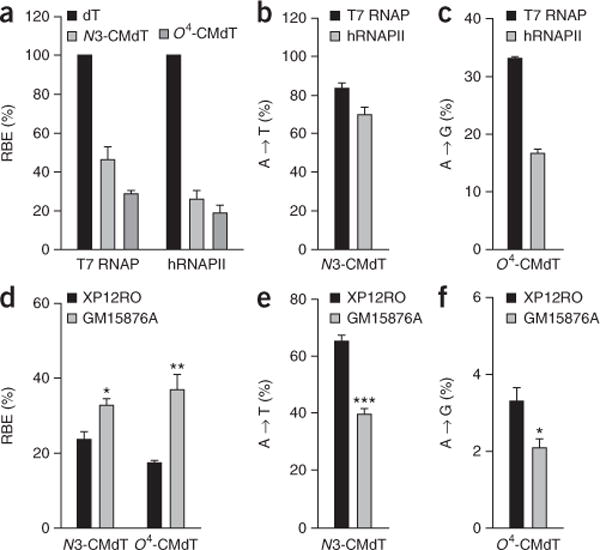
Transcriptional alterations induced by N3-CMdT and O4-CMdT. (a) The relative bypass efficiency (RBE) values of N3-CMdT and O4-CMdT in in vitro transcription systems. (b,c) Mutagenic properties of N3-CMdT (b) and O4-CMdT (c) in in vitro transcription systems. (d) The RBE values of N3-CMdT and O4-EtdT in XPA-deficient XP12RO and XPA-complemented GM15876A cells. (e,f) Mutagenic properties of N3-CMdT (e) and O4-CMdT (f) in XP12RO and GM15876A cells. The data represent the mean ± s.e.m. of results from three independent experiments. *P < 0.05, **P < 0.01 and ***P < 0.001. The P values were calculated by using unpaired two-tailed Student’s t-test. Adapted from You et al.15, Transcriptional inhibition and mutagenesis induced by N-nitroso compound–derived carboxymethylated thymidine adducts in DNA. Nucleic Acids Res. (2015) 43, 1012–1018, by permission of Oxford University Press.
The CTAB method can be generally applied for the quantitative determination of the effects of other DNA lesions on transcription in vitro and in cells, and for the identification of the repair pathway(s) that may be involved in the removal of these DNA lesions in cells. This method can be further adapted for clinical diagnosis by testing the ability of human cells to repair DNA damage, and for drug development by screening new chemotherapeutic agents that can inhibit or enhance the DNA repair capacity in human cells.
So far, we have used the CTAB method for examining the effects of DNA lesions on transcription mediated by T7 RNA polymerase and mammalian RNA polymerase II (refs. 8,13–16). However, this method can be used to examine how DNA lesions compromise the flow of genetic information during transcription mediated by RNA polymerases from other organisms, with the use of suitable lesion-bearing DNA templates that contain specific promoter sequences of these RNA polymerases.
Experimental design
Transcription template
As a general rule, all transcription templates used for the CTAB assay should not contain any mammalian replication origins and should not replicate in mammalian cells. This allows us to exclusively determine the effects of DNA lesions on transcription in mammalian cells. The competitor vector is designed to be identical to the lesion-free control plasmid, except for the presence of three additional nucleotides between the two restriction sites used for the CTAB assay (Fig. 4a,b). This design enables the output from a single biological experiment to be used for both transcriptional lesion bypass and mutagenesis assays, with the competitor signal (i.e., a restriction fragment arising from the transcription of the competitor vector) acting as an internal standard. The ability of RNA polymerase to bypass a lesion can be determined using the following formula: relative bypass efficiency (RBE) = (lesion signal/competitor signal)/(undamaged control signal/competitor signal). The transcriptional miscoding properties of a lesion can be determined by the relative ratio of the mutant over the sum of mutant and wild-type restriction fragments arising from the lesion-bearing genome8.
Gapped vector–based strategy
One challenging step of the CTAB method is the production of double-stranded DNA vectors that contain site-specifically inserted DNA lesions. The gapped vector–based strategy has been successfully established as an efficient experimental procedure to reach this goal20–22. As an example, we have described the construction of lesion-bearing plasmids, using pTGFP-T7-Hha10T as the parent vector with the help of the nicking endonuclease Nt.BstNBI (Fig. 3a,b). This experimental procedure is versatile, and it can be used for any plasmid that is engineered to contain the tandem recognition sites of Nt.BstNBI or other nicking enzymes in the transcribed strand of an active gene. The incorporation of recognition sites of tandem nicking enzymes enables us to efficiently prepare gapped plasmid DNA for the site-specific incorporation of lesion-containing ODNs20. The length of the gap region can vary depending on the chosen DNA sequence, but the melting temperature of the corresponding gap oligomer should be below 90 °C for preventing the denaturation of the remainder of the plasmid during the partial denaturation and reannealing process22. For a long gap region, it is recommended to fill the gapped vector with a short lesion-bearing ODN and an undamaged ODN. For instance, we used two short oligomers (i.e., a 12-mer lesion-bearing ODN and a 13-mer undamaged ODN), but not a single 25-mer lesion-bearing ODN, for the ligation into the gapped vector (Fig. 3b), because it is relatively easy to synthesize, purify and characterize a short lesion-bearing ODN.
The gapped vector–based strategy can be used for the incorporation of DNA lesions into the untranslated regions, as well as the protein-coding regions21. For instance, this strategy has been recently used to place 8-oxo-7,8-dihydroguanine in the coding region of a plasmid-borne EGFP reporter gene for investigating the mechanism of transcription inhibition induced by this lesion in cells23.
A complementary experimental strategy for the incorporation of a single DNA lesion into the double-stranded plasmid exploits the annealing of a synthetic lesion-bearing oligomer to a circular single-stranded DNA, extension of the lesion-bearing ODN by a DNA polymerase and ligation of the newly synthesized DNA strand24,25. This approach involves tedious and time-consuming preparation of single-stranded phage DNA; however, it is a useful alternative for the construction of lesion-bearing vectors when the parent plasmids are not suitable to be engineered to contain tandem nicking enzyme sites. In addition, an experimental procedure for the construction of plasmids containing site-specific DNA interstrand cross-links has also been developed26.
Controls
To ligate the lesion-bearing ODNs into the gapped vector, it is important to perform a self-ligation reaction without the inclusion of lesion-bearing ODNs. This negative control can be used to detect the potential super-coiled, lesion-free plasmid DNA, which may arise from an incomplete nicking reaction or incomplete removal of gap oligomers from the nicked plasmid. To analyze the potential DNA contamination in the RNA template, it is necessary to include a negative control by PCR amplification of the RNA template in the absence of reverse transcription. It is also useful to include another negative control with no template, as well as a positive control with the parent plasmid as the template DNA for PCR amplification.
Restriction enzymes
The restriction digestion of RT-PCR products is a key feature of the CTAB method, which produces short ODN segments that can be readily identified and quantified by using PAGE and LC-MS/MS8. For example, we have used two sets of restriction enzymes, i.e., NcoI/SfaNI and MlucI/Cac8I, to digest the RT-PCR products for PAGE analysis, which enabled us to distinguish the restriction fragments with a single nucleotide difference at the lesion site15 (Fig. 6). In this regard, with the use of NcoI and SfaNI, we were able to resolve the 32P-labeled d(p*CATGGCGTGCTAT, and p* designates a 32P-labeled phosphate group) (non-mutagenic product, 13-mer T) from the corresponding products carrying an A→C or A→T mutation—i.e., d(p*CATGGCGGGCTAT) (13-mer G) and d(p*CATGGCGGACTAT) (13-mer A); however, the non-mutagenic product co-migrated with the corresponding product carrying an A→G mutation opposite the lesion site, i.e., d(p*CATGGCGCGCTAT) (13-mer C) (Fig. 6b). Alternative digestion with the use of MlucI and Cac8I enabled us to resolve the product emanating from the A→G mutation opposite the lesion site, i.e., d(p*AATTATAGCG) (10-mer G), from d(p*AATTATAGCA) (non-mutagenic product10-mer A), as well as the corresponding products carrying an A→C or A→T mutation, i.e., d(p*AATTATAGCC) (10-mer C) and d(p*AATTATAGCT) (10-mer T) (Fig. 6d). We have also confirmed the identities of the corresponding nonradiolabeled restriction fragments of interest by LC-MS/MS analysis15.
Figure 6.
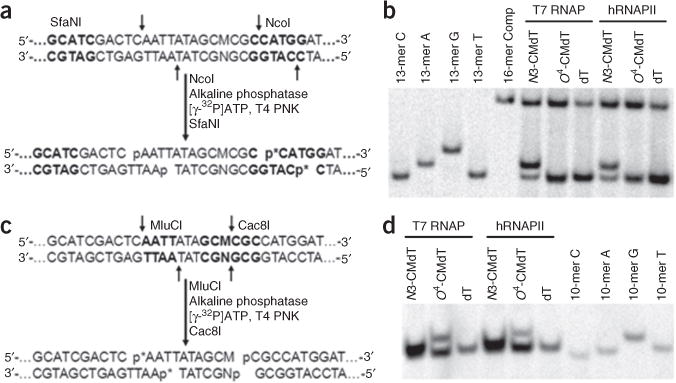
PAGE analysis for determining the effects of DNA lesions on transcription. (a) Sample processing for restriction digestion using NcoI and SfaNI and postlabeling assay (p* indicates a 32P-labeled phosphate group). The recognition sequences for restriction enzymes are highlighted in bold. (b) Representative gel images showing the NcoI/SfaNI-produced restriction fragments of interest. The restriction fragment arising from the competitor vector, i.e., d(CATGGCGATATGCTAT), is designated as ‘16-mer Comp’; ‘13-mer C’, ‘13-mer A’, ‘13-mer G’ and ‘13-mer T’ represent the standard synthetic ODNs d(CATGGCGNGCTAT), where ‘N’ is C, A, G and T, respectively. (c) Sample processing for restriction cleavage with MluCI and Cac8I and postlabeling assay. (d) Representative gel images showing the MluCI/Cac8I-generated restriction fragments of interest. ‘10-mer C’, ‘10-mer A’, ‘10-mer G’ and ‘10-mer T’ represent the standard synthetic ODNs d(AATTATAGCM), where ‘M’ is C, A, G and T, respectively. Adapted from You et al.15, Transcriptional inhibition and mutagenesis induced by N-nitroso compound–derived carboxymethylated thymidine adducts in DNA. Nucleic Acids Res. (2015) 43, 1012–1018, by permission of Oxford University Press.
Other restriction enzymes can also be used to release the restriction fragments for the CTAB assay, although appropriate modification of the parent vector by using site-directed mutagenesis27 to accommodate these restriction sites will be needed. It is important to avoid the choice of restriction enzymes that can release multiple restriction fragments with the same or similar size as the products of interest arising from the transcription of lesion-bearing or competitor genomes. In addition, the two candidate restriction enzymes should have optimal reactivities in a single buffer.
Limitations
It is important to note that the CTAB method relies on the presence of restriction recognition sequences flanking the lesion site8; thus, this approach is not suitable for the study of DNA lesions within some specific sequences that cannot be digested by restriction enzymes to produce short pieces of DNA fragments for the identification and quantification by PAGE or LC-MS/MS analysis. In addition, all existing transcriptional lesion bypass and mutagenesis assays, including the CTAB method, require the use of lesion-containing plasmids as DNA templates for in vivo transcription. These plasmid-based model systems have been proven to be highly useful in the study of the effects of DNA lesions on the flow of genetic information during transcription1,2,6,8,24. However, the transcriptional blocking and miscoding potentials of DNA lesions revealed by these plasmid-based systems may differ, to some extent, from their effects on DNA transcription when they are present in chromosomal DNA in cells. Therefore, it will be of interest to develop new methods for investigating how DNA lesions located in chromosomal templates compromise the transmission of genetic information during transcription in cells in the future.
MATERIALS
REAGENTS
pTGFP-T7-Hha10T and pTGFP-T7-Hha10comp plasmids were previously constructed in our laboratory14 and have been deposited to Addgene. The Addgene accession numbers for pTGFP-T7-Hha10T and pTGFP-T7-Hha10comp are 65427 and 65428, respectively
Unmodified ODNs are available from Integrated DNA Technologies
Lesion-bearing ODNs can be obtained from a commercial DNA synthesis vendor (e.g., Integrated DNA Technologies) or through in-house ODN synthesis. In this protocol, the 12-mer lesion-containing ODNs (5′-ATGGCGXGCTAT-3′, X = N3-CMdT or O4-CMdT) were previously synthesized in our laboratory20
Appropriate cell lines. In this protocol, we have used the XPA-complemented (GM15876A) and XPA-deficient (XP12RO) human fibroblast cell lines as an example to illustrate the application of the CTAB method for transcriptional lesion bypass, mutagenesis and repair studies in vivo. These two lines of cells were provided by Karlene A. Cimprich28 ! CAUTION The cell lines should be regularly checked to ensure that they are authentic and are not infected with mycoplasma.
Phusion high-fidelity (HF) DNA polymerase, supplied with 5× Phusion HF or GC buffer (New England BioLabs, cat. no. M0530L)
Deoxynucleoside triphosphate (dNTP) solution mix (New England BioLabs, cat. no. N0447S)
E.Z.N.A. Cycle Pure kit (Omega Bio-Tek, cat. no. D6492-02)
QIAprep spin miniprep kit (Qiagen, cat. no.27104)
EcoRI (New England BioLabs, cat. no. R0101S)
NheI (New England BioLabs, cat. no. R0131S)
Shrimp alkaline phosphatase (New England BioLabs, cat. no. R0371S)
Adenosine 5′-triphosphate (ATP; New England BioLabs, cat. no. R0756S)
T4 polynucleotide kinase (T4 PNK; New England BioLabs, cat. no. R0201S)
T4 DNA ligase (New England BioLabs, cat. no. R0202L)
Nt.BstNBI (New England BioLabs, cat. no. R0607L)
Ethidium bromide (Sigma-Aldrich, cat. no. E1510) ! CAUTION Ethidium bromide is carcinogenic; wear gloves and avoid skin contact.
Phenol:chloroform:isoamyl alcohol (25:24:1, vol/vol; Sigma-Aldrich, cat. no. P2069) ! CAUTION Phenol:chloroform:isoamyl alcohol is toxic and corrosive; wear gloves and work in a fume hood.
Ethanol (Fisher Scientific, cat. no. BP2818)
QIAquick gel extraction kit (Qiagen, cat. no. 28704)
[γ-32P]ATP (PerkinElmer, cat. no. NEG002H250UC) ! CAUTION [γ-32P]ATP is radioactive and carcinogenic; use personal protective equipment when you are handling it.
SfaNI (New England BioLabs, cat. no. R0172S)
NcoI (New England BioLabs, cat. no. R0193S)
NotI (New England BioLabs, cat. no. R0189S)
T7 RNA polymerase, supplied with 5× transcription buffer (Promega, cat. no. P2075)
100 mM DTT (Promega, cat. no. P1171)
100 mM rATP (Promega, cat. no. E6011)
100 mM rUTP (Promega, cat. no. E6021)
100 mM rGTP (Promega, cat. no. E6031)
100 mM rCTP (Promega, cat. no. E6041)
RNase inhibitor (New England BioLabs, cat. no. M0307S)
HeLaScribe nuclear extract in vitro transcription system, supplied with HeLa nuclear extract, 1× transcription buffer and HeLa extract stop solution (Promega, cat. no. E3110)
pGEM-T vector (Promega, cat. no. A3600)
Lipofectamine 2000 transfection reagent (Invitrogen, cat. no. 11668-019)
DMEM (Life Technologies, cat. no. 11995-073)
FBS (Life Technologies, cat. no. 16000-044)
Penicillin-streptomycin solution (American Type Culture Collection, cat. no. 30-2300)
0.25% (wt/vol) trypsin-EDTA (Life Technologies, cat. no. 25200-056)
10× PBS solution (VWR, cat. no. 97064-158)
E.Z.N.A. Total RNA kit I (Omega Bio-Tek, cat. no. 101319-240)
Ambion DNA-free kit (Life Technologies, cat. no. AM1906)
M-MLV reverse transcriptase, supplied with 5× reaction buffer and HeLa extract stop solution (Promega, cat. no. E3110)
MluCI (New England BioLabs, cat. no. R0538S)
Cac8I (New England BioLabs, cat. no. R0579L)
1,1,1,3,3,3-Hexafluoro-2-propanol (HFIP; Oakwood Chemical, cat. no. 003409)
Methanol (Fisher Scientific, cat. no. A452-SK4)
Sodium chloride (EMD, cat. no. 7710)
Sodium hydroxide (Fisher Scientific, cat. no. S318-10)
Agarose (Sigma-Aldrich, cat. no. A9539)
Sodium acetate (Sigma-Aldrich, cat. no. S2889)
Tris base (Fisher Scientific, cat. no. BP152-5)
EDTA (Teknova, cat. no. E5599)
Hydrochloric acid (Fisher Scientific, cat. no. A144-500) ! CAUTION It is corrosive and volatile; wear gloves, avoid skin contact and work in a fume hood).
Boric acid (Sigma-Aldrich, cat. no. B7901)
Glacial acetic acid (EMD Millipore, cat. no. 1000632511)
Formamide (Sigma-Aldrich, cat. no. F9037)
Bromophenol blue (Sigma-Aldrich, cat. no. B8026)
Xylene cyanol (Sigma-Aldrich, cat. no. X4126)
40% (wt/vol) Acrylamide/bis-acrylamide (19:1; Fisher Scientific, cat. no. BP1406-1) ! CAUTION It is toxic; wear gloves, avoid skin contact and work in a fume hood.
Urea (Fisher Scientific, cat. no. BP169-10)
Ammonium persulfate (Sigma-Aldrich, cat. no. 215589)
Tetramethylethylenediamine (Sigma-Aldrich, cat. no. T-9281)
EQUIPMENT
PCR thermocycler (Bio-Rad, cat. no. 186-1096)
Thin-walled 0.2-ml PCR tubes (Fisher Scientific, cat. no. 14230225)
Microcentrifuge (Eppendorf, model no. 5415D)
Microcentrifuge tubes, 1.5 ml (Fisher Scientific, cat. no. 02-681-320)
Electrophoresis power supply (Bio-Rad, model no. 3000xi)
PAGE apparatus (Life Technologies, model no. S2)
Agarose gel electrophoresis system (Fisher Scientific, cat. no. S98630)
Incubator (VWR, model no. 1545)
SpeedVac concentrator (Savant, SC110A)
Electroporator (Eppendorf, model no. 2510)
Incubator shaker (New Brunswick Scientific, model no. G-25)
Water bath (VWR Scientific, model no. 1217)
Vortex mixer (Fisher Scientific, cat. no. 02215365)
Heating block (Thermolyne, cat. no. DB17615)
Benchtop UV transilluminators (UVP, cat. no. 97-0274-13)
Storage phosphor screen (GE Healthcare)
Typhoon 9410 variable mode imager (GE Healthcare)
CO2 incubator (Forma Scientific, model no. 3110)
Thermo LTQ linear ion trap mass spectrometer (Thermo Fisher)
Agilent 1100 capillary HPLC system
Agilent Zorbax SB-C18 HPLC column (0.5 mm × 250 mm, 5-μm particle size)
REAGENT SETUP
3 M sodium acetate
Dissolve 40.8 g of sodium acetate in 100 ml of deionized water. Adjust the pH to 5.2 with glacial acetic acid and autoclave the solution. This solution can be stored indefinitely at room temperature (20–25 °C).
10× TE buffer
Dissolve 12.11 g of Tris base and 3.72 g of EDTA in 1 liter of deionized water. Adjust the pH to 8.0 with hydrochloric acid and autoclave the solution. Make a 1× working solution by diluting the 10× TE to a 1:10 ratio with deionized water. This solution can be stored at 4 °C for up to 6 months.
0.5 M EDTA (pH 8.0)
Dissolve 93.05 g of EDTA in 500 ml of deionized water. Adjust the pH to 8.0 with sodium hydroxide, and autoclave the solution. This solution can be stored at 4 °C for up to 6 months.
50× TAE buffer
Dissolve 242 g of Tris base, 57.1 ml of glacial acetic acid and 100 ml of 0.5 M EDTA (pH 8.0) in 1 liter of deionized water. Make a 1× working solution by diluting the 50× TAE to a 1:50 ratio with deionized water. This solution can be stored at room temperature for up to 6 months.
10% (wt/vol) ammonium persulfate
Dissolve 0.5 mg of ammonium persulfate in 5 ml of deionized water. This solution can be stored at 4 °C for up to 1 week.
10× TBE buffer
Dissolve 108 g of Tris base, 55 g of boric acid and 40 ml of 0.5 M EDTA (pH 8.0) in 1 liter of deionized water. Make a 0.5× working solution by diluting the 10× TBE at a 1:20 ratio with deionized water. This solution can be stored at room temperature for up to 6 months.
2× gel loading buffer
Dissolve 30 mg of bromophenol blue, 30 mg of xylene cyanol, 87.7 mg of EDTA and 24 ml of formamide in 30 ml of deionized water. This solution can be stored at 4 °C for up to 6 months.
50% (vol/vol) methanol
Dilute methanol with an equal volume of doubly distilled water. This solution can be stored indefinitely at room temperature.
400 mM HFIP (pH 7.0)
Dilute 21.5 ml of HFIP in 500 ml of deionized water. Adjust the pH to 7.0 with triethylamine. This solution can be stored at 4 °C for up to 6 months.
2.5 mM rNTP mixture
Combine 5 μl of 100 mM rATP, 5 μl of 100 mM rCTP, 5 μl of 100 mM rGTP and 5 μl of 100 mM rUTP with nuclease-free water to bring the volume to 200 μl. This solution can be stored at −20 °C for up to 6 months.
1% (wt/vol) agarose gel in 1× TAE buffer
Dissolve 0.5 g of agarose in 50 ml of 1× TAE buffer by heating it in a microwave oven. Cool it to ~50 °C and add 50 μg of ethidium bromide. Pour the agarose solution into a gel tray with the well comb in place, and then allow the gel to cool at room temperature for ~30 min until it is completely solidified. This gel can be stored in a sealed condition at 4 °C for up to 2 d.
2% (wt/vol) agarose gel in 0.5× TBE buffer
Dissolve 1 g of agarose in 60 ml of 0.5× TBE buffer by heating it in a microwave oven. Cool it to ~50 °C and add 50 μg of ethidium bromide. Pour the agarose into a gel tray with the well comb in place, and allow the gel to cool at room temperature for ~20 min until it is completely solidified. The gel can be stored in sealed condition at 4 °C for up to 2 d.
20% (wt/vol) denaturing polyacrylamide gel
Dissolve 28.8 g of urea, 30 ml of 40% (wt/vol) acrylamide/bis-acrylamide (19:1) and 3 ml of 10× TBE buffer in 60 ml of deionized water. Add 350 μl of 10% (wt/vol) ammonium persulfate (wt/vol) and 35 μl of tetramethylethylenediamine, and then mix the solution thoroughly. Pour the gel solution into a gel mold and insert a comb into the top of the gel. Allow the gel to polymerize at room temperature for at least 1–2 h. The gel can be stored in a sealed condition at 4 °C for up to 2 d.
30% (wt/vol) native polyacrylamide gel
Thoroughly mix 45 ml of 40% (wt/vol) acrylamide/bis-acrylamide (19:1), 3 ml of 10× TBE buffer, 350 μl of 10% (wt/vol) ammonium persulfate, 35 μl of tetramethylethylenediamine and deionized water to make a 60-ml solution. Pour the gel solution into a gel mold and insert a comb into the top of the gel. Allow the gel to polymerize at room temperature for 1–2 h. This gel can be stored in a sealed condition at 4 °C for up to 2 d.
PROCEDURE
Generation of gapped parent vector ● TIMING 2–3 d
-
1| Prepare the reaction mixture given below, and incubate it at 55 °C for 2 h.
Component Amount per reaction Final concentration
Parent vector (i.e., pTGFP-T7-Hha10T) Variable 600 ng/μl NEB buffer 3 (10×) 50 μl 1× Nt.BstNBI (10 U/μl) 22.5 μl 0.45 U/μl Sterile deionized water Variable — Total volume 500 μl —
-
2| To totally nick the plasmid DNA, add another 22.5 μl of Nt.BstNBI to the restriction mixture and incubate it at 55 °C for 4–6 h.
? TROUBLESHOOTING
-
3| Run 2 μl of the digestion mixture on a 1% (wt/vol) agarose gel in the presence of 1 μg/ml ethidium bromide. Run the gel in 1× TAE buffer at 80 V for ~90 min.
▲ CRITICAL STEP Before proceeding to the next step, confirm that the supercoiled plasmid DNA is converted to nicked plasmid DNA.
-
4| Extract the restriction digestion mixture with an equal volume of a phenol:chloroform:isoamyl alcohol solution (25:24:1), and gently shake it by hand for ~5 min. Centrifuge the mixture at 15,000g for 10 min at 4 °C.
! CAUTION Phenol:chloroform:isoamyl alcohol solution (25:24:1) is toxic and corrosive; wear gloves and work in a fume hood.
5| Precipitate the aqueous layer with 2.5 volumes of 100% (vol/vol) ethanol and 0.1 volume of 3 M sodium acetate. Incubate the mixture at −20 °C for at least 30 min, and centrifuge it at 15,000g for 60 min at 4 °C.
-
6| Gently wash the DNA pellets with 500 μl of 70% (vol/vol) ethanol and centrifuge them at 15,000g for 5 min at 4 °C.
▲ CRITICAL STEP To avoid washing out the DNA pellets, this step should be performed extremely gently.
7| Remove the supernatant, dry the DNA pellets and resuspend the pellets in 100 μl of sterile deionized water.
8| In a final volume of 500 μl, mix ~5 nmol of 25-mer complementary ODN (i.e., 5′-CATCGACTCAATTATAGCACGCCAT-3′) with nicked plasmid DNA in 1× NEB buffer 3. Heat the reaction mixture at 85 °C for 5 min, and then cool it down gradually to room temperature.
9| Purify the gapped plasmid by removing the generated 25-mer duplex ODNs with a Centricon 100 spin filter (Millipore) using four changes of TE buffer according to the manufacturer’s instructions.
-
10| Repeat Steps 8 and 9 to completely remove the 25-mer restriction fragment from the nicked vector. Approximately 240 μg of the gapped plasmid should be recovered at this point.
■ PAUSE POINT The sample can be stored at −80 °C for up to 1 year.
Construction of the lesion-bearing and lesion-free control vectors ● TIMING 3–4 d
-
11| Phosphorylate the 12-mer ODN (5′-ATGGCGXGCTAT-3′, ‘X’ indicates N3-CMdT, O4-CMdT or dT) and a 13-mer lesion-free ODN, 5′-AATTGAGTCGATG-3′, as tabulated below. Incubate the mixture at 37 °C for 2 h.
Component Amount per reaction Final concentration
T4 PNK buffer (10×) 2 μl 1× T4 PNK (10 U/μl) 0.5 μl 0.25 U/μl ATP (10 mM) 2 μl 1 mM 12-mer ODN Variable 10 μM 13-mer ODN (100 μM) 2 μl 10 μM Sterile deionized water Variable — Total volume 20 μl —
▲ CRITICAL STEP This step is essential for the lesion-bearing ODNs that are obtained through in-house solid-phase chemical synthesis; however, it can be omitted if 5′ phosphorylated ODNs are commercially available.
-
12| Prepare the following mixture, heat it at 85 °C for 5 min and then cool it down gradually to room temperature.
Component Amount per reaction Final concentration
Phosphorylated ODNs (Step 11) 0.75 μl ~ 1.25 μM Gapped plasmid (Step 10) Variable ~0.125 μM Ligation buffer (10×) 0.6 μl 1× Sterile deionized water Variable — Total volume 6 μl —
▲ CRITICAL STEP A control ligation experiment without the addition of phosphorylated ODNs should be included to confirm the lack of self-ligation of the gapped vector.
-
13| Prepare the ligation mixture tabulated below, and incubate it for 16–20 h, alternating between 10 °C for 30 s and 30 °C for 30 s.
Component Amount per reaction (μl) Final concentration
Annealed product (Step 12) 6 — Ligation buffer (10×) 0.4 1× ATP (10 mM) 1 1 mM T4 DNA ligase (400 U/μl) 1 40 U/μl Sterile deionized water 1.6 — Total volume 10 —
-
14| Load the ligation mixture onto a 1% (wt/vol) agarose gel in the presence of 1 μg/ml of ethidium bromide. Run it in 1× TAE buffer at 80 V for ~90 min.
! CAUTION Ethidium bromide is toxic; wear gloves and avoid skin contact.
-
15| Expose the gel to UV light and analyze the ligation results.
▲ CRITICAL STEP Before proceeding to the next step, confirm that ligation of the gapped vector with phosphorylated ODNs can produce the expected supercoiled bands, whereas self-ligation of gapped vector cannot produce the supercoiled bands.
? TROUBLESHOOTING
-
16| Prepare the following mixture, heat the mixture at 85 °C for 5 min and then cool it down gradually to room temperature.
Component Amount per reaction Final concentration
Phosphorylated ODNs (Step 11) 15 μl ~1.25 μM Gapped plasmid (Step 10) Variable ~0.125 μM Ligation buffer (10×) 12 μl 1× Sterile deionized water Variable — Total volume 120 μl —
-
17| Prepare the ligation mixture tabulated below, and incubate it for 16–20 h, alternating between 10 °C for 30 s and 30 °C for 30 s.
Component Amount per reaction (μl) Final concentration
Annealed product (Step 16) 120 — Ligation buffer (10×) 8 1× ATP (10 mM) 20 1 mM T4 DNA ligase (400 U/μl) 20 40 U/μl Sterile deionized water 32 — Total volume 200 —
-
18| Load the ligation mixture on a 1% (wt/vol) agarose gel in the presence of 1 μg/ml of ethidium bromide, and run the gel in 1× TAE buffer at 80 V for ~90 min.
! CAUTION Ethidium bromide is toxic; wear gloves and avoid skin contact.
-
19| Excise the band corresponding to the supercoiled plasmid DNA under a long-wavelength (365-nm) UV light source with a scalpel.
▲ CRITICAL STEP UV irradiation may cause damage to the plasmid DNA; use long-wavelength UV source and minimize the UV exposure time.
-
20| Recover the supercoiled plasmid DNA from the gel using a Qiagen QIAquick gel extraction kit according to the manufacturer’s instructions. Store the recovered plasmid DNA at −80 °C until use.
■ PAUSE POINT Plasmid can be stored at −80 °C for up to 1 year.
Quality control of the lesion-bearing and lesion-free control vectors ● TIMING 1–2 d
-
21| Prepare the reaction mixture given below, incubate it at 37 °C for 1 h, and then deactivate the enzyme by heating the solution at 70 °C for 20 min.
Component Amount per reaction Final concentration
Recovered plasmid DNA (Step 20) Variable 30 ng/μl NEB buffer 2 (10×) 1 μl 1× EcoRI (20 U/μl) 0.25 μl 0.5 U/μl SAP (1 U/μl) 1 μl 0.1 U/μl Sterile deionized water Variable — Total volume 10 μl —
-
22| Prepare the following mixture, incubate it at 37 °C for 30 min and then deactivate the T4 PNK by heating it at 65 °C for 20 min.
Component Amount per reaction (μl) Final concentration
Reaction mixture (Step 21) 10 — NEB buffer 2 (10×) 0.5 1× T4 PNK (10 U/μl) 0.5 0.33 U/μl [γ-32P]ATP (5 μCi/μl) 0.5 0.17 μCi/μl Sterile deionized water 3.5 — Total volume 15 —
-
23| Prepare the following mixture, incubate it at 37 °C for 1 h and quench the reaction by adding 20 μl of 2× gel loading buffer.
Component Amount per reaction (μl) Final concentration
Reaction mixture (Step 22) 15 — NEB buffer 2 (10×) 0.5 1× BSA (100×) 0.2 1× NheI (10 U/μl) 0.5 0.25 U/μl Sterile deionized water 3.8 — Total volume 20 —
24| Heat the mixture at 95 °C for 5 min, and then quickly chill it on ice.
-
25| Load 7 μl of the mixture on a 20% (wt/vol) denaturing polyacrylamide gel (acrylamide:bis-acrylamide = 19:1) containing 8 M urea in 0.5× TBE buffer, and run the gel at 1,500 V for ~3–4 h.
! CAUTION Polyacrylamide gel solution (acrylamide:bis-acrylamide = 19:1) is toxic; wear gloves, avoid skin contact and work in a fume hood.
26| Wrap the wet gel directly in plastic wrap and expose the wrapped gel to a storage phosphor screen at 4 °C for 4–6 h.
27| Scan the phosphor screen with a Typhoon 9410 variable mode imager.
-
28| Analyze the gel image with ImageQuant software according to the manufacturer’s instructions.
▲ CRITICAL STEP Before proceeding to the next step, confirm that there is a 50-mer 32P-labeled fragment and that there are no shorter radiolabeled fragments.
? TROUBLESHOOTING
Quantitative determination of the relative concentrations of genome constructs ● TIMING 1–2 d
29| Premix 4 μl of the lesion-bearing or lesion-free control plasmids with an equal volume of competitor vector (30–50 ng/μl for each vector).
-
30| Prepare the reaction mixture given below, incubate it at 37 °C for 1.5 h and then deactivate the enzyme by heating the reaction solution at 70 °C for 20 min.
Component Amount per reaction (μl) Final concentration
Mixed plasmids (Step 20) 8 24–40 ng/μl NEB buffer 3 (10×) 1 1× SfaNI (2 U/μl) 0.5 0.1 U/μl SAP (0.5 U/μl) 0.5 0.025 U/μl Total volume 10 —
-
31| Prepare the following mixture, incubate it at 37 °C for 30 min and then deactivate the T4 PNK by heating it at 65 °C for 20 min.
Component Amount per reaction (μl) Final concentration
Reaction mixture (Step 30) 10 — NEB buffer 3 (10×) 0.5 1× T4 PNK (10 U/μl) 0.5 0.33 U/μl [γ-32P]ATP (5 μCi/μl) 0.5 0.17 μCi/μl Sterile deionized water 3.5 μl — Total volume 15 μl —
-
32| Prepare the following mixture, incubate it at 37 °C for 1 h and quench the reaction by adding 20 μl of 2× gel loading buffer.
Component Amount per reaction (μl) Final concentration
Reaction mixture (Step 31) 15 — NEB buffer 3 (10×) 0.5 1× NcoI (10 U/μl) 0.5 0.25 U/μl Sterile deionized water 4 — Total volume 20 —
-
33| Load 7 μl of the mixture on a 20% (wt/vol) denaturing polyacrylamide gel (acrylamide:bis-acrylamide = 19:1) containing 8 M urea in 0.5× TBE buffer at 1,500 V for ~3–4 h.
! CAUTION Polyacrylamide gel solution (acrylamide:bis-acrylamide = 19:1) is toxic; wear gloves, avoid skin contact and work in a fume hood.
34| Wrap the wet gel directly in plastic wrap, and expose the wrapped gel to a storage phosphor screen at 4 °C for 4–6 h.
35| Scan the phosphor screen with a Typhoon 9410 variable mode imager.
36| Quantify the bands of interest with the ImageQuant software according to the manufacturer’s instructions, and normalize the relative concentration of lesion-bearing or lesion-free control plasmids to the competitor vector.
In vitro and in vivo transcription assay ● TIMING 3–4 d
- 37| The following options are available based on in vitro transcription reactions with T7 RNA polymerase and human RNA polymerase II (option A), or in vivo reactions with human fibroblast cells (option B).
- In vitro transcription reactions
-
Premix lesion-bearing or lesion-free control plasmids with the competitor vector at a molar ratio of 3:1 (lesion/competitor).▲ CRITICAL STEP The lesion/competitor molar ratio can be adjusted according to the extent to which the DNA lesion blocks transcription. It is recommended that preliminary experiments be performed for optimizing this molar ratio.
-
Prepare the reaction mixture given below, incubate it at 37 °C for 1 h and then deactivate the enzyme by heating the reaction solution at 70 °C for 20 min.
Component Amount per reaction Final concentration
Mixed plasmids (Step 37A(i)) Variable 25 ng/μl NEB buffer 3 (10×) 2 μl 1× BSA (100×) 0.2 μl 1× NotI (10 U/μl) 0.5 μl 0.25 U/μl Sterile deionized water Variable — Total volume 20 μl —
- Purify the NotI-treated DNA by using the E.Z.N.A. Cycle Pure kit (Omega Bio-Tek), and then elute it in 30 μl of elution buffer according to the manufacturer’s instructions.
-
To examine the effect of DNA lesion on transcription by T7 RNA polymerase in vitro, set up a reaction as tabulated below. Incubate the reaction mixture at 37 °C for 1 h.
Component Amount per reaction Final concentration
Linear DNA template (Step 37A(iii)) Variable 2.5 ng/μl Transcription buffer (5×) 4 μl 1× DTT (100 mM) 2 μl 10 mM rNTP mixture (2.5 mM) 4 μl 0.5 mM RNase inhibitor (40 U/μl) 0.25 μl 0.5 U/μl T7 RNA polymerase (20 U/μl) 1 μl 1 U/μl Nuclease-free water Variable — Total volume 20 μl —
-
Terminate the transcription reaction by adding 2 μl of 0.2 M EDTA.■ PAUSE POINT The sample can be stored at −80 °C for up to 1 month. RNA can also be purified directly as described in Step 38.
-
To examine the effects of DNA lesion on transcription by human RNA polymerase II in vitro, set up a reaction as tabulated below. Incubate the reaction mixture at 30 °C for 1 h.
Component Amount per reaction Final concentration
Linear DNA template (Step 37A(iii)) Variable 2.5 ng/μl HeLa nuclear extract 1× transcription buffer (11–x) μl — MgCl2 (50 mM) 1.5 μl 3 mM rNTP mixture (2.5 mM) 4 μl 0.4 mM RNase inhibitor (40 U/μl) 0.25 μl 0.4 U/μl HeLa nuclear extract Variable (x μl) 0.32 U/μl Nuclease-free water Variable — Total volume 25 μl —
▲ CRITICAL STEP The activity of HeLaScribe nuclear extract varies from lot to lot. For this reaction, calculate the amount needed for 0.32 U/μl, and then add 1× transcription buffer to 11 μl. Consult the HeLaScribe nuclear extract manual for more detailed information. -
Terminate the transcription reaction by adding 175 μl of the HeLa extract stop solution.■ PAUSE POINT The sample can be stored at −80 °C for up to 1 month. RNA can also be purified directly as described in Step 38.
-
- In vivo transcription assay
- Culture the XPA-complemented (GM15876A) and XPA-deficient (XP12RO) human fibroblast cells in DMEM supplemented with 10% (vol/vol) FBS, 100 μg/ml streptomycin and 100 U/ml penicillin, and incubate it at 37 °C in 5% (vol/vol) CO2 atmosphere.
- 1 d before transfection, plate 1 × 10⁵ cells per well in 24-well plates with 500 μl of growth medium without antibiotics so that the cells are 50–70% (vol/vol) confluent at the time of transfection.
- Premix the lesion-bearing or lesion-free control plasmids with the competitor vector at a molar ratio of 3:1 (lesion/competitor). Then, cotransfect the mammalian cells with 50 ng of mixed plasmids and 450 ng of carrier DNA (self-ligated pGEM-T vector) by using Lipofectamine 2000 according to the manufacturer’s instructions.
- Incubate the cells at 37 °C in 5% (vol/vol) CO2 atmosphere for 24 h.
- Discard the cell culture medium and wash the cells gently with 500 μl of PBS.
- Discard the PBS solution, and then add 100 μl of trypsin-ETDA solution and incubate the plate for 3–5 min to detach the cells from the plate.
- Add 100 μl of DMEM medium and collect the mixture into a 1.5-ml microcentrifuge tube.
- Centrifuge the mixture at 2,000g for 5 min at 4 °C.
- Aspirate the supernatant, and wash the pelleted cells with 500 μl of PBS.
-
Centrifuge the mixture at 2,000g for 5 min at 4 °C, and discard the PBS. Purify the RNA products as described in Step 38.■ PAUSE POINT The sample can be stored at −80 °C for up to 1 month.
RNA purification, DNaseI treatment, cDNA synthesis and RT-PCR ● TIMING 1–2 d
-
38| Purify the RNA products by using the total RNA kit (Omega Bio-Tek) and elute it in 50 μl of elution buffer according to the manufacturer’s instructions.
▲ CRITICAL STEP From Steps 38–42, be sure to use RNase-free tubes and tips, wear fresh gloves and maintain RNase-free conditions at all times when you are working with RNA.
■ PAUSE POINT RNA can be stored at −80 °C for up to 1 year.
39| Treat the purified RNA products twice with the DNA-free kit (Ambion) to eliminate DNA contamination, and subsequently remove the DNase and divalent cations from the sample according to the manufacturer’s instructions.
40| Add 16.5 μl of DNaseI-treated RNA product and 1 μl of gene-specific primer (10 pmol/μl; 5′-TCGGTGTTGCTGTGAT-3′) to a sterile RNase-free microcentrifuge tube. Heat the tube at 70 °C for 5 min, and then quickly chill it on ice.
-
41| Prepare the following mixture, and incubate the reaction mixture at 42 °C for 1.5 h and then at 75 °C for 15 min.
Component Amount per reaction (μl) Final concentration
Denatured sample (Step 40) 17.5 — M-MLV 5 × reaction buffer 5 1× dNTP (10 mM) 1.25 0.5 mM RNase inhibitor (40 U/μl) 0.25 0.4 U/μl M-MLV reverse transcriptase (200 U/μl) 1 8 U/μl Total volume 25 —
▲ CRITICAL STEP A control experiment without the inclusion of M-MLV reverse transcriptase should be included to evaluate the possibility of residual DNA contamination in RNA template.
■ PAUSE POINT cDNA can be stored at −20 °C for up to 6 months.
-
42| Prepare the PCR mixture given below. The forward and reverse primers used for this protocol are 5′-CTAGCGGATGCATCGACTC-3′ and 5′-TGCTGCGGATGATCTTGTCG-3′.
Component Amount per reaction (μl) Final concentration
PCR template (Step 41) 2 — Phusion HF buffer (5×) 20 1× dNTP (10 mM) 2 0.2 mM Forward primer (10 μM) 2 0.2 μM Reverse primer (10 μM) 2 0.2 μM Phusion DNA polymerase (2 U/μl) 0.4 0.008 U/μl Nuclease-free water 71.6 — Total volume 100 —
-
43| Run the reaction mixture in a PCR instrument using the program listed below.
Cycle number Denaturation Annealing Extension
1 98 °C, 30 s — — 2–36 98 °C, 10 s 60 °C, 30 s 72 °C, 15 s 37 — — 72 °C, 5 min
■ PAUSE POINT The reaction product can be stored at −20 °C for a few days.
-
44| Run 3 μl of the PCR product on a 2% (wt/vol) agarose gel in 0.5× TBE buffer at 120 V for ~45 min, and expose the gel to UV light.
▲ CRITICAL STEP Before proceeding to the next step, confirm that the cDNA, but not RNA template, can be amplified to produce a PCR product with the expected size.
? TROUBLESHOOTING
-
45| Purify the remaining PCR product by using the E.Z.N.A. Cycle Pure kit and elute it in 50 μl of elution buffer according to the manufacturer’s instructions.
■ PAUSE POINT Purified PCR product can be stored at −20 °C for up to 1 year.
Restriction digestion, PAGE and LC-MS/MS analysis ● TIMING 2–3 d
- 46| If restriction digestion with NcoI and SfaNI and PAGE analysis are used, proceed as described in option A. If restriction digestion with MluCI and Cac8I and PAGE analysis are used, proceed as described in option B. If restriction digestion and LC-MS/MS analysis are used, proceed as described in option C.
- Restriction digestion using NcoI and SfaNI, and PAGE analysis
-
Prepare the reaction mixture given below, incubate at 37 °C for 1 h and then deactivate the enzyme by heating the reaction solution at 70 °C for 20 min.
Component Amount per reaction Final concentration
Purified PCR product (Step 45) Variable 10–20 ng/μl NEB buffer 3 (10×) 1 μl 1× NcoI (10 U/μl) 0.5 μl 0.5 U/μl SAP (1 U/μl) 0.5 μl 0.05 U/μl Sterile deionized water Variable — Total volume 10 μl —
-
Radiolabel the dephosphorylated restriction fragments as tabulated below, incubate it at 37 °C for 30 min and then deactivate the T4 PNK by heating it at 65 °C for 20 min.
Component Amount per reaction (μl) Final concentration
Reaction mixture (Step 46A(i)) 10 — NEB buffer 3 (10×) 0.5 1× T4 PNK (10 U/μl) 0.5 0.33 U/μl [γ-32P]ATP (5 μCi/μl) 0.5 0.17 μCi/μl ATP (100 μM) 0.1 0.67 μM Sterile deionized water 3.4 — Total volume 15 —
-
Prepare the following mixture, incubate at 37 °C for 1.5 h and quench the reaction by adding 20 μl of 2× gel loading buffer.
Component Amount per reaction (μ l) Final concentration
Reaction mixture (Step 46A(ii)) 15 — NEB buffer 3 (10×) 0.5 1× SfaNI (2 U/μl) 1 0.1 U/μl Sterile deionized water 3.5 — Total volume 20 —
■ PAUSE POINT The sample can be stored at −20 °C for up to 1 week. -
Load 7 μl of the mixture on a 30% (wt/vol) native polyacrylamide gel (acrylamide:bis-acrylamide = 19:1) in 0.5× TBE buffer at 1,500 V for ~7–8 h.! CAUTION Polyacrylamide gel solution (acrylamide:bis-acrylamide = 19:1) is toxic; wear gloves, avoid skin contact and work in a fume hood.
-
Refer to Steps 34–36 to quantify the bands of interest with phosphorimager analysis (Figs. 5a–c and 6b).? TROUBLESHOOTING
-
- Restriction digestion using MluCI and Cac8I, and PAGE analysis
-
Prepare the reaction mixture given below, incubate it at 37 °C for 2 h and then deactivate the enzyme by heating the reaction solution at 70 °C for 20 min.
Component Amount per reaction Final concentration
Purified PCR product (Step 45) Variable 10–20 ng/μl CutSmart buffer (10×) 1 μl 1× MluCI (10 U/μl) 1 μl 1 U/μl SAP (1 U/μl) 0.5 μl 0.05 U/μl Sterile deionized water Variable — Total volume 10 μl —
-
Radiolabel the dephosphorylated restriction fragments as tabulated below, incubate the mixture at 37 °C for 30 min and then deactivate the T4 PNK by heating it at 65 °C for 20 min.
Component Amount per reaction (μl) Final concentration
Reaction mixture (Step 46B(i)) 10 — CutSmart buffer (10×) 0.5 1× T4 PNK (10 U/μl) 0.5 0.33 U/μl [γ-32P]ATP (5 μCi/μl) 10 0.5 0.17 μCi/μl ATP (100 μM) 0.1 0.67 μM Sterile deionized water 3.4 — Total volume 15 —
-
Prepare the following mixture, incubate at 37 °C for 3 h and quench the reaction by adding 20 μl of 2× gel loading buffer.
Component Amount per reaction (μl) Final concentration
Reaction mixture (Step 46B(ii)) 15 — CutSmart buffer (10×) 0.5 1× Cac8I (5 U/μl) 0.5 0.125 U/μl Sterile deionized water 3.5 — Total volume 20 —
■ PAUSE POINT The sample can be stored at −20 °C for up to 1 week. -
Load 7 μl of the mixture on a 30% (wt/vol) native polyacrylamide gel (acrylamide:bis-acrylamide = 19:1) in 0.5× TBE buffer at 1,500 V for ~6–7 h.! CAUTION Polyacrylamide gel solution (acrylamide:bis-acrylamide = 19:1) is toxic; wear gloves, avoid skin contact and work in a fume hood.
-
Refer to Steps 34–36 to quantify the bands of interest with phosphorimager analysis (Figs. 5a–c and 6d).? TROUBLESHOOTING
-
- Restriction digestion and LC-MS/MS analysis
-
Prepare the reaction mixture given below, incubate at 37 °C for 2 h and then deactivate the enzyme by heating the reaction solution at 70 °C for 20 min.
Component Amount per reaction Final concentration
Purified PCR product (Step 45) Variable ~20 ng/μl NEB buffer 3 (10×) 15 μl 1× SfaNI (2 U/μl) 15 μl 0.2 U/μl SAP (1 U/μl) 15 μl 0.1 U/μl Sterile deionized water Variable — Total volume 150 μl —
-
Further treat the dephosphorylated restriction fragments as tabulated below, and incubate the reaction at 37 °C for 2 h.
Component Amount per reaction (μl) Final concentration
Reaction mixture (Step 46C(i)) 150 — NEB buffer 3 (10×) 5 1× NcoI (10 U/μl) 5 0.25 U/μl Sterile deionized water 40 — Total volume 200 —
■ PAUSE POINT The sample can be stored at −20 °C for up to 1 week. -
Extract the restriction mixture with an equal volume of phenol:chloroform:isoamyl alcohol solution (25:24:1), vortex the mixture for ~1 min and centrifuge it at 15,000g for 10 min at 4 °C.! CAUTION Phenol:chloroform:isoamyl alcohol solution (25:24:1) is toxic and corrosive; wear gloves and work in a fume hood.
- Precipitate the aqueous layer obtained with 2.5 volumes of 100% (vol/vol) ethanol and 0.1 volume of 3 M sodium acetate. Incubate the mixture at −80 °C overnight, and centrifuge it at 15,000g for 60 min at 4 °C.
-
Gently wash the DNA pellet with 500 μl of 70% (vol/vol) ethanol, and centrifuge it at 15,000g for 10 min at 4 °C.▲ CRITICAL STEP To avoid washing out the DNA pellets, this step should be performed extremely gently.
-
Remove the supernatant, dry the DNA pellet and resuspend it in 15 μl of sterile deionized water for LC-MS/MS analysis.■ PAUSE POINT The sample can be left at −20 °C for up to several months. (vii) Use an Agilent Zorbax SB-C18 HPLC column (0.5 mm × 250 mm, 5 μm in particle size), and direct the eluent from the HPLC system to a Thermo LTQ linear ion trap mass spectrometer. Operate the mass spectrometer in the negative-ion mode.
- Equilibrate the Agilent Zorbax SB-C18 HPLC column with 100% (vol/vol) 400 mM HFIP (pH 7.0) at 8.0 μl/min for 15–30 min.
- Use the freely available online software Mongo oligo mass calculator v2.06 to calculate the theoretical mass-to-charge ratios (m/z) for the precursor, as well as the [an-B] and w ions of the potential DNA fragments, as described previously29.
- Set up the LTQ linear ion trap mass spectrometer for monitoring the restriction fragments of interest, e.g., d(AATTATAGCMCGC), where ‘M’ designates A, T, C or G.
- Inject 7.5 μl of desalted DNA product into the LC-MS system, and run the HPLC system with the gradient program being 5 min of 5–20% (vol/vol) methanol, followed by 25 min of 20–60% (vol/vol) methanol in 400 mM HFIP (pH 7.0), and with a flow rate of 8.0 μl/min.
-
Compare the calculated m/z values for the [an-B] and w ions with those observed in the tandem mass spectra to confirm the identities of DNA fragments of interest, as described previously11,29.? TROUBLESHOOTING
-
? TROUBLESHOOTING
Troubleshooting advice can be found in Table 1.
TABLE 1.
Troubleshooting table.
| Step | Problem | Possible reason | Solution |
|---|---|---|---|
| 2 | Low nicking efficiency | Incorrect reaction temperature | Reaction temperature of Nt.BstNBI should be 55 °C |
| 15 | Self-ligation of the gapped vector produces supercoiled plasmid Ligation of the gapped vector with phosphorylated ODNs yields no or little supercoiled plasmid DNA |
Incomplete nicking reaction Incomplete removal of 25-mer ODNs from the nicked plasmid Ligation reaction failure |
Increase the amount of Nt.BstNBI or extend nicking reaction time in Steps 1 and 2 Repeat Steps 8–10 with a larger amount of 25-mer complementary ODN to generate the gapped vector Ensure that inserts have a 5′ phosphate; use new ligase and buffer |
| 28 | Shorter bands than the expected 50-mer band | Unsuccessful ligation of lesion-bearing ODNs with the gapped vector Star activities of EcoRI and NheI |
Repeat Steps 11–15 to generate new lesion-bearing plasmid DNA Reduce the amounts of restriction enzyme(s) or decrease the restriction digestion time |
| 44 | RNA template yields the PCR product cDNA template yields little or no PCR product |
Residual DNA contamination in RNA template cDNA synthesis failure PCR amplification failure |
Treat the RNA with a larger amount of DNaseI for a longer time Check the quality of the RNA template and re-do cDNA synthesis Check the quality of the PCR reagents by using the parent plasmid as DNA template, and re-do PCR |
| 46A(v), 46B(v), 46C(xii) | Faint or no bands detected Faint or no signals of restriction fragments |
Restriction digestion failure Dephosphorylation failure Radiolabeling failure Poor detection sensitivity Restriction reaction failure |
Check the quality of restriction enzymes; ensure that correct enzymes and buffers are used Check the quality of shrimp alkaline phosphatase Spin the tube before heat inactivation of the enzyme at Steps 46A(i) and 46B(i) Check the quality of [γ-32P]ATP and T4-PNK Clean the HPLC and mass spectrometer systems Check the quality of restriction enzymes; ensure that correct enzymes and buffers are used |
● TIMING
Steps 1–10, generation of gapped parent vector: 2–3 d
Steps 11–20, construction of the lesion-bearing and lesion-free control vectors: 3–4 d
Steps 21–28, quality control of the lesion-bearing and lesion-free control vectors: 1–2 d
Steps 29–36, quantitative determination of the relative concentration of genome constructs: 1–2 d
Step 37, in vitro and in vivo transcription reactions: 3–4 d
Steps 38–45, RNA purification, DNaseI treatment and RT-PCR: 1–2 d
Step 46, restriction digestion, PAGE and LC-MS/MS analysis: 2–3 d
ANTICIPATED RESULTS
In this protocol, PAGE analysis of restriction fragments produced from NcoI and SfaNI digestion allows us to readily resolve the 16-mer band (competitor signal) from the 13-mer bands (i.e., restriction fragments arising from the lesion-bearing or lesion-free control plasmids). The transcriptional lesion bypass efficiency, which characterizes how a DNA lesion inhibits transcription elongation, can be determined by normalizing the ratio of the intensity of the total lesion signal to the 16-mer competitor signal against the corresponding ratio obtained for the lesion-free control (Figs. 5a and 6a,b).
Restriction digestion with NcoI and SfaNI followed by PAGE analysis also allowed us to separate the 13-mer 32P-labeled wild-type product d(p*CATGGCGTGCTAT) from the DNA fragments d(p*CATGGCGAGCTAT) and d(p*CATGGCGGGCTAT), which correspond to A→U and A→C mutations opposite the lesion (Fig. 6a,b). In addition, restriction digestion using MluCI and SfaNI followed by PAGE analysis permits the separation of the 10-mer product d(p*AATTATAGCG) (i.e., A→G mutation) from the corresponding non-mutagenic and A→U or A→C products (Fig. 6c,d). The mutagenic potential of a lesion can be determined from the relative ratio of the intensity of mutant restriction fragment over the total intensities of wild-type and mutant restriction fragments arising from the lesion-bearing template.
LC-MS/MS analysis facilitates the unambiguous identification of restriction fragments of interest15. The LC-MS/MS method can also be used to determine the relative yield of the various identified DNA fragments based on their respective peak areas in the selected-ion chromatograms, as described elsewhere11,29. This approach allows us to quantify the relative yield of restriction fragments of interest that may not be resolved by PAGE analysis8.
We have successfully used the CTAB assay to quantitatively determine the effects of a variety of DNA lesions on transcription and the possible roles of certain repair proteins in the repair of these lesions in mammalian cells8,13–16. The anticipated results with the CTAB assay can vary with the types of DNA lesions. For instance, we previously showed that N3-CMdT and O4-CMdT exhibit inhibitory effects on DNA transcription in vitro and in human cells, and their deleterious effects on transcription can be exacerbated by depletion of the XPA gene (Figs. 5 and 6). In addition, N3-CMdT predominantly induces the misincorporation of uridine, whereas transcriptional bypass of O4-CMdT exclusively results in misinsertion of guanosine opposite the lesion (Figs. 5 and 6; ref. 15). This protocol should be generally applicable for assessing quantitatively how other DNA lesions perturb the fidelity and efficiency of DNA transcription in vitro and in vivo, and how they are repaired in mammalian cells.
Acknowledgments
We acknowledge T.R. O’Connor (The City of Hope) and K.A. Cimprich (Stanford University) for kindly providing the initial pTGFP-Hha10 vector and human fibroblast cells (XP12RO and GM15876A), respectively. This work was supported by US National Institutes of Health (R01DK082779, R01ES019873, R01 ES025121 and R01CA101864 to Y.W.).
Footnotes
AUTHOR CONTRIBUTIONS C.Y. designed and performed the research and wrote the manuscript. Y.W. designed and supervised the research and edited the manuscript.
COMPETING FINANCIAL INTERESTS The authors declare no competing financial interests.
References
- 1.Bregeon D, Doetsch PW. Transcriptional mutagenesis: causes and involvement in tumour development. Nat Rev Cancer. 2011;11:218–227. doi: 10.1038/nrc3006. [DOI] [PMC free article] [PubMed] [Google Scholar]
- 2.Morreall JF, Petrova L, Doetsch PW. Transcriptional mutagenesis and its potential roles in the etiology of cancer and bacterial antibiotic resistance. J Cell Physiol. 2013;228:2257–2261. doi: 10.1002/jcp.24400. [DOI] [PMC free article] [PubMed] [Google Scholar]
- 3.Gaillard H, Herrera-Moyano E, Aguilera A. Transcription-associated genome instability. Chem Rev. 2013;113:8638–8661. doi: 10.1021/cr400017y. [DOI] [PubMed] [Google Scholar]
- 4.Lange SS, Takata K, Wood RD. DNA polymerases and cancer. Nat Rev Cancer. 2011;11:96–110. doi: 10.1038/nrc2998. [DOI] [PMC free article] [PubMed] [Google Scholar]
- 5.Sale JE, Lehmann AR, Woodgate R. Y-family DNA polymerases and their role in tolerance of cellular DNA damage. Nat Rev Mol Cell Biol. 2012;13:141–152. doi: 10.1038/nrm3289. [DOI] [PMC free article] [PubMed] [Google Scholar]
- 6.Saxowsky TT, Doetsch PW. RNA polymerase encounters with DNA damage: transcription-coupled repair or transcriptional mutagenesis? Chem Rev. 2006;106:474–488. doi: 10.1021/cr040466q. [DOI] [PubMed] [Google Scholar]
- 7.Kuraoka I, Tanaka K. Assays for transcription elongation by RNA polymerase II using oligo(dC)-tailed template with single DNA damage. Methods Enzymol. 2006;408:214–223. doi: 10.1016/S0076-6879(06)08013-X. [DOI] [PubMed] [Google Scholar]
- 8.You C, et al. A quantitative assay for assessing the effects of DNA lesions on transcription. Nat Chem Biol. 2012;8:817–822. doi: 10.1038/nchembio.1046. [DOI] [PMC free article] [PubMed] [Google Scholar]
- 9.Delaney JC, Essigmann JM. Assays for determining lesion bypass efficiency and mutagenicity of site-specific DNA lesions in vivo. Methods Enzymol. 2006;408:1–15. doi: 10.1016/S0076-6879(06)08001-3. [DOI] [PubMed] [Google Scholar]
- 10.Frick LE, Delaney JC, Wong C, Drennan CL, Essigmann JM. Alleviation of 1,N6-ethanoadenine genotoxicity by the Escherichia coli adaptive response protein AlkB. Proc Natl Acad Sci USA. 2007;104:755–760. doi: 10.1073/pnas.0607377104. [DOI] [PMC free article] [PubMed] [Google Scholar]
- 11.Hong HZ, Cao HC, Wang YS. Formation and genotoxicity of a guanine-cytosine intrastrand cross-link lesion in vivo. Nucleic Acids Res. 2007;35:7118–7127. doi: 10.1093/nar/gkm851. [DOI] [PMC free article] [PubMed] [Google Scholar]
- 12.Yuan BF, Cao HC, Jiang Y, Hong HZ, Wang YS. Efficient and accurate bypass of N2-(1-carboxyethyl)-2′-deoxyguanosine by DinB DNA polymerase in vitro and in vivo. Proc Natl Acad Sci USA. 2008;105:8679–8684. doi: 10.1073/pnas.0711546105. [DOI] [PMC free article] [PubMed] [Google Scholar]
- 13.You C, Dai X, Yuan B, Wang Y. Effects of 6-thioguanine and S6-methylthioguanine on transcription in vitro and in human cells. J Biol Chem. 2012;287:40915–40923. doi: 10.1074/jbc.M112.418681. [DOI] [PMC free article] [PubMed] [Google Scholar]
- 14.You C, Wang P, Dai X, Wang Y. Transcriptional bypass of regioisomeric ethylated thymidine lesions by T7 RNA polymerase and human RNA polymerase II. Nucleic Acids Res. 2014;42:13706–13713. doi: 10.1093/nar/gku1183. [DOI] [PMC free article] [PubMed] [Google Scholar]
- 15.You C, Wang J, Dai X, Wang Y. Transcriptional inhibition and mutagenesis induced by N-nitroso compound-derived carboxymethylated thymidine adducts in DNA. Nucleic Acids Res. 2015;43:1012–1018. doi: 10.1093/nar/gku1391. [DOI] [PMC free article] [PubMed] [Google Scholar]
- 16.You C, Ji D, Dai X, Wang Y. Effects of Tet-mediated oxidation products of 5-methylcytosine on DNA transcription in vitro and in mammalian cells. Sci Rep. 2014;4:7052. doi: 10.1038/srep07052. [DOI] [PMC free article] [PubMed] [Google Scholar]
- 17.Wang J, Wang Y. Chemical synthesis of oligodeoxyribonucleotides containing N3- and O4-carboxymethylthymidine and their formation in DNA. Nucleic Acids Res. 2009;37:336–345. doi: 10.1093/nar/gkn946. [DOI] [PMC free article] [PubMed] [Google Scholar]
- 18.Nagel ZD, et al. Multiplexed DNA repair assays for multiple lesions and multiple doses via transcription inhibition and transcriptional mutagenesis. Proc Natl Acad Sci USA. 2014;111:E1823–E1832. doi: 10.1073/pnas.1401182111. [DOI] [PMC free article] [PubMed] [Google Scholar]
- 19.Rizzo JM, Buck MJ. Key principles and clinical applications of ‘next-generation’ DNA sequencing. Cancer Prev Res. 2012;5:887–900. doi: 10.1158/1940-6207.CAPR-11-0432. [DOI] [PubMed] [Google Scholar]
- 20.Baker D, et al. Nucleotide excision repair eliminates unique DNA-protein cross-links from mammalian cells. J Biol Chem. 2007;282:22592–22604. doi: 10.1074/jbc.M702856200. [DOI] [PubMed] [Google Scholar]
- 21.Luhnsdorf B, et al. Generation of reporter plasmids containing defined base modifications in the DNA strand of choice. Anal Biochem. 2012;425:47–53. doi: 10.1016/j.ab.2012.03.001. [DOI] [PubMed] [Google Scholar]
- 22.Wang H, Hays JB. Simple and rapid preparation of gapped plasmid DNA for incorporation of oligomers containing specific DNA lesions. Mol Biotechnol. 2001;19:133–140. doi: 10.1385/MB:19:2:133. [DOI] [PubMed] [Google Scholar]
- 23.Kitsera N, et al. 8-Oxo-7,8-dihydroguanine in DNA does not constitute a barrier to transcription, but is converted into transcription-blocking damage by OGG1. Nucleic Acids Res. 2011;39:5926–5934. doi: 10.1093/nar/gkr163. [DOI] [PMC free article] [PubMed] [Google Scholar]
- 24.Bregeon D, Peignon PA, Sarasin A. Transcriptional mutagenesis induced by 8-oxoguanine in mammalian cells. PLoS Genet. 2009;5:e1000577. doi: 10.1371/journal.pgen.1000577. [DOI] [PMC free article] [PubMed] [Google Scholar]
- 25.Bregeon D, Doetsch PW. Reliable method for generating double-stranded DNA vectors containing site-specific base modifications. BioTechniques. 2004;37:760–762. doi: 10.2144/04375ST01. 764, 766. [DOI] [PubMed] [Google Scholar]
- 26.Enoiu M, Ho TV, Long DT, Walter JC, Scharer OD. Construction of plasmids containing site-specific DNA interstrand cross-links for biochemical and cell biological studies. Methods Mol Biol. 2012;920:203–219. doi: 10.1007/978-1-61779-998-3_15. [DOI] [PMC free article] [PubMed] [Google Scholar]
- 27.Edelheit O, Hanukoglu A, Hanukoglu I. Simple and efficient site-directed mutagenesis using two single-primer reactions in parallel to generate mutants for protein structure-function studies. BMC Biotechnol. 2009;9:61. doi: 10.1186/1472-6750-9-61. [DOI] [PMC free article] [PubMed] [Google Scholar]
- 28.Bomgarden R, et al. Opposing effects of the UV lesion repair protein XPA and UV bypass polymerase eta on ATR checkpoint signaling. EMBO J. 2006;25:5036–5036. doi: 10.1038/sj.emboj.7601123. [DOI] [PMC free article] [PubMed] [Google Scholar]
- 29.Chowdhury G, Guengerich F. Liquid chromatography-mass spectrometry analysis of DNA polymerase reaction products. Curr Protoc Nucleic Acid Chem. 2011;47:7.16.1–7.16.11. doi: 10.1002/0471142700.nc0716s47. [DOI] [PMC free article] [PubMed] [Google Scholar]