

Abstract
It has been suggested that pharmacogenomic phenotypes are influenced by genetic variants with larger effect sizes than other phenotypes, such as complex disease risk. This is presumed to reflect the fact that relevant environmental factors (drug exposure) are appropriately measured and taken into account. To test this hypothesis, we performed a systematic comparison of effect sizes between pharmacogenomic and non-pharmacogenomic phenotypes across all genome-wide association studies (GWAS) reported in the NHGRI GWAS catalog. We found significantly larger effect sizes for studies focused on pharmacogenomic phenotypes, as compared to complex disease risk, morphological phenotypes, and endophenotypes. We found no significant differences in effect sizes between pharmacogenomic studies focused on adverse events versus those focused on drug efficacy. Furthermore, we found that this pattern persists among sample size-matched studies, suggesting that this pattern does not reflect over-estimation of effect sizes due to smaller sample sizes in pharmacogenomic studies.
Introduction
Genome-wide association studies (GWAS) have successfully identified genetic markers associated with many different phenotypes1. In so doing, GWAS have revealed that many common and complex phenotypes (e.g. disease risk) are influenced by a large number of genetic variants, each of which has a relatively small effect2. Many of these phenotypes have high heritability, but seem to be influenced by hundreds or thousands of causative polymorphisms with modest effects (i.e. polygenic architecture) rather than a few genetic variants with large effects (i.e. mono- or oligogenic architecture). As first shown for height3 and subsequently for a number of other phenotypes4, 5, the total genetic variance combined across all these variants can often explain half or more of the heritability estimated from twin and family studies while highly significantly associated variants (presumably with the largest effects) explain only a small proportion of the heritability. This has complicated efforts to use genetic variants to predict disease risk6., although polygenic risk scores built from a large number of causative variants identified through large-scale genetic studies may be promising path towards clinically useful tests7, 8.
In sharp contrast to the history of attempts to map disease risk, efforts to identify genetic variants associated with drug response (especially risk of adverse events) have been marked by the discovery of individual genetic variants with large effects9. Indeed, there are currently 44 pharmacogenomic tests with sufficient explanatory ability to be used to guide clinical treatment decisions, as recommended by the Clinical Pharmacogenetics Implementation Consortium (i.e. CPIC Level ‘A’)10. Many of these tests are comprised of a small number of genetic variants. Indeed, in some cases only one genetic variant is sufficient to predict treatment outcome (e.g. the HLA-B*5801 allele and hypersensitivity to allopurinol11). These anecdotal observations have led some to suggest that pharmacogenomic phenotypes tend to be influenced by a relatively smaller number of genetic variants with larger effect sizes, especially compared to complex disease risk12, 13. Indeed, in 2012 Giacomini et al observed that GWAS hits from pharmacogenomic studies reported in NHGRI GWAS catalog were 7 times as likely to have odds ratios above 3 as compared to other traits 14. Similarly, Chhibber et al plotted effect sizes from pharmacogenomics study against those from all studies in the NHGRI GWAS catalog to show a trend towards larger effects15. While this is an intriguing possibility, its legitimacy remains unclear as a formal comparison of effect sizes across studies with different types of phenotypes has not yet been performed. In this study, we sought to provide a systematic comparison of effect sizes between categories of phenotypes across all genome-wide association studies reported in the NHGRI GWAS catalog (www.genome.gov/gwastudies16). These categories included complex disease risk, pharmacogenetic traits (adverse events), pharmacogenetic traits (efficacy), morphological traits, and endophenotypes.
Methods
GWAS data
We obtained a list of all significant associations for all phenotypes listed in the NHGRI GWAS catalog1 (http://www.genome.gov/gwastudies/) as of April 23, 2014. These include all associations with p-values less than 10−5 reported in studies included in the catalog, for a total of 16,536 associations. We excluded associations if no effect size was provided, leaving 14,201 associations. We then categorized associations based into continuous and binary phenotypes. Initially, we assigned associations based on keywords (“cases” or “controls” indicated binary phenotypes). These assignments were then manually reviewed and adjusted as necessary. To allow effect sizes to be comparable across phenotypes in the form of odds ratios, we then excluded associations for continuous phenotypes. This left a total of 5,376 variant-phenotype associations. These associations include 4,930 (91.7%) with complex disease risk, 279 (5.2%) with pharmacogenomic phenotypes, and 167 (3.1%) with endophenotypes/morphological phenotypes.
Categorization of studies based on phenotype
We assigned each phenotype to a category based on keywords. Specifically, we determined a set of keywords for each category. We then made a list of all phenotypes included in the catalog. We searched all keywords in each phenotype name. If a phenotype name contained one or more keywords from a given category, it was assigned to that category. Phenotype names that matched multiple categories were flagged and assigned to a single category through manual curation. Keywords for pharmacogenomics phenotypes were: “response”, “adverse”, “induced”, “sensitivity”, “exacerbated”, “interaction”, and “dosage”. Keywords for morphological phenotypes were: “metric”, “weight”, “color”, “eyes”, “mass”, “circumference”, “structure”, “size”, “freckling”, “thickness”, “curvature”, and “stiffness”. Keywords for endophenotypes were: “trait”, “antibody”, “biomarker”, “activity”, and “reactivity”. Some phenotypes contained keywords for multiple categories. Specifically, we observed the following: 4 phenotypes had both pharmacogenomics and morphological keywords, 11 phenotypes had both pharmacogenomics and endophenotype keywords, and 10 phenotypes had both morphological and endophenotype keywords. These associations were flagged and resolved through manual review. To ensure the quality of keyword-based assignment, all phenotypes were validated, and modified as needed, through manual curation. Phenotype assignments are listed in Supplementary Table 1.
Comparison of odds ratio distribution between phenotype categories
We used a Wilcoxon Rank-Sum test to test for significant differences in median odds ratio between pairs of categories.
Additionally, we used re-sampling analyses to estimate null distributions of summary statistics (e.g. median odds ratio) and compare them between categories while controlling for specific parameters. To determine if the median odds ratio for pharmacogenomics phenotypes was significantly different from the median odds ratio for non-pharmacogenomic phenotypes, we randomly re-sampled an equal number of studies 10,000 times. For each re-sampling, we recorded the median odds ratio. We then used the distribution of median odds ratios from these re-samplings as null distribution. As re-sampling was performed on studies, rather than individual variant-phenotype pairs, these analyses took into account the potential correlation of odds ratios within studies.
We used a similar re-sampling procedure to compare the median odds ratio between pharmacogenetic studies and complex disease risk studies while controlling for sample size. Sample size was defined as the sum of the number of cases and the number of controls used to obtain the association result. To describe the distribution of sample sizes for pharmacogenomics studies, we counted the number of studies in each of nine bins. Bins spanned the range of observed sample sizes and were broken at regular intervals in log10 space. Specifically, the following bins, in terms of log10 sample sizes, were used: <=2 (8 studies), >2 and <=2.2 (8 studies), >2.2 and <=2.4 (9 studies), >2.4 and <=2.6 (13 studies), >2.6 and <=2.8 (4 studies), >2.8 and <=3 (7 studies), >3 and <=3.2 (7 studies), >3.2 and <=3.4 (3 studies), and >3.4 and <=3.6 (6 studies). For 10,000 iterations, we randomly sampled an equal number of complex disease risk studies with matching sample sizes for each bin and recorded the median odds ratio. The total number of available complex disease risk traits for each bin were: <=2 (3 studies), >2 and <=2.2 (6 studies), >2.2 and <=2.4 (10 studies), >2.4 and <=2.6 (11 studies), >2.6 and <=2.8 (31 studies), >2.8 and <=3 (49 studies), >3 and <=3.2 (73 studies), >3.2 and <=3.4 (130 studies), and >3.4 and <=3.6 (120 studies). As there were too few complex disease risk studies in the bins with less than 398 (102.6) samples, we excluded studies of this size from both the pharmacogenomic and complex diseas risk categories. All analyses were performed in the statistical programming language R (http://www.r-project.org).
Results
Summary of included studies
We collected a set of 5,376 variant-phenotype associations from the GWAS catalog corresponding to 822 published studies (summarized by phenotype category in Table 1). The vast majority of these associations were from studies of complex disease risk (91%). Approximately 5.7% of the studies and associations corresponded to pharmacogenomic phenotypes. The remainder of these associations came from studies focused on either endophenotypes (e.g. LDL cholesterol) or morphological phenotypes (e.g. hair color). Many endophenotypes are measured on a continuous scale. To allow us to compare standardized effect sizes across categories, we only included associations reported in odds ratio. We were still able to capture traits traditionally measured as continuous variables, however, as many of these studies set thresholds to transform continuous measurements into binary variables. For example, we included association results from a GWAS of body mass index that compared the upper and lower 5th percentiles of body mass index17.
Table 1.
Summary of association characteristics by phenotype category.
| Complex disease risk | Pharmacogenomic phenotypes | Endophenotypes/morphological phenotypes | |
|---|---|---|---|
| # Associations (%) | 4930 (91.7) | 279 (5.2) | 167 (3.1) |
| # Studies (%) | 748 (91) | 47 (5.7) | 33 (4) |
| Median log10 sample size (standard deviation) | 3.8 (0.58) | 2.53 (0.43) | 3.7 (0.5) |
| Median minor allele frequency | 0.28 | 0.23 | 0.23 |
Pharmacogenetic studies report larger effect sizes than other phenotypes
We found that the distribution of odds ratios for pharmacogenomic phenotypes showed a strong skew towards larger odds ratios relative to other phenotypes (Figure 1A). Specifically, we found that pharmacogenomic phenotypes (from 47 studies) had a median odds ratio of 2.5 versus a median odds ratio of 1.25 for complex disease risk (748 studies). A Wilcoxon Rank-Sum test showed that these distributions were highly significantly different (P=7.2×10−111). To account for the dependence structure between associations from the same studies, we used a re-sampling approach to generate a null distribution of median odds ratios expected from a random sampling of all included studies. In each permutation, all studies were randomly designated as either “pharmacogenomic” or “non-pharmacogenomic” according to the proportions observed in our data (~5.7% of studies involve pharmacogenomics traits). In 10,000 permutations, none showed a median odds ratio as large as we observed for pharmacogenomics phenotypes (Figure 1B).
Figure 1.
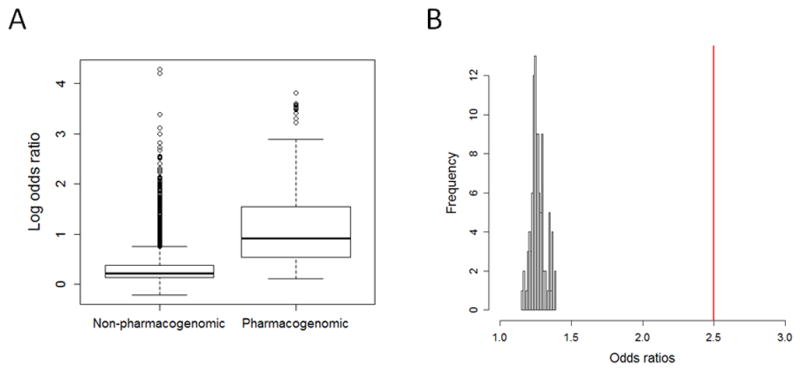
Pharmacogenomic associations tend to yield larger odds ratios than other phenotypes. A) Boxplot shows the distribution of natural log odds ratios between pharmacogenomic and non-pharmacogenomic phenotypes. Odds ratios for pharmacogenomic phenotypes were significantly larger than non-pharmacogenomic phenotypes (P=7.2×10−111). Boxes represent the first to third quartiles and whiskers represent 1.5 times the interquartile range from the upper and lower quartile. B) Histogram in grey shows the distribution of median odds ratios from 10,000 re-samplings where studies were randomly designated as “pharmacogenomic” or “non-pharmacogenomic” according to the observed proportions of these categories. The red line corresponds to the median odds ratio observed for actual pharmacogenomic studies, which is much larger than any median observed in 10,000 re-samplings.
Distribution of effect sizes similar between adverse events and drug efficacy
Many of the strongest associations observed for pharmacogenomic traits have involved prediction of adverse events. To determine if the tendency for large odds ratios in pharmacogenomics phenotypes was driven by adverse event phenotypes as opposed to drug efficacy phenotypes, we compared the distribution of odds ratios between studies focused on these two sub-categories. We found no significant differences in effect sizes between pharmacogenetic studies focused on adverse events compared to those focused on drug efficacy (Figure 2, P=0.49). Indeed, the median odds ratio for drug efficacy phenotypes (3) was slightly higher (not significantly) than for adverse events (2.39).
Figure 2.
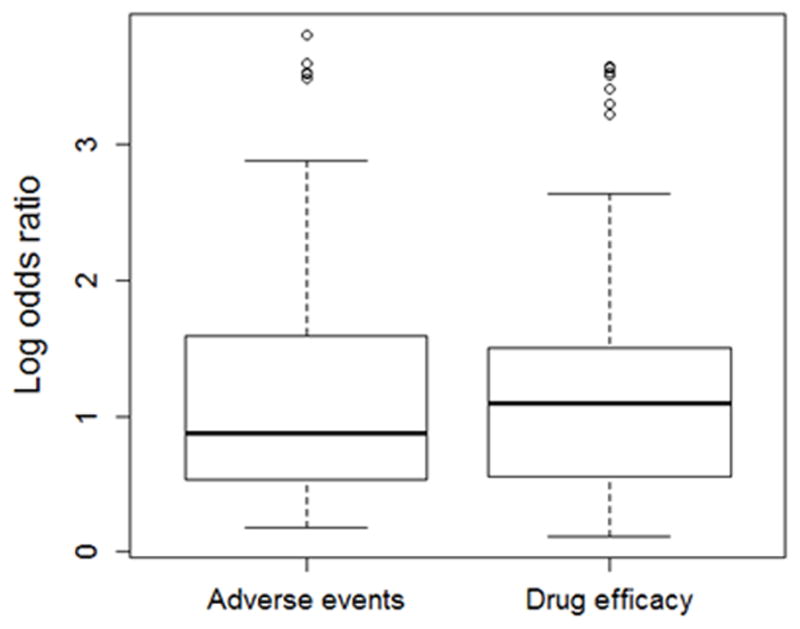
Adverse events and drug efficacy phenotypes have similar distributions of effect sizes. Boxplot shows distribution of natural log odds ratios by sub-category of pharmacogenomic phenotype (adverse event versus drug efficacy), which were not significantly different (P = 0.49). Boxes represent the first to third quartiles and whiskers represent 1.5 times the interquartile range from the upper and lower quartile.
Pharmacogenetic studies report larger effect sizes than endophenotypes and morphological phenotypes
It has also been suggested that endophenotypes may be influenced by a smaller number of genetic variants with larger effects as compared to disease risk18. In support of this hypothesis, we found that associations with endophenotypes had significantly higher odds ratios than disease risk (Figure 3, median odds ratio for endophenotypes = 1.52, P = 6×10⁻¹¹). Interestingly, morphological phenotypes, which are measurements of anatomical features such as hair or eye color, tended to have slightly larger odds ratios as compared to endophenotypes. Specifically, median odds ratio for morphological phenotypes was 1.7, which was significantly larger than that for endophenotypes (Figure 3 P = 6.3×10⁻⁴) and disease risk (P = 8.8×10⁻¹⁶). Still, we found that pharmacogenomic phenotypes had significantly larger odds ratios than either endophenotypes (Figure 3, P = 5.7×10⁻¹⁸) or morphological traits (Figure 3, P = 3.4×10⁻³).
Figure 3.
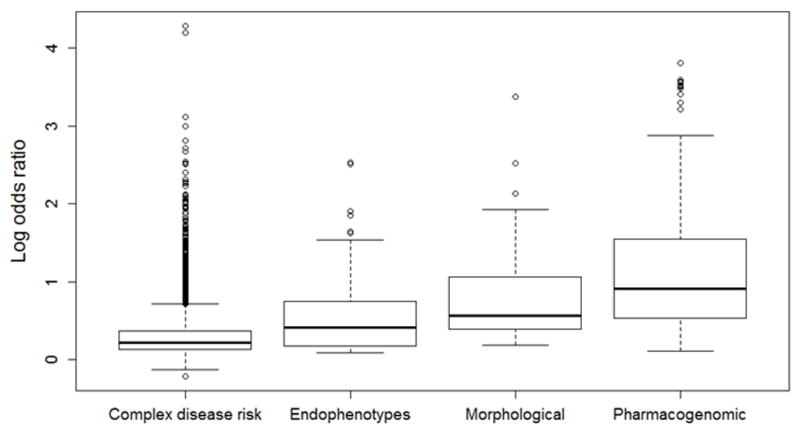
Phenotype categories show a range of effect size distributions, with the larger effects observed for pharmacogenomic phenotypes. Boxplot shows distribution of natural log odds ratios by category of phenotype. Endophenotypes have significantly larger odds ratios than complex disease risk (P=6×10⁻¹¹), but smaller odds ratios than morphological phenotypes (P=6.3×10⁻⁴). In turn, pharmacogenomic phenotypes have significantly larger odds ratios than morphological phenotypes (P = 3.4×10⁻³). Boxes represent the first to third quartiles and whiskers represent 1.5 times the interquartile range from the upper and lower quartile.
Larger effect sizes in pharmacogenetic studies not explained by smaller sample size
We observed that pharmacogenetic studies tended to have smaller much sample sizes than complex disease risk studies (P = 8.7×10−148, Table 1 and Figure 4A). It is possible that the larger odds ratios we observed could reflect systematically inflated estimates due to the tendency for smaller sample sizes. To test this hypothesis, we generated random sets of complex disease risk studies with distributions of sample sizes that mirrored those observed for pharmacogenomics phenotypes. We found that the observed median odds ratio for pharmacogenomic studies was significantly larger than the expected median odds ratio from a random sample of similarly sized complex disease risk studies (P = 0.047, Figure 4B).
Figure 4.

Larger odds ratios for pharmacogenomic studies is not explained by smaller sample sizes. A) Boxplot shows the distribution of log10 sample sizes between pharmacogenomic and non-pharmacogenomic phenotypes. Studies of pharmacogenomic phenotypes tend to have significantly smaller sample sizes (P = 8.7×10−148). Boxes represent the first to third quartiles and whiskers represent 1.5 times the interquartile range from the upper and lower quartile. B) Histogram in grey shows the distribution of median odds ratios from 10,000 random re-samplings of complex disease risk studies with matching sample size distributions. The red line corresponds to the median odds ratio (1.74) observed for actual pharmacogenomic studies with N>398, which is significantly larger than expected for complex disease risk studies with similar sample sizes (P = 0.047).
Discussion
Analysis of association results included in the NHGRI GWAS catalog revealed a significant trend towards larger effect sizes for associations between genetic variants and pharmacogenomics phenotypes as compared to other types of phenotypes. Indeed, we found that the median odds ratio for pharmacogenomics phenotypes (2.5) was twice as large as that observed for associations with complex disease risk (1.25). Morphological and endophenotypes also showed larger effect sizes than complex disease risk, but still tended to be smaller than effect sizes for pharmacogenomic phenotypes. We also observed that pharmacogenomic studies tended to have lower sample sizes than studies of other phenotypes. Differences in sample size do not explain the observed differences in odds ratio distribution, however, as significant differences in odds ratio persist when similarly sized studies of pharmacogenomics and complex disease risk phenotypes are compared. This observation raises the intriguing possibility that additional pharmacogenomic associations may have large enough effects to be eventually translated into clinical practice. While it is difficult to draw conclusions about clinical utility solely based on odds ratio (see Manolio TA 201319 for a detailed discussion of odds ratio from GWAS and predictive ability), two prominent examples of clinically implemented pharmacogenetic tests reflect associations identified in GWAS with odds ratios well within the range observed for all pharmacogenomic associations in this study (SLCO1B1-simvastatin with odds ratio of 4.5 20 and IL28-peginterferon with an odds ratio of 2 21).
Larger effect sizes for pharmacogenomics associations may reflect inherent differences in study design for pharmacogenomics studies. Specifically, pharmacogenomic phenotypes are actually interaction effects between biological measurements (e.g. adverse events or disease processes) and drug treatment. For drug efficacy studies, the phenotype is often a summary of the change in disease processes measured before and after treatment, while for adverse events, there is at least appropriate utilization of information on drug exposure, and often incorporation of information on dose to event. Consequently, the measurement and analysis of pharmacogenomic phenotypes incorporates information on the most relevant environmental factors affecting the phenotypes – drug exposure. This should reduce non-genetic variance, and as observed, increase estimates of effect size. Moreover, many of these studies were performed as a part of clinical trials for the corresponding drugs. Therefore, the tendency for larger effects sizes that we observe may be due in part to the use of more carefully measured and controlled phenotype data.
It has been suggested that larger effects in pharmacogenomics studies may reflect negative selection on non-pharmacogenetic phenotypes, especially disease risk. The underlying hypothesis is that drug exposure is a recent phenomenon in human evolution. As a result, alleles with large deleterious effects in the presence of drug have been able to rise to high frequency through drift. Indeed, some pharmacogenomic alleles may have increased in frequency through positive selection as a consequence of non-pharmacological phenotypic effects (e.g. CYP3A drug metabolizing enzymes and salt sensitivity22). At the very least, the intermittent nature of exposures that induce pharmacogenomics phenotypes (inadvertent through diet, or more recently purposeful through drug therapy) increases the possibility that alleles reducing activity of drug metabolizing enzymes and transporters can rise to intermediate frequencies. Alleles with similar effect sizes but that influence other phenotypes that may have been more deleterious over the course of human evolution (e.g. increasing risk of developing childhood cancer), would be subject to negative selection and would have a decreased probability of reaching intermediate frequency (see discussion in 23).
Supplementary Material
Acknowledgments
Funding:
JCM was supported by a Clinical Therapeutics training grant to the University of Chicago (T32GM007019). The funders had no role in study design, data collection and analysis, decision to publish, or preparation of the manuscript.
Footnotes
Conflict of Interest
The authors state no conflict of interest.
References
- 1.Welter D, MacArthur J, Morales J, Burdett T, Hall P, Junkins H, et al. The NHGRI GWAS Catalog, a curated resource of SNP-trait associations. Nucleic Acids Res. 2014;42(Database issue):D1001–1006. doi: 10.1093/nar/gkt1229. [DOI] [PMC free article] [PubMed] [Google Scholar]
- 2.Manolio TA, Collins FS, Cox NJ, Goldstein DB, Hindorff LA, Hunter DJ, et al. Finding the missing heritability of complex diseases. Nature. 2009;461(7265):747–753. doi: 10.1038/nature08494. [DOI] [PMC free article] [PubMed] [Google Scholar]
- 3.Yang J, Benyamin B, McEvoy BP, Gordon S, Henders AK, Nyholt DR, et al. Common SNPs explain a large proportion of the heritability for human height. Nat Genet. 2010;42(7):565–569. doi: 10.1038/ng.608. [DOI] [PMC free article] [PubMed] [Google Scholar]
- 4.Yang J, Lee T, Kim J, Cho MC, Han BG, Lee JY, et al. Ubiquitous polygenicity of human complex traits: genome-wide analysis of 49 traits in Koreans. PLoS Genet. 2013;9(3):e1003355. doi: 10.1371/journal.pgen.1003355. [DOI] [PMC free article] [PubMed] [Google Scholar]
- 5.Vinkhuyzen AA, Wray NR, Yang J, Goddard ME, Visscher PM. Estimation and partition of heritability in human populations using whole-genome analysis methods. Annu Rev Genet. 2013;47:75–95. doi: 10.1146/annurev-genet-111212-133258. [DOI] [PMC free article] [PubMed] [Google Scholar]
- 6.Evans DM, Visscher PM, Wray NR. Harnessing the information contained within genome-wide association studies to improve individual prediction of complex disease risk. Hum Mol Genet. 2009;18(18):3525–3531. doi: 10.1093/hmg/ddp295. [DOI] [PubMed] [Google Scholar]
- 7.Jostins L, Barrett JC. Genetic risk prediction in complex disease. Hum Mol Genet. 2011;20(R2):R182–188. doi: 10.1093/hmg/ddr378. [DOI] [PMC free article] [PubMed] [Google Scholar]
- 8.Dudbridge F. Power and predictive accuracy of polygenic risk scores. PLoS Genet. 2013;9(3):e1003348. doi: 10.1371/journal.pgen.1003348. [DOI] [PMC free article] [PubMed] [Google Scholar]
- 9.Roden DM, Wilke RA, Kroemer HK, Stein CM. Pharmacogenomics: the genetics of variable drug responses. Circulation. 2011;123(15):1661–1670. doi: 10.1161/CIRCULATIONAHA.109.914820. [DOI] [PMC free article] [PubMed] [Google Scholar]
- 10.Caudle KE, Klein TE, Hoffman JM, Muller DJ, Whirl-Carrillo M, Gong L, et al. Incorporation of Pharmacogenomics into Routine Clinical Practice: the Clinical Pharmacogenetics Implementation Consortium (CPIC) Guideline Development Process. Curr Drug Metab. 2014;15(2):209–217. doi: 10.2174/1389200215666140130124910. [DOI] [PMC free article] [PubMed] [Google Scholar]
- 11.Somkrua R, Eickman EE, Saokaew S, Lohitnavy M, Chaiyakunapruk N. Association of HLA-B*5801 allele and allopurinol-induced Stevens Johnson syndrome and toxic epidermal necrolysis: a systematic review and meta-analysis. BMC Med Genet. 2011;12:118. doi: 10.1186/1471-2350-12-118. [DOI] [PMC free article] [PubMed] [Google Scholar]
- 12.Daly AK. Genome-wide association studies in pharmacogenomics. Nat Rev Genet. 2010;11(4):241–246. doi: 10.1038/nrg2751. [DOI] [PubMed] [Google Scholar]
- 13.Ritchie MD. The success of pharmacogenomics in moving genetic association studies from bench to bedside: study design and implementation of precision medicine in the post-GWAS era. Hum Genet. 2012;131(10):1615–1626. doi: 10.1007/s00439-012-1221-z. [DOI] [PMC free article] [PubMed] [Google Scholar]
- 14.Giacomini KM, Yee SW, Ratain MJ, Weinshilboum RM, Kamatani N, Nakamura Y. Pharmacogenomics and patient care: one size does not fit all. Sci Transl Med. 2012;4(153):153ps118. doi: 10.1126/scitranslmed.3003471. [DOI] [PMC free article] [PubMed] [Google Scholar]
- 15.Chhibber A, Kroetz DL, Tantisira KG, McGeachie M, Cheng C, Plenge R, et al. Genomic architecture of pharmacological efficacy and adverse events. Pharmacogenomics. 15(16):2025–2048. doi: 10.2217/pgs.14.144. [DOI] [PMC free article] [PubMed] [Google Scholar]
- 16.Hindorff LA, JH, Hall PN, Mehta JP, Manolio TA. A Catalog of Published Genome-Wide Association Studies. 2011 Available at: www.genome.gov/gwastudies.
- 17.Berndt SI, Gustafsson S, Magi R, Ganna A, Wheeler E, Feitosa MF, et al. Genome-wide meta-analysis identifies 11 new loci for anthropometric traits and provides insights into genetic architecture. Nat Genet. 45(5):501–512. doi: 10.1038/ng.2606. [DOI] [PMC free article] [PubMed] [Google Scholar]
- 18.Gibson G. Rare and common variants: twenty arguments. Nat Rev Genet. 2011;13(2):135–145. doi: 10.1038/nrg3118. [DOI] [PMC free article] [PubMed] [Google Scholar]
- 19.Manolio TA. Bringing genome-wide association findings into clinical use. Nat Rev Genet. 14(8):549–558. doi: 10.1038/nrg3523. [DOI] [PubMed] [Google Scholar]
- 20.Link E, Parish S, Armitage J, Bowman L, Heath S, Matsuda F, et al. SLCO1B1 variants and statin-induced myopathy--a genomewide study. N Engl J Med. 2008;359(8):789–799. doi: 10.1056/NEJMoa0801936. [DOI] [PubMed] [Google Scholar]
- 21.Suppiah V, Moldovan M, Ahlenstiel G, Berg T, Weltman M, Abate ML, et al. IL28B is associated with response to chronic hepatitis C interferon-alpha and ribavirin therapy. Nat Genet. 2009;41 (10):1100–1104. doi: 10.1038/ng.447. [DOI] [PubMed] [Google Scholar]
- 22.Thompson EE, Kuttab-Boulos H, Witonsky D, Yang L, Roe BA, Di Rienzo A. CYP3A variation and the evolution of salt-sensitivity variants. Am J Hum Genet. 2004;75(6):1059–1069. doi: 10.1086/426406. [DOI] [PMC free article] [PubMed] [Google Scholar]
- 23.Di Rienzo A. Population genetics models of common diseases. Curr Opin Genet Dev. 2006;16(6):630–636. doi: 10.1016/j.gde.2006.10.002. [DOI] [PubMed] [Google Scholar]
Associated Data
This section collects any data citations, data availability statements, or supplementary materials included in this article.