Abstract
The use of diffusion tensor imaging (DTI) for studying the human heart in vivo is very challenging due to cardiac motion. This paper assesses the effects of cardiac motion on the human myocardial fiber architecture. To this end, a model for analyzing the effects of cardiac motion on signal intensity is presented. A Monte-Carlo simulation based on polarized light imaging data is then performed to calculate the diffusion signals obtained by the displacement of water molecules, which generate diffusion weighted (DW) images. Rician noise and in vivo motion data obtained from DENSE acquisition are added to the simulated cardiac DW images to produce motion-induced datasets. An algorithm based on principal components analysis filtering and temporal maximum intensity projection (PCATMIP) is used to compensate for motion-induced signal loss. Diffusion tensor parameters derived from motion-reduced DW images are compared to those derived from the original simulated DW images. Finally, to assess cardiac motion effects on in vivo fiber architecture, in vivo cardiac DTI data processed by PCATMIP are compared to those obtained from one trigger delay (TD) or one single phase acquisition. The results showed that cardiac motion produced overestimated fractional anisotropy and mean diffusivity as well as a narrower range of fiber angles. The combined use of shifted TD acquisitions and postprocessing based on image registration and PCATMIP effectively improved the quality of in vivo DW images and subsequently, the measurement accuracy of fiber architecture properties. This suggests new solutions to the problems associated with obtaining in vivo human myocardial fiber architecture properties in clinical conditions.
Index Terms: Diffusion tensor imaging (DTI), fiber architecture, in vivo heart, motion, polarized light imaging
I. Introduction
Diffusion tensor imaging (DTI) allows for noninvasive assessment and quantification of water molecule diffusion behavior in tissues in vivo [1]. In simple water molecule diffusion models, the directional dependence of diffusion can be defined by diffusion tensors. Three-dimensional diffusion tensors can be visualized as ellipsoids with major, medium, and minor axes defined by the diffusion tensor’s three eigenvectors. The major axis, which corresponds to the largest of the three eigenvectors, reflects the direction of the maximum diffusion probability and thus the averaged orientation of the local muscle fiber tracts passing through the voxel [2]–[4]. Cardiac DTI has been used to depict the fiber architecture of the human heart in healthy individuals [5]–[11] and patients [12], [13]. Fractional anisotropy (FA) and mean diffusivity (MD) have been shown to provide quantitative information regarding the spatial coherence of cellular structures and the average intra-voxel water molecule mobility, respectively [14]. These parameters have been used in ex vivo cardiac DTI measurement [15]–[18] and also in vivo DTI to characterize the fiber integrity of the myocardium in patients [12], [13]. However, patient status or heart motion in in vivo DTI greatly influences the image quality because DTI is motion sensitive [19]–[21]. Moreover, the low signal-to-noise ratio (SNR) of in vivo images can also cause estimation errors in these measures [22].
To date, very few studies have investigated the impact of cardiac motion on diffusion measurement and fiber architecture properties in beating human hearts. One of the main difficulties lies in the fact that cardiac motion induces large signal loss and has complex effects on diffusion tensors. Compared to computational imaging methods such as DTI, polarized light imaging (PLI) appears to be the only technique that allows for physical measurement of the fiber orientation of the entire human heart in 3-D with high spatial resolution (100 × 100 ×500 μm3) [31], although other high spatial resolution 3-D DTI studies have also been reported in the literature, but on the small animal hearts (with a resolution of 117 × 117 × 234 μm3) [23]. PLI provides the ground truth of the human cardiac fiber architecture; however, PLI can only be used in ex vivo hearts. On the other hand, displacement encoding with stimulated echoes (DENSE) [26] sequences can provide high spatial resolution 3-D displacement fields of the human heart in vivo. This has motivated us to investigate cardiac motion effects on the measurement of in vivo fiber architecture in a multimodal approach. More precisely, our method consists of: 1) using physical measurements from PLI to generate realistic DW images at different gradient diffusion directions [24], [25], 2) integrating motion information of the beating human heart obtained from DENSE [26] acquisition, 3) establishing an empirical model describing the relationship between cardiac motion and diffusion signal intensity (SI), 4) applying this model to the simulated DW images to imitate the in vivo acquisition of DW images, 5) applying the principal components analysis filtering technique combined with temporal maximum intensity projection (PCATMIP) [27], [28] to the simulated and in vivo DW images to obtain motion corrected images, and 6) computing the corresponding diffusion tensor parameters and fiber architecture properties.
II. Materials and Methods
A. Polarized Light Imaging
PLI data were acquired using an ex vivo human heart via the procedure detailed in [31]. The heart was fixed in formaldehyde (4% neutral buffer) and was embedded in a methyl-methacrylate (MMA) resin. It was then mounted on a microtome (Leica Microsystems, Wetzlar, Germany) stage and the plane of serial sectioning was determined such that it was parallel to the diaphragmatic face of the heart. A series of 500-μm sections was cut using a rotary microtome. Sections were then imaged using the polarized light optical bench developed in TIMC-IMAG (University of Joseph Fourier Grenoble I, France). Briefly, the section was placed on a stage and illuminated with parallel rays of polarized light. After traversing the section, this light was collected through an orientable full-wave plate and a crossed polarizer. The intensity of the resulting interfering light was measured with a charge-coupled device (CCD) camera. For a single section, a set of 12 images was collected using various orientations of the crossed polarizers and full wave plate with a specific spatial resolution (100 × 100 μm2. From these images, the elevation and azimuth angles of cardiac fibers at each voxel were derived. All tissues were obtained in compliance with French legal and ethical guidelines.
B. Cardiovascular Magnetic Resonance Imaging
The cardiovascular magnetic resonance (CMR) in vivo experiments were performed with a 1.5T clinical scanner (MAGNETOM Avanto, Siemens AG, Healthcare Sector, Erlangen, Germany) with a maximum gradient strength of 45 mT/m and maximum slew rate of 200 mT/m/ms. Six healthy volunteers were recruited for this study, including four males and two females with a mean age of 30 9 years (from 25 to 50 years) and a mean heart rate (HR) of 56 10 beats/min (bpm). All subjects gave informed consent to the institutional review board-approved study protocol prior to participation.
To model the influence of cardiac motion on in vivo DTI, 3-D displacement fields were obtained from a DENSE acquisition according to [26]. A total of 20 frames were acquired with a time resolution of 50 ms covering the entire RR cycle during breath-holding conditions.
For each subject, both DENSE data and DW images were acquired in the short-axis view at the mid-ventricular level. Prior to each acquisition, standard two-chamber, four-chamber and short-axis cines were acquired.
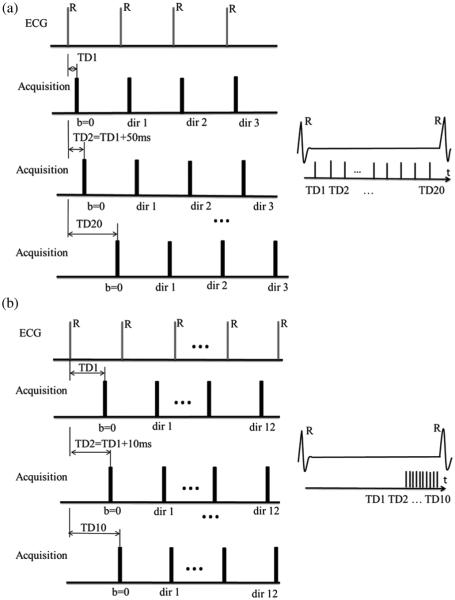
For the DW image acquisitions, two different types of datasets were collected. The corresponding acquisition schemes are illustrated in Fig. 1(a) and (b), respectively.
Fig. 1.
Two DW image acquisition schemes. (a) DW images acquisition at the same time points as in the DENSE acquisitions: the 20 TDs of the DW images were determined by DENSE acquisitions. (b) DW acquisition devoted to in vivo DTI: the 10 DW images were acquired with TD increased by 10 ms inside a diastolic time window. “TD” in the schemes refers to trigger delay.
DW images were acquired at the same time points of the cardiac cycle as in the DENSE acquisitions to study the relationship between regional signal loss and cardiac motion. The trigger delay (TD) was increased 20 times (20 TDs), in order to produce a series of multi-TD (or multi-phase) DW images with the same temporal resolution as the DENSE acquisitions [Fig. 1(a)]. The first TD (TD1) corresponds to 50 ms after the R-wave trigger. For each TD, three DW acquisitions with three orthogonal gradient directions (x, y, z) were obtained to produceb = 200 s/mm2 DW images. In total, 80 DW images, including 20 b0 images (corresponding to null diffusion gradient), were acquired under breath-holding conditions to explore the entire cardiac cycle.
Whole heart DTI images were then acquired with minimal signal loss, i.e., at the end of diastole [Fig. 1(b)]. These datasets are devoted to investigating in vivo cardiac DTI. The acquisitions occurred inside an optimal time-window that corresponded to the smallest amount of cardiac motion toward the end of diastole. To achieve this in the acquired short-axis and long-axis cine sequences, we sought the time-window of smallest motion at the end of diastole. For the first time point or TD (e.g., 850 ms), we acquired one b0 image and 12 DW images corresponding to the 12 diffusion gradient directions in the optimal time-window. By shifting the TD (by 10 ms), we acquired another b0 image and 12 DW images at the next time point, which corresponded to the same 12 gradient directions. By repeating the TD shifting 10 times, we acquired a total of 10 × 13 = 130 multi-phase images for each slice. The total scan time was approximately 2 min for each slice under free-breathing conditions. Compared to acquisition scheme 1 [Fig. 1(a)], acquisition scheme 2 had higher temporal resolution (10 ms instead of 50 ms), and its TDs occurred in the optimal time-window situated toward the end of diastole rather than covering the entire cardiac cycle.
All diffusion images were acquired using a single-shot twicerefocused spin-echo EPI sequence with optimized bipolar diffusion encoding gradients [32], [33], improved fat suppression using a gradient reversal technique [34], and standard global phase correction. The localized firstand second-order shimming was performed with an adjustment box fitting the entire heart. The sequence parameters used for the study are listed in Table I.
TABLE I.
Sequence Parameters Used in the Present Study
| Cine trueFISP | FOV: 287 ×400 mm2
Matrix: 184 ×256 Resolution: 1.56 ×1.56×8 mm3 TE/TR= 1.49/35.76 ms Flip angle = 70° 29 cardiac phases |
Breath-holding Acquisition time ~30s |
| DENSE | FOV: 168 ×448 mm2
Matrix: 48 × 128 Resolution: 3.5 ×3.5×8 mm3 TE/TR = 2/50 ms 20 cardiac phases |
Breath-holding Acquisition time ~20s |
| DW imaging with scheme 1 |
FOV: 236 ×420 mm2
Matrix: 90 ×160 Resolution: 2.63 ×2.63×6 mm3 TE/TR = 51/100 ms Partial Fourier acquisition: 6/8 |
Breath-holding Acquisition time ~4s b-value = 200 s/mm2 |
| DW imaging with scheme 2 |
FOV: 236 ×420 mm2
Matrix: 90 × 160 Resolution: 2.63 ×2.63×6 mm3 TE/TR = 51/110 ms Partial Fourier acquisition: 6/8 |
Free-breathing Acquisition time ~ 13s b-value = 200 s/mm2 |
C. Simulation of Cardiac Motion in DTI Using DENSE Sequences: Toward a Motion Model
The signal decay as a function of the B-value is defined in the case of static organs by
| (1) |
where SI represents the signal intensity, b denotes the b-value which determines the amount of diffusion-weighting, represents the signal intensity for b = 0, and D represents the diffusion coefficient related to molecular mobility. However, this model does not take into account the signal attenuation caused by cardiac motion. In the presence of motion, the diffusion gradients not only encode molecular motion (diffusion) but also generate an additional signal attenuation term. This term reflects the fact that the diffusion gradients encode the displacement of the moving object and generate a phase term according to the principle of DENSE using so-called motion encoding gradients
| (2) |
where φ represents the phase shift resulting from the displacement of proton spins, γ is the proton gyromagnetic ratio, G is the gradient pulse in a given diffusion gradient direction, and r is the displacement component of the spins in the diffusion gradient direction. Unlike the diffusion attenuation term S0 · e−bD, the attenuation, e−iφ, owing to tissue motion is spatially variable, unpredictable and several orders of magnitude larger than diffusion.
CMR techniques sensitive to phase variations [35] are usually affected by longitudinal cardiac motion (through-plane motion), which leads to additional signal loss [8]. To establish the motion model, the amplitude of the relative longitudinal displacement between two consecutive time points and the DW SI were derived from all pixels averaging in each region of interest (ROI). The LV was divided into six myocardial ROIs corresponding to American Heart Association (AHA) segments [36], and the normalized myocardium SI was plotted as a function of the mean motion of each ROI. In vivo DW SI attenuation in the presence of heart motion results from a complex process. It is not straightforward to integrate such motion in the Bloch–Torrey equations describing the precession of spins in an external magnetic field B, as well as the concurrent relaxation and diffusion effects in field B. As a first approach, we simplified the process by considering that the relationship between DW SI and cardiac motion can be modeled as an attenuation of magnetization. We then modeled the relationship between the relative longitudinal displacement amplitude (as a surrogate for cardiac motion) and SI as an exponential function regression defined by
| (3) |
where y represents the normalized SI of 20 time-course signal points inside a given sector and during one cardiac cycle, x represents the mean motion of each sector, A and B represent the regression coefficients, and ε represents the remaining difference between the data and the model. A moving average (MA) filter was applied to the DW SI data to identify the underlying trends hidden in the measured data. The MA filter smoothes data by replacing each data point with the data averaged in a neighborhood, according to the equation ys(i) = (1/(2N+1))(y(i+N)+y(i+N−1)+ … + y(i−N)) where ys(i) is the smoothed value for the ith data point, N is the number of neighboring data points on both sides of the current data point, and 2N + 1 defines the size of neighborhood. In the present study, we chose N = 2. The estimation of the regression error was evaluated by the absolute measure of fit, the root mean square error (RMSE), and a relative measure of fit, the coefficient of determination (R–square). They are defined by
| (4) |
where yi is the acquired data value, is the predicted value from the fit and ωi is the weighting applied to each data point, and
| (5) |
where is the mean of acquired data.
In the above definitions, usually ωi = 1. An value close to 0 indicates that the model has a smaller random error and that the fit will be more useful for prediction. An R–square value close to 1 indicates that a greater proportion of variance is accounted for by the model.
D. Simulation of Realistic Cardiac DTI Using PLI
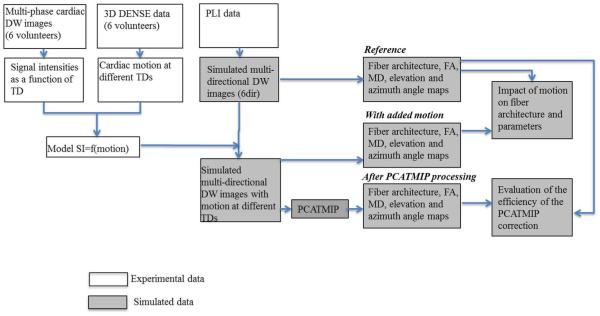
Fig. 2 presents a flowchart describing simulated DW data generation, postprocessing and analysis. First, the diffusion behavior of water molecules in the cardiac fiber structure was simulated based on a series of cardiac PLI data using the Monte Carlo method [24], [25]. In the simulation, six diffusion gradient directions ([1 0 0; 0 1 0; 0 0 1; 0.707 0.707 0; 0 0.707 0.707; 0.707 0 0.707]) were applied and the diffusion coefficient for the water molecules in the cardiac tissue was set to 1 × 10⁻³ mm2/s in all the directions. Six DW images were then generated, from which the reference tensor field as well as FA, MD, and fiber angles were calculated. Second, Rician noise was added to the simulated DW images to imitate real noise situations before motion was incorporated [37]. The added Rician noise had a standard deviation of σR = 17 with respect to the SI of 102, which corresponded to a SNR of 6 (which is the same as that used in previously published work) [27]. In parallel, the average motion was calculated from the 20 displacement fields obtained using a DENSE sequence for all six healthy volunteers. The raw data obtained by the DENSE acquisition were processed using IDL (Research systems, Inc., Boulder, CO, USA); phase map differences were constructed using the reference scan and the encoded images [26]. Following manual myocardial border segmentation, the maps were phase-unwrapped and scaled to the position-encoding gradient strength, yielding separate displacement maps for the x, y, and z directions. The corresponding signal loss was calculated using the motion model described above [(3)] and was added to the noise-simulated DW images to yield multi-directional DW images mimicking noisy in vivo cardiac DW images contaminated with realistic intrascan cardiac motion. Because the DENSE encoded data had a temporal resolution of 50 ms, we used linear interpolation to interpolate the cardiac diastolic motion to achieve a temporal resolution of 10 ms. Ten DW images at 10 TDs in diastole with intensity fluctuations induced by cardiac motion were generated for each diffusion gradient direction, which resulted in a total of 60 multi-directional and multi-TD DW images and six reference images with a null diffusion gradient.
Fig. 2.
Flowchart of simulated DW data generation and postprocessing. Blocks with gray background represent simulated data and blocks with white background represent experimental data. “TD” represents trigger delay.
E. Post-Processing and Analysis
After the acquisitions using scheme 2 were obtained [Fig. 1(b)], a set of DTI images was formed using b0 images and DW images corresponding to the combination of the 12 gradient directions and 10 equi-spaced time points (10 ms shift acquisition over the end of diastole). Because these DTI images were acquired under free-breathing conditions, we registered them in order to compensate for motion and correctly calculate the subsequent diffusion tensor parameters. To this end, a nonrigid registration algorithm [29], [30] was applied, not only to the different TD DW images corresponding to a given diffusion direction but also to the DW images at all of the diffusion directions. For a given gradient direction, we then obtained a temporal sequence of registered images corresponding to different shifted TDs or time points. Our goal was to then find, for each given pixel, an optimal time point at which motion is minimal. To this end, we applied the PCATMIP technique [27], [28], [33] to the temporal sequence of DW images. The principle of this postprocessing is briefly described as follows. In the registered DW image sequence, if residual motion and random noise exist, the time-course SI values at a given pixel will fluctuate. To reduce residual motion and random noise, we first performed a block-wise spatiotemporal filtering based on the principal components analysis (PCA) of the DW images; PCA is applied to a 15 × 15 pixels boxcar sliding over each DW image. Then, at a given pixel, we searched for the time point yielding the highest SI value and assigned this value to the pixel being considered. Repeating this procedure for each pixel generated a final DW image that is a summarized version of the image sequence in which signal loss due to motion is minimal. Calculating the final image for each gradient direction generated 12 DW images, which allowed us to obtain a whole heart DTI dataset with the derived diffusion tensor parameters (FA, MD, elevation angle, azimuth angle, and 3-D tracts).
To illustrate how an optimal time point inside the optimal window can be found in a (registered) DW image sequence obtained using multiple shifted TD acquisitions, Fig. 3 presents two curves showing the variation of motion amplitude (measured from DENSE sequence) at a pixel in the lateral wall and the variation of this voxel SI as a function of time points for one volunteer, respectively. These curves clearly show that the optimal time point for this case occurred at 900 ms; at this time point, motion is at a minimum and SI is at a maximum, which implies that motion-reduced DW SI can be accessed using multiple shifted TD acquisitions. More details about the ability of the PCATMIP to find an optimal time point and reduce motion impact can be found in [28].
Fig. 3.
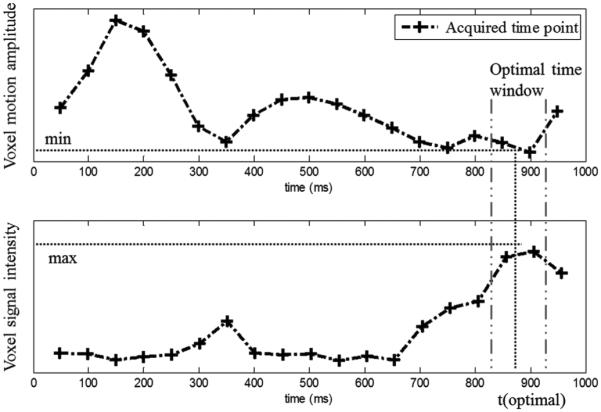
Variations of voxel motion amplitude and signal intensity as a function of time points for one pixel in the lateral wall. Signal loss is relatively low at a few phases of the cardiac cycle and reaches a minimum inside the optimal time-window, which occurred at the time point 900 ms for this case.
Simulated DTI data
Image postprocessing was performed using MATLAB (R2010b, Mathworks, Inc., Natick, MA, USA). The PCATMIP technique [28] was applied to the temporal sequence of DW images corresponding to the same diffusion gradient direction but different TDs. The SI was measured in the LV after manual segmentation of the myocardium in b = 0. The SI values of the entire myocardium resulting from PCATMIP processing were used to estimate the motion information according to the proposed cardiac motion model. We compared the motion information obtained from the PCATMIP-processed DW images with those originally included in the PLI simulated DW data.
For quantitative analysis, the trace diffusion-weighted image (T-DWI) was defined as the geometrical mean of the DW image intensity over all the directions (N = 6)
| (6) |
The SNR of the T-DWI images was then defined to assess the quality of the acquired DW images
| (7) |
where 〈I〉LV denotes the pixel intensity mean over the LV wall and “Noise” was measured as the standard deviation (SD) of pixel intensities over the LV wall.
However, SNR alone is not sufficient to completely assess the quality of the acquired DTI data. Indeed, DTI data are fundamentally different from commonly used scalar data (gray-level images) or vector-valued data; it is essentially diffusion tensor data, which implies that DTI data should be evaluated not only at the level of the DW image (although their quality is primarily the most important) but also at the level of diffusion tensor-derived parameters such as FA, MD, and fiber angles. These parameters constitute the main practical indexes to evaluate myocardial integrity. FA and MD are defined in terms of the eigenvalues λ1, λ2, and λ3 of the diffusion tensor. FA represents the degree of deviation of a diffusion ellipsoid from a sphere and was quantified as the SD of the eigenvalues of the diffusion tensor normalized by the “magnitude” of the three eigenvalues of the diffusion tensor. FA varies between 0 (perfectly isotropic diffusion) and 1 (the hypothetical case of an infinite cylinder)
| (8) |
where was quantified as the mean of the three eigenvalues of the diffusion tensor
| (9) |
To compare the data with the ground truth of the fiber architecture provided by PLI [31], we calculated two indexes: elevation angle and azimuth angle (presented in Fig. 4). The elevation angle corresponds to the angle between the fiber and the short-axis plane, while the azimuth angle represents the angle between the projection of the fiber in the short-axis plane and the +y axis.
Fig. 4.
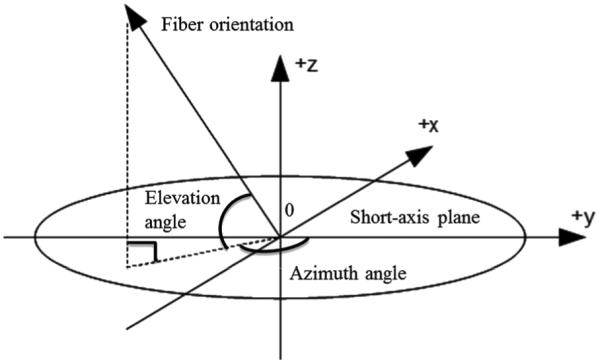
Definition of the elevation and azimuth angles of a fiber.
In vivo DTI data
The DW images acquired under free-breathing conditions were first registered [30] and then processed using the PCATMIP method as described previously in detail. These DW images were then used to calculate the tensor fields. To improve spatial resolution, the diffusion tensors were interpolated in the plane by a factor of 2 using the Log-Euclidean method, which avoids swelling effects [38].
Subsequently, FA, MD, elevation angle, and azimuth angle maps were calculated from the tensor fields, and they were compared to the results obtained from one single trigger delay (1TD). Elevation angle was calculated in the regions of the LV wall at five transmural locations (endocardium, mid-endocardium, mid-wall, mid-epicardium, and epicardium layers). The partition of the myocardium into these transmural layers was achieved by first manually segmenting the LV, calculating a distance from the endocardium to the epicardium, and finally dividing the distance into five segments equally. The pixels belonging to the same layer were automatically grouped into the same class on which the elevation angle was calculated. Finally, the 3-D fiber architecture of the human heart from multi-slice data was obtained using the conventional streamline algorithm [39].
III. Results
A. Simulation Results
Fig. 5 plots the relationship between cardiac motion and signal loss (normalized myocardial DW SI) for each of the six datasets corresponding to the six volunteers [Fig. 5(a)–(f)], and the cardiac motion model (Fig. 5(g), red curve), which was obtained by fitting SI values (blue points) as a function of cardiac motion. The experimental data were acquired and analyzed based on AHA ROI segmentation. Globally, more motion increases SI attenuation. Fig. 5(a)–(f) shows that the six datasets exhibit rather similar behavior. However, the experimental data do not exhibit a simple monotonous relationship between the SI values and the cardiac motion, as illustrated by the discrepancy between the blue points and red curve in Fig. 5(g). The fitting parameters of this model are RMSE = 0.026 and R–square = 0.9855, which were obtained from the regression estimation. This model provided a mean value to add signal loss in simulated DW images to imitate the in vivo DW image acquisition of the beating human heart.
Fig. 5.
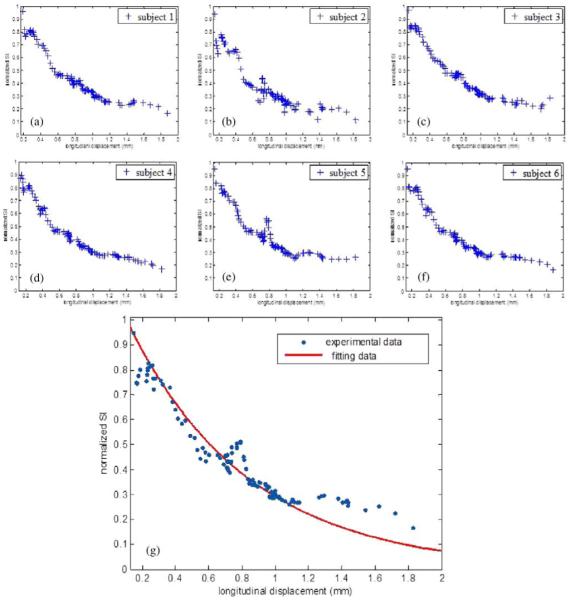
Normalized myocardial DW SI as a function of cardiac motion for the six volunteers corresponding to (a)–(f) and the cardiac motion model over the six volunteers (g). Blue points in (g) represent experimental data: for each blue point, the x value indicates the relative longitudinal displacement amplitude and the y value indicates the measured SI derived from all pixels averaged inside each of the six AHA ROIs. Red curve in (g) represents the fitted data.
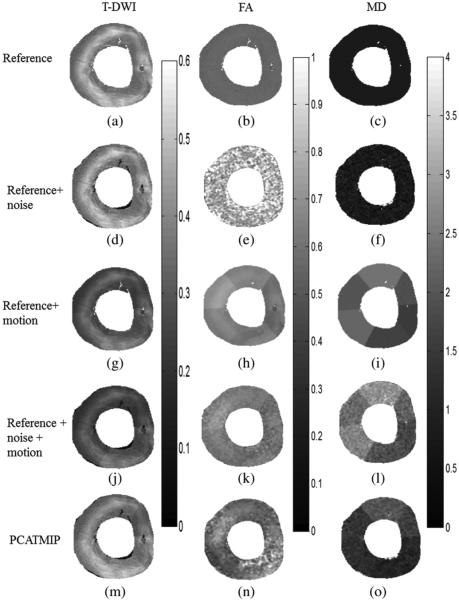
The impact of cardiac motion on T-DWI simulated by volunteer’s physiological motion and on fiber architecture properties is shown in Fig. 6. Signal dropout due to motion is visible in the LV. Table II provides quantitative analysis of the impact of cardiac motion on normalized SI, SNR, and fiber architecture properties corresponding to Fig. 6. The DW images corrected by the PCATMIP method offered an overall increased SI (this is consistent with the hypothesis that PCATMIP removes inherent signal loss due to motion) and therefore resulted in a subsequent higher SNR (5.3) compared to the Ref + noise (4.9) and the Ref + noise + motion (3.7). This illustrates that the PCATMIP can effectively recover signal loss due to cardiac motion. The signal loss due to noise resulted in increases in FA (0.82 ± 0.07) and MD (0.95 ± 0.87 × 10 −3 mm2/s) compared to those obtained from the original DW images (0.56 and 0.78 × 10⁻³ mm2/s for FA and MD, respectively). With the added motion, signal loss is more pronounced. After processing by the PCATMIP, we observed lower FA values with respect to the Ref + noise (−28%), but higher FA values with respect to the Ref (−5%). We also observed smaller MD values with respect to the Ref + noise + motion (−54%); however, the MD values are higher than those in the Ref+ noise and the Ref (+19% and +44%, respectively). The results showed that both FA and MD were overestimated with increased motion and that motion-induced signal loss could be minimized after using PCATMIP.
Fig. 6.
Impact of cardiac motion on T-DWI (left column) and fiber architecture properties (middle and right columns) using simulated data. (a)–(c) With reference noise-free data. (d)–(f) With reference + noise data. (g)–(i) With reference + motion data. (j)–(l) With reference + noise + motion data. (m)–(o) PCATMIP results.
TABLE II.
Quantitative Analysis of the Impacts of Cardiac Motion on Normalized SI, SNR, and Fiber Architecture Properties Using Simulated Data. MD Values are in Units of 10−3 mm2 /s
| SI | SNR | FA±SD | MD±SD | |
|---|---|---|---|---|
|
| ||||
| Ref | 0.399 | 6.8 | 0.56 | 0.78 |
| Ref + noise | 0.389 | 4.9 | 0.82 ± 0.07 | 0.95 ± 0.87 |
| Ref + motion | 0.295 | 3.9 | 0.61 ± 0.05 | 1.99 ± 0.30 |
| Ref + noise + motion |
0.263 | 3.7 | 0.62 ±0.10 | 2.45 ± 1.21 |
| PCATMIP | 0.369 | 5.3 | 0.59 ± 0.02 | 1.13 ± 0.49 |
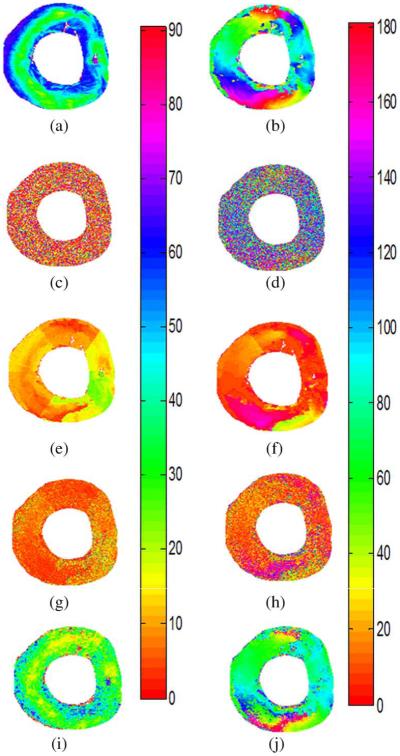
Fig. 7 shows the elevation and azimuth angle maps calculated from the primary eigenvectors of the diffusion tensor fields. Fig. 7(a) and (b) represents the original maps without adding noise and motion. In Fig. 7(a), the elevation angle varies from 57° ± 9° on the endocardium to 25° ± 10° on the mid-wall, and back to 51° ± 13° on the epicardium of the LV, which reflects fiber rotation. In Fig. 7(b), we can observe continuous circular variation of the azimuth angles inside the LV wall. The azimuth angle varies with the curvature of the LV and rotates with a smooth progression from one color to the other while turning around the LV. For example, there are red fibers at the junction between the LV and right ventricle of the heart with a 0° azimuth angle, and blue fibers in the inter-ventricular septum and lateral wall of the ventricles with a 90° azimuth angle. Variation in the azimuth angle reflects the spiral-shaped muscle structure of the heart. The regular variation pattern of elevation and azimuth angles is removed after adding the Rician noise and cardiac motion in Fig. 7(g) and (h). Signal loss due to motion and noise therefore greatly influence the angle maps. After using the PCATMIP method, regular azimuth angle [Fig. 7(j)] variation patterns were nearly completely recovered despite a relatively higher noise level. However, the elevation angle [Fig. 7(i)] range was narrower (41° ± 13° on the endocardium, 15° ± 11° on the midwall, and 35° ± 12° on the epicardium) than in the reference [Fig. 7(a)].
Fig. 7.
Elevation angle maps (left column) and azimuth angle maps (right column). (a) and (b) Original angle maps from simulated DW data. (c) and (d) Angle maps after adding noise. (e) and (f) Angle maps after adding cardiac motion. (g) and (h) Angle maps after adding noise and cardiac motion. (i) and (j) Corrected angle maps after using PCATMIP processing.
B. In vivo DTI Results
Fig. 8 shows an example of in vivo cardiac DW images of a volunteer. Fig. 8(a) presents DW images of 10 TD acquisitions of one diffusion gradient direction. The signal loss throughout the myocardium is visible because the cardiac motion was spatially and temporally heterogeneously distributed due to freebreathing during acquisition. Fig. 8(b) shows the processed DW image after applying the PCATMIP method to the 10 TD DW images. Fig. 8(c) shows the DW images recovered from the raw images using the PCATMIP method in 12 directions, which presents highly reduced motion artifacts and reduced intrascan signal loss.
Fig. 8.
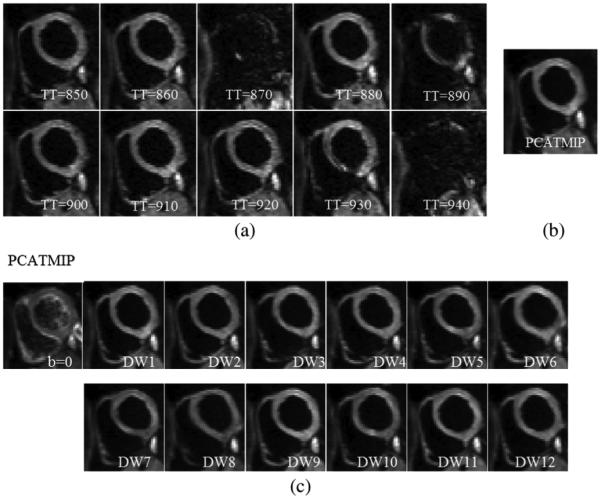
(a) Free-breathing short-axis DW images from 10 repetitions acquired at different time points for one direction during diastole on a volunteer. Visible spatial SI fluctuation resulting from spatially variable intrascan motion is visible. (b) Processed DW images for one direction using the PCATMIP method. (c) DW images corresponding to 12 diffusion gradient directions as well as images were reconstituted using the PCATMIP method.
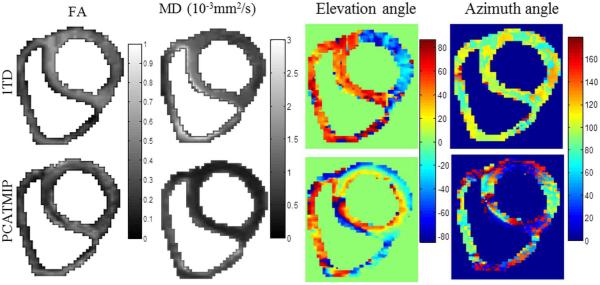
The FA, MD, elevation angle, and azimuth angle maps are illustrated in Fig. 9. The maps revealed that the mean FA value for 1TD (without PCATMIP) (0.60) is higher than that obtained using PCATMIP (0.42). The MD maps revealed significant differences between before and after processing with PCATMIP. PCATMIP yielded significantly lower MD than with 1TD (−73%). It also yielded smaller SD (0.28 × 10⁻³ mm2/s) than without PCATMIP (0.37 × 10⁻³ mm2/s). There were also significant differences between 1TD and PCATMIP in the angle maps. With 1TD, heterogeneous elevation and azimuth maps were yielded due to signal loss throughout the myocardium, while PCATMIP generated smooth angle maps. For PCATMIP, the elevation angle varied globally from −43° ± 16° on the epicardium to 10° ± 9° on the mid-wall and to 32° ± 19° on the endocardium, which reflects the fiber rotation of the LV.
Fig. 9.
FA, MD, elevation, and azimuth maps calculated from tensor fields for a short-axis slice in a healthy volunteer.
Table III summarizes the results obtained after applying PCATMIP to the in vivo cardiac DTI datasets of all of the volunteers. For each volunteer, with or without PCATMIP, the FA and MD variation share the same trend: PCATMIP yielded lower FA and MD values than 1TD. The mean FA value over all of the volunteers that was obtained using PCATMIP (0.43 ± 0.05) was smaller than that obtained using 1TD (0.56 ± 0.05). At the same time, the mean MD value over all of the volunteers with PCATMIP (0.75 ± 0.12 × 10⁻³ mm2/s) was smaller than that obtained using 1TD (1.37 ± 0.16 × 10⁻³ mm2/s).
TABLE III.
Mean ± SD FA and MD Values in the LV of All Volunteers. Results Demonstrated That the PCATMIP Correction Yielded Sysematically Lower Values and Much Lower Variation Than 1TD Acquisitions
| Subject | FA±SD | MD±SD(× 10−3mm2/s) | ||
|---|---|---|---|---|
| 1TD | PCATMIP | 1TD | PCATMIP | |
| 1 | 0.59±0.08 | 0.51±0.02 | 1.23± 0.19 | 0.77±0.09 |
| 2 | 0.56±0.02 | 0.48±0.02 | 1.52±0.08 | 0.88±0.04 |
| 3 | 0.60± 0.11 | 0.42±0.02 | 1.57±0.14 | 0.58±0.08 |
| 4 | 0.60±0.13 | 0.39±0.03 | 1.41± 0.16 | 0.74± 0.07 |
| 5 | 0.57±0.09 | 0.42± 0.02 | 1.25±0.08 | 0.88±0.10 |
| 6 | 0.46±0.04 | 0.39±0.01 | 1.23±0.08 | 0.64± 0.03 |
| Mean ± SD |
0.56±0.05 | 0.43±0.05 | 1.37±0.16 | 0.75±0.12 |
Fig. 10 shows the mean ± SD of the elevation angle values over all volunteers in the five cardiac layers with and without (1TD) PCATMIP. The elevation angle values for all of the volunteers vary from 32° ± 9° in the endocardium layer, through 24° ± 5° in the mid-endocardium layer and 13° ± 5°in the mid-wall, and −7° ± 7° in the mid-epicardium layer to −27° ± 7° in the epicardium layer.
Fig. 10.
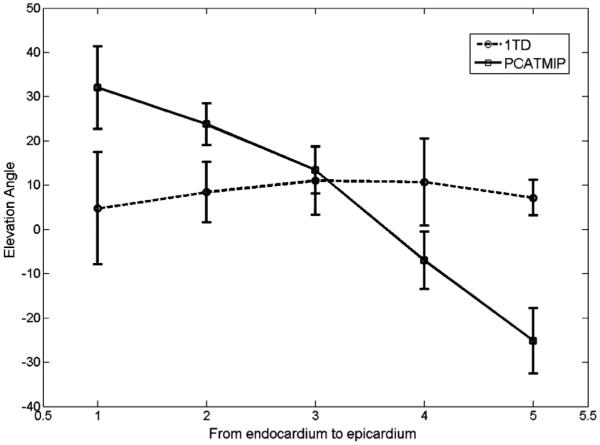
Elevation angle values obtained without (1TD, dotted line) and with the PCATMIP (solid line) method from the endocardium to epicardium of the LV. The x value (from 1 to 5) in the plot represents five different transmural locations (endocardium, mid-endocardium, mid-wall, mid-epicardium, and epicardium layers, respectively). Error bars represent the standard deviations in each dataset.
Fig. 11 shows the in vivo 3-D fiber tracts of a volunteer derived from 1TD and (the combined use of multiple shifted TDs and) PCATMIP. The helical structure of the LV is clearly visualized with the PCATMIP method. The negative to positive angles of the fibers when moving from the epicardium to endocardium are easily seen, as found in other previous healthy in vivo [11] and ex vivo [43] human heart studies. This highlights the potential of the PCATMIP method to minimize cardiac motion effects on in vivo cardiac DTI.
Fig. 11.
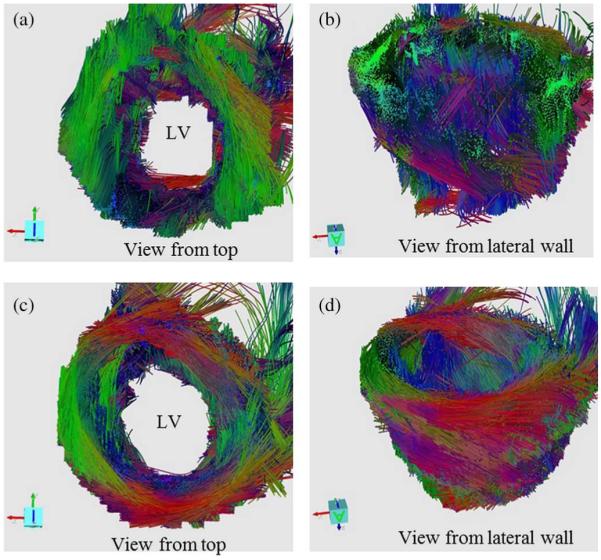
In vivo 3-D fiber tracts of a volunteer derived from 1TD [(a) and (b)] and PCATMIP [(c) and (d)]. The 3-D fiber architectures were constructed from 10 slice DW images. The red, green, and blue colors of the tracked fibers indicate the x, y, z components of the local orientation of the fiber, respectively.
IV. Discussion
As mentioned before, cardiac motion is three-dimensional, both in the longitudinal direction (through-plane motion) and within the imaging plane (in-plane motion). Our experiments confirmed much greater amplitudes of the longitudinal motion. The relative in-plane displacement amplitude ranged from 0.01 to 3.5 mm and the relative longitudinal displacement ranged from 0.01 to 10 mm at the pixel level of the DENSE data. As a consequence, we only considered cardiac longitudinal motion in the analysis of the impact of cardiac motion on diffusion signal loss in the present cardiac in vivo DTI study. This is in line with the work of Fischer et al. [35], which also stressed the importance of longitudinal motion; this has been considered the most challenging issue in phase sensitive MR imaging.
From the results shown in Fig. 5, the relationship between cardiac motion and DW SI is not strictly mono-exponential, which implies other possible approximations to motion modeling problems. Our model was obtained for a single-shot twice-refocused spin-echo EPI sequence with optimized bipolar diffusion encoding gradients; other diffusion encoding schemes will most likely lead to other signal loss dependency.
Using a PLI simulated DW dataset as reference for the ground truth and combining it with our diffusion model, we can provide simulations that illustrate the efficacy of the PCATMIP method to recover signal loss due to cardiac motion. We analyzed the displacement in only six sectors following AHA standardized segmentation rather than the myocardial motion at the pixel level. The difference in resolution between the PLI (100 × 100 × 500 μm3) and the DENSE (3.5 × 3.5 × 8 mm3) data did not allow us to obtain motion information for each pixel in the PLI data. Moreover, we did not compare the motion at different transmural zones from the endocardium to epicardium. With transmural segmentation, we may try to search for other models given experimental cardiac motion data and also find better fitting techniques for a given motion model. Additionally, we did not consider the effects of diffusion gradient direction sampling schemes. Because the same gradient directions were used in the simulation, this issue does not impact the comparison of motion effects.
Noise simulation revealed that the FA value is 0.82 ± 0.07 in the presence of noise, compared to the original value (0.56). The effects of noise on the FA estimation have been reported in the literature, which shows that, in anisotropic systems, the largest eigenvalue is overestimated and the lowest eigenvalue is underestimated in general [40]. The mean FA of the Ref + noise + motion was 0.62 without PCATMIP, compared to the original value of 0.56. The mean MD of the Ref + noise + motion was 2.12 × 10⁻³ mm2/s compared to the original value of 0.78 × 10⁻³ mm2/s mm . Our results therefore showed that while cardiac motion was associated with an overestimation of both FA and MD, the effect was greater for MD. For the in vivo experiments, the mean FA value for 1TD (without PCATMIP) over the six volunteers (0.56) was higher than when using PCATMIP (0.43); this was due to the higher noise level and motion-induced signal loss. The MD values showed differences between before and after measures using PCATMIP. With 1TD, signal loss resulted in an overestimation of MD (1.37±0.16 × 10⁻³ mm2/s). PCATMIP yielded a significantly lower MD (0.75 ± 0.12 × 10⁻³ mm2/s) than that obtained using 1TD. The in vivo results showed that motion-induced signal loss could be minimized by using the PCATMIP method, which is consistent with the simulation results. This is in line with previous reports of human brain studies that also demonstrated that noise and motion cause a bias for FA and MD and that motion correction strategies help to improve the accuracy of DTI indexes [41], [42].
The shifted acquisition scheme combined with the PCATMIP postprocessing allowed us to select, after motion correction and for each pixel, the optimal time point during the cardiac cycle with minimal signal loss due to cardiac motion. The PCATMIP postprocessing over multi-TD SIs clearly maximized the diffusion information in the images while reducing the influence of motion. Note that in some patients with spatial heterogeneity of motion (dyskinesia, akinesia), it might be difficult to find a unique TD that could cancel the effects of motion in the entire myocardium. It is therefore retrospectively not always possible to determine a best TD at which the DTI data would be acquired with minimal motion impact. Nevertheless, the chosen reference TD for 1TD was the one that exhibited the highest homogeneity and SI in the myocardium.
The first important result was that PCATMIP operation over multi-TD DW images clearly and always improved image quality (increased SNR resulting from compensated signal loss compared to that obtained with 1TD) while preserving the fiber architecture of the human heart.
The range of elevation angles used in the simulation was restricted to 90° in order to compare to the data reported in the prior PLI study [31]. After processing by PCATMIP, the range of elevation angles [Fig. 7(i)] in the simulation study was narrower (41° ± 13° on the endocardium and 35° ± 12° on the epicardium) than the reference (Fig. 7(a), 57° ± 9° on the endocardium and 51° ± 13° on the epicardium). This implies that PCATMIP could not completely eliminate the impact of motion and noise on the fiber architecture, but it could still reduce the effect of physiological motion. Motion resulted in a reduced range of fiber angles. The elevation angle range obtained in the in vivo DTI study was narrower (approximately from 41 on the endocardium to −34° on the epicardium) than in previously reported ex vivo human cardiac studies [43], [44]. We must account for many factors that may influence the elevation angle range, i.e., in vivo or ex vivo data, data acquired at different cardiac phases, spatial resolution, motion artifacts and segmentation method. The study reported by Lombaert et al. [43] on healthy ex vivo human hearts showed that the helix angle varied from 66° ± 15° on the endocardium to −41° ± 26° on the epicardium. The histological study of postmortem human hearts by Greenbaum et al. showed a distribution of helix angles from approximately 40 on the endocardium to approximately −40° on the epicardium [44]. The narrower elevation angle range may be caused by signal loss in the DW images due to residual noise or residual motion. Another possible cause of narrower angle ranges may be related to the fact that the angles were obtained by averaging the coarser in-plane resolution voxels inside the transmural layers. Because coarser resolution neighboring voxels have greater angle difference, the obtained angle has, after averaging, a smaller value in total.
V. Conclusion
We have proposed a multimodal approach to assess the effects of cardiac motion on in vivo diffusion tensor parameters of the human heart. With the aid of the ground truth provided by the combined use of PLI data, simulated DW images and motion information derived from DENSE imaging, the proposed cardiac motion model has been shown to elegantly allow us to investigate the relationship between cardiac motion and in vivo diffusion tensor parameters of the human heart. Additionally, this method enabled us to quantify the impact of motion on diffusion tensor parameters. Cardiac motion resulted in large signal loss in DW images, an overestimation of both FA and MD, and a reduced range of fiber angles between the endocardium and epicardium. We also showed that 3-D fiber architecture can be retrieved from in vivo DTI data acquired under free-breathing conditions using the shifted TD acquisition scheme combined with adequate postprocessing based on image registration and PCATMIP. The FA was 0.43 ± 0.05 and MD was 0.75±0.12 × 10⁻³ mm2/s among all volunteers. From the angle maps, the myocardial fiber orientation of the LV wall showed a circularly symmetric pattern, ranging from 41° on the endocardium to −34° on the epicardium. The 3-D fiber architecture also reproduced the typical helical organization of myocardial fibers. The results showed that the combined use of shifted TD acquisitions and adequate postprocessing based on registration and PCATMIP effectively improves the quality of in vivo DW images as well as the subsequent measurement accuracy of fiber architecture properties. This suggests new directions toward obtaining in vivo human myocardial fiber architecture in clinical conditions.
Acknowledgment
The authors would like to thank T. Feweier from Siemens AG, Healthcare Sector, Erlangen, Germany, for the advanced diffusion prototype sequence delivery. They are also grateful to Prof. P.-S. Jouk, Dr. Y. Usson, and G. Michalowicz from The TIMC-IMAG laboratory and the Service de Medecine Néonatale, Centre Hospitalier Universitaire de Grenoble, Université Joseph Fourier, Grenoble, France for their assistance with the PLI experiments.
This work was supported by the French ANR 2009 (under ANR-09-BLAN-0372-01).
Footnotes
Color versions of one or more of the figures in this paper are available online at http://ieeexplore.ieee.org.
Contributor Information
Hongjiang Wei, CREATIS, CNRS UMR 5220, INSERM U1044; INSA Lyon; University of Lyon, 69100 Villeurbanne, France.
Magalie Viallon, CREATIS, CNRS UMR 5220, INSERM U1044; INSA Lyon; University of Lyon, 69100 Villeurbanne, France.
Benedicte M. A. Delattre, CREATIS, CNRS UMR 5220, INSERM U1044; INSA Lyon; University of Lyon, 69100 Villeurbanne, France
Lihui Wang, CREATIS, CNRS UMR 5220, INSERM U1044; INSA Lyon; University of Lyon, 69100 Villeurbanne, France.
Vinay M. Pai, Division of Applied Science and Technology, National Institute of Biomedical Imaging and Bioengineering/National Institutes of Health (NIBIB/NIH), Bethesda, MD 20892 USA
Han Wen, Physics Lab, The National Heart, Lung, and Blood Institute/National Institutes of Health (NHLBI/NIH), Bethesda, MD 20892 USA.
Hui Xue, Siemens Corporation, Corporate Technology, Princeton, NJ 08540 USA.
Christoph Guetter, Siemens Corporation, Corporate Technology, Princeton, NJ 08540 USA.
Pierre Croisille, CREATIS, CNRS UMR 5220, INSERM U1044; INSA Lyon; University of Lyon, 69100 Villeurbanne, France.
Yuemin Zhu, CREATIS, CNRS UMR 5220, INSERM U1044; INSA Lyon; University of Lyon, 69100 Villeurbanne, France.
References
- [1].Le Bihan D, Mangin JF, Poupon C, Clark CA, Pappata S, Molko N, Chabriat H. Diffusion tensor imaging: Concepts and applications. J. Magn. Reson. Imag. 2001;13(4):534–546. doi: 10.1002/jmri.1076. [DOI] [PubMed] [Google Scholar]
- [2].Kingsley PB. Introduction to diffusion tensor imaging mathematics: Part I. Tensors, rotations, and eigenvectors. Concepts Magn. Reson. Part A. 2006;28:101–122. [Google Scholar]
- [3].Kingsley PB. Introduction to diffusion tensor imaging mathematics: Part II. Anisotropy, diffusion-weighting factors, and gradient encoding schemes. Concepts Magn. Reson. Part A. 2006;28:123–154. [Google Scholar]
- [4].Kingsley PB. Introduction to diffusion tensor imaging mathematics: Part III. Tensor calculation, noise, simulations, and optimization. Concepts Magn. Reson. Part A. 2006;28:155–179. [Google Scholar]
- [5].Edelman RR, Gaa J, Wedeen VJ, Loh E, Hare JM, Prasad P, Li W. In vivo measurement of water diffusion in the human heart. Magn. Reson. Med. 1994;22(3):423–428. doi: 10.1002/mrm.1910320320. [DOI] [PubMed] [Google Scholar]
- [6].Tseng WY, Reese TG, Weisskoff RM, Brady TJ, Wedeen VJ. Myocardial fiber shortening in humans: Initial results of MR imaging. Radiology. 2006;216(1):128–139. doi: 10.1148/radiology.216.1.r00jn39128. [DOI] [PubMed] [Google Scholar]
- [7].Dou J, Reese TG, Tseng WY, Wedeen VJ. Cardiac diffusion MRI without motion effects. Magn. Reson. Med. 2002;281:105–114. doi: 10.1002/mrm.10188. [DOI] [PubMed] [Google Scholar]
- [8].Gamper U, Boesiger P, Kozerke S. Diffusion imaging of the in vivo heart using spin echoes—Considerations on bulk motion sensitivity. Magn. Reson. Med. 2007;57(4):331–337. doi: 10.1002/mrm.21127. [DOI] [PubMed] [Google Scholar]
- [9].Yang F, Zhu YM, Magnin IE, Luo JH, Croisille P, Kingsley PB. Feature-based interpolation of diffusion tensor fields and application to human cardiac DT-MRI. Med. Image Anal. 2011;16(2):459–481. doi: 10.1016/j.media.2011.11.003. [DOI] [PubMed] [Google Scholar]
- [10].Frindel C, Robini M, Croisille P, Zhu YM. Comparison of regularization methods for human cardiac diffusion tensor MRI. Med. Image Anal. 2009;13(3):405–418. doi: 10.1016/j.media.2009.01.002. [DOI] [PubMed] [Google Scholar]
- [11].Nielles-Vallespin S, Mekkaoui C, Gatehouse P, Reese TG, Keegan J, Ferreira PF, Collins S, Speier P, Feiweier T, de Silva R, Jackowski MP, Pennell DJ, Sosnovik DE, Firmin D. In vivo diffusion tensor MRI of the human heart: Reproducibility of breath-hold and navigator-based approaches. Magn. Reson. Med. 2013;70(2):454–465. doi: 10.1002/mrm.24488. [DOI] [PMC free article] [PubMed] [Google Scholar]
- [12].Wu MT, Tseng WY, Su MY, Liu CP, Chiou KR, Wedeen VJ, Reese TG, Yang CF. Diffusion tensor magnetic resonance imaging mapping the fiber architecture remodeling in human myocardium after infarction. Circulation. 2006;114(10):1036–1045. doi: 10.1161/CIRCULATIONAHA.105.545863. [DOI] [PubMed] [Google Scholar]
- [13].Wu MT, Su MY, Huang YL, Chiou KR, Yang P, Pan HB, Reese TG, Wedeen VJ, Tseng WY. Sequential changes of myocardial microstructure in patients postmyocardial infarction by diffusion-tensor cardiac MR: Correlation with left ventricular structure and function. Circ. Cardiovasc. Imag. 2009;2(1):32–40. doi: 10.1161/CIRCIMAGING.108.778902. [DOI] [PubMed] [Google Scholar]
- [14].Basser P, Pierpaoli C. Microstructural and physiological features of tissues elucidated by quantitative-diffusion-tensor MRI. J. Magn. Reson. Imag. 1996;111(3):209–219. doi: 10.1006/jmrb.1996.0086. [DOI] [PubMed] [Google Scholar]
- [15].Tseng WY, Wedeen VJ, Reese TG, Smith RN, Halpern EF. Diffusion tensor MRI of myocardial fibers and sheets: Correspondence with visible cut-face texture. J. Magn. Reson. Imag. 2003;17(1):31–42. doi: 10.1002/jmri.10223. [DOI] [PubMed] [Google Scholar]
- [16].Helm P, Beg MF, Miller MI, Winslow RL. Measuring and mapping cardiac fiber and laminar architecture using diffusion tensor MR imaging. Ann. NY Acad. Sci. 2005;1047:296–307. doi: 10.1196/annals.1341.026. [DOI] [PubMed] [Google Scholar]
- [17].Wu EX, Wu Y, Tang H, Wang J, Yang J, Ng MC, Yang ES, Chan CW, Zhu S, Lau CP, Tse HF. Study of myocardial fiber pathway using magnetic resonance diffusion tensor imaging. Magn. Reson. Med. 2007;25(7):1048–1057. doi: 10.1016/j.mri.2006.12.008. [DOI] [PubMed] [Google Scholar]
- [18].Wu Y, Wu EX. MR study of postnatal development of myocardial structure and left ventricular function. J. Magn. Reson. Imag. 2009;30(1):47–53. doi: 10.1002/jmri.21814. [DOI] [PubMed] [Google Scholar]
- [19].Reese TG, Wedeen VJ, Weisskoff RM. Measuring diffusion in the presence of material strain. J. Magn. Reson. B. 1996;112(3):253–258. doi: 10.1006/jmrb.1996.0139. [DOI] [PubMed] [Google Scholar]
- [20].Tseng WY, Reese TG, Weisskoff RM, Wedeen VJ. Cardiac diffusion tensor MRI in vivo without strain correction. Magn. Reson. Med. 1999;42(2):393–403. doi: 10.1002/(sici)1522-2594(199908)42:2<393::aid-mrm22>3.0.co;2-f. [DOI] [PubMed] [Google Scholar]
- [21].Tseng WY, Reese TG, Weisskoff RM, Brady TJ, Wedeen VJ. Myocardial fiber shortening in humans: Initial results of MR imaging. Radiology. 2000;216(1):128–139. doi: 10.1148/radiology.216.1.r00jn39128. [DOI] [PubMed] [Google Scholar]
- [22].Landman BA, Farrell JA, Huang H, Prince JL, Mori S. Diffusion tensor imaging at low SNR: Nonmonotonic behaviors of tensor contrasts. Magn. Reson. Imag. 2008;26(6):790–800. doi: 10.1016/j.mri.2008.01.034. [DOI] [PMC free article] [PubMed] [Google Scholar]
- [23].Peeters T, Vilanova A, Haar Romeny B. Interactive fibre structure visualization of the heart. Comput. Graph. Forum. 2009;28(8):2140–2150. [Google Scholar]
- [24].Wang L, Zhu Y, Li H, Liu W, Magnin IE. Multiscale modeling and simulation of the cardiac fiber architecture for DMRI. IEEE Trans. Biomed. Eng. 2012 Jan.59(1):16–19. doi: 10.1109/TBME.2011.2166265. [DOI] [PubMed] [Google Scholar]
- [25].Wang L, Camarasu-Pop S, Glatard T, Zhu Y, Magnin IE. Diffusion MRI simulation with the virtual imaging platform. Journées scientifiques mésocentres et France Grilles, Paris. 2012:1. [Google Scholar]
- [26].Aletras AH, Ding S, Balaban RS, Wen H. DENSE: Displacement encoding with stimulated echoes in cardiac functional MRI. J. Magn. Reson. 1999;137(1):247–252. doi: 10.1006/jmre.1998.1676. [DOI] [PMC free article] [PubMed] [Google Scholar]
- [27].Pai VM, Rapacchi S, Kellman P, Croisille P, Wen H. PCATMIP: Enhancing signal intensity in diffusion-weighted magnetic resonance imaging. Magn. Reson. Med. 2011;65(6):1611–1619. doi: 10.1002/mrm.22748. [DOI] [PMC free article] [PubMed] [Google Scholar]
- [28].Rapacchi S, Wen H, Viallon M, Grenier D, Kellman P, Croisille P, Pai VM. Low B-value diffusion-weighted cardiac magnetic resonance imaging: Initial results in humans using an optimal time-window imaging approach. Invest. Radiol. 2011;46(12):751–758. doi: 10.1097/RLI.0b013e31822438e8. [DOI] [PMC free article] [PubMed] [Google Scholar]
- [29].Chefd’hotel C, Hermosillo G, Faugeras O. Flows of diffeomorphisms for multimodal image registration. Proc. IEEE Int. Symp. Biomed. Imag..2002. pp. 753–756. [Google Scholar]
- [30].Guetter C, Xue H, Chefd’hotel C, Guehring J. Efficient symmetric and inverse-consistent deformable registration through interleaved optimization. Proc. IEEE Int. Symp. Biomed. Imag..2011. pp. 590–593. [Google Scholar]
- [31].Jouk PS, Mourad A, Milisic V, Michalowicz G, Raoult A, Caillerie D, Usson Y. Analysis of the fiber architecture of the heart by quantitative polarized light microscopy. Accuracy, limitations and contribution to the study of the fiber architecture of the ventricles during fetal and neonatal life. Eur. J Cardiothoracic Surg. 2007;31(5):915–921. doi: 10.1016/j.ejcts.2006.12.040. [DOI] [PubMed] [Google Scholar]
- [32].Feiweier T. Bipolar diffusion encoding with implicit spoiling of undesired coherence pathways. Proc. Int. Soc. Magn. Reson. Med. 2010;10:1–1. [Google Scholar]
- [33].Delattre BM, Viallon M, Wei HJ, Zhu YM, Feiweier T, Pai VM, Wen H, Croisille P. In vivo cardiac diffusion-weighted magnetic resonance imaging: Quantification of normal perfusion and diffusion coefficients with intravoxel incoherent motion imaging. Invest. Radiol. 2012;47(11):662–670. doi: 10.1097/RLI.0b013e31826ef901. [DOI] [PMC free article] [PubMed] [Google Scholar]
- [34].Park HW, Kim DJ, Cho ZH. Gradient reversal technique and its application to chemical-shift-related NMR imaging. Magn. Reson. Med. 1987;4(6):526–536. doi: 10.1002/mrm.1910040604. [DOI] [PubMed] [Google Scholar]
- [35].Fischer SE, Stuber M, Scheidegger MB, Boesiger P. Limitations of stimulated echo acquisition mode (STEAM) techniques in cardiac applications. Magn. Reson. Med. 1995;34(1):80–91. doi: 10.1002/mrm.1910340113. [DOI] [PubMed] [Google Scholar]
- [36].Cerqueira MD, Weissman NJ, Dilsizian V, Jacobs AK, Kaul S, Laskey WK, Pennell DJ, Rumberger JA, Ryan T, Verani MS. Standardized myocardial segmentation and nomenclature for tomographic imaging of the heart. Circulation. 2002;105(4):539–542. doi: 10.1161/hc0402.102975. [DOI] [PubMed] [Google Scholar]
- [37].Skare S, Li T, Nordell B, Ingvar M. Noise considerations in the determination of diffusion tensor anisotropy. Magn. Reson. Imag. 2000;18(6):659–669. doi: 10.1016/s0730-725x(00)00153-3. [DOI] [PubMed] [Google Scholar]
- [38].Arsigny V, Fillard P, Pennec X, Ayache N. Log-euclidean metrics for fast and simple calculus on diffusion tensors. Magn. Reson. Med. 2006;56(2):411–421. doi: 10.1002/mrm.20965. [DOI] [PubMed] [Google Scholar]
- [39].Zhukov L, Barr AH. Heart-muscle fiber reconstruction from diffusion tensor MRI. Proc. 14th IEEE Visualizat. 2003 Oct.:597. [Google Scholar]
- [40].Pierpaoli C, Basser PJ. Toward a quantitative assessment of diffusion anisotropy. Magn. Reson. Med. 1996;36(6):893–906. doi: 10.1002/mrm.1910360612. [DOI] [PubMed] [Google Scholar]
- [41].Ling J, Merideth F, Caprihan A, Pena A, Teshiba T, Mayer AR. Head injury or head motion? Assessment and quantification of motion artifacts in diffusion tensor imaging studies. Hum. Brain Mapp. 2012;33(1):50–62. doi: 10.1002/hbm.21192. [DOI] [PMC free article] [PubMed] [Google Scholar]
- [42].Tijssen RH, Jansen JF, Backes WH. Assessing and minimizing the effects of noise and motion in clinical DTI at 3T. Hum. Brain Mapp. 2009;30(8):2641–2655. doi: 10.1002/hbm.20695. [DOI] [PMC free article] [PubMed] [Google Scholar]
- [43].Lombaert H, Peyrat J, Croisille P, Rapacchi S, Fanton L, Cheriet F, Clarysse P, Delingette H, Ayache N. Human atlas of the cardiac fiber architecture: Study on a healthy population. IEEE Trans. Med. Imag. 2012 Jul.31(7):1436–1447. doi: 10.1109/TMI.2012.2192743. [DOI] [PubMed] [Google Scholar]
- [44].Greenbaum RA, Ho SY, Gibson DG, Becker AE, Anderson RH. Left ventricular fibre architecture in man. Br. Heart J. 1981;45(3):248–263. doi: 10.1136/hrt.45.3.248. [DOI] [PMC free article] [PubMed] [Google Scholar]


