Abstract
Carcinoembryonic antigen-related cell adhesion molecule 2 (CEACAM2) regulates food intake as demonstrated by hyperphagia in mice with the Ceacam2 null mutation (Cc2−/−). This study investigated whether CEACAM2 also regulates insulin secretion. Ceacam2 deletion caused an increase in β-cell secretory function, as assessed by hyperglycemic clamp analysis, without affecting insulin response. Although CEACAM2 is expressed in pancreatic islets predominantly in non-β-cells, basal plasma levels of insulin, glucagon and somatostatin, islet areas, and glucose-induced insulin secretion in pooled Cc2−/− islets were all normal. Consistent with immunofluorescence analysis showing CEACAM2 expression in distal intestinal villi, Cc2−/− mice exhibited a higher release of oral glucose-mediated GLP-1, an incretin that potentiates insulin secretion in response to glucose. Compared with wild type, Cc2−/− mice also showed a higher insulin excursion during the oral glucose tolerance test. Pretreating with exendin(9–39), a GLP-1 receptor antagonist, suppressed the effect of Ceacam2 deletion on glucose-induced insulin secretion. Moreover, GLP-1 release into the medium of GLUTag enteroendocrine cells was increased with siRNA-mediated Ceacam2 down-regulation in parallel to an increase in Ca2+ entry through L-type voltage-dependent Ca2+ channels. Thus, CEACAM2 regulates insulin secretion, at least in part, by a GLP-1-mediated mechanism, independent of confounding metabolic factors.
Keywords: diabetes, gene knock-out, insulin resistance, insulin secretion, intestine, CEACAM2, GLP-1, enteroendocrine cells, insulin clearance
Introduction
CEACAM2 (carcinoembryonic antigen-related cell adhesion molecule 2) is a transmembrane glycoprotein that is expressed in kidney, spleen, testis, platelets, crypt epithelial cells of the small intestine, and in some brain nuclei, including the ventromedial hypothalamus (1–5). Consistently, CEACAM2 is implicated in the central regulation of energy balance (including regulation of food intake, energy expenditure, and brown adipogenesis) (1, 6), platelet activation/adhesion and thrombus stability (3), and spermatid maturation (2).
CEACAM2 is highly homologous to CEACAM1, the protein product of a distinct gene. Both genes contain nine exons, the seventh of which undergoes alternative splicing to yield different transcripts that are distinguished by a long (-L) or a short (-S) intracellular tail, containing or devoid of conserved phosphorylation sites (5, 7). In particular, in the case of CEACAM2, exons 3 and 4 commonly undergo alternative splicing to yield a shorter extracellular domain containing two instead of four immunoglobulin-like loops. Hence, CEACAM2 is mostly expressed as CEACAM2–2L/2S.
Although CEACAM2 shares some functions with CEACAM1, such as platelet activation/adhesion (3), it does not appear to directly act as a cell adhesion molecule (5). Moreover, the absence of its transcripts in hepatocytes has not warranted the investigation of its role in hepatic insulin clearance, as was the case for CEACAM1 (8–10).
Mice with Ceacam2 null deletion (Cc2−/−) exhibited hyperphagia (1, 6). Because of increased energy expenditure, hyperphagia did not translate into insulin resistance in males (6), as it did to females (1). This study investigated whether CEACAM2 regulates insulin secretion. We report here that CEACAM2 plays a role in insulin secretion via a mechanism implicating the release of the insulinotropic glucagon-like peptide-1 (GLP-1), an incretin that potentiates glucose-stimulated insulin secretion from pancreatic β-cells (11–17).
Experimental Procedures
Mouse Generation
The generation of Cc2−/− mice was described previously (1, 6). Unless otherwise mentioned, male mice (5–7 months of age) were used. All animals were housed in a 12-h dark-light cycle and fed standard chow (Harlan Teklad 2016; Harlan, Haslett, MI) ad libitum at the Division of Laboratory Animal Resources at the University of Toledo College of Medicine. All procedures and animal experiments were approved by the Institutional Animal Care and Utilization Committee.
Plasma Biochemistry
Mice were anesthetized with sodium pentobarbital at 11:00 a.m. following an overnight fast. Whole venous blood was drawn from the retro-orbital sinuses to measure, by radioimmunoassay (RIA), the plasma levels of insulin, C-peptide (Linco Research, Billerica, MA), somatostatin (Phoenix Pharmaceuticals, Belmont, CA), and total GLP-1 (catalog no. GLP1T-36HK, Millipore, Billerica, MA). RIA (Linco) was used to measure basal plasma glucagon levels in mice fasted for 4 h (from 07:00 to 11:00).
Glucose Tolerance Test
Male mice (n >5/genotype, 5 months old) were fasted overnight from 17:00 to 08:00 the following day before being anesthetized and administered glucose via oral gavage (3.0 g/kg BWT). Blood was drawn from the retro-orbital sinus to measure blood glucose and plasma insulin levels at 0–120 min post-glucose administration. In parallel experiments, anesthetized mice were injected intraperitoneally with 5 μg of the GLP-1 receptor antagonist, exendin (9–39) (American Peptide Co. Inc., Sunnyvale, CA), 20 min before glucose administration.
Hyperglycemic Clamp Analysis in Awake Mice
To assess β-cell function in vivo, a 2-h hyperglycemic clamp was performed as described previously (18). Male mice (n = 7/genotype, 7 months of age) were anesthetized with an intraperitoneal injection of ketamine (100 mg/kg BWT) and xylazine (10 mg/kg BWT), and an indwelling catheter was inserted into the right internal jugular vein. Four-to-five days later, mice were fasted overnight before being subjected to hyperglycemic clamp analysis with a continuous infusion of 20% glucose to raise and maintain plasma glucose levels at ∼300 mg/dl for 2 h. Blood samples (40 μl) were collected at 15–20-min intervals over a period of 120 min to measure plasma glucose and insulin concentrations.
Hyperinsulinemia-Euglycemic Clamp Analysis
A 2-h hyperinsulinemic-euglycemic clamp was performed in overnight-fasted awake mice (n = 11/genotype, 7–8 months old) with primed and continuous infusion of human regular insulin (Humulin; Lilly) at a rate of 2.5 milliunits·kg−1·min−1, as described (6). Glucose metabolism was estimated with a continuous infusion of [3-3H]glucose (PerkinElmer Life Sciences) for 2 h prior to (1850 Bq/min) and throughout the clamps (3700 Bq/min).
Plasma GLP-1 Measurement in Response to Oral Glucose
Mice (n ≥6/genotype) were fasted overnight, subjected to an oral glucose administration (3 g/kg BWT), and anesthetized with pentobarbital immediately after glucose administration before their retro-orbital blood was drawn 30 min later to measure blood glucose and plasma insulin levels. For GLP-1 measurement, plasma from each genotype was pooled to determine GLP-1 levels in triplicate in 300-μl aliquots, as above.
Immunohistochemical Analysis
Six-month-old male mice were anesthetized with pentobarbital, and their pancreases carefully dissected, cleared of fat and spleen, weighed, and fixed overnight in 4% paraformaldehyde. Tissues were embedded in paraffin and consecutive 7-μm sections were mounted on slides. Sections were then stained with antibodies against insulin (Dako, Carpinteria, CA), glucagon (Sigma), somatostatin (Chemicon, Temecula, CA), pancreatic polypeptide (PP) (Linco), or a mixture of glucagon, somatostatin, and polypeptide (3Ab) and visualized utilizing 3,3′-diaminobenzidine tetrahydrochloride reaction, as described (19).
Immunofluorescence Staining
As described previously (9), small intestinal tissues were fixed overnight in Bouin's solution, embedded in paraffin, and cut into 4-μm consecutive sections. Following deparaffinization, sections were exposed to antigen retrieval by carefully boiling in a microwave oven in 10 mm citrate buffer, pH 6.0. Sections were then incubated at 4 °C overnight with α-CEACAM2 custom-made anti-peptide polyclonal antibody raised in rabbit against the keyhole limpet hemocyanin-conjugated HPLC-purified peptide CNAEIVRFVTGTNKTIKGPVH in CEACAM2 (Bethyl Laboratories, Montgomery, TX) (final dilution 1:50) (6). Subsequently, sections were incubated with a goat α-rabbit Cy5 (final dilution 1:400, Dianova 111-175-144) for 1 h to visualize with epifluorescence (Keyence BZ9000) equipped with a Plan Apo objective (Nikon). DAPI (1:9000) was used to visualize nuclei.
Fluorescence-activated Cell Sorter Purification of Isolated Islets
Islets were isolated by the intraductal collagenase digestion method (20). After PBS wash, the suspension was passed through a 35-μm filter before fluorescence-activated cell sorter (FACS) analysis, based on autofluorescence and size (21). Cells were sorted directly into TRIzol reagent, and the purity of the sorted fractions was determined by real time PCR for insulin and glucagon in each fraction.
Insulin Secretion from Isolated Islets
Purification of islets was conducted on pancreases of 4-month-old mice by collagenase digestion (22). Islets were then resuspended in RPMI 1640 medium containing 10% newborn calf serum and 5.5 mm glucose and cultured overnight at 37 °C. Islets were stimulated with glucose (2.8–16.8 mm) or 20 mm KCl for 1 h at 37 °C, followed by centrifugation to assay insulin content by radioimmunoassay in the supernatant. Islets were dissolved in high salt buffer and sonicated three times at 80 watts for 10 s to measure DNA concentration for normalization.
GLP-1 Release from Enteroendocrine Intestinal Cells
GLUTag cells (generated by the D. Drucker laboratory at University of Toronto, Ontario, Canada) were maintained in 6-well plates in low glucose (5.6 mmol/liter) DMEM containing 10% fetal bovine serum and 1% penicillin and streptomycin at 37 °C in a 5% CO2 incubator. Using Lipofectamine 2000 reagent (Invitrogen), cells were transfected with 100 pmol of scrambled oligos or with a combination of 33.3 pmol each of Ceacam2-specific siRNA oligos (oligo 1, 92ccaccactgcacaagtgactgttat116 (exon2); oligo 2, 238tgtacgatttgtaacagg255 (exon2); oligo 3, 1324gggctggcatatcgcctctgtt1345 (exon6)), based on the lowest shared homology between Ceacam1 and Ceacam2 in exons 2 and 6 (4). Transfected cells were plated on Matrigel-coated 6-well culture plates. 2–3 days post-transfection, GLP-1 secretion was assessed as described previously (23). Briefly, cells were washed and incubated in saline solution containing in millimolar (128 NaCl, 5.6 KCl, 4.2 NaHCO3, 1.2 NaH2PO4, 2.6 CaCl2, 1.2 MgCl2, 10 HEPES, pH 7.4) and 1.6 mmol/liter glucose for 2 h at 37 °C. Some cells were treated with 11 mm glucose for an additional 2 h before the medium was removed and stored at −80 °C, and cells were lysed in 900 μl of RIPA buffer containing 50 mm Tris-HCl, 150 mm NaCl, 1%Triton, 0.5% deoxycholic acid, and complete EDTA-free protease inhibitor mixture (Roche Applied Science). GLP-1 was measured in triplicate in 300 μl of medium and of cell lysates using the Millipore RIA kit, as above. Secreted GLP-1 was calculated as percent of GLP-1 in media relative to the sum of GLP-1 content in medium plus cell lysates (24).
Live Cell Fluorescence and Intracellular Ca2+ Measurements
GLUTag cells were plated on Matrigel-coated coverslips (Corning Glass) 1 day prior to undergoing transfection with scrambled or Ceacam2-specific siRNA oligos, as above. Two to 3 days later, cells were loaded with 2 μm Fura-2 AM in physiological saline solution (147 mm NaCl, 5 mm KCl, 2.2 mm CaCl2, 1 mm MgCl2, 10 mm HEPES, and 1 mm d-glucose) for 1 h at room temperature and washed. Coverslips were mounted, and intracellular Ca2+ measurements were obtained using a Nikon TE2000 microscope.
Live cell imaging was performed using a Polychrome IV monochromator-based high speed digital imaging system (TILL Photonics, Gräfelfing, Germany) ported to a fiber optic guide and epifluorescence condenser and coupled to a Nikon TE2000 microscope. Cytosolic Ca2+ concentration dynamics in Fura-2 AM-loaded GLUTag cells was recorded by alternately illuminating cells with 340 and 380 nm wavelength light focused onto the image plane via a DM400 dichroic mirror and Nikon Super-Fluor X40 oil immersion objective, and fluorescence was obtained through a 525 ± 25-nm bandpass filter (Chroma Technologies, Brattleboro, VT). Acquired images were analyzed using TILLvisION (TILL Photonics) and ImageJ (W. S. Rasband, National Institutes of Health, Bethesda).
Western Blot Analysis
Tissues were lysed in 150 mm NaCl, 50 mm HEPES, pH 7.6, containing protease and phosphatase inhibitor, and the protein concentration was determined by BCA protein assay (Pierce) prior to analysis by 7% SDS-PAGE and immunoprobing with specific antibodies. These include polyclonal antibodies against mouse CEACAM1 (α-mCC1) (Ab-231) (9) and mouse CEACAM2 (α-mCC2) (above), in addition to monoclonal antibodies against tubulin (Sigma) and GAPDH (Santa Cruz Biotechnology, Inc., Dallas, TX) to normalize for the amount of proteins analyzed. Blots were incubated with horseradish peroxidase conjugated with anti-rabbit and anti-mouse IgG (Amersham Biosciences) antibodies, and proteins were detected by enhanced chemiluminescence (ECL; Amersham Biosciences).
Semi-quantitative Real Time PCR Analysis
RNA was extracted using the TRIzol method according to the manufacturer's protocol. Following DNase digestion (DNAfree, Ambion), 200 ng of RNA was transcribed into cDNA in a 20-μl reaction using a High Capacity cDNA archive kit (Applied Biosystems), analyzed, and amplified (ABI7900 HT system). PCR was performed in a 10-μl reaction, containing 5 μl of cDNA (1/5 diluted), 1× SYBR Green PCR Master Mix (Applied Biosystems) and 300 nm of each primer as follows: Ceacam2: F, 5′-CTACTGCTCACAGCCTCACTTTTAG-3′, and R, 5′-GCTAAAGGCCAAGACTCCCTTCAT-3′; Ceacam1: F, 5′-CTACTGCTCACAGCCTCACTTTTAG-3′, and R, 5′-AAAGGCTCCAAGCGCCAGGGG-3′; proglucagon: F, 5′-CAATGTTGTTCCGGTTCCTC-3′, and R, 5′-CCCTGATGAGATGAATGAAGA-CA-3′; 18S: F, 5′-TTCGAACGTCTGCCCTATCAA-3′, and R, 5′-ATGGTAGGCACGGCGACTA-3′; and β-actin: F, 5′-AGGGCTATGCTCTCCCTCAC-3′, and R, 5′-AAGGAAGGCTGGAAAAGAGC-3′. Ct values (cycle threshold) were used to calculate the amount of amplified PCR product relative to β-actin. The relative amount of mRNA was calculated as 2−ΔCt. Results were expressed in fold change as means ± S.E.
Statistical Analysis
Data were analyzed with SPSS software using one-way analysis of variance, two-way analysis of variance, or Student's t test, as appropriate. For live cell imaging, Graph Pad Prism 3 (Graph Pad Software Inc., La Jolla) software packages were used. Values were represented as mean ± S.E., and p < 0.05 values were statistically significant.
Results
Expression of CEACAM2 in Endocrine Pancreas
Semi-quantitative RT-PCR analysis revealed that Ceacam2 mRNA is expressed at a ratio of ∼2:1 in FACS-purified mouse pancreatic non-β-cells relative to β-cells (Fig. 1A, panel i), as opposed to the Ceacam1 transcript, which was predominantly expressed in β-cells (Fig. 1A, panel ii), consistent with its protein distribution (9).
FIGURE 1.
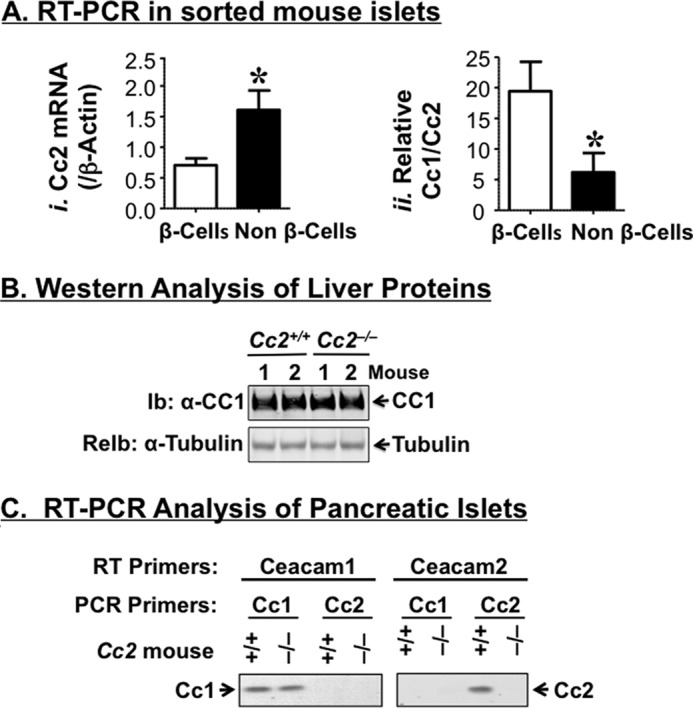
Characterization of CEACAM2 expression in the endocrine pancreas. A, Ceacam2 mRNA levels were determined in triplicate in FACS-purified β-cells and non β-cells by qRT-PCR (n = 5 mice), normalized to β-actin (panel i), and measured relative to Ceacam1 mRNA (panel ii). Values were expressed as means ± S.E. *, p < 0.05 versus β-cells. B, liver tissues were removed from 5-month-old mice (n >3/genotype) and lysates were analyzed by 7% SDS-PAGE with sequential immunoblotting (Ib) with polyclonal antibody against CEACAM1 followed by re-immunoblotting (ReIb) with α-tubulin antibody for protein normalization. C, RNA was extracted from pancreatic islets of these mice and reverse-transcribed using specific Ceacam1 and Ceacam2 primers, followed by PCR amplification and analysis by 1% agarose gel. Gels in B and C represent at least two independent experiments.
Effect of CEACAM2 on Insulin Secretion
Five-month-old male Cc2−/− mice exhibited a 2-fold higher plasma C-peptide level than their Cc2+/+ wild-type counterparts (Table 1). However, this did not translate into changes in plasma insulin levels, possibly because of the countervailing effect of increased insulin clearance, as measured by steady-state C-peptide/insulin molar ratio (Table 1), and consistent with maintenance of the protein level of hepatic CEACAM1 (Fig. 1B), a main promoter of insulin clearance in liver (8–10), and its insulin-stimulated phosphorylation in the insulin-sensitive male mouse (6). Changes in plasma C-peptide levels are not likely attributed to a regulatory action by CEACAM1 on insulin secretion from pancreatic β-cells because it does not play a significant role in insulin secretion, as it does in insulin clearance (9), and its cDNA level is preserved in pooled islets isolated from Cc2−/− mice, as RT-PCR amplification revealed (Fig. 1C).
TABLE 1.
Plasma biochemistry
Five-month-old male mice (n ≥13 for all parameters, except for n ≥4 for GLP-1) were fasted overnight before retro-orbital blood was drawn, and plasma levels of hormones were assayed. To determine basal glucagon level, mice were fasted for 4 h before their retro-orbital blood was drawn. Data are means ± S.E.
| Cc2+/+ | Cc2−/− | |
|---|---|---|
| Body weight (g) | 25.7 ± 0.34 | 26.0 ± 0.65 |
| Insulin (pm) | 57.3 ± 4.19 | 63.0 ± 5.77 |
| C-peptide (pm) | 349. ± 38.3 | 670. ± 91.5a |
| C/I ratio (steady state) | 5.98 ± 0.44 | 10.3 ± 0.96a |
| Glucagon (pg/ml) | 57.9 ± 1.20 | 60.0 ± 1.28 |
| Somatostatin (pg/ml) | 819. ± 9.86 | 823. ± 16.1 |
| GLP-1 (pm) | 1.46 ± 0.15 | 4.81 ± 1.23a |
a p < 0.05 versus Cc2+/+.
Immunohistochemical analysis with anti-insulin, anti-glucagon, and anti-somatostatin antibodies, respectively (Fig. 2A), revealed normal areas of β-, α-, and δ-cells in 6-month-old Cc2−/− mice. Immunostaining with a three antibody mixture (3Ab) to glucagon, somatostatin, and pancreatic polypeptide P (PP) also revealed no difference in the area of cells secreting these hormones between the two groups of mice. Consistently, basal plasma levels of somatostatin and glucagon were normal in Cc2−/− as compared with Cc2+/+ mice (Table 1). Furthermore, glucose (2.8–16.8 mm) and KCl (20 mm), a membrane-depolarizing agent, induced a comparable level of insulin release from pooled islets isolated from null or control mice (4-month-old) (Fig. 2B). Taken together, the data suggest that Ceacam2 deletion from the pancreas does not intrinsically affect β-cell area or insulin secretion.
FIGURE 2.
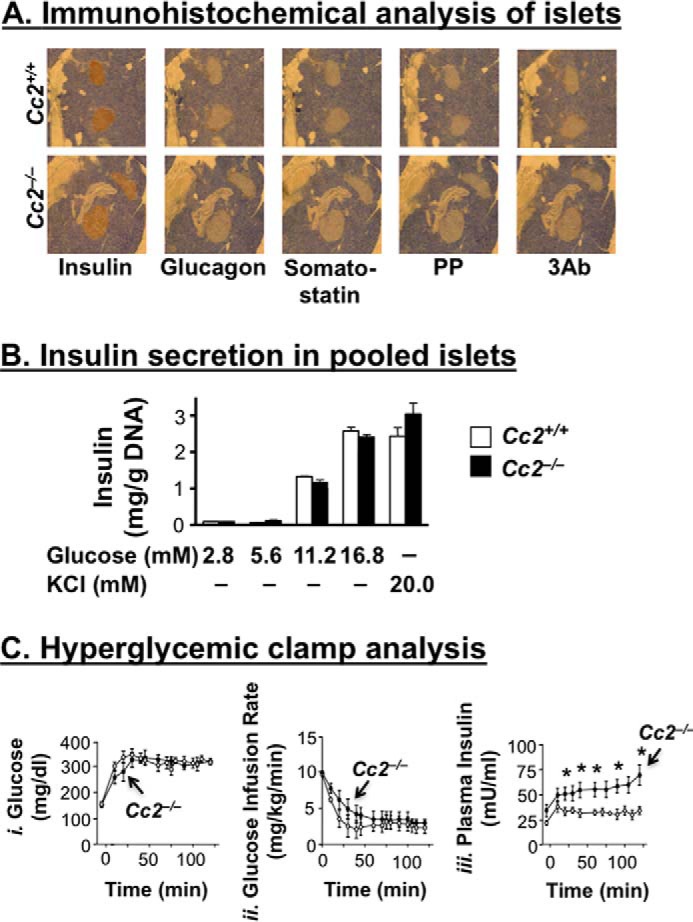
Effect of CEACAM2 on islet area, insulin secretion from isolated islets, and β-cell secretory function. A, pancreatic sections from 6-month-old mice (n = 4/genotype) were fixed and immunostained with antibodies against insulin, glucagon, somatostatin, polypeptide P (PP), and 3Ab (a mixture made up of the last three antibodies). Six sections/mouse were analyzed. Magnification ×40. B, islets were isolated from 4-month-old mice (n >3/genotype) by collagenase digestion followed by centrifugation over Histopaque gradient and culturing overnight in RPMI 1640 medium containing 5.5 nmol/liter glucose. Insulin secretion was assayed by incubating 10 islets in Krebs buffer containing different concentrations of glucose or 20 mmol/liter KCl for 1 h. The amount of insulin secreted was normalized to DNA content, and values were expressed as means ± S.E. C, awake mice (n = 7, 7-month-old Cc2+/+ (○) and Cc2−/− (●)) were continuously infused with glucose to maintain hyperglycemia (panel i), before glucose infusion rate (mg/kg/min) (panel ii), and plasma insulin (milliunits/ml) levels (panel iii) were determined. Values were expressed as means ± S.E. *, p < 0.05 versus Cc2+/+.
To further test insulin secretory function, we subjected 7-month-old mice (n = 7/genotype) to hyperglycemic clamp analysis. Maintaining a steady hyperglycemic state (at ∼320 mg/dl) in mutants and controls (Fig. 2C, panel i) required a comparable glucose infusion rate in both groups (Fig. 2C, panel ii). However, Cc2−/− mice displayed higher plasma insulin levels, suggesting preserved insulin secretory function (Fig. 2C, panel iii).
The increase in insulin levels in response to glucose does not appear to be compensatory to insulin resistance. Consistent with previous reports on 5-month-old mice (6), a 2-h hyperinsulinemic-euglycemic clamp analysis in overnight-fasted awake mice demonstrated that insulin sensitivity was maintained even at ∼7–8 months of age (Fig. 3). Basal glucose at the beginning of the clamp (Fig. 3A) and basal hepatic glucose production (Fig. 3B), a measure of rate of appearance at pre-clamp condition, were similar in both groups of mice (Fig. 3B, vertical and patterned hatchings). During the clamp, at similar glucose levels (Fig. 3A, white and black bars), the glucose infusion rate required to maintain euglycemia was comparable in both groups of mice (Fig. 3C), indicating preserved systemic insulin sensitivity in the mutants, as was the case for 5-month-old male mice (6). Ceacam2 null mutation did not affect the ability of insulin to suppress hepatic glucose production (Fig. 3B, white and black bars) and promote whole body glucose disposal (turnover) (Fig. 3D, black versus white bars), including glucose uptake in gastrocnemius muscle (Fig. 3E). Insulin suppresses hepatic glucose production by inhibiting gluconeogenesis and stimulating net hepatic glucose uptake followed by glycogen synthesis (25). Consistently, whole body glycolysis (Fig. 3F) and glycogen synthesis (Fig. 3G) were comparable in both groups of mice.
FIGURE 3.
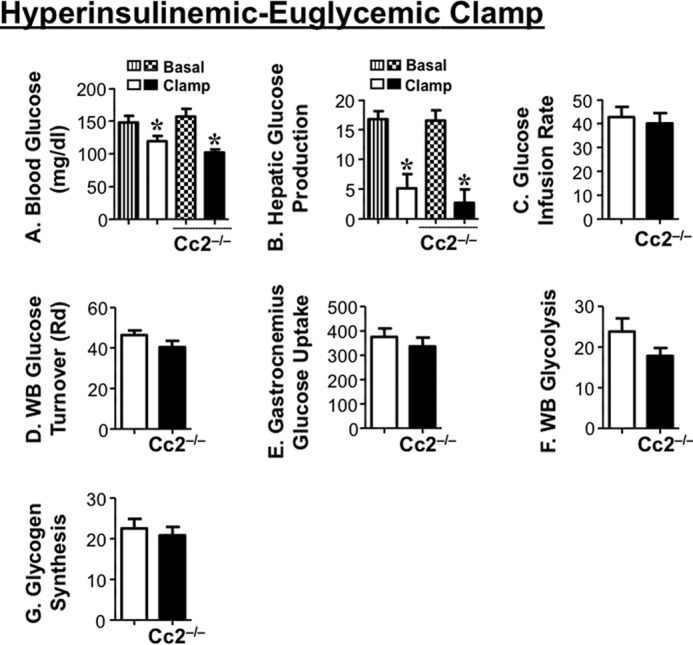
Insulin sensitivity in awake mice. Seven-to-eight month-old overnight fasted awake mice (n = 11/genotype) were subjected to hyperinsulinemic-euglycemic clamp analysis. A, whole blood glucose. B, hepatic glucose production at basal (vertical hatchings, Cc2+/+; patterned hatchings, Cc2−/−) and clamp (white, Cc2+/+; black, Cc2−/−) conditions. *, p < 0.05 versus basal. C, steady-state glucose infusion rate during clamp. D, whole body (WB) glucose turnover (Rd). E, glucose uptake in gastrocnemius muscle. F, whole body glycolysis. G, whole body glycogen synthesis (white, Cc2+/+; black, Cc2−/−). Values were all expressed as means ± S.E. in mg/kg·min−1 except for blood glucose levels (mg/dl).
CEACAM2 Regulates Release of Glucagon-like Peptide-1
Because the distal part of the small intestine harbors cells that produce GLP-1 (12, 26), we then reassessed CEACAM2 expression in this tissue and investigated whether its regulation of insulin secretion implicates GLP-1 production and/or release. Immunofluorescence analysis detected CEACAM2 in the villi lining the intestinal segment beginning with distal jejunum (Fig. 4, A–C, green). As reported previously (5), CEACAM2 was also detected in crypt cells (Fig. 4, A′–C′).
FIGURE 4.
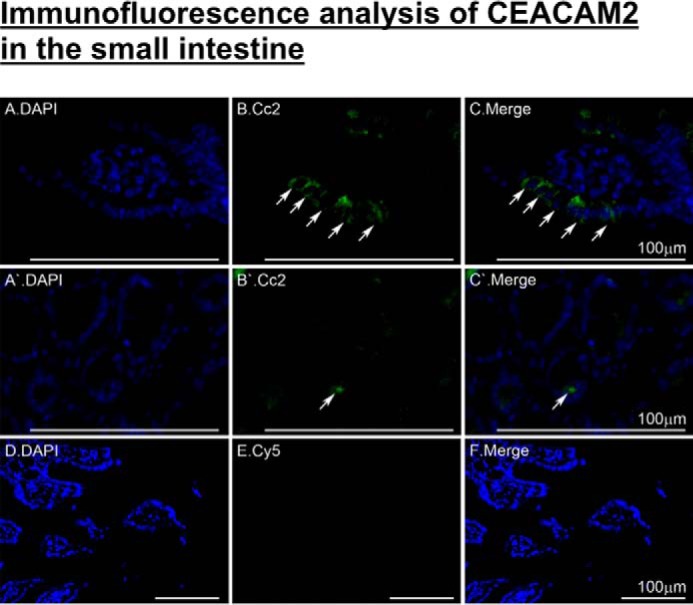
Immunofluorescence analysis of intestinal CEACAM2 expression. Small intestinal sections from 5-month-old mice were fixed in Bouin's solution and embedded in paraffin blocks prior to exposure to antigen retrieval and overnight incubation with α-CEACAM2 polyclonal antibody followed by Cy5 for visualization of CEACAM2 (green) in villi of distal jejunum/proximal ileum (A–C) and in crypts (A′–C′). DAPI was used to visualize nuclei (D–F). Analysis was performed using a Keyence BZ9000. Scale bar, 100 μm.
Relative to their wild-type counterparts, 5-month-old Cc2−/− mice released a significantly higher level of GLP-1 (Fig. 5A) as well as insulin during an oral glucose tolerance test (Fig. 5B, panel i). Although their basal blood glucose level was normal, they manifested more tolerance to exogenous oral glucose (Fig. 5B, panel ii), consistent with their insulin sensitivity.
FIGURE 5.
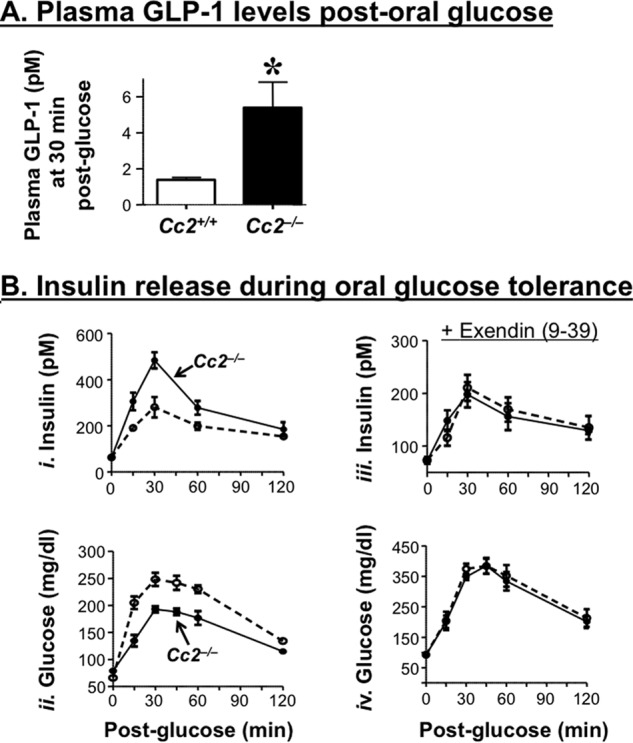
Effect of CEACAM2 on GLP-1 and insulin release during an oral glucose tolerance test. A, plasma GLP-1 levels were measured from overnight fasted mice (n ≥6/genotype) following an oral administration of glucose. Values were expressed as means ± S.E. *, p < 0.05 versus Cc2+/+. B, plasma insulin concentrations (panel i) and blood glucose levels (panel ii) at the 0–120-min time period were determined in overnight fasted male 5-month-old Cc2+/+ (○) and Cc2−/− mice (●) mice after oral administration of glucose. Plasma insulin (panel iii) and blood glucose (panel iv) were also assessed in the presence of exendin(9–39), a GLP-1 receptor antagonist. n >5 mice/genotype. Values were expressed as means ± S.E. *, p < 0.05 versus Cc2+/+.
Pretreating with exendin(9–39), a GLP-1 receptor antagonist, suppressed the effect of Ceacam2 deletion on insulin (Fig. 5B, panel iii) as well as glucose excursion (Fig. 5C, panel iv) in response to oral glucose. Together, this suggests that Ceacam2 deletion regulates insulin secretion, at least partly, via a GLP-1-mediated mechanism.
To further examine the effect of CEACAM2 on GLP-1 production and/or secretion, we then reduced its expression in murine GLUTag enteroendocrine cells by means of siRNA transfection. As Fig. 6 shows, reduction of Ceacam2 mRNA (Fig. 6A) and protein (Fig. 6B) levels by ∼50% significantly induced GLP-1 release into the media of siRNA relative to scrambled-transfected cells (Scr),3 both basally and in response to 11 mm glucose (Fig. 6C). In contrast, reducing CEACAM2 content did not affect mRNA levels of cellular proglucagon (Fig. 6D). Together, the data point to modulation of GLP-1 secretion from intestinal cells independent of other potential confounding metabolic factors.
FIGURE 6.
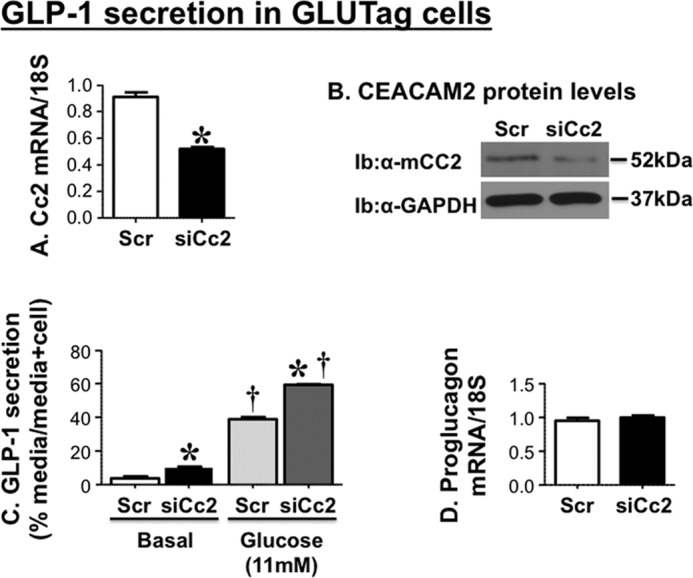
Effect of CEACAM2 on GLP-1 secretion in GLUTag cells. GLUTag cells were transfected with scrambled (Scr-Cc2) or Ceacam2-specific siRNA (siRNA-Cc2). A, Ceacam2 mRNA; B, protein levels were then evaluated by qRT-PCR and Western blot analysis, respectively. Ib, immunoblot. C, GLP-1 secretion was assessed as percentage GLP-1 level in media relative to the sum of GLP-1 in media plus cell lysates. D, proglucagon mRNA levels were assessed by qRT-PCR. Values were expressed as means ± S.E. *, p < 0.05 versus scrambled/treatment group; †, p < 0.05 versus basal/transfection group.
CEACAM2 Regulates GLP-1 Secretion through L-type Voltage-gated Ca2+ Channels
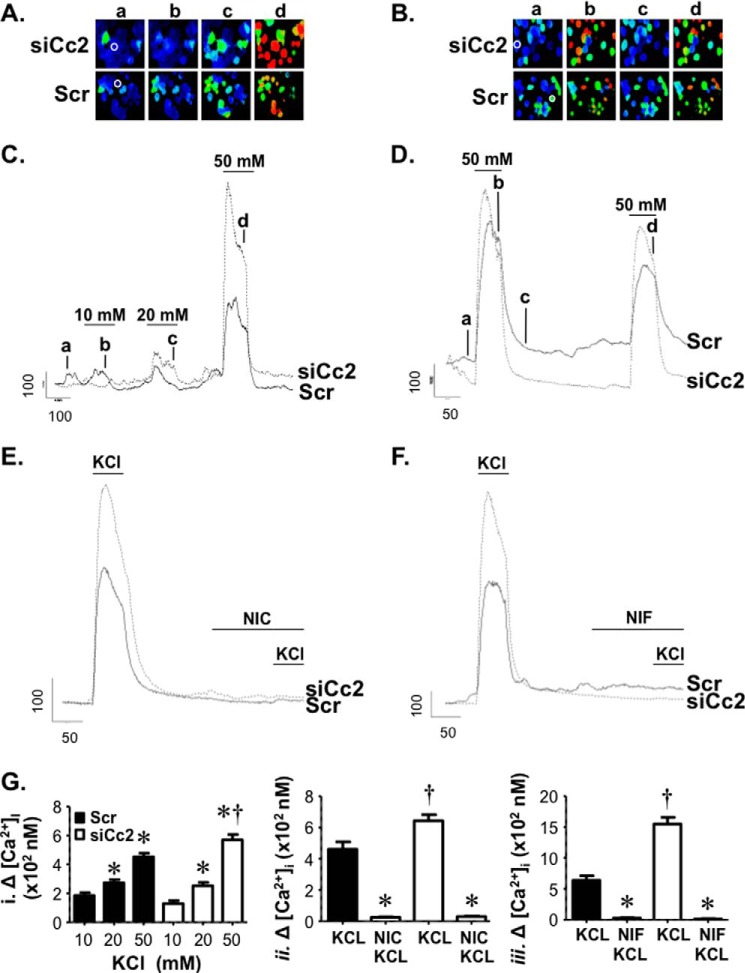
Because L-type voltage-dependent Ca2+ channels are implicated in GLP-1 release from GLUTag cells (27, 28), we investigated whether CEACAM2 regulates GLP-1 release through voltage-dependent Ca2+ channel (VDCC)-mediated changes in intracellular calcium. To this end, we transfected GLUTag cells with scrambled (Scr) and Ceacam2-specific siRNA oligos (siCc2) before loading them with Fura-2, a calcium indicator, and monitored 340/380 nm fluorescence in response to membrane depolarization evoked by application of physiological saline containing elevated KCl concentrations (10–50 mm). As shown in Fig. 7, applications of elevated KCl induced concentration-dependent cytosolic Ca2+ rises. Whereas KCl at 10 and 20 mm yielded comparable calcium influx in both control and knocked down cells, 50 mm KCl induced a more pronounced calcium rise in siCc2 than Scr cells, as shown in the ratio images and corresponding line traces (Fig. 7, A and C). In addition, repeated depolarization with 50 mm KCl revealed only a slight reduction in a second cytosolic Ca2+ rise suggesting that the VDCC-underlying Ca2+ entry was not robustly inactivated by our stimulus paradigm, as indicated by the ratio images and respective line traces (Fig. 7, B and D). Moreover, the amount of inactivation of entry was similar between control and knocked down groups.
FIGURE 7.
CEACAM2 regulates GLP-1 secretion through L-type voltage-dependent Ca2+ channels. A and B, GLUTag cells were loaded with Fura-2 AM, and images were obtained. The ratio images illustrate [Ca2+]i rises in individual cells in a field of view following membrane depolarization evoked by applying elevated concentrations of KCl (10, 20, and 50 mm) (A) and two sequential stimulations with 50 mm KCl (B) in both scrambled (Scr) and si-RNA Ceacam2 transfected (siCc2) cells. C–F, representative line traces from cells in A and B (indicated by white circles) depict [Ca2+]i responses in GLUTag cells evoked by KCl (10, 20, and 50 mm) or sequential applications of 50 mm KCl. To assess VDCC contribution to the depolarization-evoked rises in cytosolic Ca2+, 50 mm KCl was applied prior to and following treatment with 10 μm of the L-type calcium channel blockers, nicardipine (NIC) and nifedipine (NIF), as indicated. Scale bars indicate fluorescence ratio units (r.u.) and time in seconds. G, bar graphs of the averaged changes in [Ca2+]i in GLUTag cells stimulated by physiological saline containing the indicated concentrations of KCl (10, 20, and 50 mm) (panel i) or following treatment with nicardipine (panel ii) and nifedipine (panel iii). *, p < 0.05 versus 10–20 mm KCl/transfection group (i) and KCl/transfection group (ii), †, p < 0.05 versus scrambled group.
To further identify the calcium channel that mediated depolarization-evoked intracellular Ca2+ rises, the L-type VDCC blockers, nicardipine and nifedipine at 10 μm each, were used to selectively inhibit Ca2+ entry in response to 50 mm KCl application. As Fig. 7, E and F, reveals, elevated KCl failed to induce a rise in cytosolic Ca2+ levels in the presence of nicardipine and nifedipine, respectively. This suggests that enhanced Ca2+ entry in siCc2 cells was mediated by L-type VDCC and that CEACAM2 may regulate GLP-1 secretion by modulating L-type channel expression or activity. Cumulative averaged data for these experiments are shown in Fig. 7G.
Glucose Regulates Ceacam2 Expression
We have previously reported that refeeding following an overnight fast markedly represses Ceacam2 mRNA levels (1). Thus, we investigated whether glucose and/or insulin modulate(s) Ceacam2 expression. To this end, we treated GLUTag cells with 3, 5.5, or 20 mm glucose for 15 or 60 min. As Fig. 8A, panel i, reveals, glucose (5.5 mm) decreased Ceacam2 mRNA levels by ∼50% compared with 3 mm within 15 min of treatment. Increasing glucose concentration and prolonging the treatment period did not further change Ceacam2 mRNA expression. Consistently, Western blot analysis reveals no effect of glucose (3–20 mm) on CEACAM2 protein level after 15 min of treatment. However, treatment with 20 mm, but not 3 mm, glucose for ≥60 min reduced CEACAM1 protein level by ∼50% (Fig. 8A, panel ii). In contrast to glucose, insulin (100 nm) treatment for 15 or 60 min failed to modulate Ceacam2 mRNA levels in these cells (Fig. 8B).
FIGURE 8.
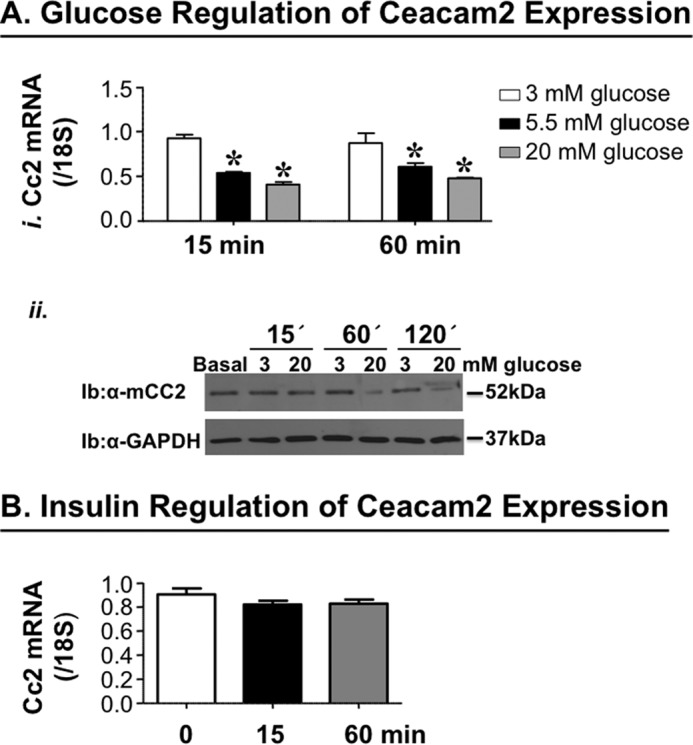
Effect of glucose and insulin on Ceacam2 expression. A, Ceacam2 mRNA level was measured in GLUTag cells in response to glucose (3–20 mm) for 15 and 60 min (panel i). Values were expressed as mean ± S.E. *, p < 0.05 versus 3 mm glucose. Panel ii, CEACAM2 protein levels were evaluated in GLUTag cells in response to glucose (3 and 20 mm) for 15, 60, and 120 min. Ib, immunoblot. B, as in A, except for stimulation with insulin (100 nm). Values were expressed as means±S.E.
Discussion
CEACAM1 and CEACAM2 are highly homologous proteins with differential tissue and cellular distribution (4, 29) that predict distinct functions. CEACAM1 enhances insulin action by promoting insulin clearance in liver without affecting insulin secretion despite its significant expression in pancreatic β-cells (9). Emerging evidence shows that CEACAM2 regulates insulin action by reducing food intake and modulating energy expenditure (6). Using global Cc2−/− null mice, the current studies unravel a novel role for CEACAM2 in inhibiting insulin secretion, at least partly by a GLP-1-dependent mechanism.
Despite predominant CEACAM2 expression in non-β pancreatic islets, its deletion did not affect either the islet areas or basal plasma glucagon and somatostatin levels. Together with preserved β-cell secretory function and normal insulin release in response to both glucose and KCl in isolated pooled islets, this points to an extra-pancreatic regulatory mechanism on insulin secretion brought about by Ceacam2 deletion.
Enhanced insulin excursion in response to oral glucose was accompanied by a higher induction of GLP-1 release in Cc2−/− mice. Suppression of the differential effect of oral glucose on insulin secretion and glucose tolerance by the GLP-1 receptor antagonist provides further evidence that CEACAM2 can regulate insulin secretion through a GLP-1-dependent pathway. Because GLP-1 potentiates glucose-dependent insulin secretion from β-cells (11), it is likely that Ceacam2 deletion caused an increase in glucose-stimulated insulin secretion, at least partly, by inducing GLP-1 release. This is supported by elevated GLP-1 content in the media of GLUTag enteroendocrine cells following siRNA-mediated knockdown of Ceacam2. The mechanistic underpinning of the regulation of GLP-1 secretion by CEACAM2 awaits further investigation, but the positive effect of Ceacam2 deletion on Ca2+ entry via L-type VDCC suggests that CEACAM2 regulates GLP-1 secretion in part by reducing cellular Ca2+ entry, consistent with the role of this process in mediating GLP-1 release from GLUTag cells (27, 28). Moreover, induction of GLP-1 release from GLUTag cells by Ceacam2 down-regulation suggests that elevated plasma GLP-1 levels in Cc2−/− mice are independent of other potential confounding metabolic changes stemming from Ceacam2 deletion.
Of note, higher plasma insulin levels in Cc2−/− than in wild-type mice during hyperglycemic clamp analysis point to the possibility that CEACAM2 can also affect insulin secretion independently of GLP-1. In light of CEACAM2 expression in the ventromedial hypothalamus (1), the glucose-sensing center in the brain (30), it is possible that hypothalamic CEACAM2 regulates insulin secretion centrally (31, 32) and independently of GLP-1 release (33). Disturbance in this neuronally mediated mechanism may contribute to the higher excursion of insulin during hyperglycemic clamp analysis in Cc2−/− mice.
We have shown that fasting induces and refeeding represses Ceacam2 mRNA levels (1). Based on these studies, it is reasonable to postulate that reduction of Ceacam2 expression during refeeding could result from the rise in glucose. This, in turn, could elevate GLP-1 and subsequently insulin secretion. To avoid hyperinsulinemia, secreted insulin would induce CEACAM1 phosphorylation to promote receptor-mediated insulin uptake (34) and hepatic insulin clearance (9, 10) to maintain normal insulin metabolism and action on glucose homeostasis. Given that GLP-1 prompts transition into the fasting state (35), this may also constitute a negative feedback mechanism to ultimately recover CEACAM2 levels and limit insulin secretion. Of note, CEACAM2 is expressed in the kidney but not liver (4, 29). Whether it plays a role in renal insulin clearance is not known but, given that insulin clearance occurs mostly in the liver where CEACAM1 expression dominates, insulin clearance is not expected to be directly affected by Ceacam2 deletion, and elevation in insulin clearance in Cc2−/− mice would be mediated by CEACAM1 phosphorylation in response to insulin in liver (8–10) as well as kidney (36).
In conclusion, the data provide evidence for a novel role for CEACAM2 in the regulation of insulin secretion, at least partly, via GLP-1 release. Further studies are required to elucidate the underlying mechanisms, but the current data highlight a relevant role for CEACAM2 in GLP-1 release.
Author Contributions
S. S. G. researched data, designed and coordinated experiments, and wrote the manuscript. G. H. researched and analyzed data and reviewed the manuscript. S. G. L., V. P., S. B., P. R. P., A. M. D., T. D., S. K. R., Z. N. S., Y. L., D. Y. J., and T. K. researched data. S. E. oversaw the immunofluorescence analysis of intestinal cells. R. N. K. oversaw, discussed the localization of CEACAM2 to islets, and revised the manuscript. J. K. K. oversaw and discussed clamp analysis data. D. R. G. oversaw and discussed data of live cell fluorescence and intracellular Ca2+ measurements and revised the manuscript. S. M. N. was responsible for study design, conceptualization, data analysis, results interpretation, and reviewing the manuscript. S. M. N. has full access to all the data of the study and takes responsibility for the integrity and accuracy of data analysis and the decision to submit and publish the manuscript.
Acknowledgments
We thank Jiang Hu at the Kulkarni laboratory for excellent work in the characterization of Ceacam2 expression in pancreatic islets. We also thank Dr. O. Chepurny at the laboratory of Dr. G. Holz, State University of New York Upstate Medical University, Syracuse, NY, for providing and advising on the propagation of the GLUTag enteroendocrine cell line with permission from Dr. D. Drucker, University of Toronto, Ontario, Canada.
This work was supported in part by National Institutes of Health Grants R01 DK054254, R01 DK083850, and R01 HL112248 (to S. M. N.), Grants R01 DK67536 and R01 DK103215 (to R. N. K.), Grant R21 DE023418 (to D. R. G.), and Grant U24-DK093000 (to the National Mouse Metabolic Phenotyping Center at University of Massachusetts), United States Department of Agriculture Grant USDA 38903-19826 (to S. M. N.), and Deutsche Forschungsgemeinschaft Grants ER 276/9-1 TI 690/3-1 and SFB 688/3 A19 (to S. E.). The authors declare that they have no conflicts of interest with the contents of this article. The content is solely the responsibility of the authors and does not necessarily represent the official views of the National Institutes of Health.
- Scr
- scrambled
- VDCC
- voltage-dependent Ca2+ channel
- F
- forward
- R
- reverse
- oligo
- oligonucleotide
- qRT
- quantitative RT
- BWT
- body weight.
References
- 1.Heinrich G., Ghosh S., Deangelis A. M., Schroeder-Gloeckler J. M., Patel P. R., Castaneda T. R., Jeffers S., Lee A. D., Jung D. Y., Zhang Z., Opland D. M., Myers M. G. Jr., Kim J. K., and Najjar S. M. (2010) Carcinoembryonic antigen-related cell adhesion molecule 2 controls energy balance and peripheral insulin action in mice. Gastroenterology 139, 644–652 [DOI] [PMC free article] [PubMed] [Google Scholar]
- 2.Salaheldeen E., Kurio H., Howida A., and Iida H. (2012) Molecular cloning and localization of a CEACAM2 isoform, CEACAM2-L, expressed in spermatids in mouse testis. Mol. Reprod. Dev. 79, 843–852 [DOI] [PubMed] [Google Scholar]
- 3.Alshahrani M. M., Yang E., Yip J., Ghanem S. S., Abdallah S. L., deAngelis A. M., O'Malley C. J., Moheimani F., Najjar S. M., and Jackson D. E. (2014) CEACAM2 negatively regulates hemi (ITAM-bearing) GPVI and CLEC-2 pathways and thrombus growth in vitro and in vivo. Blood 124, 2431–2441 [DOI] [PMC free article] [PubMed] [Google Scholar]
- 4.Han E., Phan D., Lo P., Poy M. N., Behringer R., Najjar S. M., and Lin S. H. (2001) Differences in tissue-specific and embryonic expression of mouse Ceacam1 and Ceacam2 genes. Biochem. J. 355, 417–423 [DOI] [PMC free article] [PubMed] [Google Scholar]
- 5.Robitaille J., Izzi L., Daniels E., Zelus B., Holmes K. V., and Beauchemin N. (1999) Comparison of expression patterns and cell adhesion properties of the mouse biliary glycoproteins Bbgp1 and Bbgp2. Eur. J. Biochem. 264, 534–544 [DOI] [PubMed] [Google Scholar]
- 6.Patel P. R., Ramakrishnan S. K., Kaw M. K., Raphael C. K., Ghosh S., Marino J. S., Heinrich G., Lee S. J., Bourey R. E., Hill J. W., Jung D. Y., Morgan D. A., Kim J. K., Rahmouni K., Rahmouni S. K., and Najjar S. M. (2012) Increased metabolic rate and insulin sensitivity in male mice lacking the carcino-embryonic antigen-related cell adhesion molecule 2. Diabetologia 55, 763–772 [DOI] [PMC free article] [PubMed] [Google Scholar]
- 7.Najjar S. M., Accili D., Philippe N., Jernberg J., Margolis R., and Taylor S. I. (1993) pp120/ecto-ATPase, an endogenous substrate of the insulin receptor tyrosine kinase, is expressed as two variably spliced isoforms. J. Biol. Chem. 268, 1201–1206 [PubMed] [Google Scholar]
- 8.Xu E., Dubois M. J., Leung N., Charbonneau A., Turbide C., Avramoglu R. K., DeMarte L., Elchebly M., Streichert T., Lévy E., Beauchemin N., and Marette A. (2009) Targeted disruption of carcinoembryonic antigen-related cell adhesion molecule 1 promotes diet-induced hepatic steatosis and insulin resistance. Endocrinology 150, 3503–3512 [DOI] [PubMed] [Google Scholar]
- 9.DeAngelis A. M., Heinrich G., Dai T., Bowman T. A., Patel P. R., Lee S. J., Hong E. G., Jung D. Y., Assmann A., Kulkarni R. N., Kim J. K., and Najjar S. M. (2008) Carcinoembryonic antigen-related cell adhesion molecule 1: a link between insulin and lipid metabolism. Diabetes 57, 2296–2303 [DOI] [PMC free article] [PubMed] [Google Scholar]
- 10.Poy M. N., Yang Y., Rezaei K., Fernström M. A., Lee A. D., Kido Y., Erickson S. K., and Najjar S. M. (2002) CEACAM1 regulates insulin clearance in liver. Nat. Genet. 30, 270–276 [DOI] [PubMed] [Google Scholar]
- 11.D'Alessio D. A., Kahn S. E., Leusner C. R., and Ensinck J. W. (1994) Glucagon-like peptide 1 enhances glucose tolerance both by stimulation of insulin release and by increasing insulin-independent glucose disposal. J. Clin. Invest. 93, 2263–2266 [DOI] [PMC free article] [PubMed] [Google Scholar]
- 12.Shalev A. (1997) The role of glucagon-like peptide 1 in the regulation of glucose homeostasis and satiety. Eur. J. Endocrinol. 137, 220–221 [DOI] [PubMed] [Google Scholar]
- 13.Reimann F., and Gribble F. M. (2002) Glucose-sensing in glucagon-like peptide-1-secreting cells. Diabetes 51, 2757–2763 [DOI] [PubMed] [Google Scholar]
- 14.Kedees M. H., Guz Y., Grigoryan M., and Teitelman G. (2013) Functional activity of murine intestinal mucosal cells is regulated by the glucagon-like peptide-1 receptor. Peptides 48, 36–44 [DOI] [PubMed] [Google Scholar]
- 15.Habib A. M., Richards P., Rogers G. J., Reimann F., and Gribble F. M. (2013) Co-localisation and secretion of glucagon-like peptide 1 and peptide YY from primary cultured human L cells. Diabetologia 56, 1413–1416 [DOI] [PMC free article] [PubMed] [Google Scholar]
- 16.Seino Y., and Yabe D. (2013) Glucose-dependent insulinotropic polypeptide and glucagon-like peptide-1: incretin actions beyond the pancreas. J. Diabetes Investig. 4, 108–130 [DOI] [PMC free article] [PubMed] [Google Scholar]
- 17.Drucker D. J. (2015) Deciphering metabolic messages from the gut drives therapeutic innovation: the 2014 Banting Lecture. Diabetes 64, 317–326 [DOI] [PubMed] [Google Scholar]
- 18.Cho Y. R., Kim H. J., Park S. Y., Ko H. J., Hong E. G., Higashimori T., Zhang Z., Jung D. Y., Ola M. S., Lanoue K. F., Leiter E. H., and Kim J. K. (2007) Hyperglycemia, maturity-onset obesity, and insulin resistance in NONcNZO10/LtJ males, a new mouse model of type 2 diabetes. Am. J. Physiol. Endocrinol. Metab. 293, E327–E336 [DOI] [PubMed] [Google Scholar]
- 19.Kitamura T., Kitamura Y. I., Kobayashi M., Kikuchi O., Sasaki T., Depinho R. A., and Accili D. (2009) Regulation of pancreatic juxtaductal endocrine cell formation by FoxO1. Mol. Cell. Biol. 29, 4417–4430 [DOI] [PMC free article] [PubMed] [Google Scholar]
- 20.Kulkarni R. N., Brüning J. C., Winnay J. N., Postic C., Magnuson M. A., and Kahn C. R. (1999) Tissue-specific knockout of the insulin receptor in pancreatic beta cells creates an insulin secretory defect similar to that in type 2 diabetes. Cell 96, 329–339 [DOI] [PubMed] [Google Scholar]
- 21.Josefsen K., Stenvang J. P., Kindmark H., Berggren P. O., Horn T., Kjaer T., and Buschard K. (1996) Fluorescence-activated cell sorted rat islet cells and studies of the insulin secretory process. J. Endocrinol. 149, 145–154 [DOI] [PubMed] [Google Scholar]
- 22.Kitamura T., Kido Y., Nef S., Merenmies J., Parada L. F., and Accili D. (2001) Preserved pancreatic beta cell function in mice lacking the insulin receptor-related receptor. Mol. Cell. Biol. 21, 5624–5630 [DOI] [PMC free article] [PubMed] [Google Scholar]
- 23.Parker H. E., Wallis K., le Roux C. W., Wong K. Y., Reimann F., and Gribble F. M. (2012) Molecular mechanisms underlying bile acid-stimulated glucagon-like peptide-1 secretion. Br. J. Pharmacol. 165, 414–423 [DOI] [PMC free article] [PubMed] [Google Scholar]
- 24.Iakoubov R., Izzo A., Yeung A., Whiteside C. I., and Brubaker P. L. (2007) Protein kinase Cζ is required for oleic acid-induced secretion of glucagon-like peptide-1 by intestinal endocrine L cells. Endocrinology 148, 1089–1098 [DOI] [PubMed] [Google Scholar]
- 25.DeFronzo R. A. (1988) Lilly lecture 1987. The triumvirate: beta-cell, muscle, liver. A collusion responsible for NIDDM. Diabetes 37, 667–687 [DOI] [PubMed] [Google Scholar]
- 26.Campbell J. E., and Drucker D. J. (2013) Pharmacology, physiology, and mechanisms of incretin hormone action. Cell Metab. 17, 819–837 [DOI] [PubMed] [Google Scholar]
- 27.Sidhu S. S., Thompson D. G., Warhurst G., Case R. M., and Benson R. S. (2000) Fatty acid-induced cholecystokinin secretion and changes in intracellular Ca2+ in two enteroendocrine cell lines, STC-1 and GLUTag. J. Physiol. 528, 165–176 [DOI] [PMC free article] [PubMed] [Google Scholar]
- 28.Reimann F., Maziarz M., Flock G., Habib A. M., Drucker D. J., and Gribble F. M. (2005) Characterization and functional role of voltage gated cation conductances in the glucagon-like peptide-1 secreting GLUTag cell line. J. Physiol. 563, 161–175 [DOI] [PMC free article] [PubMed] [Google Scholar]
- 29.Zebhauser R., Kammerer R., Eisenried A., McLellan A., Moore T., and Zimmermann W. (2005) Identification of a novel group of evolutionarily conserved members within the rapidly diverging murine Cea family. Genomics 86, 566–580 [DOI] [PubMed] [Google Scholar]
- 30.Levin B. E., Routh V. H., Kang L., Sanders N. M., and Dunn-Meynell A. A. (2004) Neuronal glucosensing: what do we know after 50 years? Diabetes 53, 2521–2528 [DOI] [PubMed] [Google Scholar]
- 31.Thorens B. (2010) Central control of glucose homeostasis: the brain–endocrine pancreas axis. Diabetes Metab. 36, S45–S49 [DOI] [PubMed] [Google Scholar]
- 32.Osundiji M. A., Lam D. D., Shaw J., Yueh C. Y., Markkula S. P., Hurst P., Colliva C., Roda A., Heisler L. K., and Evans M. L. (2012) Brain glucose sensors play a significant role in the regulation of pancreatic glucose-stimulated insulin secretion. Diabetes 61, 321–328 [DOI] [PMC free article] [PubMed] [Google Scholar]
- 33.Chan O., and Sherwin R. (2013) Influence of VMH fuel sensing on hypoglycemic responses. Trends Endocrinol. Metab. 24, 616–624 [DOI] [PMC free article] [PubMed] [Google Scholar]
- 34.Formisano P., Najjar S. M., Gross C. N., Philippe N., Oriente F., Kern-Buell C. L., Accili D., and Gorden P. (1995) Receptor-mediated internalization of insulin. Potential role of pp120/HA4, a substrate of the insulin receptor kinase. J. Biol. Chem. 270, 24073–24077 [DOI] [PubMed] [Google Scholar]
- 35.Barrera J. G., Sandoval D. A., D'Alessio D. A., and Seeley R. J. (2011) GLP-1 and energy balance: an integrated model of short-term and long-term control. Nat. Rev. Endocrinol. 7, 507–516 [DOI] [PMC free article] [PubMed] [Google Scholar]
- 36.Al-Share Q. Y., DeAngelis A. M., Lester S. G., Bowman T. A., Ramakrishnan S. K., Abdallah S. L., Russo L., Patel P. R., Kaw M. K., Raphael C. K., Kim A. J., Heinrich G., Lee A. D., Kim J. K., Kulkarni R. N., Philbrick W. M., and Najjar S. M. (2015) Forced hepatic overexpression of CEACAM1 curtails diet-induced insulin resistance. Diabetes 64, 2780–2790 [DOI] [PMC free article] [PubMed] [Google Scholar]


